Great Lakes Dairy Sheep Symposium - the Department of Animal ...
Great Lakes Dairy Sheep Symposium - the Department of Animal ... Great Lakes Dairy Sheep Symposium - the Department of Animal ...
In the systemic mechanism, stress activates the HPA axis: the response to different stress factors provokes firstly the release of the hypothalamic factor vasopressin and corticotropin releasing hormones, which stimulate the secretion of Adrenocorticotropic hormone (ACTH) by the pituitary gland. The ACTH stimulates the synthesis and release of glucocorticoids (cortisol and corticosterone) from the adrenal cortex. The main function of cortisol, which is secreted within a few minutes after exposure to stress, is to mobilize energy reserves to promote hyperglycemia and reduce cellular glucose uptake (Borski, 2000). In dairy animals, cortisol shows itself in a decrease of milk synthesis, by blocking the uptake of glucose by the mammary gland (Davis and Collier, 1985). Simulation of stress using ACTH treatment in dairy cows resulted in the cortisol concentrations being substantially higher and a reduction of mammary tight junction leakiness (Stelwagen et al., 1998), which showed itself in involution of the mammary gland (see paragraph 2). A secondary effect of stress is the inhibition of prolactin synthesis by the pituitary gland, due to the hypothalamic release of dopamine. Both cases lead the lactating ewe to a transient metabolic energy unbalance, due to the reduction in the energy output by the milk and an increase in mobilization of stored energy. This is caused by a sharp increase in glucocorticoids, followed by an increase in insulin and adipose tissue uptake capacity. If the stress level remains, it may have a negative effect on lactation persistency, especially in the second half of lactation, due to the leptin hormone secreted by adipose tissue inhibiting the IGF-I action on mammary parenchyma (Silva et al., 2002). In fact, Cannas et al. (unpublished data) found a negative relationship between leptin concentration in the blood and milk yield in ewes with different DM intake levels (Table 8). Table 8 - Relationship between leptin, milk yield and DM intake in Sardinian breed ewes (Cannas et al., unpublished data). Leptin class Leptin Milk yield Fat FCM a DM Intake ng/ml ng/ml kg % kg 2.30 2.70 1.434 7.28 1.531 2.22 P 0.000 0.039 0.490 0.034 0.088 a FCM = Fat corrected milk Udder health status Although clinical cases of mastitis are a source of milk loss, subclinical mastitis is more important economically because it occurs more frequently (Ruiu and Pulina, 1992). It is associated with a decrease in milk production, milk quality and coagulation properties (Nudda et al., 2001). The coagulase negative staphylococci (CNS) are the most prevalent pathogens in the mammary gland of sheep (Gonzalo et al., 2002; McDougall et al., 2002). Bacterial infection of the mammary gland is associated with a higher somatic cell count (SSC) in milk (Figure 10) (Pulina et al., unpublished data). 56
probability (%) 70 60 50 40 30 20 10 0 Figure 10 – Relationship between the probability of isolating microorganisms and somatic cell count (SCC) in half udders of dairy sheep (Pulina et al., unpublished data). Losses of milk yield through intramammary infection (IMI) in sheep varies with the type of pathogen. High SCC, corresponding to major pathogens, causes larger milk yield losses (Table 9) (Gonzalo et al., 2002). Table 9 - Least square means of somatic cell count (SCC) and milk yield losses (1322 Churra ewes; 9592 milk samples) (Gonzalo et al., 2002). SCC Infection status (x10 3 Milk losses /ml) (%) Uninfected 82 - Infection by minor pathogens 120 2.6 Unilateral inf. by NSCNS a 597 5.1 Unilateral infection by major pathogens 1317 8.8 Bilateral infection by NSCNS 1547 3.6 Bilateral infection by major pathogens 2351 10.1 a NSCNS = Novobiocin sensitive coagulase-negative staphylococci Sarda breed ewes with mammary glands, which were positive on bacteriological analysis, suffered a reduction in milk yield of about 24% in overall lactation when compared to negative animals (Figure 11). The pattern showed that intramammary infections (IMI) before the peak caused a reduction in peak yield, and the milk yield loss is maintained during lactation with a consequent lower persistency (Pulina et al., 1993). 57 y = 16.11 Ln(x) - 77.22 R2 = 0.94 0 1000 2000 3000 4000 5000 6000 SCC (x10^3/ml)
- Page 15 and 16: efficient or just selling milk (or
- Page 17 and 18: production doubles. However, there
- Page 19 and 20: Total production (pounds) Percentag
- Page 21 and 22: Milk production (pounds) Average mi
- Page 23 and 24: Percentage of ewes in each system 1
- Page 25 and 26: 5. Ice Cream and Butter: • raw mi
- Page 27 and 28: 3. Fresh Cheeses made from pasteuri
- Page 29 and 30: The Vermont Cheese Council (www.vtc
- Page 31 and 32: 1 x Brine Tank (10’ long x 3 ft.
- Page 33 and 34: LAMB REARING STRATEGIES: FARMER PAN
- Page 35 and 36: BONNIEVIEW FARM’S LAMB REARING ST
- Page 37 and 38: REARING LAMBS AT 3-CORNER FIELD FAR
- Page 39 and 40: PROFITABILITY OF SMALL RUMINANT FAR
- Page 41 and 42: Table I. General Farm Description L
- Page 43 and 44: Table 4. Business Balance Sheet Ass
- Page 45 and 46: Table 5. Income Statement Income Av
- Page 47 and 48: Lifestyle is a definite reason for
- Page 49 and 50: Grossman et al., 1999). Animals wit
- Page 51 and 52: Physiological Factors Affecting Lac
- Page 53 and 54: Recently, it has been hypothesized
- Page 55 and 56: (co)variate in the genetic model us
- Page 57 and 58: show that milk production increases
- Page 59 and 60: Figure 6 - Lactation curves of ewes
- Page 61 and 62: milk yield (g/d) 3000 2500 2000 150
- Page 63 and 64: a genetic potential to produce more
- Page 65: when compared with the control grou
- Page 69 and 70: considered “healthy” if every S
- Page 71 and 72: Finally, udder health has to be con
- Page 73 and 74: De Maria Ghionna C., Dell’Aquila.
- Page 75 and 76: Manalu, W., Sumaryadi, M.Y., Sudjat
- Page 77 and 78: Rupp R., Boichard D., Barbat A., As
- Page 79 and 80: Introduction MILK FAT SYNTHESIS AND
- Page 81 and 82: The variety of fatty acids allows t
- Page 83 and 84: Germany); we have shown previously
- Page 85 and 86: Manipulating Milk Fatty Acid Compos
- Page 87 and 88: increase in rumen output of vacceni
- Page 89 and 90: Luna et al., 2005; Nudda et al., 20
- Page 91 and 92: Cabiddu, A., M. Decandia, M. Addis,
- Page 93 and 94: MANAGING YOUR OWN RETAIL SHOP: MARK
- Page 95 and 96: The Reality our feta demonstrates t
- Page 97 and 98: Meat and meat dishes: 1. Legs: whol
- Page 99 and 100: 5. We have daily visits from chefs
- Page 101 and 102: HOW TO GRAZE DAIRY SHEEP AND SUPPLE
- Page 103 and 104: significantly increase milk product
- Page 105 and 106: All parameters are significantly di
- Page 107 and 108: Table 6 - Dry matter intake and mil
- Page 109 and 110: animals can reduce intake, as they
- Page 111 and 112: Milk fat and protein concentrations
- Page 113 and 114: fat concentration can be used as a
- Page 115 and 116: (1998), working with adult Sarda ew
probability (%)<br />
70<br />
60<br />
50<br />
40<br />
30<br />
20<br />
10<br />
0<br />
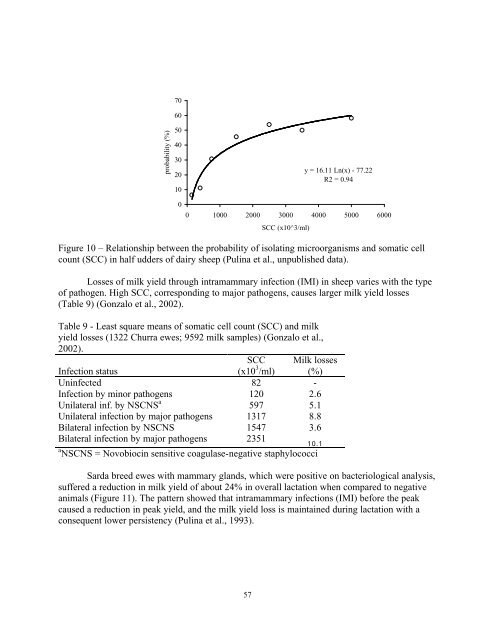
Figure 10 – Relationship between <strong>the</strong> probability <strong>of</strong> isolating microorganisms and somatic cell<br />
count (SCC) in half udders <strong>of</strong> dairy sheep (Pulina et al., unpublished data).<br />
Losses <strong>of</strong> milk yield through intramammary infection (IMI) in sheep varies with <strong>the</strong> type<br />
<strong>of</strong> pathogen. High SCC, corresponding to major pathogens, causes larger milk yield losses<br />
(Table 9) (Gonzalo et al., 2002).<br />
Table 9 - Least square means <strong>of</strong> somatic cell count (SCC) and milk<br />
yield losses (1322 Churra ewes; 9592 milk samples) (Gonzalo et al.,<br />
2002).<br />
SCC<br />
Infection status<br />
(x10 3 Milk losses<br />
/ml) (%)<br />
Uninfected 82 -<br />
Infection by minor pathogens 120 2.6<br />
Unilateral inf. by NSCNS a<br />
597 5.1<br />
Unilateral infection by major pathogens 1317 8.8<br />
Bilateral infection by NSCNS 1547 3.6<br />
Bilateral infection by major pathogens 2351<br />
10.1<br />
a NSCNS = Novobiocin sensitive coagulase-negative staphylococci<br />
Sarda breed ewes with mammary glands, which were positive on bacteriological analysis,<br />
suffered a reduction in milk yield <strong>of</strong> about 24% in overall lactation when compared to negative<br />
animals (Figure 11). The pattern showed that intramammary infections (IMI) before <strong>the</strong> peak<br />
caused a reduction in peak yield, and <strong>the</strong> milk yield loss is maintained during lactation with a<br />
consequent lower persistency (Pulina et al., 1993).<br />
57<br />
y = 16.11 Ln(x) - 77.22<br />
R2 = 0.94<br />
0 1000 2000 3000 4000 5000 6000<br />
SCC (x10^3/ml)


