Great Lakes Dairy Sheep Symposium - the Department of Animal ...
Great Lakes Dairy Sheep Symposium - the Department of Animal ... Great Lakes Dairy Sheep Symposium - the Department of Animal ...
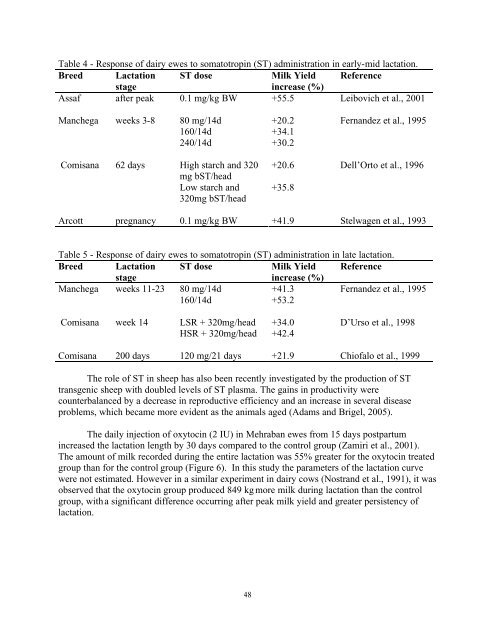
Table 4 - Response of dairy ewes to somatotropin (ST) administration in early-mid lactation. Breed Lactation ST dose Milk Yield Reference stage increase (%) Assaf after peak 0.1 mg/kg BW +55.5 Leibovich et al., 2001 Manchega weeks 3-8 80 mg/14d +20.2 Fernandez et al., 1995 160/14d +34.1 240/14d +30.2 Comisana 62 days High starch and 320 mg bST/head Low starch and 320mg bST/head 48 +20.6 Dell’Orto et al., 1996 +35.8 Arcott pregnancy 0.1 mg/kg BW +41.9 Stelwagen et al., 1993 Table 5 - Response of dairy ewes to somatotropin (ST) administration in late lactation. Breed Lactation ST dose Milk Yield Reference stage increase (%) Manchega weeks 11-23 80 mg/14d +41.3 Fernandez et al., 1995 160/14d +53.2 Comisana week 14 LSR + 320mg/head +34.0 D’Urso et al., 1998 HSR + 320mg/head +42.4 Comisana 200 days 120 mg/21 days +21.9 Chiofalo et al., 1999 The role of ST in sheep has also been recently investigated by the production of ST transgenic sheep with doubled levels of ST plasma. The gains in productivity were counterbalanced by a decrease in reproductive efficiency and an increase in several disease problems, which became more evident as the animals aged (Adams and Brigel, 2005). The daily injection of oxytocin (2 IU) in Mehraban ewes from 15 days postpartum increased the lactation length by 30 days compared to the control group (Zamiri et al., 2001). The amount of milk recorded during the entire lactation was 55% greater for the oxytocin treated group than for the control group (Figure 6). In this study the parameters of the lactation curve were not estimated. However in a similar experiment in dairy cows (Nostrand et al., 1991), it was observed that the oxytocin group produced 849 kg more milk during lactation than the control group, with a significant difference occurring after peak milk yield and greater persistency of lactation.
Figure 6 - Lactation curves of ewes given daily oxytocin injection over the whole lactation (WOT) or during the post-weaning period (POT) compared to saline treated control ewes (CONT) (Zamiri et al., 2001). Lambing season The effects of the lambing season on persistency of lactation have been mainly attributed to seasonal differences in the availability and quality of pasture (Cappio-Borlino et al., 1997b). The ewes that lambed when the maximum amount of forage was available had a higher milk yield, perhaps because of a positive effect on the differentiation of udder secretory cells and on the accumulation of body reserves. The influence of the lambing season on milk yield may also be related to the photoperiod. In Mediterranean areas, lactation occurs during the period when the days are lengthening. As has also been observed in dairy cows, the increase in the hours of light seems to improve milk production and feed intake (Bocquier et al., 1997). This effect was evident when the treatment lasted more than 30 days and may be explained by the fact that the animals feed more when there is more light. Indeed, sheep which were submitted, for a short period, to sharp changes in day length produced less milk (Pulina et al., 2002). Lactation number Analysis of the evolution of the shape of the lactation curve according to the number of lambings showed that Laxta (Gabina et al., 1993), Lacaune (Barillet, 1985), Sarda (Carta et al., 1995) and Valle del Belice (Cappio-Borlino et al., 1997b) dairy ewes produced more milk after the third or subsequent parities. By contrast, the peak yield took place quite late in 1 st lactation sheep and lactation is more persistent in almost all dairy breeds. Stanton et al. (1992) observed 49
- Page 7 and 8: Speakers at the symposium site in B
- Page 9 and 10: Gold: Sponsors Babcock Institute fo
- Page 11 and 12: “YOU WANT TO MILK WHAT?” IMPORT
- Page 13 and 14: already have their milking faciliti
- Page 15 and 16: efficient or just selling milk (or
- Page 17 and 18: production doubles. However, there
- Page 19 and 20: Total production (pounds) Percentag
- Page 21 and 22: Milk production (pounds) Average mi
- Page 23 and 24: Percentage of ewes in each system 1
- Page 25 and 26: 5. Ice Cream and Butter: • raw mi
- Page 27 and 28: 3. Fresh Cheeses made from pasteuri
- Page 29 and 30: The Vermont Cheese Council (www.vtc
- Page 31 and 32: 1 x Brine Tank (10’ long x 3 ft.
- Page 33 and 34: LAMB REARING STRATEGIES: FARMER PAN
- Page 35 and 36: BONNIEVIEW FARM’S LAMB REARING ST
- Page 37 and 38: REARING LAMBS AT 3-CORNER FIELD FAR
- Page 39 and 40: PROFITABILITY OF SMALL RUMINANT FAR
- Page 41 and 42: Table I. General Farm Description L
- Page 43 and 44: Table 4. Business Balance Sheet Ass
- Page 45 and 46: Table 5. Income Statement Income Av
- Page 47 and 48: Lifestyle is a definite reason for
- Page 49 and 50: Grossman et al., 1999). Animals wit
- Page 51 and 52: Physiological Factors Affecting Lac
- Page 53 and 54: Recently, it has been hypothesized
- Page 55 and 56: (co)variate in the genetic model us
- Page 57: show that milk production increases
- Page 61 and 62: milk yield (g/d) 3000 2500 2000 150
- Page 63 and 64: a genetic potential to produce more
- Page 65 and 66: when compared with the control grou
- Page 67 and 68: probability (%) 70 60 50 40 30 20 1
- Page 69 and 70: considered “healthy” if every S
- Page 71 and 72: Finally, udder health has to be con
- Page 73 and 74: De Maria Ghionna C., Dell’Aquila.
- Page 75 and 76: Manalu, W., Sumaryadi, M.Y., Sudjat
- Page 77 and 78: Rupp R., Boichard D., Barbat A., As
- Page 79 and 80: Introduction MILK FAT SYNTHESIS AND
- Page 81 and 82: The variety of fatty acids allows t
- Page 83 and 84: Germany); we have shown previously
- Page 85 and 86: Manipulating Milk Fatty Acid Compos
- Page 87 and 88: increase in rumen output of vacceni
- Page 89 and 90: Luna et al., 2005; Nudda et al., 20
- Page 91 and 92: Cabiddu, A., M. Decandia, M. Addis,
- Page 93 and 94: MANAGING YOUR OWN RETAIL SHOP: MARK
- Page 95 and 96: The Reality our feta demonstrates t
- Page 97 and 98: Meat and meat dishes: 1. Legs: whol
- Page 99 and 100: 5. We have daily visits from chefs
- Page 101 and 102: HOW TO GRAZE DAIRY SHEEP AND SUPPLE
- Page 103 and 104: significantly increase milk product
- Page 105 and 106: All parameters are significantly di
- Page 107 and 108: Table 6 - Dry matter intake and mil
Table 4 - Response <strong>of</strong> dairy ewes to somatotropin (ST) administration in early-mid lactation.<br />
Breed Lactation ST dose Milk Yield Reference<br />
stage<br />
increase (%)<br />
Assaf after peak 0.1 mg/kg BW +55.5 Leibovich et al., 2001<br />
Manchega weeks 3-8 80 mg/14d +20.2 Fernandez et al., 1995<br />
160/14d +34.1<br />
240/14d +30.2<br />
Comisana<br />
62 days High starch and 320<br />
mg bST/head<br />
Low starch and<br />
320mg bST/head<br />
48<br />
+20.6 Dell’Orto et al., 1996<br />
+35.8<br />
Arcott pregnancy 0.1 mg/kg BW +41.9 Stelwagen et al., 1993<br />
Table 5 - Response <strong>of</strong> dairy ewes to somatotropin (ST) administration in late lactation.<br />
Breed Lactation ST dose Milk Yield Reference<br />
stage<br />
increase (%)<br />
Manchega weeks 11-23 80 mg/14d +41.3 Fernandez et al., 1995<br />
160/14d +53.2<br />
Comisana week 14 LSR + 320mg/head +34.0 D’Urso et al., 1998<br />
HSR + 320mg/head +42.4<br />
Comisana 200 days 120 mg/21 days +21.9 Chi<strong>of</strong>alo et al., 1999<br />
The role <strong>of</strong> ST in sheep has also been recently investigated by <strong>the</strong> production <strong>of</strong> ST<br />
transgenic sheep with doubled levels <strong>of</strong> ST plasma. The gains in productivity were<br />
counterbalanced by a decrease in reproductive efficiency and an increase in several disease<br />
problems, which became more evident as <strong>the</strong> animals aged (Adams and Brigel, 2005).<br />
The daily injection <strong>of</strong> oxytocin (2 IU) in Mehraban ewes from 15 days postpartum<br />
increased <strong>the</strong> lactation length by 30 days compared to <strong>the</strong> control group (Zamiri et al., 2001).<br />
The amount <strong>of</strong> milk recorded during <strong>the</strong> entire lactation was 55% greater for <strong>the</strong> oxytocin treated<br />
group than for <strong>the</strong> control group (Figure 6). In this study <strong>the</strong> parameters <strong>of</strong> <strong>the</strong> lactation curve<br />
were not estimated. However in a similar experiment in dairy cows (Nostrand et al., 1991), it was<br />
observed that <strong>the</strong> oxytocin group produced 849 kg more milk during lactation than <strong>the</strong> control<br />
group, with a significant difference occurring after peak milk yield and greater persistency <strong>of</strong><br />
lactation.


