Great Lakes Dairy Sheep Symposium - the Department of Animal ...
Great Lakes Dairy Sheep Symposium - the Department of Animal ...
Great Lakes Dairy Sheep Symposium - the Department of Animal ...

Create successful ePaper yourself
Turn your PDF publications into a flip-book with our unique Google optimized e-Paper software.
Milk fat (%)<br />
Milk fat (%)<br />
14<br />
12<br />
10<br />
8<br />
6<br />
4<br />
2<br />
14<br />
12<br />
10<br />
8<br />
6<br />
4<br />
2<br />
y = 0.01x + 8.02<br />
R 2 = 0.00<br />
30 35 40 45 50 55<br />
Dietary NDF (% DM)<br />
y = 0.001x + 7.846<br />
R 2 = 0.007<br />
0 100 200 300 400 500<br />
Milk yield (g/d)<br />
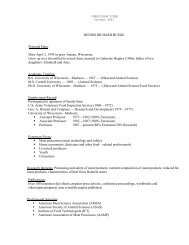
Figure 5 - Relationship between milk fat concentration and dietary and animal characteristics for<br />
ewes that produced less than 400 g/d <strong>of</strong> milk.<br />
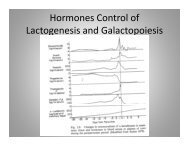
The concentration <strong>of</strong> urea in <strong>the</strong> milk as a nutritional indicator<br />
As for dairy cows, milk urea (MU) is an excellent nutritional indicator <strong>of</strong> <strong>the</strong> protein<br />
status <strong>of</strong> dairy sheep. Milk urea originates from <strong>the</strong> diffusion <strong>of</strong> blood urea (BU) into <strong>the</strong><br />
mammary gland. Indeed, MU is closely correlated with BU concentration. However, MU is more<br />
stable (Baker et al., 1992) and easier to sample than BU.<br />
In ruminants, urea is formed by <strong>the</strong> liver using ammonia as a major substrate. This process is<br />
energetically very costly (e.g. <strong>the</strong> energy cost <strong>of</strong> eliminating 100 g <strong>of</strong> CP in excess <strong>of</strong> sheep<br />
needs is <strong>the</strong> same as that <strong>of</strong> producing 200 g <strong>of</strong> sheep milk). In some cases, this process<br />
remarkably affects total energy requirements. The two major sources <strong>of</strong> ammonia, and thus <strong>of</strong><br />
MU, are:<br />
a) <strong>the</strong> ammonia formed in <strong>the</strong> rumen by bacteria fermentation <strong>of</strong> nitrogen sources (protein<br />
and non protein nitrogen, NPN) that is not used by bacteria for protein syn<strong>the</strong>sis. The<br />
ammonia in excess is absorbed by <strong>the</strong> rumen wall and <strong>the</strong>n carried to <strong>the</strong> liver, where it is<br />
converted in urea; and<br />
b) <strong>the</strong> ammonia formed as a by-product in <strong>the</strong> process <strong>of</strong> gluconeogenesis, when amino acids<br />
are converted to glucose, or in processes <strong>of</strong> amino acids catabolization.<br />
Despite <strong>the</strong> importance <strong>of</strong> MU as a nutritional indicator in dairy cows, systematic studies on<br />
its use in dairy sheep are recent. In one <strong>of</strong> <strong>the</strong> first studies published on this topic, Cannas et al.<br />
104<br />
Milk fat (%)<br />
Milk fat (%)<br />
14<br />
12<br />
10<br />
8<br />
6<br />
4<br />
2<br />
14<br />
12<br />
10<br />
8<br />
6<br />
4<br />
2<br />
y = -0.96x + 9.27<br />
R 2 = 0.04<br />
0.5 1.0 1.5 2.0 2.5<br />
NDF intake (% BW)<br />
y = -1.14x + 8.59<br />
R 2 = 0.06<br />
-0.5 0.0 0.5 1.0 1.5<br />
Energy balance (UFL/d)