IndonesIa's greenhouse gas abatement cost curve
IndonesIa's greenhouse gas abatement cost curve
IndonesIa's greenhouse gas abatement cost curve

Create successful ePaper yourself
Turn your PDF publications into a flip-book with our unique Google optimized e-Paper software.
IndonesIa’s <strong>greenhouse</strong><br />
<strong>gas</strong> <strong>abatement</strong> <strong>cost</strong> <strong>curve</strong><br />
Dewan Nasional Perubahan Iklim, Indonesia<br />
august 2010
2<br />
IndonesIa’s <strong>greenhouse</strong> <strong>gas</strong> <strong>abatement</strong> <strong>cost</strong> <strong>curve</strong>
Contents<br />
Foreword 2<br />
Preface 4<br />
Acknowledgements 6<br />
How to read the <strong>greenhouse</strong> <strong>gas</strong> <strong>abatement</strong> <strong>cost</strong> <strong>curve</strong> 8<br />
Summary of findings 10<br />
Emissions scenarios and <strong>abatement</strong> opportunities by sector 14<br />
Peat 14<br />
Land use, land-use change, and forestry (LuLucf) 18<br />
agriculture 23<br />
Power 25<br />
transportation 28<br />
Petroleum and <strong>gas</strong> 30<br />
cement 33<br />
buildings 34<br />
Appendices 37<br />
methodology and scope 38<br />
Peat science 41<br />
reconciliation of dnPI’s estimates with the second national communication 43<br />
bibliography 46
2<br />
IndonesIa’s <strong>greenhouse</strong> <strong>gas</strong> <strong>abatement</strong> <strong>cost</strong> <strong>curve</strong><br />
foreWord<br />
man-made climate change is one of the major challenges we face as a global community. success in tackling<br />
this highly complex problem will require strong will, great policy skills and above all, a global commitment to<br />
fairness and justice, according to the principle of common but differentiated responsibility among nations.<br />
these principles underlie Indonesia’s strong commitment to this struggle. We have committed to make a<br />
26 percent cut in our <strong>greenhouse</strong> <strong>gas</strong> (ghg) emissions by 2020 (as against projections of our business as<br />
usual emissions). President soesilo bambang Yudhoyono has stated that – with the right level of international<br />
support – Indonesia can cut 41 percent of its emissions, which would in turn deliver nearly 7 percent of the<br />
cuts called for by the Intergovernmental Panel on climate change.<br />
the redd+ Partnership signed by Indonesia and norway in may, 2010 is among the developments which<br />
should encourage us that a system of viable international support is evolving. equitable partnerships<br />
between developing and developed world are central to a global climate change solution.<br />
the analysis underlying this document is an important tool in Indonesia’s efforts to deliver ghg emissions<br />
cuts while protecting, even enhancing, long-term economic growth and development. With this document,<br />
the dewan nasional Perubahan Iklim aims to provide a common analytical basis to which different<br />
stakeholders can refer in thinking through different options. What measures will deliver the biggest impact<br />
in terms of emissions reduced? Which are likely to be more expensive, which less so? using this knowledge,<br />
how should we prioritize our policy moves? how can we sequence our moves? What can we do now, and<br />
what should wait? the Indonesia ghg <strong>abatement</strong> <strong>cost</strong> <strong>curve</strong> will remain useful as the policy environment<br />
continues to evolve.<br />
this analysis has been carried out in close consultation with many stakeholders and experts, inside<br />
and outside of government. While they may or may not agree will our conclusions, they have all certainly<br />
contributed to improve the quality of the analysis. a policy process now continues within and between<br />
central and provincial government, and the different national ministries and relevant agencies. there is still<br />
a long way to go to establishing a rich consensus and a mutually-shared understanding among all experts,<br />
particularly in having a detailed understanding and database of the state of our forests and peat swamps, as<br />
well as our land use across the archipelago.<br />
Part of the uncertainty resides in the science. our understanding of emissions from peat soils, to pick one<br />
example, is still evolving, as research is done in different settings and with constantly improving methodologies<br />
and instruments. In some cases, we have had no choice but to use estimates for emissions. but the point of<br />
the exercise has not been to try to come up with the most nearly perfect estimates, of emissions or <strong>abatement</strong><br />
potential. rather the goal has been to create a framework for analysis that can guide us with genuine insights<br />
now, but which can be extended and improved as our knowledge grows.<br />
among the most important achievements of the report is to clarify and quantify the central importance of<br />
land use, and land use change in Indonesia’s current emissions picture. the report has also measured the<br />
impact of the different efforts which could mitigate these land-use based emissions. slowing deforestation is<br />
an important measure here, but it is by no means the only one.<br />
and as the report calls for a greater focus on land and spatial planning, the analysis also highlights how<br />
emissions from energy generation and transportation will become increasingly important as Indonesia<br />
continues to grow. the impact of a carbon-inefficient energy and transport infrastructure may not be so<br />
important today, in the overall scheme of things. however, the forward-looking elements of this analysis<br />
provides a profound view of the importance of today’s infrastructure decisions. especially when the energy<br />
infrastructure accounts for a much higher percentage of total emissions in our future.
IndonesIa’s <strong>greenhouse</strong> <strong>gas</strong> <strong>abatement</strong> <strong>cost</strong> <strong>curve</strong> 3<br />
thank you for your interest in this report, and for your efforts to enable Indonesia to work towards a future<br />
based on long-term, sustainable, development.<br />
Prof. (Hon) Rachmat Witoelar<br />
executive chair<br />
national council on climate change
4<br />
IndonesIa’s <strong>greenhouse</strong> <strong>gas</strong> <strong>abatement</strong> <strong>cost</strong> <strong>curve</strong><br />
Preface<br />
under the leadership of President susilo bambang Yudhoyono, Indonesia has made several important<br />
contributions to the global climate change debate. after hosting the united nations framework climate<br />
change convention conference of Parties (coP-13) in bali in 2007, Indonesia has organized or participated<br />
in a series of high-level gatherings to address the issue of reducing <strong>greenhouse</strong> <strong>gas</strong> (ghg) emissions from<br />
the forestry sector. these include the forestry-11 grouping convened by Indonesia, the Informal Working<br />
group on Interim financing for redd, and the april 2009 meeting of heads of state convened by the Prince’s<br />
rainforest Project.<br />
at the september 2009 g-20 summit in Pittsburgh, President Yudhoyono voluntarily committed Indonesia<br />
to an ambitious roadmap for reducing carbon emissions by 26 percent against a business-as-usual estimate<br />
of emissions in 2020, the first large developing country to do so. Indonesia reaffirmed its commitment to the<br />
reduction target at the coP-15 round of un climate change negotiations in copenhagen in december 2009<br />
and subsequently associated itself with the copenhagen accord in January 2010. the government is currently<br />
preparing a national action Plan on climate change, which will describe in detail how Indonesia will meet<br />
its 26 percent commitment. another major milestone was reached on 28 may 2010 with the announcement<br />
of a redd+ Partnership between Indonesia and norway, in which norway pledged usd 1 billion towards<br />
redd+ readiness programs and as contributions in return for verified emissions reductions. at the same time,<br />
Indonesia committed to a two-year suspension of new concessions or forested land and peatland. 1 these<br />
steps position Indonesia well to benefit from the usd 30 billion of fast-start funds committed at coP-15.<br />
to coordinate climate change-related activities within Indonesia, in July 2008 President Yudhoyono<br />
established the dewan nasional Perubahan Iklim (dnPI) or national council on climate change. the council<br />
is specifically tasked with the role of convening different stakeholders in Indonesia to create consensus around<br />
the opportunities and challenges related to climate change. to that effect, the dnPI has commissioned<br />
this ghg <strong>abatement</strong> <strong>cost</strong> <strong>curve</strong> analysis to provide a quantitative basis for a national discussion on the<br />
opportunities for reducing ghg emissions in Indonesia consistent with national development goals.<br />
this report evaluates the potential reduction in emissions coming from different <strong>abatement</strong> initiatives, as well<br />
as estimating the <strong>cost</strong>s involved for each of those initiatives. through this paper the dnPI intends to provide<br />
an objective and uniform set of data that will support Indonesia’s decision-making process, as we work<br />
together with relevant ministries, regional governments, and others to reduce Indonesia’s ghg emissions.<br />
We are committed to ensure such reductions in carbon emissions support rather than undermine our national<br />
development goals and our long-term efforts to improve the standard of living for all Indonesians. the dnPI is<br />
currently extending the analysis and data contained in the ghg <strong>abatement</strong> <strong>cost</strong> <strong>curve</strong> through its support<br />
in developing low-carbon growth strategies in several Indonesian provinces with high emissions levels.<br />
this study builds on the proprietary global ghg <strong>abatement</strong> database created by the global consultancy<br />
mcKinsey & company and developed in partnership with governments, businesses, and non-governmental<br />
organizations around the world. the dnPI would like to acknowledge the technical support of mcKinsey<br />
in extending and further developing its methodology for the Indonesian context. the dnPI would also<br />
like to thank the more than 150 government, private-sector, and ngo personnel who made important<br />
contributions to the sectoral working teams. While the ghg <strong>abatement</strong> methodology belongs to mcKinsey,<br />
the conclusions and results set forth in this report are exclusively those of the dnPI.<br />
1 The GHG <strong>abatement</strong> scenarios discussed in this report do not take into account emissions reductions stemming from the<br />
two-year suspension of new forest and peat concessions announced in May 2010
IndonesIa’s <strong>greenhouse</strong> <strong>gas</strong> <strong>abatement</strong> <strong>cost</strong> <strong>curve</strong> 5<br />
We would also like to express our appreciation to the climateWorks foundation, the agence française de<br />
développement (afd), the norwegian government, and the Packard foundation for partially funding this<br />
work.<br />
much work remains to further develop the scientific understanding that underlies this study, particularly in the<br />
Land use, Land-use change, and forestry (LuLucf) and peat sectors. estimates and extrapolations have<br />
been made for some emissions categories where data is incomplete or missing.<br />
this report highlights that while Indonesia’s emissions are significant and expected to grow by more than<br />
60 percent between today and 2030, many opportunities exist to mitigate these emissions. With the<br />
support of the global community, Indonesia has a window of opportunity to shift to a less carbon-intensive<br />
development model. Without early action, Indonesia may become locked into a growth model (particularly<br />
through long-term infrastructure choices) that is unsustainable for our, and the world’s, environment.<br />
this report focuses on the potential for ghg mitigation. It does not address the challenge Indonesia faces<br />
in adapting to climate change that has or will occur, although we recognize that the <strong>cost</strong>s of adaptation will<br />
be both significant and additive to mitigation <strong>cost</strong>s. this report also intentionally avoids any assessment of<br />
policies and regulatory choices. Its purpose is to provide an objective and uniform set of data that can serve<br />
to underlie policy discussions.
6<br />
IndonesIa’s <strong>greenhouse</strong> <strong>gas</strong> <strong>abatement</strong> <strong>cost</strong> <strong>curve</strong><br />
acKnoWLedgements<br />
In the process of this study, the project team met with a large number of experts and stakeholders. the dnPI<br />
would like to thank the following individuals for their assistance and their time. While we have received input,<br />
advice and feedback from the following individuals, the conclusions here are those of the dnPI.<br />
For information and input on the LULUCF and peatland sectors, dr. boen Purnama, dr. Wandojo<br />
siswanto, dr. hadi daryanto, dr. bambang sukmananto, Ibu Lystia, saiphul rahman, dyah Puspasari,<br />
Puja utama, magdalena gultom, dr. Wardojo, dr. syaiful anwar, dr. Ibu Yetti rusli, and Pak agus sarsito,<br />
Ministry of Forestry. others consulted include Joseph Leitmann, timothy brown, eri Indrawan and virza<br />
susmitawidjaja, World Bank; frances seymour, daniel murdiyarso, and Louis verchot CIFOR; dieter<br />
brulez, heiner von Luebcke, and anja rosenberg, GTZ; Joel daligault, Patrick abbes, dimitri Kanounnikoff,<br />
Philippe guizol, morgane Leterrier, thierry Liabastre, AFD; grahame applegate, dan heldon, and timothy<br />
Jessup, AusAid; andrew Wardell, Clinton Foundation; alfred nakatsuma, USAID; alex heikens,<br />
UNDP; marcel silvius, Pak nyoman, and Yus rusila noor, Wetlands International; dr. suyanto, meine<br />
van noorwijk, and ujjwal Pradhan, ICRAF; aljosja hooijer, Delft Hydraulics; fitrian ardiansyah, anna von<br />
Paddenburg, Katie stafford, adam tomasek, michael steuwe, Iwan Wibisono, and Zulfira Warta, WWF;<br />
Lex hovani, Wahjudi Wardojo, TNC; fred stolle, beth gingold, WRI; aulia aruan, neil franklin, and Jouko<br />
virta, APRIL; dharsono hartono, Pt rimba makmur utama, timotheus Lesmana and canecio munoz,<br />
Sinarmas; taufiq alimi, Indonesian Biodiversity Foundation; adrian suharto, AsianAgri; sapto sakti<br />
and Yosafat erie, Sampoerna Foundation; mahawira singh dillon, PT Sumalindo Lestari Jaya T; michael<br />
black, Teknix Capital; aris adhianto, Asosiasi Pengusaha Hutan; nanang roffandi ahmad, APH; rezal<br />
Kusumaatmadja, Starling Resources; rizaldi boer Center for Climate Risk & Operation Management;<br />
Ibu moekti soejachmoen, Pelangi; dr. agus Justianto, MFP; dewi rizki, GRM International; emmy hafild,<br />
arief Wicaksono, hanafi guciano, Kemitraan; and a. m velinda, Ditjen Baplan.<br />
For information and input on the power, petroleum, and <strong>gas</strong> sectors, Lisa ambarsari, marwan Lobo<br />
balia, ellydar bahar, I made agus, ratna ariati, and sutijastoto, DS ESDM; nunung ajiwihanto, bambang<br />
Praptono, bambang Prasetoyo, harris, edy Iskanto, assistia semiawan, and Putu Wirasangka, PLN; ami<br />
Indriyanto, IIEE; agus sari, Ecosecurities; mohammad boedoyo and muhammad Wahid, BPPT; saleh,<br />
PUSPATIN and ESDM; anton Wahjosoedibjo, MKI; ris Wahyudi, LItbang, ESDM; fathurrahman, martha<br />
maulidia, and mauayat ali muhsi, PEACE; bobby Watimena and moekti soejachmoen, Pelangi; fabby<br />
tumiwa, IESR; firdaus akmal, Indonesia Coal Society; sri endah agustina, METI; anna reani, Indonesia<br />
Power; ade hermaka and darman mappangara, PT. LEN Industri; Widhyawan Prawiraatmadja, timbul<br />
silitonga, and adi Pramono, Pertamina.<br />
for information and input on the transportation sector, arif, arisman harefa, Wendy aritenang, djarot, Pudji<br />
Kinanti, siti nur, farida m, edhy sudjiono, and gatot s, Ministry of Transportation; bambang susantono,<br />
Transportation Association; moekti soejachmoen, Pelangi; John Kwant, Ford Asia Pacific; freddy<br />
sutrisno, noegardjito, budi susilo, and Juwono andrianto, Gaikindo; harya dillon and restiti, ITDP; dadang<br />
Parikesit, Pustral; mesra eza, Ministry of Finance; martha maulidia, PEACE; and bambang s and heru<br />
sutanto, AISI; Waty suhadi, Swisscontact.<br />
For information and input on the cement industry, agus Wahyudi, endang supraptini, sangapan, denny<br />
noviansyah, emmy suryandari and tony tanduk, Ministry of Industry; urip timuryono, sudaryanto and<br />
risatantin, ASI; raju goyal, eamon ginley, faisal nur, and oepoyo Prakoso, urip timuryono, sudaryanto,<br />
and risatantin, PT Holcim; enggun Puwoko, rudi hermanwan, and gatot mardiana, Semen Gresik; agus<br />
erfien, Indocement; moekti soejahmaoen and martha maulidia, Pelangi; and gary Kleiman and virza<br />
sasmitawidjaja, World Bank.
IndonesIa’s <strong>greenhouse</strong> <strong>gas</strong> <strong>abatement</strong> <strong>cost</strong> <strong>curve</strong> 7<br />
For information and input on the agriculture sector, gatot Irianto and Kaman nainggolan, Ministry of<br />
Agriculture; h.s. dillon, Centre for Agricultural & Policy Institutes; rizaldi boer, Center for Climate Risk &<br />
Operation Management; dr. shobha shetty, World Bank; taco bottema, Peter timmer, Centre for Global<br />
Development; Pete smith, University of Aberdeen (IPCC Report); and dennis vonboril, US Embassy.<br />
For information and input on buildings, Jesper vauvert, Danish International Development Agency<br />
(DANIDA); Jonathan I Levy, Harvard School of Public Health; francis rubinstein, Lawrence Berkeley<br />
National Laboratory; Jean su & aleksandra barnes, Clinton Climate Initiative.
8<br />
IndonesIa’s <strong>greenhouse</strong> <strong>gas</strong> <strong>abatement</strong> <strong>cost</strong> <strong>curve</strong><br />
hoW to read the<br />
<strong>greenhouse</strong> <strong>gas</strong><br />
<strong>abatement</strong> <strong>cost</strong> <strong>curve</strong><br />
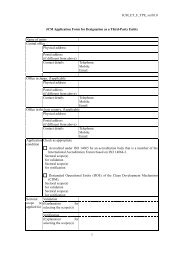
the global <strong>greenhouse</strong> <strong>gas</strong> <strong>abatement</strong> “<strong>cost</strong> <strong>curve</strong>” developed by global consultancy mcKinsey & company 2<br />
summarizes the technical potential to reduce emissions of <strong>greenhouse</strong> <strong>gas</strong>es at a <strong>cost</strong> of up to 80 usd per<br />
ton co 2 e 3 of avoided emissions. the <strong>cost</strong> <strong>curve</strong> shows the range of emission reduction actions that are<br />
possible with technologies that either are available today or are highly likely to be available by 2030.<br />
the width of each bar represents the potential of that opportunity to reduce ghg emissions in a specific year<br />
compared to business-as-usual development (bau). the potential of each opportunity assumes aggressive<br />
global action starting in 2010 to capture that specific opportunity and so does not represent a forecast of how<br />
each opportunity will develop. the height of each bar represents the average <strong>cost</strong> of avoiding 1 ton of co 2 e by<br />
2030 through that opportunity. the <strong>cost</strong> is a weighted average across sub-opportunities and years. all <strong>cost</strong>s<br />
are in 2005 real usd. from left to right, the graph presents the lowest-<strong>cost</strong> <strong>abatement</strong> opportunities to the<br />
highest-<strong>cost</strong>. 4 the uncertainty of volume and <strong>cost</strong> estimates can be significant for individual opportunities, in<br />
particular for LuLucf and peat and for emerging technologies (exhibit 1).<br />
Exhibit 1<br />
The <strong>cost</strong> <strong>curve</strong> is developed in a four step process…<br />
GHG emissions<br />
tCO 2 e<br />
2005 baseline<br />
Emissions growth in<br />
frozen technology<br />
scenario (2005-2030)<br />
Decarbonization in<br />
Reference case<br />
(2005-2030)<br />
Reference case<br />
emissions 2030<br />
Abatement<br />
lever potential<br />
Potential <strong>abatement</strong><br />
scenario<br />
("end game")<br />
3<br />
Estimated<br />
<strong>cost</strong> in year<br />
chosen to<br />
reduce<br />
emissions by<br />
1 tCO2e with<br />
this lever<br />
Cost of <strong>abatement</strong><br />
USD / tCO 2 e<br />
1<br />
Each field represents one<br />
<strong>abatement</strong> lever to reduce<br />
emissions<br />
Abatement<br />
Gt CO 2 e/year<br />
2<br />
Annual GHG emission<br />
reduction potential in<br />
chosen year<br />
4<br />
Levers are sorted by<br />
increasing <strong>cost</strong>s for the<br />
reduction of emissions<br />
by tCO2e ▪ The <strong>cost</strong> <strong>curve</strong> displays <strong>abatement</strong> potential, and corresponding <strong>cost</strong>, for each<br />
<strong>abatement</strong> lever relative to a "business-as-usual" scenario<br />
▪ The merit order is applied based on the cheapest measures in 2030 in USD/tCO 2 e<br />
Source: McKinsey & Company Global GHG Abatement Cost Curve v2.0<br />
2 McKinsey & Company (2009) Pathways to a Low-Carbon Economy: Version 2 of the Global Greenhouse Gas Abatement Cost<br />
Curve<br />
3 Following IPCC definitions, the <strong>abatement</strong> <strong>cost</strong> <strong>curve</strong> shows technical measures with economic potential under USD 80 per<br />
tCO2e<br />
4 A negative <strong>cost</strong> lever on the <strong>cost</strong> <strong>curve</strong> implies that while an upfront capital investment may be required, the lever will more than<br />
pay for itself over its lifetime through energy savings when the investment is evaluated at a societal <strong>cost</strong> of capital (i.e., for the<br />
purposes of this study, this has been taken at 4 percent).
IndonesIa’s <strong>greenhouse</strong> <strong>gas</strong> <strong>abatement</strong> <strong>cost</strong> <strong>curve</strong> 9<br />
mcKinsey’s global <strong>greenhouse</strong> <strong>gas</strong> <strong>cost</strong> <strong>curve</strong> aims to look at global emission reduction opportunities with<br />
one consistent methodology, rather than to analyze in detail any individual emission reduction opportunity.<br />
therefore the <strong>curve</strong> should be used for overall comparisons of the size and <strong>cost</strong> of different opportunities,<br />
the relative importance of different sectors, and the overall size of the emission reduction opportunity, rather<br />
than for predictions of the development of individual technologies. It can also be used as a simulation tool for<br />
testing different implementation scenarios, energy prices, interest rates, and technological developments.<br />
the <strong>cost</strong> of <strong>abatement</strong> is calculated from a societal perspective (i.e., excluding taxes, subsidies, and with a<br />
capital <strong>cost</strong> similar to government bond rates), which is useful to allow comparisons of opportunities and <strong>cost</strong>s<br />
across countries, sectors, and individual opportunities. however it also means that the <strong>cost</strong>s calculated are<br />
different from the <strong>cost</strong>s a company or consumer would see, as taxes, subsidies, and different interest rates in<br />
their calculations would then also be included. therefore the <strong>curve</strong> cannot be used for determining switching<br />
economics between investments, nor for forecasting co 2 prices. the <strong>cost</strong> of each opportunity also excludes<br />
transaction and program <strong>cost</strong>s to implement the opportunity on a large scale, as these are highly dependent<br />
on how policy makers choose to implement each opportunity. the <strong>cost</strong>s to fully implement specific reduction<br />
opportunities, therefore, will in most cases be higher than those shown in the <strong>cost</strong> <strong>curve</strong>.
10<br />
IndonesIa’s <strong>greenhouse</strong> <strong>gas</strong> <strong>abatement</strong> <strong>cost</strong> <strong>curve</strong><br />
summarY of fIndIngs<br />
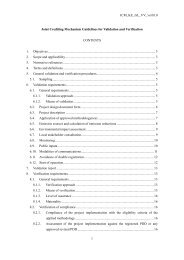
Indonesia’s annual <strong>greenhouse</strong> <strong>gas</strong> (ghg) emissions amounted to approximately 2.1 5 giga tons (gt) 6 in<br />
2005. as Indonesia continues to develop, its total ghg emissions are expected to rise to 3.2 gt by 2030. In<br />
both 2005 and 2030, Indonesia’s emissions account for approximately 4.5 percent of global ghg emissions<br />
in a business-as-usual scenario. Indonesia’s share of global emissions is significantly higher than its share<br />
of real global gdP, which was 0.6 percent in 2005. a comparison of the dnPI’s emission estimates and<br />
those in the ministry of environment’s second national communication (revised on december 5, 2009)<br />
shows a broad consistency in the overall emission levels, albeit with significant differences in the sectoral<br />
composition of these emissions. 7<br />
analysis of the potential benefits and indicative <strong>cost</strong>s of various ghg emissions <strong>abatement</strong> measures suggests<br />
that by 2030, Indonesia has the potential to reduce its ghg emissions by 2.3 gt, representing a reduction of<br />
approximately 72 percent compared to the current trend. thus, emissions in 2030 would be 67 percent lower<br />
than emissions in 2005. such a reduction would be an important contribution to global efforts, amounting<br />
to some 7 percent of the total global reduction required by 2030 to reach the levels recommended by the<br />
Intergovernmental Panel on climate change (IPcc). 8<br />
furthermore, the average <strong>cost</strong> of Indonesia’s potential emissions reductions is relatively low, compared to<br />
some of the <strong>abatement</strong> options available in most developed countries. the known technical <strong>cost</strong> 9 and the<br />
<strong>cost</strong> of currently available <strong>abatement</strong> technologies show that Indonesia’s estimated average <strong>abatement</strong><br />
<strong>cost</strong> is in the order of 2 usd per tco 2 e by 2030. 10<br />
Peat and LULUCF comprise Indonesia’s largest opportunity<br />
Peat and LuLucf-related emissions are by far the largest contributors to Indonesia’s current and expected<br />
future emissions (exhibit 2) under a business-as-usual scenario (bau). they also represent the largest<br />
opportunities to abate emissions. high growth rates in power and transport-related emissions mean that,<br />
although opportunities in these sectors become progressively more important in the years ahead, strategic<br />
choices on the development pathway must begin today.<br />
emissions from carbon-rich peatlands amount to 772 mtco 2 e, roughly 38 percent of Indonesia’s total emissions<br />
in 2005. 11 Peatlands have acidic water-logged soils, which in a dry state contain as much as 60 percent carbon<br />
in the form of organic matter that has accumulated over thousands of years. When peat soils are drained for<br />
cultivation, timber extraction or other land uses, they are aerated and begin to oxidize and decompose. the<br />
slow oxidation of drained peatlands or their more rapid oxidation through peat fires are the main sources of<br />
peatland emissions.<br />
5 Total emissions here refers to emissions from eight sectors including LULUCF, peat, agriculture, power, petroleum and refining,<br />
transportation, cement and buildings, which together account for the majority of Indonesia’s emissions<br />
6 One Giga ton (Gt) is equivalent to one billion tons<br />
7 The Second National Communication (SNC) provides emission estimates for the year 2000. The overall estimates of CO2 net<br />
emissions in 2000 from the DNPI and the SNC are very similar, differing by less than 8 percent.<br />
8 The IPCC is a scientific intergovernmental body established in 1988 under the auspices of the United Nations and tasked to<br />
evaluate the risk of climate change caused by human activity. It has stated that global <strong>greenhouse</strong> <strong>gas</strong> concentrations will reach<br />
650 ppm by 2030 on current global trends. This would far exceed the 450 ppm level – the level at which scientists have deemed<br />
we can avoid catastrophic climate changes as global temperatures would not rise more than 2 degrees Celsius. According to<br />
Project Catalyst, to limit <strong>greenhouse</strong> <strong>gas</strong> concentrations to this safer level, <strong>greenhouse</strong> <strong>gas</strong> emissions must be cut globally by<br />
at least 32 GtCO2e in 2030 compared to current trends.<br />
9 This paper considers various <strong>cost</strong>s in evaluating <strong>abatement</strong> options. Technical <strong>cost</strong>s are defined as the incremental <strong>cost</strong> of a<br />
low emission technology compared to the reference case, measured as USD per tCO2e abated emissions. Technical <strong>cost</strong>s<br />
include annualized repayments for capital expenditure and operating expenditure, and thus represent the pure “project <strong>cost</strong>”<br />
to install and operate the low-emission technology. They include neither implementation <strong>cost</strong>s nor social <strong>cost</strong>s (e.g. the loss<br />
of biosystem services such as clean, fresh water supply from forests). Full <strong>abatement</strong> <strong>cost</strong>s include both technical <strong>cost</strong>s as<br />
defined above and implementation <strong>cost</strong>s., but not social <strong>cost</strong>s. Finally, opportunity <strong>cost</strong>s refer to the full foregone revenue an<br />
agent gives up to switch to a lower emission technology, behaviour or alternative.<br />
10 This estimate does not include transaction or other implementation <strong>cost</strong>s, which can be significant for some <strong>abatement</strong> measures<br />
11 The Ministry of Forestry data suggests that Indonesia has 22 million ha of peatland
Indonesian emissions are estimated to grow from 2.1 to 3.3 GtCO 2 e<br />
between 2005 and 2030<br />
Projected emissions 1 , Million tons CO 2 e<br />
25<br />
25<br />
60<br />
2,055<br />
95<br />
130<br />
110<br />
840<br />
IndonesIa’s <strong>greenhouse</strong> <strong>gas</strong> <strong>abatement</strong> <strong>cost</strong> <strong>curve</strong> 11<br />
these two emission sources are globally significant, accounting for almost 0.77 gt in current annual emissions,<br />
an amount close to that of germany. Peatland-related emissions are also a unique and predominantly Indonesian<br />
challenge, as Indonesia accounts for almost 60 percent of global emissions from peat decomposition (exhibit<br />
3). a further 0.25 gt is caused by deforestation and degradation (through timber extraction) of peatland forests,<br />
however we account for this loss of aboveground carbon in the LuLucf sector.<br />
While a great deal of research into peat emissions and measurement is ongoing in Indonesia, the scientific<br />
world’s understanding of peat-related emissions is still developing. consequently, there is a relatively wide<br />
range in the estimates of Indonesia’s emissions from peat decomposition and fires. We have adopted relatively<br />
conservative estimates for the two categories of peat-related emissions (decomposition, fires) to reach our<br />
total peat-related emissions 2005 estimate of 0.77 gtco 2 e. most analyses of Indonesia’s emissions related<br />
to peat decomposition and fire fall within the range of 0.75 to 1.5 gtco 2 e.<br />
deforestation, forest degradation and forest fire is the second largest source of ghg emissions in Indonesia<br />
and is expected to remain a significant contributor to Indonesia’s emission profile, with approximately 1.1 million<br />
hectares of high carbon value (hcv) forests cleared per year, with slightly more than 25 percent occurring in<br />
peatland forests and the remainder occurring in dry-land forests. deforestation, forest degradation and forest<br />
fire is resulting in gross emissions of approximately 1.1 gtco 2 e. Indonesia’s natural secondary and “manmade”<br />
forests (timber and estate crop plantations) absorb at the same time significant amounts of co 2 e, which<br />
reduced Indonesia’s gross emissions from LuLucf by more than 250 mtco 2 e in 2005. this results in net<br />
emissions of approximately 838 mtco 2 e, representing 41 percent of Indonesia’s current total emissions.<br />
broadly accepted estimates indicate that around 15–23 percent 12 of the world’s ghg emission reduction<br />
potential needed by 2020 will come from the LuLucf and peat sectors. unsurprisingly, given the size of<br />
Indonesia’s forests, many of these opportunities are located within Indonesia.<br />
12 Van der Werf et al. 2009<br />
2,530<br />
45<br />
100<br />
145<br />
220<br />
440<br />
770 890 970<br />
2005<br />
4.97%<br />
370<br />
730<br />
2020<br />
30<br />
Share of global emissions<br />
1 Includes only direct emissions from each sector<br />
2 Emissions from LULUCF are based on a net emission approach i.e., including absorption<br />
SOURCE: Indonesia GHG Abatement Cost Curve<br />
3,260<br />
75<br />
40<br />
105<br />
150<br />
810<br />
670<br />
2030<br />
5.07%<br />
Buildings<br />
Cement<br />
Petroleum and <strong>gas</strong><br />
Agriculture<br />
Transport<br />
Power<br />
LULUCF 2<br />
Peat<br />
Exhibit 2
12<br />
IndonesIa’s <strong>greenhouse</strong> <strong>gas</strong> <strong>abatement</strong> <strong>cost</strong> <strong>curve</strong><br />
Exhibit 3<br />
Emissions from peatland are a unique challenge for Indonesia as they<br />
account for 58% of global emissions from peat decomposition<br />
Breakdown of global peatland area by surface and corresponding CO 2 emissions<br />
Percent<br />
Area<br />
CO 2 emissions<br />
from decomposition<br />
SOURCE: Hooijer et al 2006; Wetlands International<br />
5 5 90<br />
additionally, the power and transportation sectors are likely to gain increasing significance in the future<br />
if current trends continue. these sectors contribute relatively low emissions today, but emissions are<br />
expected to rise sharply by 2030. our estimates put Indonesia’s power and transportation emissions at 110<br />
and 70 mtco 2 e, respectively in 2005, but these are each expected to rise seven-fold over the 25-year period<br />
leading up to 2030. If approaches to low-carbon infrastructure development are not identified quickly, there<br />
is an added challenge of a lock-in effect, leaving little opportunity for implementing low-carbon alternative<br />
solutions for the next 30 to 40 years.<br />
Large emission reductions possible with investment<br />
Indonesia could potentially provide up to 2.3 gtco e of <strong>greenhouse</strong> <strong>gas</strong> <strong>abatement</strong> by 2030 (that is, 7 percent<br />
2<br />
of required global emission reductions) 13 through implementing over 90 <strong>abatement</strong> opportunities14 across<br />
eight major sectors: LuLucf, peatland, cement, power, petroleum and <strong>gas</strong>, agriculture, transportation, and<br />
buildings (exhibit 4).<br />
unlike most countries and reflecting Indonesia’s unique emissions profile, over 75 percent of the opportunity<br />
lies in LuLucf and peat (exhibit 5).<br />
as noted, the average <strong>cost</strong> of emission reductions in Indonesia is relatively low compared to most developed<br />
country options, at around 2 usd per tco 2 e in 2030. (this <strong>cost</strong> estimate reflects a technical assessment only;<br />
it does not include implementation and transaction <strong>cost</strong>s, which for some <strong>abatement</strong> opportunities are likely<br />
to be significant.) this means that underwriting <strong>abatement</strong> opportunities in Indonesia may be economically<br />
appealing to developed countries.<br />
13 the global community is to meet the 450-500 ppm target described above<br />
14 See „How to read the <strong>greenhouse</strong> <strong>gas</strong> <strong>abatement</strong> <strong>cost</strong> <strong>curve</strong>“<br />
58<br />
Indonesia Other tropical<br />
countries 1<br />
24 18<br />
Rest of<br />
the World 2<br />
100%<br />
▪ 5% of global and 50% of tropical peatlands are located in Indonesia<br />
▪ Tropical peat has a share of more than 80% of emissions from peat decomposition<br />
▪ Indonesia’s share of total emissions from peat decomposition is 60% or 12 times more<br />
than share of area<br />
1 Papua New Guinea, Brazil, Peru, Sudan, Malaysia<br />
2 Canada, Russia, Scandinavia, USA
IndonesIa’s <strong>greenhouse</strong> <strong>gas</strong> <strong>abatement</strong> <strong>cost</strong> <strong>curve</strong> 13<br />
Indonesia has the potential to reduce CO2 emissions by up to 2.3 Gt per by<br />
2030<br />
Societal perspective 1 , 2030<br />
60<br />
Reduction potential<br />
-200<br />
2<br />
Reduction <strong>cost</strong><br />
80<br />
20<br />
0<br />
-80<br />
MtCO2e per year<br />
2<br />
USD per tCO2e Fire<br />
prevention<br />
40<br />
Large hydro<br />
Sustainable Forest<br />
Management<br />
REDD –<br />
Peatland REDD –<br />
smallholder<br />
rehabilitation timber<br />
agriculture<br />
extraction<br />
REDD – timber<br />
plantation<br />
Geothermal<br />
-20 0 200 400 600 800 1,000 1,200 1,400 1,600 1,800 2,000 2,200<br />
-40<br />
-60<br />
-100<br />
-120<br />
High efficiency appliances<br />
-140<br />
-160<br />
-180<br />
-220<br />
-240<br />
-260<br />
Switching to LEDs<br />
Internal combustion<br />
engine improvements in<br />
passenger cars<br />
Includes over 90 reduction<br />
opportunities from Forestry, Peat<br />
Agriculture, Power, Transportation,<br />
Petroleum and Refining Buildings<br />
and Cement sectors<br />
1 Societal perspective implies utilizing a 4% discount rate<br />
2. The width of each bar represents the volume of potential reduction. The height of each bar represents the <strong>cost</strong> to capture each reduction initiative<br />
SOURCE: Indonesia GHG Abatement Cost Curve<br />
Indonesia’s reduction potential is concentrated largely in the forestry<br />
and peat sectors<br />
Reduction potential<br />
MtCO 2 e / year<br />
LULUCF 1,204<br />
Peat<br />
Power 1<br />
Agriculture<br />
Transport<br />
Petroleum & Gas<br />
Buildings<br />
Cement<br />
43<br />
13<br />
106<br />
87<br />
61<br />
225<br />
566<br />
1 Exclusive of demand side reductions from other sectors<br />
SOURCE: Indonesia GHG Abatement Cost Curve<br />
Average reduction <strong>cost</strong><br />
USD / MtCO 2 e<br />
-126<br />
-60<br />
-14<br />
0<br />
1<br />
5<br />
11<br />
23<br />
Ø 2<br />
Exhibit 4<br />
Exhibit 5
14<br />
IndonesIa’s <strong>greenhouse</strong> <strong>gas</strong> <strong>abatement</strong> <strong>cost</strong> <strong>curve</strong><br />
emIssIons scenarIos and<br />
<strong>abatement</strong> oPPortunItIes<br />
bY sector<br />
the dnPI’s ghg <strong>abatement</strong> <strong>cost</strong> <strong>curve</strong> study for Indonesia involved in-depth research into eight sectors –<br />
LuLucf, peatland, agriculture, power, transportation, petroleum and <strong>gas</strong>, cement, and buildings – which<br />
currently represent the majority of Indonesia’s total emissions. the findings described in this section are<br />
based on our ongoing analysis, which continues to be refined and updated.<br />
several challenges to the analysis persist. for example, access and availability to national-level data with<br />
regional breakdowns was limited in the LuLucf, peat, and agricultural sector analyses. furthermore, the<br />
science and methodology behind peat emission calculations is still at a relatively early stage. such challenges<br />
are further articulated within each sector description that follows.<br />
for each of the sectors, we have developed both business-as-usual and <strong>abatement</strong> scenarios. these<br />
have taken into account, amongst others, government and industry perspectives on how the sector would<br />
develop (a) should no major policy or regulatory changes take place between now and 2030 and (b) should<br />
identified <strong>abatement</strong> opportunities within each sector be taken up fully.<br />
this work has involved extensive stakeholder interactions and workshops.<br />
Peat<br />
2030 – emissions: 972 MtCO 2 e, <strong>abatement</strong> potential: 566 MtCO 2 e<br />
While in the past emissions from deforestation and forest degradation have received the vast proportion of<br />
climate-focused attention, both domestically and internationally, carbon emissions from Indonesian peat 15<br />
reserves are even more significant. 16 only very recently has there been a broad recognition of the importance<br />
of peatland emissions, and while the science is still at a relatively early stage it has improved significantly in<br />
recent years. 17 the importance of peat as a source of carbon emissions has gained greater acceptance<br />
globally. exhibit 6 captures the difference between this dnPI report and various estimates published by<br />
other government agencies, multilateral organizations, and non-governmental organizations.<br />
Sectoral emissions<br />
Peatlands store a massive amount of carbon in the form of organic matter accumulated in waterlogged soils.<br />
the release of carbon from tropical peatlands represents a unique and predominantly Indonesian challenge<br />
as Indonesia holds approximately 50 percent of the total tropical peat area. emissions from peatland today<br />
represent 38 percent of Indonesia’s total emissions and will continue to remain a dominant portion in 2030<br />
(at 30 percent) if no major action is taken.<br />
under the business-as-usual scenario, emissions from peatland are expected to increase by 20 percent<br />
from 772 mtco 2 e in 2005 to 972 mtco 2 e in 2030 (exhibit 7).<br />
15 A more detailed description of peat and its relevance to carbon emissions is included in the appendix<br />
16 Indonesia’s peatland represents 5 percent of global and 50 percent of tropical peat. It is storing 132 GtCO2e below ground and<br />
a further 4.2 GtC above ground, a value comparable to the Amazon rainforest, which is the single largest ecological carbon sink<br />
in the world, at 46 GtC (or 168 GtCO2e)<br />
17 A description of the most important scientific uncertainties is included as an appendix
Estimates for annual GHG emissions differ between<br />
sources<br />
MtCO2e, 2005<br />
IFCA<br />
SNC 2009<br />
Worldbank 1<br />
CAIT-WRI<br />
Hooijer<br />
Wetlands Int.<br />
Van der Werft<br />
CIFOR<br />
DNPI<br />
LULUCF<br />
N/A<br />
N/A<br />
N/A<br />
290<br />
496<br />
538<br />
528<br />
838<br />
1,138<br />
1 Using IFCA, WRI and Hooijer et al. 2006 as main sources<br />
Peat fires<br />
30<br />
N/A<br />
0<br />
451<br />
470<br />
470<br />
SOURCE: IFCA; Ministry of Forestry Indonesia; Houghton; Worldbank; CAIT – WRI; Hooijer 2006; SNC 2009, Indonesia GHG Emission Cost Curve<br />
1,260<br />
1,260<br />
1,271<br />
N/A<br />
N/A<br />
N/A<br />
300<br />
IndonesIa’s <strong>greenhouse</strong> <strong>gas</strong> <strong>abatement</strong> <strong>cost</strong> <strong>curve</strong> 15<br />
Peat decomposition Total<br />
379<br />
500<br />
600<br />
600<br />
600<br />
LULUCF<br />
Peatland<br />
N/A Documented numbers do not exist<br />
30<br />
526<br />
496<br />
290 830<br />
538 1,860<br />
500<br />
470<br />
528 1,870<br />
743 848<br />
1,120<br />
1,138<br />
1,800<br />
1,591<br />
2,398<br />
2,398<br />
Hooijer et al 2006 as a baseline and<br />
taking into account that 50% of<br />
emissions might be caused by<br />
soil/roots respiration<br />
Emissions from peat fire and peat decomposition are expected<br />
to increase by 200 Mt in a business-as-usual scenario<br />
Projected emissions,<br />
Million tons CO2e 1,000<br />
900<br />
800<br />
700<br />
600<br />
500<br />
400<br />
300<br />
200<br />
100<br />
0<br />
772<br />
472<br />
300<br />
2005<br />
902<br />
532<br />
370<br />
2020<br />
2030<br />
SOURCE: Hooijer et al 2006- PEAT CO2e; Alterra; Wetlands International; Expert interviews; Couwenberg et al 2009; Van der Werft et al 2008<br />
972<br />
577<br />
395<br />
Peat fire<br />
Peat decomposition<br />
▪ Emissions from<br />
peatland are going to<br />
increase in a businessas-usual<br />
scenario as it<br />
is expected that large<br />
areas will be converted<br />
to other land-uses<br />
going forward<br />
▪ Emissions from<br />
peatland, especially<br />
from peat fire, are<br />
highly dependent on<br />
weather conditions and<br />
can show large<br />
fluctuations from year<br />
to year<br />
Exhibit 6<br />
Exhibit 7
16<br />
IndonesIa’s <strong>greenhouse</strong> <strong>gas</strong> <strong>abatement</strong> <strong>cost</strong> <strong>curve</strong><br />
fires are the main sources of peat related emissions. In 2005, fires accounted for 472 mtco 2 e, more than<br />
60 percent of all peatland related emissions. decomposition of peatland as a consequence of drainage<br />
is the second largest source of peat related emissions, accounting for another 300 mtco 2 e. as peatland<br />
forest are converted to another land use, the removal of the aboveground biomass during land clearing and<br />
timber extraction during logging of production forests (hPh) result in further co 2 e emissions; to avoid double<br />
counting, these emissions are accounted for in the LuLucf sector.<br />
Peat fires<br />
emissions related to peat fires will increase from approximately 470 mtco e per year at present to nearly 580<br />
2<br />
mtco e in 2030, as the total share of degraded peatland at high risk to fire increases if peatland conversions<br />
2<br />
are not stopped and if fire is continued to be used as the main tool for land preparation and fertilization by<br />
smallholders. It should be noted that the year-to-year emissions from peat fires tend to fluctuate significantly,<br />
as they are heavily correlated with annual rainfall, the groundwater table, and the extent of the dry season.<br />
the estimates for peatland fires are based on an analysis of 2000–2006 emissions from peat fires by van der<br />
Werf et al. (2008) as well as the future projected development of degraded land areas and the share of different<br />
land types as described by hooijer et al. (2006). the estimates are based on the same publication from van<br />
der Werf as used by Indonesia’s ministry of environment in Indonesia’s second national communication.<br />
When compared to estimates published by other scientists (e.g., Page et al. (2002)), estimates for peat fire<br />
based on the van der Werf data can be considered to be conservative.<br />
there should be no doubt that emissions from fires on degraded peatland will continue to be a major<br />
contributor to emissions, pending strong action. Indeed emissions from peat fires could easily range higher<br />
than the estimates used here.<br />
Decomposition<br />
emissions from decomposition will continue to grow by 30 percent from 300 mtco e in 2005 to approximately<br />
2<br />
395 mtco e in 2030, due to the combination of emissions from already drained peatland and due to the<br />
2<br />
fresh conversion and drainage of peatland for plantations (e.g., pulpwood and oil palm plantations) and<br />
smallholder agriculture. drainage accelerates the rate of soil decomposition, as significantly larger volumes<br />
of peat soil are exposed to oxygen and hence made susceptible to further oxidation.<br />
It is only in recent years, as more peatlands have been cleared, that land managers and scientists have come<br />
to understand how peat soils behave as they dry out. Peat soils subside dramatically due to compaction,<br />
shrinkage, and decomposition, and this can result in a loss of the fertile surface layers. at the same time, the<br />
drying out of the surface layers results in a growing vulnerability to hard-to-manage peat fires.<br />
our estimates of carbon emissions from peat decomposition are based on an analysis of historically drained<br />
peat areas and their expected future conversion into different land uses. emissions from soil decomposition<br />
are assumed to depend on drainage depth. estimates are derived from measures of decomposition for<br />
different levels of drainage (for different land uses) combined with the area of degraded land and the number<br />
of years of decomposition after the initial drainage. one key uncertainty is that soil and root respiration make<br />
up somewhere between 40 and 60 percent of measured carbon flux between soil and atmospheric carbon,<br />
as a result of soil and biomass respiration and carbon uptake during photosynthesis, as recently described<br />
in couwenberg et al. (2009). measurements of carbon flux from soil decomposition, using changes in soil<br />
mass and carbon composition, are not subject to this uncertainty, but few such studies with comparable<br />
measurement methods have been published.<br />
the emission levels used here were calculated using Wösten’s linear peat drainage emission model (which<br />
predicts emission patterns for different drainage depths) and average drainage depths of different land uses<br />
provided by hooijer et al. 2006. hooijer et al. 2006 synthesizes the direct observations of drained peatlands<br />
made by different scientists in different areas of Indonesia, Papua new guinea, malaysia, and brunei. It<br />
includes estimates for decomposition of peat soils in secondary forests, palm oil plantations, and agricultural<br />
areas planted with other crops affected by drainage.
IndonesIa’s <strong>greenhouse</strong> <strong>gas</strong> <strong>abatement</strong> <strong>cost</strong> <strong>curve</strong> 17<br />
estimates of emissions from peat decomposition remain subject to revision, as further scientific work is<br />
done. many potentially useful research efforts to tackle open issues were started only recently. the results of<br />
these efforts, expected to be published in the coming two to three years, might change the current view of the<br />
extent of peat decomposition. given this uncertainty, estimates used here are conservative relative to other<br />
widely cited estimates.<br />
Abatement potential and <strong>cost</strong><br />
the Indonesian government has already begun to address peat emission through a decree that prohibits<br />
land conversion of peat which is more than three meters deep. In addition to this, several opportunities<br />
exist for reducing emissions at a relatively modest <strong>cost</strong>. a total of 566 mtco e of <strong>abatement</strong> opportunity<br />
2<br />
exists in the peat sector across several levers, including fire prevention, peatland rehabilitation, but also<br />
water management in existing timber plantations and oil palm plantations or more generally in areas under<br />
agricultural use (exhibit 8).<br />
566 Mt of CO2e could be abated by fire prevention, water management and<br />
rehabilitation of degraded peatland<br />
Societal perspective; 2030<br />
Abatement <strong>cost</strong><br />
USD per tCO2e 10<br />
Total emissions from peat by 2030<br />
9 in the business-as-usual<br />
trajectory is 970 Mt CO2e<br />
8<br />
7<br />
6<br />
5<br />
4<br />
3<br />
2<br />
1<br />
0<br />
0<br />
0.35<br />
SOURCE: Indonesia GHG Abatement Cost Curve<br />
Fire prevention<br />
Water management<br />
0.85<br />
Peatland rehabilitation<br />
100 200<br />
300 400 500<br />
600<br />
Abatement potential<br />
MtCO2e per year<br />
Fire prevention<br />
fire prevention is the largest <strong>abatement</strong> opportunity and could prevent nearly 320 mtco e in 2030. necessary<br />
2<br />
actions to reduce emissions from peat fires include prohibiting fire as a tool for land preparation, providing<br />
appropriate and practical technologies (and, if appropriate, financial incentives) for manual land clearing,<br />
developing appropriate early-warning systems based on fire risk status and field-based fire detection,<br />
strengthening fire brigades, ensuring strong enforcement and large penalties for rule violations, and building<br />
public awareness of the local economic and social <strong>cost</strong>s of forest fires. besides the reduction of emissions,<br />
fire prevention will have additional positive effects on the health of the local population as well as on the overall<br />
economy of Indonesia through, e.g., the avoidance of airport closures and haze-related transportation<br />
delays. fire prevention can be done as discrete activities, however it will be more successful and sustainable<br />
if the main source of fires, the degraded peatlands, are rehabilitated in parallel.<br />
<strong>cost</strong> for fire prevention is relatively small, averaging at 0.35 usd per tco 2 e if the implemented actions focus<br />
primarily on the historical fire hotspots. If the prevention of fire-caused economic losses, e.g. haze-related<br />
transportation delays, loss of agricultural crops and loss of valuable timber, would be taken into account as<br />
5.21<br />
Exhibit 8
18<br />
IndonesIa’s <strong>greenhouse</strong> <strong>gas</strong> <strong>abatement</strong> <strong>cost</strong> <strong>curve</strong><br />
well, societal <strong>cost</strong> for fire prevention could be negative, as these economic losses can be significant. the<br />
World resource Institute estimated the direct economic loss of the 1997/98 fires at more than 5 billion usd.<br />
It should be noted that the technical potential for emissions reductions due to peat fire prevention could be as<br />
high as 580 mt co 2 e. however, it would require massive investments in infrastructure to be able to attack or<br />
suppress all fires across the breadth of Indonesia. as a result, we have assumed a more conservative figure<br />
in this analysis.<br />
Peatland rehabilitation<br />
the rehabilitation of Indonesia’s degraded peatland, e.g., areas within the ex-mega rice Project in central<br />
Kalimantan, is the second largest <strong>abatement</strong> opportunity of peat emissions. Peatland rehabilitation combines<br />
the restoration of the hydrological functions of the peat and the replanting with native species.<br />
While the restoration of the hydrological functions of the peat by blocking drainage channels is relatively cheap<br />
at a <strong>cost</strong> below 1 usd per abated tco 2 e, replanting degraded peatlands is relatively expensive with <strong>cost</strong>s<br />
between 500 to 1,100 usd per ha or 3 to 5 usd per t of sequestred co 2 e. fostering natural regeneration of<br />
existing tree cover could reduce the replanting <strong>cost</strong>s significantly and should be applied wherever possible.<br />
Water management<br />
Installing a dam-based water management system in timber and estate crops plantations located on peatland<br />
is another powerful tool to reduce emissions. there is a technical <strong>abatement</strong> potential of 90 mtco e by 2030.<br />
2<br />
Water management is relatively cheap, with an associated <strong>cost</strong> below 1 usd per abated tco 2 e. In addition,<br />
water management can help to reduce the risk of flooding in the wet season and prevent the risk of drought<br />
in the dry season.<br />
Land use, Land-use change, and forestrY (LuLucf)<br />
2030 – Net emissions: 666 MtCO 2 e, <strong>abatement</strong> potential: 1,204 MtCO 2 e<br />
With over 100 million hectares of tropical forest, Indonesia is home to the world’s third largest tropical forest<br />
– rich in biodiversity and with total carbon storage of 15 gt above ground, which is equivalent to 60 gtco 2 e if<br />
completely emitted.<br />
deforestation peaked in Indonesia in the late 1990s, at a rate of more than 1.8 million ha annually, and<br />
has significantly decreased since then, averaging roughly 1.1 million ha annually between 2000 and 2005.<br />
however, the increasing global demand for pulp and paper and palm oil together with a growing domestic<br />
demand for food crops is expected to result in the conversion of an additional 21–28 million ha of currently<br />
forested land by 2030 (exhibit 9) in a business-as-usual scenario. much of that additional land is likely to be<br />
made available through deforestation of conversion forest (hutan produksi yang dapat di konversi, hPK);<br />
the shift of production forests (hutan produks tetap, hPh) to conversion forests because of high rates of<br />
degradation (due to poor logging practices); and from conversion of forests located outside the forest estate<br />
(kawasan hutan).<br />
given that Java and sumatra have already lost large parts of their original forest areas, it is expected that<br />
deforestation will shift to other, still largely forested islands such as parts of Kalimantan and especially Papua.<br />
Sectoral emissions<br />
net emissions from LuLucf account for over 35 percent of total carbon emissions in Indonesia, at 745 mtco e 2<br />
in 2005, and are expected to remain significant even if LuLucf-related net emissions decrease to 570 mtco e; 2<br />
its relative share will sink to 18 percent in 2030 (exhibit 10). however, annual gross emissions are likely to remain<br />
at a high level of more than 1,080 mtco e.<br />
2
Deforestation is expected to remain constant driven by conversion to<br />
intensive plantations and croplands<br />
Total forest area loss and drivers until 2030<br />
Million ha<br />
6 to 8<br />
Pulpwood<br />
plantation<br />
5 to 7<br />
Palm oil<br />
plantation<br />
10 to 13<br />
Croplands<br />
21 to 28<br />
Total forest area<br />
loss<br />
IndonesIa’s <strong>greenhouse</strong> <strong>gas</strong> <strong>abatement</strong> <strong>cost</strong> <strong>curve</strong> 19<br />
Low range estimate<br />
High range estimate<br />
▪ Government plans for<br />
increasing pulp and palm<br />
oil production will require<br />
11-15 million ha of currently<br />
forest covered areas to be<br />
converted<br />
▪ To feed and support the<br />
growing population another<br />
10-13 million ha are<br />
required for croplands<br />
▪ General increasing demand<br />
for wood products in<br />
construction and bioenergy<br />
might lead to even larger<br />
areas required<br />
SOURCE: RISI; EMGE; Government of Indonesia; A Rante Tondak DG Estate Crops , Min of Agri, Proceedings of the World Conference on Palm and<br />
Coconut Oils for the 21st Century, American Oil Chemist Society, Leonard Perkins and Cahn edts, 1999; Indonesia GHG Abatement Cost Curve<br />
Net emissions from the forest sector are expected to constantly decrease<br />
throughout the reporting period but gross emissions will remain constant<br />
Projected emissions1 ,<br />
Million tons CO2e 1,100<br />
1,084<br />
1,000<br />
900<br />
800<br />
700<br />
600<br />
500<br />
400<br />
300<br />
200<br />
100<br />
0<br />
246<br />
838<br />
2005<br />
1 Net emissions include absorption in secondary forests, timber and estate crops plantations and initiated reforestation programs<br />
SOURCE: DNPI - Indonesia GHG Abatement Cost Curve<br />
1,084<br />
356<br />
728<br />
2020<br />
1,084<br />
416<br />
668<br />
2030<br />
Gross emissions<br />
Net emissions<br />
▪ Gross emissions are<br />
expected to remain<br />
constant at nearly<br />
1,100 MtCO 2 e<br />
▪ Net emissions are<br />
expected to decrease<br />
by approximately 170<br />
MtCO 2 e by the<br />
increasing absorption<br />
potential of<br />
reforested areas but<br />
also through the<br />
expansion of timber<br />
and estate crops<br />
plantation<br />
Exhibit 9<br />
Exhibit 10
20<br />
IndonesIa’s <strong>greenhouse</strong> <strong>gas</strong> <strong>abatement</strong> <strong>cost</strong> <strong>curve</strong><br />
gross emissions from dry-land forests stem primarily from deforestation, forest degradation and forest fires.<br />
deforestation is caused by land conversion for (smallholder) agriculture, oil palm cultivation and pulpwood<br />
plantation but also illegal logging. deforestation is expected to remain constant at the current rate of 1.1 million<br />
ha annually resulting in around 750 mtco 2 e of gross emissions. forest degradation caused by non-sustainable<br />
logging activities in Indonesia’s production forests could on average account for another 250 mtco 2 e of gross<br />
emissions per year if current logging practices are not changed. forest fires are expected to contribute in<br />
average another 78 mt co 2 e annually going forward.<br />
Abatement potential and <strong>cost</strong><br />
the LuLucf sector’s potential to bring about emission reductions by 2030 is unique, in that the potential<br />
reductions significantly exceed business-as-usual emissions. this is due to the fact that conservationdedicated<br />
afforestation and reforestation efforts could effectively create a net carbon sink, capturing more<br />
carbon (called sequestered carbon) than would otherwise be emitted. Indeed, the total annual <strong>abatement</strong><br />
potential of the LuLucf sector is 1,204 mtco 2 e by 2030, of which halting deforestation and forest degradation<br />
would account for 811 mtco 2 e, afforestation and reforestation efforts could account for 280 mtco 2 e (exhibit<br />
11) and fire prevention for 43 mt co 2 e.<br />
Reduced emissions from deforestation and degradation (REDD)<br />
the <strong>abatement</strong> potential of redd is by far the largest of the LuLucf levers. We use the term redd as shorthand<br />
for the halting or prevention of emissions-causing activities in forested areas. redd represents a combined<br />
<strong>abatement</strong> opportunity of more than 570 mtco e, of which stopping forest conversion to smallholder agriculture<br />
2<br />
is the single largest opportunity at slightly more than 190 mtco e. as with the case of fire prevention, reduced<br />
2<br />
emissions from so-called “redd smallholder agriculture” could technically be as high as 300 mtco e. given<br />
2<br />
the large number, fragmentation and remoteness of many smallholder farmers in Indonesia, it seems unrealistic<br />
that the full potential could be reached until 2030 and so a discount of 40 percent was applied to the maximum<br />
technical potential reduction.<br />
opportunity <strong>cost</strong>s differ significantly between deforestation drivers, ranging from 1 usd to 29 usd per ton of<br />
avoided co 2 e (exhibit 12). avoided deforestation and degradation from smallholder agriculture has relatively<br />
Exhibit 11<br />
Avoiding deforestation,sustainable forest management, afforestation, and<br />
reforestation could turn the LULUCF sector into a net carbon sink by 2030<br />
Indonesia’s 2030 BAU gross emissions, <strong>abatement</strong> levers<br />
and emissions after <strong>abatement</strong><br />
MtCO 2 e<br />
763<br />
Deforestation<br />
243<br />
Degradation<br />
SOURCE: Indonesia GHG Abatement Cost Curve<br />
78<br />
Forest fire<br />
1,084<br />
Gross<br />
emissions<br />
574<br />
Avoid deforestation<br />
237<br />
Sust.<br />
Forest<br />
Mgmt.<br />
150<br />
Aforestation<br />
123<br />
Reforestation<br />
78<br />
Intensive<br />
Silviculture<br />
43<br />
Fire<br />
prevention<br />
Emissions<br />
Abatement<br />
-121<br />
-1,205<br />
Emissions<br />
after<br />
<strong>abatement</strong>
1,200 MtCO2e could be abated in 2030 by implementation of 9 different<br />
<strong>abatement</strong> levers<br />
Societal perspective; 2030<br />
Abatement <strong>cost</strong><br />
USD per tCO 2e<br />
50<br />
45<br />
40<br />
35<br />
30<br />
25<br />
20<br />
15<br />
10<br />
5<br />
0<br />
0<br />
Total net emissions from<br />
Forestry sector by 2030 in the<br />
business as usual trajectory is<br />
668 MtCO2e<br />
REDD – smallholder<br />
agriculture<br />
1<br />
100<br />
Sustainable Forest<br />
Management<br />
2<br />
5<br />
IndonesIa’s <strong>greenhouse</strong> <strong>gas</strong> <strong>abatement</strong> <strong>cost</strong> <strong>curve</strong> 21<br />
200 300 400 500 600 700 800 900 1,000 1,100 1,200 1,300<br />
Abatement potential<br />
MtCO2e per year<br />
Note: The <strong>curve</strong> presents an estimate of the maximum potential of all technical GHG <strong>abatement</strong> measures below EUR 60 per tCO2e if each lever was<br />
pursued aggressively. It is not a forecast of what role different <strong>abatement</strong> measures and technologies will play. Assuming a 4% societal discount rate<br />
SOURCE: Indonesia GHG Abatement Cost Curve<br />
Marginal land<br />
afforestation<br />
Fire<br />
prevention<br />
6<br />
Reforestation<br />
6<br />
10<br />
Intensive<br />
Silviculture<br />
10<br />
REDD –<br />
Intensive<br />
plantation -<br />
pulpwood<br />
low opportunity <strong>cost</strong>s, given the limited economic alternatives facing smallholder farmers in Indonesia.<br />
however, those <strong>cost</strong>s could significantly increase if transaction <strong>cost</strong>s are included due to the sheer size of<br />
Indonesia and the complexity of changing cultivation habits of tens of millions of smallholders. capturing the<br />
<strong>abatement</strong> potential from “redd smallholder agriculture” would require massive investments in agricultural<br />
extension services to enable rural communities to use already cleared lands more efficiently and with less<br />
carbon intensity.<br />
opportunity <strong>cost</strong>s for avoiding forest conversion into estate crops or timber plantations are high, reaching<br />
close to 30 usd per avoided tco 2 e, due to the high economic returns obtainable from crops such as palm oil<br />
and pulpwood. these <strong>cost</strong>s can be significantly reduced if those plantations can be established on already<br />
degraded or deforested areas, as the <strong>cost</strong>s then represent only forgone revenue from one-time timber<br />
extraction for the initial land clearing and possibly some additional input <strong>cost</strong>s or marginally lower yields.<br />
Prospects for this are good as several organizations (e.g., WrI) are trying to develop land swap systems,<br />
and the private sector is showing growing interest. however new spatial plans and an appropriate financial<br />
incentive system, e.g. carbon-based permit fees for new concessions, would be needed for making the use<br />
of degraded land a real opportunity at scale.<br />
Afforestation and reforestation<br />
afforestation and reforestation represent a sequestration opportunity of 300 mtco e by 2030 at a <strong>cost</strong> of<br />
2<br />
5 to 6 usd per avoided tco e. this implies (re-)establishing forests on more than 10 million ha of degraded<br />
2<br />
non-forested and forested land and would be in addition to the already established reforestation program<br />
(gerhan) of the ministry of forestry. realizing large sequestration volumes requires the set aside of these<br />
afforested and reforested areas for conservation. developing commercial timber and estate crop plantations<br />
as part of the reforestation program could help to reduce the pressure on remaining forest areas, but at the<br />
same time these activities will sharply reduce the <strong>abatement</strong> potential of reforested areas. this is because<br />
large volumes of co e would be emitted at the end of the plantations’ rotation period.<br />
2<br />
28<br />
REDD –<br />
Intensive<br />
plantation –<br />
palm oil<br />
29<br />
Exhibit 12
22<br />
IndonesIa’s <strong>greenhouse</strong> <strong>gas</strong> <strong>abatement</strong> <strong>cost</strong> <strong>curve</strong><br />
Sustainable forest management<br />
our estimates indicate that reducing emissions from the degradation of production forest (hPh) through<br />
a combination of better planning, reduced impact logging, and improved post-harvest management<br />
could deliver an emission reduction of more than 200 mtco e at a <strong>cost</strong> of slightly more than 2 usd per<br />
2<br />
tco e. current policies on timber extraction and cutting cycles in production forests are already based on<br />
2<br />
sustainability but do not consider nor calculate total biomass removed, which is typically many multiples of<br />
the merchantable timber. In addition, further loss of carbon stock can occur for several years after logging if<br />
conditions are not conducive for quick forest regeneration.<br />
activities to reduce emissions from timber extraction include the construction of an adequate network<br />
of forest roads and skidding trails to minimize skidding damage, the employment of modern harvesting<br />
equipment, and the use of a geographical information system to make harvesting as focused as possible.<br />
the alternative – stopping logging altogether – would have the same effect on emission reduction, but has a<br />
much higher opportunity <strong>cost</strong> and would not allow Indonesia to further develop its forest products industry.<br />
Intensive silviculture<br />
Intensive silviculture should be considered as an additional activity to increase the growth rates (and therefore<br />
the sequestration rates) of Indonesia’s production forests. Intensive silviculture is based on broadening<br />
silvicultural activities from their current limited application. typical activities include enrichment planting,<br />
thinning between the cycles, and also fertilization, improved seedlings, and better breeding techniques.<br />
Intensive silviculture is relatively expensive at close to 10 usd per t of additional sequestered co e, but 2<br />
represents an <strong>abatement</strong> opportunity of nearly 100 mtco e annually. In addition, the application of intensive<br />
2<br />
silviculture represents significant employment opportunities for forest communities, e.g., plant nurseries.<br />
Prevention of forest fire<br />
fire prevention outside peatland is a significant emission reduction opportunity as well and could prevent<br />
43 mtco e in 2030. necessary actions to reduce emissions from forest fires include prohibiting fire as a<br />
2<br />
tool for land preparation, providing appropriate and practical technologies (and, if appropriate, financial<br />
incentives) for manual land clearing, developing appropriate early-warning systems based on fire risk status<br />
and field-based fire detection, strengthening fire brigades, ensuring strong enforcement and large penalties<br />
for rule violations, and building public awareness of the local economic and social <strong>cost</strong>s of forest fires.<br />
the <strong>cost</strong> to reduce emissions from fire prevention in forests outside the peatland is relatively high at more<br />
than 5 usd per ton of abated co 2 e. the high <strong>cost</strong>s are caused by the fact the forest fires are scattered<br />
across a much larger land area than peat fires.<br />
Methodology<br />
the estimated annual rate of deforestation and gross emissions used in this analysis is 1.1 million ha, which is<br />
based on the historical deforestation rate in 2000–2005 provided by the ministry of forestry. approximately<br />
75 percent (or 0.8 million ha) of the total deforested area is expected to occur on dry-land forests and the<br />
remaining 25 percent in peatland forest areas. 18 We assume that the carbon density of Indonesian forests<br />
cleared in the future will remain the same as that of forests cleared over the last five years, which is 192 tc/<br />
ha. 19 Land use assumptions were cross-checked with projections for additional land demand for pulpwood<br />
and palm oil plantations, 20 and to meet increasing domestic demand for agricultural products. 21 together the<br />
datasets suggest a total need for additional forest land of 21–28 million ha by 2030.<br />
18 As described by Hooijer et al. (2006)<br />
19 IFCA 2008<br />
20 IFCA 2008, RISI 2009, NLK 2009<br />
21 Tondak (1999)
IndonesIa’s <strong>greenhouse</strong> <strong>gas</strong> <strong>abatement</strong> <strong>cost</strong> <strong>curve</strong> 23<br />
net emissions from the LuLucf sector are calculated by taking the absorption potential of Indonesia’s<br />
existing natural forests (with the exception of primary, non-managed forests, as suggested by IPcc 22 ) and<br />
also man-made forests (e.g., palm oil plantations) into account as long as those meet the forest definition of<br />
the Indonesian government 23 as described in the Ifca report (exhibit 13).<br />
Net emissions are calculated by taking absorption of natural<br />
forest and plantations into account<br />
Indonesia’s emissions from deforestation and forest<br />
degradation and absorption 2030<br />
Million tons CO 2 e<br />
764<br />
243<br />
1,007<br />
SOURCE: Min. of Forestry – Rekalkulasi Penutupan Lahan Indonesia Tahun 2008; Forestry Statistics 2007; Sheil et al.<br />
2009; Burschel et al. 2001; Indonesia GHG Emission Cost Curve, Indonesia – 2 nd National Communication<br />
the calculation of the absorption in the forest types described above is based on assumptions for annual<br />
growth rates, carbon content per cubic meter of biomass, future area development, and crop rotation period.<br />
the rotation period is a critical element of the calculation, as large parts of the sequestered carbon will be<br />
released at the end of the rotation period, reducing the annual absorption rate significantly. this is especially<br />
true for short-rotation pulpwood plantations, which are therefore not an ideal tool to increase the carbon sink<br />
of Indonesian forests in the long term.<br />
agrIcuLture<br />
127<br />
DeDe- Gross Seq.<br />
forestationgradation<br />
emissionsnatural<br />
forest 1<br />
2030 – emissions: 164 MtCO 2 e, <strong>abatement</strong> potential: 105 MtCO 2 e<br />
25<br />
Seq.<br />
timber<br />
235<br />
Seq.<br />
Gerhan2 plantation3 PRELIMINARY<br />
▪ Absorption in natural<br />
secondary forests is<br />
decreasing as a<br />
consequence of area<br />
reduction and<br />
degradation<br />
▪ Absorption in<br />
plantations and<br />
reforestation projects<br />
are likely to increase<br />
steadily until 2030,<br />
however as soon as<br />
those areas will reach<br />
the end of their rotation<br />
cycle e.g. oil palm after<br />
25 years the absorption<br />
potential will decrease<br />
and net emissions<br />
increase<br />
1 Annual increment of 4m 3 per ha or 4.4 t CO2e/ha per year in Indonesia secondary forest<br />
2 400,000 ha land rehabilitated inside and outside forest annually between 2003 and 2007; sequestration of 18.3 t CO2e/ha/year, rotation period 35 years<br />
3 271,000 ha of new established timber plantation, sequestration of 29.3 t CO2e/ha/year; rotation period of 10 years<br />
4 434,000 ha of new established estate crops plantations, sequestration of 5.1 t CO2e/ ha/year; rotation period of 30 years<br />
49<br />
Seq.<br />
Estate<br />
crops 4<br />
agricultural carbon emissions are mostly not carbon dioxide, but other ghgs like methane and nitrogen<br />
oxide. such emissions come from three major sources: water management practices for rice crops, artificial<br />
fertilizer application, and the burning of crop residues.<br />
Sectoral emissions<br />
agriculture is Indonesia’s third-highest emitting sector, behind LuLucf and peat, with emissions of 132 mtco e 2<br />
in 2005 (based on land use at the time). emissions from this sector are expected to grow by 25 percent to<br />
164 mtco e in 2030 (exhibit 14).<br />
2<br />
22 IPCC – Good Practice Guidance for Land Use, Land-Use Change, and Forestry<br />
23 Forests are described as non-annual plants reaching a height of minimum 5 m and with a crown cover of more than 30 percent<br />
of a defined area, normally one hectare<br />
571<br />
Net<br />
Emissions<br />
Exhibit 13
24<br />
IndonesIa’s <strong>greenhouse</strong> <strong>gas</strong> <strong>abatement</strong> <strong>cost</strong> <strong>curve</strong><br />
Exhibit 14<br />
In a business as usual trajectory emissions from agriculture are expected<br />
to grow from 132 to 164 Mt CO 2 e by 2030 Soil N2O<br />
Projected emissions from<br />
agriculture in Indonesia<br />
Million tons CO 2 e<br />
180<br />
160<br />
140<br />
120<br />
100<br />
80<br />
60<br />
40<br />
20<br />
SOURCE: EPA; Indonesia GHG Abatement Cost Curve<br />
Abatement potential and <strong>cost</strong><br />
0<br />
132<br />
2005<br />
151<br />
2020<br />
the <strong>abatement</strong> potential for this sector is estimated to be approximately 105 mtco 2 e per year or approximately<br />
63 percent of the sector’s emissions by 2030 (exhibit 15).<br />
Improving the management of water and nutrients for rice farming offers significant <strong>abatement</strong> potential of<br />
45 mtco 2 e or 43 percent of the sector’s emissions. rice water management involves mid-season and<br />
shallow flooding drainage to avoid anaerobic conditions, which otherwise lead to significant methane<br />
emissions. nutrient management refers to a shift from nitrogen based fertilizers to sulfate fertilizers.<br />
a third of the sector’s <strong>abatement</strong> opportunity comes from the restoration of degraded land (i.e., agricultural<br />
land degraded through excessive disturbance, erosion, organic matter loss, salinization or acidification),<br />
which would account for emission reductions of 35 mtco 2 e. typical <strong>abatement</strong> activities include re-vegetation<br />
(e.g., planting grasses), improving fertility by nutrient amendments, applying organic substrates such as<br />
manures, biosolids, and composts, reducing tillage and retaining crop residues.<br />
the average <strong>abatement</strong> <strong>cost</strong> in the agriculture sector is 5 usd per tco 2 e. the restoration of degraded land<br />
through the creation of a carbon sink (building up organic matter within the soil) comes at a <strong>cost</strong> of 13.8<br />
usd per tco 2 e, while improving rice water management and rice nutrient management has a <strong>cost</strong> of -7 and<br />
21.7 usd per tco 2 e per year respectively. the improving nutrient management lever is expensive because of<br />
the significantly higher prices of non-nitrogen based fertilizers, e.g. phosphor- or sulfate based fertilizers such<br />
as diammonium phosphate, which are up to 30 percent more expensive than nitrogen-based fertilizers.<br />
the greatest implementation challenge in the agricultural sector is geography and the fragmentation of<br />
stakeholders, as these <strong>abatement</strong> programs would have to be implemented across a vast number of<br />
Indonesia’s mostly smallholder farmers. this would require extensive investment in educational programs<br />
to change entrenched farming practices. transaction <strong>cost</strong>s for these <strong>abatement</strong> levers are not yet well<br />
understood in Indonesia.<br />
164<br />
2030<br />
Rice CH4<br />
Livestock<br />
Other<br />
▪ Agricultural area is expected to<br />
increase by 10 to 13 million ha<br />
until 2030 with the majority<br />
expected to have significant<br />
forest cover<br />
▪ Emissions from livestock are<br />
expected to rise from 25 Mt<br />
CO 2 e to 39 Mt CO 2 e in 2030<br />
being responsible for more<br />
than 50 percent of additional<br />
emissions<br />
▪ 2 nd largest increase is<br />
expected to come from rice<br />
cultivation, rising by 14 Mt<br />
CO 2 e until 2030
105 Mt CO2e could be abated by improving water management in rice<br />
cultivation and the restoration of degraded land<br />
Societal perspective; 2030<br />
PoWer<br />
2030 – emissions: 810 MtCO 2 e, <strong>abatement</strong> potential: 225 MtCO 2 e<br />
IndonesIa’s <strong>greenhouse</strong> <strong>gas</strong> <strong>abatement</strong> <strong>cost</strong> <strong>curve</strong> 25<br />
Abatement <strong>cost</strong><br />
USD per tCO2e 80<br />
Total emissions from Agriculture<br />
sector by 2030 in the business as<br />
usual trajectory is 164 MtCO2e Livestock – feed<br />
supplement<br />
70<br />
60<br />
50<br />
40<br />
30<br />
20<br />
Cropland<br />
nutrient<br />
management<br />
Livestock –<br />
Antimethanogen<br />
vaccine<br />
Degraded land<br />
management<br />
Nutrient<br />
management –<br />
rice cultivation<br />
10<br />
0<br />
Ø 5<br />
-10 0 5 10 15 20 25 30 35 40 45 50 55 60 65 70 75 80 85 90 95 100 105 110<br />
-20<br />
Abatement potential<br />
-30<br />
MtCO2e per year<br />
-40<br />
-50<br />
-60<br />
-70<br />
Water<br />
management –<br />
rice cultivation<br />
Grassland<br />
management<br />
Agronomy<br />
practices<br />
Residue management practices<br />
Note:<br />
The <strong>curve</strong> presents an estimate of the maximum potential of all technical GHG <strong>abatement</strong> measures below EUR 60 per tCO2e if each lever was<br />
pursued aggressively. It is not a forecast of what role different <strong>abatement</strong> measures and technologies will play. Assuming a 4% societal discount rate<br />
SOURCE: Indonesia GHG Abatement Cost Curve<br />
Exhibit 15<br />
demand for power is expected to rise by eight times from 2005 to 2030 – driven by rapid economic<br />
development, increased electrification of rural Indonesia (from 60 percent of households today to 100 percent<br />
by 2020), fast growth of manufacturing and services, and the expected realization of latent and suppressed<br />
demand for power.<br />
Sectoral emissions<br />
Indonesia’s emissions from the power sector are expected to grow seven-fold from 110 mtco e in 2005<br />
2<br />
to 810 mtco e in 2030 due to strong demand growth and an increasing dependence on coal (exhibit 17).<br />
2<br />
emissions from the power sector in 2030 are expected to exceed levels of the peat sector today.<br />
demand for power is expected to grow from 120 tWh in 2005 to 970 tWh in 2030. While several demand<br />
projections exist for Indonesia, demand estimates developed by PLn, the state electricity utility company,<br />
appear to be the most consistent with our general approach, using projections based on those of a comparable<br />
economy. however, since PLn does not project beyond 2025, we have extrapolated the demand to 2030<br />
using the historical growth rate.<br />
on the supply side, Indonesia has ambitious plans to capture as much as 9 gW (from 1 gW today) of<br />
geothermal energy by 2030, which would then account for 8 percent of total power generation. however, the<br />
continued policy emphasis (as described by the national energy blueprint) on increasing the share of coal<br />
in the energy mix will negate most efforts of clean power generation, leaving Indonesia’s electricity emission<br />
factor, i.e., emission per unit of electricity, relatively unchanged from 2005 to 2030.
26<br />
IndonesIa’s <strong>greenhouse</strong> <strong>gas</strong> <strong>abatement</strong> <strong>cost</strong> <strong>curve</strong><br />
Exhibit 16<br />
Exhibit 17<br />
The power sector is expected to see an 8-10 fold increase<br />
in demand from 120 to 970 TWh over the next 25 years<br />
…driven by several factors<br />
including:<br />
1▪<br />
Growth in residential<br />
consumption<br />
2▪<br />
Electrification of rural<br />
Indonesia<br />
3▪<br />
Realization of latent and<br />
suppressed demand<br />
4▪<br />
Manufacturing and services<br />
growing faster than before<br />
Power demand projection<br />
TWh<br />
1,000<br />
900<br />
800<br />
700<br />
600<br />
500<br />
400<br />
300<br />
200<br />
100<br />
0<br />
120<br />
150<br />
SOURCE: RUPTL 2007-2018, RUKN 2008-2027 (Ministry of Energy & Mineral Resources)<br />
250<br />
415<br />
610<br />
RUPTL (PLN)<br />
Projection<br />
970<br />
2005 2010 2015 2020 2025 2030<br />
Coal is expected to take on a greater share of the total BAU energy mix<br />
leading to a seven-fold increase in GHG emissions in 2030<br />
Electricity generation Associated GHG emissions<br />
TWh<br />
MtCO2e 55<br />
(45%)<br />
8X<br />
124<br />
2005<br />
Key observations<br />
414<br />
272<br />
(66%)<br />
2020<br />
970<br />
645<br />
(66%)<br />
2030<br />
Geothermal<br />
Other<br />
clean tech<br />
Other<br />
fossil fuels<br />
Coal<br />
Note: Projections from PLN are until 2018, hence proportion of technologies is assumed to remain constant after 2020<br />
SOURCE: Indonesia GHG Abatement Cost Curve, PLN, ESDM, IEA<br />
7X<br />
110<br />
2005<br />
369<br />
2020<br />
• While geothermal capacity continues to grow in absolute terms, it’s relative share in the<br />
overall mix remains small<br />
• Current plans outlined in the National Energy Blueprint push for a switch from oil to coal<br />
so as to limit excessive price fluctuations caused by volatile oil price<br />
810<br />
2030<br />
Oil<br />
Gas<br />
Coal
Abatement potential and <strong>cost</strong>s<br />
IndonesIa’s <strong>greenhouse</strong> <strong>gas</strong> <strong>abatement</strong> <strong>cost</strong> <strong>curve</strong> 27<br />
there are several opportunities to abate as much as 225 mtco 2 e in 2030 through increased penetration<br />
of clean and renewable energy sources and the increased use of clean coal technologies. an additional<br />
reduction can be attributed to reduced demand from other sectors. In particular, demand-side management<br />
levers (e.g., switch from incandescent to Led light bulbs) in the buildings, transportation, and cement sectors<br />
could see a net effect of reducing emissions by 47 mtco 2 e (56 tWh) in 2030 (exhibit 18).<br />
The power sector could provide approximately 260 MtCO 2 e 1 of reduction<br />
potential in 2030<br />
Abatement <strong>cost</strong><br />
USD per tCO2e Coal CCS<br />
50<br />
new built<br />
40<br />
with EOR<br />
30<br />
20<br />
10<br />
0<br />
Demand side<br />
management<br />
Large hydro<br />
10<br />
14<br />
-10 0 20 40 60 80 -4 100 120 140<br />
-20<br />
-15<br />
-30<br />
-40<br />
-50<br />
-60<br />
-70<br />
Small hydro<br />
Nuclear<br />
-80<br />
-75<br />
Coal supercritical<br />
1 Inclusive of demand side reductions in other sectors; currently estimated at 57 TWh<br />
SOURCE: Indonesia GHG Abatement Cost Curve<br />
160<br />
Geothermal<br />
27<br />
Biomass<br />
45<br />
180 200 220 240<br />
On shore wind<br />
Abatement potential<br />
MtCO 2 e per year<br />
as relatively clean technology, hydro-electricity plants offer the largest <strong>abatement</strong> opportunity. hydro in<br />
Indonesia remains mostly underdeveloped, with only 5 gW developed of the total 32 gW of exploitable<br />
potential expected in 2030. capturing the additional 27 gW capacity (based on 70 tWh installed) of hydro<br />
power would result in an <strong>abatement</strong> potential of 65 mtco 2 e at a negative <strong>cost</strong> of -7 usd per tco 2 e.<br />
Indonesia is home to a significant share of the world’s known conventional geothermal resources. additional<br />
use of geothermal sources, beyond what is already planned, could provide <strong>abatement</strong> of some 50 mtco 2 e,<br />
adding an additional 6 gW of capacity (47 tWh) at an <strong>abatement</strong> <strong>cost</strong> of 27 usd per tco 2 e. although a proven<br />
technology, limited feasibility assessments in Indonesia often leads to much higher exploration and development<br />
<strong>cost</strong>s of geothermal projects in Indonesia. experts have suggested that these <strong>cost</strong>s could be as much as<br />
125-175 percent higher given the scarcity of strong technical information available on geothermal sites.<br />
the single largest lever by volume is biomass power plants. In this context biomass refers to fuels derived<br />
from timber, fuel crops and agricultural waste. together these represent a 64 mtco 2 e <strong>abatement</strong> opportunity.<br />
the high <strong>cost</strong> of biomass in this analysis is caused by two factors: the first is that given the Indonesia’s<br />
geographical context, fuel supply usually resides some distance from where power demand exists leading to<br />
high transportation <strong>cost</strong>s for the fuel; the second is that the model considers only grid-connected applications<br />
of biomass power. Implementing biomass in smaller, off-grid and distributed applications could provide for<br />
additional, and lower-<strong>cost</strong>, options; however, the limited availability of off-grid demand data in Indonesia<br />
limits a more detailed analysis.<br />
49<br />
260<br />
280<br />
Ø 20<br />
Exhibit 18
28<br />
IndonesIa’s <strong>greenhouse</strong> <strong>gas</strong> <strong>abatement</strong> <strong>cost</strong> <strong>curve</strong><br />
similarly, solar power is considered as a grid-connected system in this model which limits its potential scale<br />
and leads to a relatively higher <strong>cost</strong>. solar power could provide significant savings if off-grid solar applications<br />
were considered, but these would require additional analysis. In the current model which looks only at gridconnected<br />
power, the <strong>cost</strong> of solar exceeds the $80/tco 2 e threshold built into the analysis.<br />
to realize this potential <strong>abatement</strong> and develop power infrastructure on a low-carbon-growth trajectory,<br />
Indonesia must overcome several barriers. a comprehensive, detailed, and publicly available mapping<br />
of available energy sources in Indonesia as well as sufficient regulatory support may help attract more<br />
investment to develop their potential. the most recent publicly available information relies on antiquated data<br />
and often does not include a feasibility analysis of the available resources.<br />
transPortatIon<br />
2030 – emissions: 502 MtCO 2 e, <strong>abatement</strong> potential: 100 MtCO 2 e<br />
Sectoral emissions<br />
emissions from the transportation sector will increase seven-fold between 2005 and 2030 (from 60 to<br />
443 mtco e) in the business-as-usual scenario, driven by strong growth in the number of personal and<br />
2<br />
commercial vehicles (exhibit 19). as personal income levels triple over the next two decades, this will lead to<br />
a tripling in penetration of personal vehicles from 115 vehicles per 1,000 inhabitants today to 312 in 2030.<br />
Exhibit 19<br />
Indonesia will see a seven-fold increase in business-as-usual emissions<br />
from the road transport sector<br />
Projected emissions, Mt CO 2 e<br />
9<br />
11<br />
7X<br />
60<br />
2005<br />
18<br />
2<br />
4<br />
17<br />
tied to this rise in wealth will be an increased volume of goods to be transported across the country, which<br />
will drive an even faster increase in the share of commercial vehicles from 5 percent to 15 percent of the<br />
overall vehicle population (exhibit 20). With heavier, lower-fuel-economy vehicles traveling longer distances,<br />
the share of emissions from commercial vehicles is expected to grow from 10 percent to 20 percent of the<br />
total emissions in 2030.<br />
17<br />
1 LCV: Light commercial vehicles weighing under 3.5 tons<br />
2 MCV: Medium commercial vehicles weighing between 3.5 – 16 tons<br />
3 HCV: Heavy commercial vehicles weighing over 16 tons<br />
223<br />
70<br />
26<br />
84<br />
22<br />
2020<br />
4<br />
443<br />
6<br />
42<br />
176<br />
62<br />
129<br />
28<br />
2030<br />
SOURCE: Asia Clean Air Initiative, Swisscontact, PUSTRAL, GAIKINDO, Expert Interviews, Indonesia GHG Abatement Cost Curve<br />
HCVs3 Buses<br />
MCVs 2<br />
LCVs 1<br />
Passenger car<br />
Motorcycles
Abatement potential and associated <strong>cost</strong>s<br />
IndonesIa’s <strong>greenhouse</strong> <strong>gas</strong> <strong>abatement</strong> <strong>cost</strong> <strong>curve</strong> 29<br />
The share of commercial vehicles will increase from 5 to 15% as the need<br />
for transporting goods rises with increased economic activity<br />
Millions<br />
100%=<br />
2<br />
28<br />
15<br />
79<br />
2005<br />
3<br />
74<br />
1<br />
5<br />
3<br />
61<br />
2020<br />
112<br />
1<br />
8<br />
6<br />
31<br />
54<br />
2030<br />
SOURCE: Ministry of Transportation, Ministry of Industry, GAIKINDO, PUSTRAL, Expert interviews<br />
31<br />
Buses<br />
HCVs<br />
MCVs<br />
LCVs<br />
Passenger<br />
cars<br />
Motorcycles<br />
CAGR<br />
5%<br />
there exists the potential to reduce transportation sector emissions by 20 percent (approximately 100 mt)<br />
by 2030 across three principal mitigation levers: improvements to internal combustion engines; moving from<br />
<strong>gas</strong>oline-powered vehicles to hybrid and electric vehicles; and the adoption of biodiesel fuel made from palm<br />
oil (exhibit 21).<br />
three quarters of the total emission reduction potential (or 75 mtco 2 e) lies in improvements to conventional<br />
internal combustion engines (Ice) across all vehicle classes, which could be encouraged through higher fuel<br />
efficiency standards. such measures are all available at a negative <strong>abatement</strong> <strong>cost</strong>. It is important to stress<br />
here that while the <strong>abatement</strong> <strong>cost</strong> is negative over the life of the technology there can often be a significant<br />
upfront <strong>cost</strong> which needs to be born by the consumer. Without specific regulations in place, the manufacturer<br />
is unlikely to incorporate more expensive technologies as their products will appear more expensive to the<br />
consumer. specific regulatory measures will need to be undertaken by the government of Indonesia to help<br />
manage these forms of principle-agent issues.<br />
shifting from <strong>gas</strong>oline-powered vehicles towards hybrid and electric vehicles represents the next largest<br />
opportunity of 15 mtco 2 e. switching to electric motorcycles is a relatively attractive option at a <strong>cost</strong> of -162 usd<br />
per ton of co 2 e abated. though the <strong>cost</strong>ly batteries associated with these new technologies would act as a<br />
<strong>cost</strong> barrier in a developing country such as Indonesia, continued innovation that lowers <strong>cost</strong> and new sources<br />
of international financing could result in increased penetration of these vehicles.<br />
While a significant portion of the opportunity is available at a negative <strong>abatement</strong> <strong>cost</strong>, implementing most<br />
of these levers will require significant upfront investments in vehicles and infrastructure in related sectors.<br />
International financing will need to be made available in order for Indonesia to capture many, if not most, of<br />
these opportunities in the near term.<br />
many Ice improvements are dependent on the availability of the appropriate fuel types, which could imply<br />
changes or additions to current refining practices in Indonesia.<br />
10%<br />
10%<br />
10%<br />
10%<br />
10%<br />
Exhibit 20
30<br />
IndonesIa’s <strong>greenhouse</strong> <strong>gas</strong> <strong>abatement</strong> <strong>cost</strong> <strong>curve</strong><br />
Exhibit 21<br />
About 89% of the <strong>abatement</strong> potential can be obtained at a negative <strong>cost</strong><br />
to society 1<br />
Abatement <strong>cost</strong><br />
$ per tCO 2e<br />
400<br />
300<br />
200<br />
100<br />
0<br />
0<br />
-100<br />
20<br />
40<br />
60 80 100<br />
Abatement potential<br />
-200<br />
MtCO2e per year<br />
-300<br />
LCV ICE3 Cars ICE3 Cars ICE<br />
Diesel<br />
3 <strong>gas</strong>oline<br />
Cars hybrid<br />
2 wheeler electric<br />
1 Assuming a societal discount rate of 4%<br />
2 Current potential based on global <strong>cost</strong> assumptions for palm oil at USD 0.52 / liter<br />
3 Internal combustion engine (ICE)<br />
SOURCE: Indonesia GHG Abatement Cost Curve<br />
biodiesel made from palm oil would provide an additional 10 mtco 2 e of <strong>abatement</strong> potential, but at a very<br />
high incremental <strong>cost</strong> compared to the current projected <strong>cost</strong> of diesel. however, the <strong>abatement</strong> potential<br />
from the use of biodiesel from palm oil is particularly sensitive to the availability of sustainable palm oil. It is<br />
important that any increase in supply of palm oil for the transportation sector not compete with efforts to<br />
avoid deforestation as highlighted in the LuLucf section. should the biofuels come from plantations which<br />
have displaced forests the <strong>abatement</strong> opportunity would be significantly reduced and hence lead to the lever<br />
becoming even more expensive.<br />
sustainable public transit systems are another important mitigation measure in the transportation<br />
sector. however, they have not been included in this analysis as local data on public transportation <strong>cost</strong>s<br />
and effectiveness are limited. several studies are currently underway, the results of which could later be<br />
incorporated into this model.<br />
PetroLeum and <strong>gas</strong><br />
MCV ICE 3<br />
Bio diesel palm oil<br />
HCV ICE 3<br />
Car dieselization<br />
2030 – emissions: 137 MtCO 2 e, <strong>abatement</strong> potential: 41 MtCO 2 e<br />
Cars electric<br />
Buses ICE 3<br />
Sectoral emissions<br />
for petroleum, the scope of this analysis includes production (including <strong>gas</strong> flaring) and refining activities.<br />
excluded are emissions related to exploration and development of petroleum reserves, shipping, and<br />
petrochemicals. this analysis also excludes emissions related to the final consumption of petroleum products<br />
by the end user, as these are treated within the individual consuming sectors detailed elsewhere in this report.<br />
for natural <strong>gas</strong>, the scope of this analysis includes production and liquefaction of natural <strong>gas</strong> into liquefied<br />
natural <strong>gas</strong> (Lng).<br />
under these definitions, total emissions from Indonesia’s petroleum and <strong>gas</strong> sector are expected to increase<br />
in the medium term from 122 mtco 2 e in 2005 to 135 mtco 2 e in 2020, mainly on account of additional
IndonesIa’s <strong>greenhouse</strong> <strong>gas</strong> <strong>abatement</strong> <strong>cost</strong> <strong>curve</strong> 31<br />
refining capacity expected to come online. however, in the longer term, emission increases from refining are<br />
expected to be offset – as mature oil and <strong>gas</strong> fields are shut down and replaced with newer, more efficient<br />
ones – so that emissions stay relatively constant at 137 mtco 2 e in 2030 (exhibit 22).<br />
Business-as-usual emissions in the petroleum and <strong>gas</strong> sector<br />
MtCO 2e per year*<br />
Midstream LNG<br />
Downstream<br />
refining<br />
+12%<br />
Upstream oil and<br />
<strong>gas</strong> production<br />
* Including indirect emissions<br />
Source: Indonesia GHG Abatement Cost Curve<br />
122<br />
11<br />
20<br />
91<br />
2005<br />
134 132<br />
13 8<br />
21<br />
100<br />
2010<br />
19<br />
105<br />
2015<br />
0.5%<br />
135 137 137<br />
8<br />
13<br />
7<br />
9<br />
7<br />
5<br />
114<br />
2020<br />
Upstream<br />
Production of oil is expected to remain relatively flat at around 1.1 million barrels per day. current forecasts<br />
for oil production in Indonesia do not include any additional large discoveries. most oil fields are beginning<br />
to mature and only smaller fields are coming online to offset the very mature fields, which are expected to be<br />
shut down in the near future.<br />
flaring and in some cases even venting of associated <strong>gas</strong>es continues to remain a problem in Indonesia.<br />
current estimates suggest that 25–30 percent of all flaring activities in southeast asia are occurring in and<br />
around Indonesia, which is significant given that Indonesia only accounts for around 12 percent of all oil<br />
production in the region. however, flaring emissions in southeast asia have been reducing at a fairly strong<br />
pace; current estimates from the u.s. national oceanic and atmospheric administration (noaa) show<br />
reductions of around 5 percent per year from 2000 to 2004. In 2005, the most recent year with data available,<br />
<strong>gas</strong> flaring in Indonesia was estimated to be around 3 billion cubic meters (bcm) per year.<br />
Midstream<br />
natural <strong>gas</strong> liquefaction is currently estimated at 44 bcm per year, with the majority of it being exported.<br />
most of the emissions associated with Lng are the result of <strong>gas</strong> compression and methane leakage during<br />
the processing and transporting of the <strong>gas</strong>. current estimates suggest a decline in the volume of Lng being<br />
produced over the next 20 years and almost halved by 2030, as it is expected that increasingly larger shares<br />
will be diverted for domestic consumption where the need for liquefaction would be reduced.<br />
Downstream<br />
refining capacity in Indonesia has remained constant for the past few years at around 1 million barrels<br />
per day. all refining capacity in Indonesia is owned and operated by state-owned Pertamina, which has<br />
announced plans to add an additional 500,000 barrels per day refining capacity in the next 5–10 years,<br />
121<br />
2025<br />
124<br />
2030<br />
CAGR<br />
2005-30<br />
%<br />
-2<br />
-5<br />
1<br />
Exhibit 22
32<br />
IndonesIa’s <strong>greenhouse</strong> <strong>gas</strong> <strong>abatement</strong> <strong>cost</strong> <strong>curve</strong><br />
increasing total refining capacity up to 1.5 million barrels of oil per day. this planned capacity addition is<br />
included in the current emission analysis.<br />
Abatement potential and associated <strong>cost</strong>s<br />
the petroleum and <strong>gas</strong> sector has an opportunity to reduce emissions by as much as 30 percent by 2030<br />
through a focused effort across three <strong>abatement</strong> areas: improved maintenance and process control, energy<br />
efficiency programs, and reduced flaring. (exhibit 23).<br />
Exhibit 23<br />
Indonesia GHG <strong>abatement</strong> <strong>cost</strong> <strong>curve</strong> for the Petroleum sector in 2030<br />
Abatement <strong>cost</strong><br />
$ per tCO2e 40<br />
Co-generation -<br />
downstream<br />
Reduced flaring - upstream<br />
28<br />
20<br />
0<br />
6<br />
-20 0 2 4 6 8 10 12 14 16 18 20 22 24 26 28 30 32 34 36 38 4042<br />
-40<br />
-60<br />
-80<br />
-100<br />
-69<br />
Abatement potential<br />
MtCO2e per year<br />
-120<br />
-140<br />
-106 -103<br />
-160<br />
-180<br />
-200<br />
-160<br />
Energy efficiency projects requiring CAPEX at process unit level -<br />
downstream<br />
-220<br />
-240<br />
Improved maintenance and process control - downstream<br />
Procedural changes - downstream<br />
Procedural changes and improved maintenance and process control - upstream<br />
SOURCE: Indonesia GHG Abatement Cost Curve<br />
Improved maintenance and process control across the production and refining subsectors could result in<br />
a little over 7 mtco 2 e of <strong>abatement</strong> and is net-profit-positive (-103 usd per tco 2 e), which implies significant<br />
savings over the life of the <strong>abatement</strong> measures. specific programs within these levers include conservation<br />
programs, energy-awareness programs, and measures to reduce fouling build-up in pipes, optimize well<br />
and separator pressures, and optimize the spinning reserves of rotating equipment.<br />
Implementation of energy-efficiency programs could provide an additional 27 mtco 2 e of <strong>abatement</strong> at<br />
negative <strong>cost</strong> (for energy efficiency programs) or modest <strong>cost</strong> (for implementing cogeneration 24 units). While<br />
the levers identified within this category require high capital investments, significant operational savings can<br />
be captured through reduced energy requirements.<br />
reduced flaring through the implementation of a zero-flaring program could offer 2 mtco 2 e of <strong>abatement</strong><br />
at a relatively higher <strong>cost</strong> of 28 usd per tco 2 e. the relatively small <strong>abatement</strong> is a result of significant<br />
anticipated reductions in flaring emissions in the business-as-usual scenario (currently at 5 percent per<br />
annum). In the near future, carbon capture and storage could offer a significant <strong>abatement</strong> opportunity for<br />
the petroleum and <strong>gas</strong> sector. however, given the limited deployment of this technology and as yet unknown<br />
<strong>cost</strong> structures, this <strong>abatement</strong> lever has been excluded from this analysis.<br />
24 Process by which the plants use waste energy to produce heat or electricity
cement<br />
2030 – emissions: 86 MtCO 2 e, <strong>abatement</strong> potential: 13 MtCO 2 e<br />
Sectoral emissions<br />
IndonesIa’s <strong>greenhouse</strong> <strong>gas</strong> <strong>abatement</strong> <strong>cost</strong> <strong>curve</strong> 33<br />
With strong economic growth expected for Indonesia for the next 20 years, cement sector emissions will see<br />
a three-fold increase from 26 mtco 2 e in 2005 to 75 mtco 2 e in 2030. this will be driven by significant growth<br />
in the production of cementitious material in Indonesia from 31 million tons in 2005 to 125 million tons in 2030<br />
(exhibit 24) driven primarily by strong economic growth.<br />
Cement demand and related GHG emissions are projected<br />
to more than triple by 2030<br />
Mt, Mt CO 2 e<br />
Cementitious production<br />
4X<br />
31<br />
2005<br />
37<br />
10<br />
49<br />
15<br />
66<br />
20<br />
91<br />
25<br />
125<br />
2030<br />
CO 2 e emissions<br />
Key observations<br />
▪ Cementitious production and related CO 2 e emissions are projected to more than triple by 2030<br />
compared to 2005 production and emissions levels<br />
▪ Emissions are growing at a lower annual rate than production, driven by increased clinker substitution,<br />
an improved average fuel efficiency of production capacity resulting from optimized retirement of least<br />
fuel efficient kilns first and build out of best available technology as replacement<br />
SOURCE: Indonesia GHG Abatement Cost Curve<br />
3X<br />
26<br />
14<br />
3 8<br />
2005<br />
Process Emissions<br />
Fuel Combustion Emissions<br />
Indirect Emissions<br />
the majority of these emissions are generated from production of clinker, a key element of cement production.<br />
the process involves the calcination of limestone and clay, a chemical reaction that releases a significant<br />
amount of co 2 e as a byproduct. replacing clinker with substitutes such as fly ash or slag can significantly<br />
reduce direct emissions from the cement sector.<br />
Abatement potential and associated <strong>cost</strong>s<br />
the cement industry in Indonesia has ambitious plans to reduce emissions through a significant increase in<br />
clinker substitution. In fact, almost 14 mtco e of reduction is already incorporated in the business-as-usual<br />
2<br />
figures (i.e., comparing 2005 emission intensities with those in 2030).<br />
In addition, given other existing technologies, the cement sector could further reduce its emissions by<br />
12 percent (or 9 mtco 2 e) by 2030. although clinker substitution continues to represent the largest opportunity<br />
for <strong>abatement</strong>, at approximately 7.5 mtco 2 e at an average negative <strong>cost</strong> of -25 usd per tco 2 e, incorporating<br />
alternative fuels, particularly from industrial and municipal waste, could further reduce emissions from the<br />
cement sector by 4.5 mtco 2 e at a moderate average <strong>cost</strong> of 8 usd per tco 2 e (exhibit 25).<br />
Within the cement industry there are other <strong>abatement</strong> levers such as carbon capture and storage (ccs)<br />
and waste heat recovery, which could provide further <strong>abatement</strong> potential in the future. however, ccs<br />
30<br />
17<br />
4 9<br />
10<br />
38<br />
21<br />
12<br />
5<br />
15<br />
51<br />
29<br />
16<br />
7<br />
20<br />
67<br />
38<br />
20<br />
9<br />
25<br />
86<br />
50<br />
24<br />
11<br />
2030<br />
Exhibit 24
34<br />
IndonesIa’s <strong>greenhouse</strong> <strong>gas</strong> <strong>abatement</strong> <strong>cost</strong> <strong>curve</strong><br />
Exhibit 25<br />
technologies are still at a nascent stage, and waste heat recovery is currently not technically feasible given<br />
the higher moisture content of most raw materials in cement production.<br />
challenges in the implementation of <strong>abatement</strong>, such as the availability of clinker and fuel substitutes, will<br />
continue to make it difficult to realize both the ambitious plans of the industry and the further capture of<br />
additional <strong>abatement</strong> potential. most of the additional <strong>abatement</strong> potential will only be captured through<br />
policy changes and enhanced incentive structures. clinker substitutes such as fly ash are of limited availability<br />
in Indonesia. attempts to import quantities of fly ash from other countries such as malaysia or Japan have not<br />
been successful given the current regulatory framework which prevents such imports.<br />
buILdIngs<br />
Indonesia GHG <strong>abatement</strong> <strong>cost</strong> <strong>curve</strong> for the Cement sector in 2030<br />
Abatement <strong>cost</strong><br />
€ per tCO2e 30<br />
20<br />
10<br />
0<br />
0<br />
-10<br />
-20<br />
-30<br />
-40<br />
-50<br />
-60<br />
Clinker substitution by<br />
Other MIC<br />
SOURCE: Indonesia GHG Abatement Cost Curve<br />
2030 – emissions: 215 MtCO 2 e, <strong>abatement</strong> potential: 43 MtCO 2 e<br />
Sectoral emissions<br />
emissions from the buildings sector will increase from 71 mtco e in 2005 to 215 mtco e in 2030, driven by<br />
2 2<br />
growing consumption of residential and commercial energy of 5–7 percent per annum (exhibit 27).<br />
Abatement potential and associated <strong>cost</strong>s<br />
by leveraging existing technologies, the buildings sector could reduce its emissions by 22 percent in 2030,<br />
representing 48 mtco e – with most reductions (more than 70 percent) coming at negative <strong>abatement</strong><br />
2<br />
<strong>cost</strong>s. (exhibit 26).<br />
these <strong>abatement</strong> opportunities are focused around six areas. In order of lowest-<strong>cost</strong> <strong>abatement</strong> lever, these<br />
include:<br />
alternative water heating replacements (8.8 mt)<br />
more efficient lighting replacements (11.3 mt)<br />
26<br />
20<br />
1 2 3 4 5 6 7 -2 8 9 10 11 12 13 14<br />
Abatement potential<br />
MtCO2e per year<br />
-28<br />
Cogeneration<br />
Fuel substitution - Bio<br />
mass<br />
Clinker substitution by Fly<br />
Ash<br />
9<br />
Clinker substitution by Slag<br />
Fuel substitution - Fossil<br />
waste
Buildings sector business-as-usual emissions are expected to grow from<br />
71 to 215 Mt CO 2 e between 2005 and 2030<br />
Projected emissions<br />
Million tons CO 2 e<br />
Direct<br />
Indirect<br />
1 From 2005 to 2030<br />
71<br />
23<br />
48<br />
2005<br />
4.5%<br />
138<br />
31<br />
108<br />
2020<br />
215<br />
38<br />
178<br />
2030<br />
SOURCE: Global Insight; RISI; WMM; PLN; IEA; Indonesia GHG Abatement Cost Curve<br />
Key Assumptions<br />
Residential Consumption<br />
Electricity<br />
Gas<br />
Oil<br />
Coal<br />
Other fuel<br />
Electricity<br />
Gas<br />
Oil<br />
Coal<br />
Other fuel<br />
IndonesIa’s <strong>greenhouse</strong> <strong>gas</strong> <strong>abatement</strong> <strong>cost</strong> <strong>curve</strong> 35<br />
2005 (Gwh)<br />
41,171<br />
15,544<br />
42,878<br />
2,557<br />
337,702<br />
Commercial Consumption<br />
2005 (Gwh)<br />
17,036<br />
2,749<br />
11,352<br />
972<br />
1,013<br />
Growth 1<br />
5.0%<br />
3.6%<br />
1.4%<br />
1.7%<br />
0.5%<br />
Growth<br />
6.7%<br />
3.0%<br />
2.3%<br />
0.0%<br />
-0.1%<br />
Indonesia has 43 Mt CO2e <strong>abatement</strong> opportunity in Buildings sector –<br />
with over 79% at negative <strong>cost</strong>s<br />
Societal perspective; 2030<br />
Abatement <strong>cost</strong><br />
$ per tCO2e 100<br />
Water heating - replacement of<br />
80<br />
60<br />
Efficiency package - new build, commercial<br />
electric water heater,<br />
residential<br />
40<br />
Water heating - replacement of electric water heater, commercial<br />
20<br />
Lighting - T12 to T8/T5, commercial<br />
0<br />
-20<br />
0<br />
-40<br />
-60<br />
-80<br />
-100<br />
Lighting - controls - retrofit,<br />
Abatement<br />
potential<br />
50<br />
commercial<br />
HVAC - retrofit, MtCO2e per year<br />
commercial<br />
-120<br />
Lighting - switch CFLs to LEDs, residential<br />
-140<br />
-160<br />
Building envelope - retrofit, commercial<br />
Electronics - office, commercial<br />
Appliances -<br />
refrigerators,<br />
ELECTRONICS - consumer, residential<br />
commercial<br />
Lighting - switch incandescent to LEDs, commercial<br />
Lighting - switch incandescent to LEDs, residential<br />
Water heating - replacement of <strong>gas</strong> water heater, residential<br />
Water heating - replacement of <strong>gas</strong> water heater , commercial<br />
Lighting - control - new build, commercial<br />
HVAC - maintenance - retrofit, residential<br />
Appliances - residential<br />
HVAC - controls - retrofit, commercial<br />
Lighting - switch CFLs to LEDs, commercial<br />
1 VAC stands for ventilation and air conditioning<br />
Note: The <strong>curve</strong> presents an estimate of the maximum potential of all technical GHG <strong>abatement</strong> measures below $90 per tCO2e if each lever was<br />
pursued aggressively. It is not a forecast of what role different <strong>abatement</strong> measures and technologies will play<br />
SOURCE: Global GHG Abatement Cost Curve v2.0<br />
Ø -60<br />
Exhibit 26<br />
Exhibit 27
36<br />
IndonesIa’s <strong>greenhouse</strong> <strong>gas</strong> <strong>abatement</strong> <strong>cost</strong> <strong>curve</strong><br />
more efficient electronics replacements (6.4 mt)<br />
more efficient appliances replacements (9.3 mt)<br />
retrofit building packages (3.2 mt)<br />
new building packages (8.2 mt)<br />
the buildings sector is unique in that not only are many of the opportunities at negative <strong>cost</strong> (i.e., they save<br />
money in the long term), but the launch of a few specific programs towards more efficient lighting, electronics,<br />
and appliances would allow the relatively quick capture of 50 percent of these <strong>abatement</strong> opportunities<br />
(exhibit 28).<br />
Exhibit 28<br />
74% of Buildings sector <strong>abatement</strong> opportunities could be captured in the<br />
short-term through government and private sector programs<br />
Quick Win opportunity 1<br />
Light bulb subsidy<br />
program (both residential<br />
and commercial)<br />
Consumer Electronics tax<br />
refund & trade-in program<br />
Consumer Appliance tax<br />
refund & trade-in program<br />
▪ Incentivize utility companies to sell CFL/LED<br />
bulbs at a lower <strong>cost</strong> by offering cash for the<br />
energy <strong>cost</strong>s they save/avoid<br />
▪ California’s PG&E sell CFL bulbs for 25-50<br />
cents and are awarded 12% of <strong>cost</strong>s they<br />
avoid (324-450M USD)<br />
▪ Provide government tax refunds to consumers<br />
who purchase an energy efficient<br />
electronics, e.g. TV, computers, printer<br />
▪ Incentivize electronics manufacturers to<br />
offer a trade-in program for old electronics<br />
▪ Provide government tax refunds to consumers<br />
who purchase an energy efficient<br />
appliance, e.g. refrigerator, stoves<br />
▪ Incentivize appliance manufacturers to offer<br />
a trade-in program for old appliances<br />
Abatement Abatement<br />
Potential <strong>cost</strong>s<br />
MtCO2e/year USD / tCO2e 14.4 -164<br />
1 Programs identified here refer to global examples of programs which have successfully captured the related <strong>abatement</strong> opportunity. The <strong>abatement</strong><br />
potential and <strong>abatement</strong> <strong>cost</strong> described refer to their potentially impact in Indonesia if implemented<br />
SOURCE: Press search<br />
examples of major initiatives that could be launched in the near term include government programs<br />
to subsidize the purchase of more efficient light bulbs and to provide a tax refund and/or trade-in for the<br />
purchase of more energy-efficient consumer electronics and appliances.<br />
utility companies could be subsidized to sell more efficient light bulbs at low <strong>cost</strong>, e.g., california’s Pg&e<br />
sells compact fluorescent (cfL) bulbs for 25–50 cents, and the government awards Pg&e with 12 percent of<br />
the <strong>cost</strong>s they avoid, i.e., 324–450 million usd over the three-year program.<br />
consumers could be encouraged to purchase more energy-efficient electronics (e.g., tv, computer) and<br />
appliances (e.g., refrigerator, stove) through government tax refunds and/or trade-in incentives.<br />
the capture of these negative <strong>cost</strong> opportunities could require broader initiatives to raise the energy efficiency<br />
standards of new buildings, develop high-efficiency standards for appliances, and make available innovative<br />
financing schemes for enabling retrofits to the existing building stock, such as through energy services<br />
companies. Important behavioral changes instilled through civic education programs in schools and universities<br />
will be instrumental to the success of these initiatives, especially those focused at the consumer.<br />
7.8<br />
9.5<br />
-86<br />
-64
aPPendIces<br />
IndonesIa’s <strong>greenhouse</strong> <strong>gas</strong> <strong>abatement</strong> <strong>cost</strong> <strong>curve</strong> 37<br />
methodology and scope 36<br />
Peat science 40<br />
reconciliation of dnPI’s estimates with the second national communication 42<br />
bibliography 44
38<br />
IndonesIa’s <strong>greenhouse</strong> <strong>gas</strong> <strong>abatement</strong> <strong>cost</strong> <strong>curve</strong><br />
methodology and scope<br />
this study focuses on technical <strong>abatement</strong> opportunities <strong>cost</strong>ing less than 80 usd per ton of co 2 equivalent<br />
(tco 2 e), as shown on Indonesia’s <strong>greenhouse</strong> <strong>gas</strong> <strong>abatement</strong> <strong>cost</strong> <strong>curve</strong> (exhibit 3). We have defined technical<br />
<strong>abatement</strong> opportunities as those that do not have a material effect on people’s way of life. our approach and<br />
results are both consistent with the national imperative of continued development and sustainable growth.<br />
the <strong>cost</strong> <strong>curve</strong> model analyzes a total of eight economic sectors employing the IPcc methodology for<br />
calculating sector emissions (see box). We look at six sectors in detail from the bottom up: LuLucf, peat,<br />
power, transportation, cement, and petroleum and refining, and at two using top-down estimates: agriculture<br />
and buildings.<br />
IPCC Methodology<br />
the Intergovernmental Panel on climate change (IPcc), established by the united nations environment<br />
Program and the World meteorological organization, is the primary un scientific advisory body<br />
publishing reports on the science and economics of climate change in order to provide a detailed fact<br />
base to policy makers and negotiators. one of its activities is to support the united nations framework<br />
convention on climate change (unfccc) through its work on developing methodologies for national<br />
<strong>greenhouse</strong> <strong>gas</strong> Inventories, which it publishes in the form of detailed guidelines.<br />
the dnPI has relied on the IPcc’s national emission reporting guidelines and good practice guides for<br />
calculating Indonesia’s emission profile. IPcc guidelines provide three methodological tiers, varying<br />
in complexity, to be chosen on the basis of national circumstance (annex 1 vs non-annex 1) and<br />
availability of data.<br />
tier 1 is a simple first order approach, whereby emissions are calculated based on IPcc default<br />
parameters, and dnPI analysis is consistent with a tier 1 assessment at a minimum. tier 2 is a more<br />
accurate approach that provides more detailed sector level and nationally specific parameters for<br />
calculating emissions, and the dnPI has developed tier 2 level assessments wherever national sector<br />
level emissions data were made available through either multi-stakeholder workshops or expert<br />
interviews. at this time, a lack of detailed data precludes the dnPI from using tier 3 methodology, the<br />
highest order method that includes detailed modeling and/or inventory measurement systems with<br />
data available at a higher resolution.<br />
the dnPI has shared its methodology for all sectors with unfccc reviewers. under current practice,<br />
reviewers do not endorse or certify national emission inventories unless submitted as a part of the<br />
national communication framework.<br />
Development of the <strong>abatement</strong> <strong>cost</strong> <strong>curve</strong><br />
the global <strong>greenhouse</strong> <strong>gas</strong> <strong>abatement</strong> “<strong>cost</strong> <strong>curve</strong>” developed by global consultancy mcKinsey & company25 summarizes the technical potential to reduce emissions of <strong>greenhouse</strong> <strong>gas</strong>es at a <strong>cost</strong> of up to 80 usd per<br />
ton co e 2 26 of avoided emissions. the <strong>cost</strong> <strong>curve</strong> shows the range of emission reduction actions that are<br />
possible with technologies that either are available today or are highly likely to be available by 2030.<br />
25 McKinsey & Company (2009) Pathways to a Low-Carbon Economy: Version 2 of the Global Greenhouse Gas Abatement Cost<br />
Curve<br />
26 Following IPCC definitions, the <strong>abatement</strong> <strong>cost</strong> <strong>curve</strong> shows technical measures with economic potential under USD 80 per<br />
tCO2
IndonesIa’s <strong>greenhouse</strong> <strong>gas</strong> <strong>abatement</strong> <strong>cost</strong> <strong>curve</strong> 39<br />
the combined axes of an <strong>abatement</strong> <strong>cost</strong> <strong>curve</strong> depict the full range of available technical opportunities 27<br />
(or levers), their relative impact in terms of carbon <strong>abatement</strong> (emission reduction potential by volume), and<br />
their estimated <strong>cost</strong> for a specific year. each opportunity is examined independently to quantify both the<br />
<strong>abatement</strong> and <strong>cost</strong> dimensions.<br />
the basic logic of the <strong>cost</strong> <strong>curve</strong> is that it displays the <strong>abatement</strong> potential and the corresponding <strong>cost</strong><br />
for each mitigation opportunity relative to a business-as-usual scenario in any given year, for a given price<br />
of fossil energy. In other words, the <strong>cost</strong> <strong>curve</strong> is a tool for assessing the emissions reduction potential of<br />
different <strong>abatement</strong> measures and for comparing their respective incremental <strong>cost</strong>s. It is not designed to<br />
predict the actual price of carbon.<br />
to ensure comparability across sectors and sources, all emission sources and sinks (points of carbon emission<br />
absorption) have been measured in a consistent way, using co 2 equivalents measured in metric tons (tco 2 e).<br />
the merit order of <strong>abatement</strong> levers is based on the lowest <strong>cost</strong> measures (in usd per tco 2 e) as of 2030.<br />
viewed as a whole, the <strong>abatement</strong> <strong>cost</strong> <strong>curve</strong> illustrates the “supply” of <strong>abatement</strong> opportunities independently<br />
from the possible “demand” that may or may not currently exist for any particular <strong>abatement</strong> opportunity.<br />
by definition, any <strong>abatement</strong> potential is attributed to the sector in which a particular lever is implemented.<br />
for example, if an <strong>abatement</strong> lever in a consuming sector (e.g., Leds in buildings) reduces electricity<br />
consumption, the resulting emission reduction in the power sector is attributed to the consuming sector<br />
(in this case, buildings). therefore, the business-as-usual emission calculations for all consuming sectors<br />
include indirect emissions from the power, transportation and petroleum and <strong>gas</strong> sectors.<br />
uncertainty can be significant for both <strong>abatement</strong> volumes and <strong>cost</strong> estimates. there are two key sources<br />
of this uncertainty: the feasibility of implementing <strong>abatement</strong> measures (for example in the LuLucf and<br />
agriculture sectors) and the <strong>cost</strong> of development for key technologies.<br />
as noted above, uncertainty also exists on several of the estimates available at the time of conducting this<br />
study, especially in the peat sector. there are still gaps in today’s understanding of climate change-related<br />
sciences, particularly as regards to natural emission sources. this report tries to bring transparency and<br />
openness to the dialogue on the scientific evidence incorporated into this study.<br />
Calculating an <strong>abatement</strong> potential<br />
<strong>abatement</strong> potential is defined as the difference between the emissions volume of a particular source under<br />
a business-as-usual scenario and the emissions volume after the <strong>abatement</strong> lever has been applied.<br />
the emissions baseline is calculated from several driver values, such as the carbon intensity of a specific<br />
fossil fuel, the production volume of a basic material, or the fuel consumption of a vehicle. each <strong>abatement</strong><br />
lever changes (usually reduces) specific driver values, for which the quantification is determined by literature<br />
reviews and expert discussions. for example, fuel consumption can be reduced by 70 percent through<br />
improvements to passenger vehicles. this leads to an <strong>abatement</strong> potential of 30 percent of initial fuel<br />
combustion emissions for this specific lever.<br />
using a merit order logic for the levers, adhering to the principle of lowest <strong>cost</strong> first, the lever with the next<br />
higher <strong>cost</strong> is applied on a new baseline after reductions from all previous levers have been applied.<br />
Calculating <strong>abatement</strong> <strong>cost</strong>s<br />
most <strong>abatement</strong> <strong>cost</strong>s are defined as the incremental <strong>cost</strong> of implementing a low-emission technology<br />
compared to the business-as-usual case, measured in usd per ton of co e abated emissions. <strong>abatement</strong><br />
2<br />
<strong>cost</strong>s include annualized repayments for capital expenditure and operating expenditure. the <strong>cost</strong> therefore<br />
represents the pure “project <strong>cost</strong>” to install and operate the low-emission technology. capital availability is<br />
not considered a constraint.<br />
27 See “How to read the <strong>greenhouse</strong> <strong>gas</strong> <strong>abatement</strong> <strong>cost</strong> <strong>curve</strong>”
40<br />
IndonesIa’s <strong>greenhouse</strong> <strong>gas</strong> <strong>abatement</strong> <strong>cost</strong> <strong>curve</strong><br />
the full <strong>cost</strong> of most <strong>abatement</strong> levers also incorporates investment <strong>cost</strong>s (calculated as the annual<br />
repayment of a loan over the lifetime of the asset), operating <strong>cost</strong>s (including personnel and materials <strong>cost</strong>s),<br />
and possible <strong>cost</strong> savings generated by use of the alternative (especially energy savings).<br />
In some cases, <strong>abatement</strong> comes from changes in allocation of resources rather than using alternative<br />
technologies. In such cases, <strong>abatement</strong> levers are developed by considering opportunity or replacement<br />
<strong>cost</strong>s. for example, avoiding deforestation by smallholders has an estimated opportunity <strong>cost</strong> of around<br />
1 usd per tco2e, as this represents the revenue smallholders would expect to receive from agricultural<br />
purposes after they cut down the forest. If they don’t deforest their farmland, they will lose this revenue.<br />
naturally, stopping smallholders from cutting down forests will require more than simply paying them such<br />
an amount. however opportunity <strong>cost</strong> analysis yields the most appropriate way to easily understand the<br />
relative scale of certain <strong>abatement</strong> opportunities.<br />
the full <strong>abatement</strong> <strong>cost</strong>s (either technological or opportunity) estimated here do not include transaction <strong>cost</strong>s,<br />
communication or information <strong>cost</strong>s, subsidies or explicit carbon <strong>cost</strong>s, taxes, or the consequential impact on<br />
the economy (for example, advantages from technology leadership). these <strong>cost</strong>s all depend on policy choices<br />
and dependencies, and so do not form part of this exercise, which is to form a fact-base for policy-making.<br />
operating expenditure is assessed as a real amount to be expensed in each year and capital expenditure<br />
is accounted as annualized repayments. repayment periods are calculated as the functional life of the<br />
respective piece of equipment. the interest rate used is the actual long-term bond rate of 4 percent, based<br />
on historical global averages.<br />
all <strong>cost</strong>s in the model are based on current <strong>cost</strong> and estimated projections. estimates are based on the<br />
best available projection methods, such as models (if available), expert views, and educated extrapolation.<br />
given the long horizon of approximately 25 years, a certain estimation error is inherent in the approach.<br />
macroeconomic variables such as lifetime of assets, interest rates, oil prices, and exchange rates have the<br />
highest impact on results and error margins. Individual <strong>cost</strong> estimates per lever are of lower significance and<br />
will not substantially distort overall results for each lever.<br />
transaction <strong>cost</strong>s – <strong>cost</strong>s incurred in making an economic exchange above and beyond the technical project<br />
<strong>cost</strong>s (e.g., education, policing, and enforcement <strong>cost</strong>s) – are not included in the <strong>cost</strong> <strong>curve</strong>. Implementation<br />
<strong>cost</strong> for <strong>abatement</strong> levers are considered part of the transaction <strong>cost</strong>s, involving such aspects as information<br />
campaigns and training programs.<br />
Pure behavioral changes by individuals are also excluded from the <strong>cost</strong> <strong>curve</strong>, although they do present<br />
additional <strong>abatement</strong> potential. behavioral changes are driven by various price and non-price factors, such as<br />
public education, awareness campaigns, social trends, or policy changes. for this reason, behavioral shifts are<br />
analyzed separately from the primary <strong>cost</strong> <strong>curve</strong> as “further potential” with no <strong>abatement</strong> <strong>cost</strong> attached.<br />
rather than taking the perspective of any specific decision-maker, the <strong>cost</strong> <strong>curve</strong> analysis takes a societal<br />
perspective, illustrating <strong>cost</strong> requirements to the society as a whole. at a global scale, this societal perspective<br />
enables the usage of the <strong>abatement</strong> <strong>cost</strong> <strong>curve</strong> as a fact base for discussions about what levers exist to<br />
reduce <strong>greenhouse</strong> <strong>gas</strong> emissions, how to compare reduction opportunities and <strong>cost</strong>s between countries<br />
and sectors, and how to discuss what incentives (e.g., subsidies, taxes, and carbon pricing) to put in place.<br />
for example, with this analysis, the question can be asked and answered, “If a government wanted to make<br />
different <strong>abatement</strong> measures happen, how much would different measures reduce emissions by, and what<br />
is the minimum <strong>cost</strong> (to achieve this emission reduction from a societal perspective)?”<br />
Estimating <strong>greenhouse</strong> <strong>gas</strong> emissions<br />
estimates of annual ghg emissions used in international climate change negotiations may vary, depending<br />
on the different factors included or excluded (e.g., peat fires, land use changes) and the year chosen as a
IndonesIa’s <strong>greenhouse</strong> <strong>gas</strong> <strong>abatement</strong> <strong>cost</strong> <strong>curve</strong> 41<br />
reference. given the weight of peat fires in Indonesia’s emissions, for example, total emissions may vary<br />
considerably each year according to the occurrence of fire.<br />
the current emissions number represented in this study is higher than some and lower than other estimates<br />
published by other sources. however this variance does not reflect any major difference in assumptions or<br />
interpretation of data.<br />
many of the differences between our estimates and other previously-published estimates can be explained by:<br />
1. More complete inclusion of emission sources. this estimate includes estimates of emissions from<br />
forest degradation, peat fires, and peat soil decomposition. few published estimates of Indonesia’s<br />
emissions take peat soil decomposition into account. While there are a limited number of published<br />
estimates for peat soil emissions to work from, the consensus that they are an important factor is now<br />
very clear in the wider scientific literature.<br />
2. LULUCF emissions are reported as net emissions. In accordance with IPcc guidelines, emissions<br />
from land use, land-use change, and forestry (LuLucf) activities, follow a net approach that calculates<br />
the change in time-averaged carbon stock. for example, emissions resulting from timber harvesting are<br />
calculated as the loss of carbon from production forests to the time-averaged carbon stock at the end<br />
of the rotation cycle, which includes biomass regrowth. differences in carbon stocks in different regions<br />
have been taken into account based on estimations provided by the Ifca report.<br />
3. Annual average approach to peat fire emissions. Peat fires are a major source of emissions, but<br />
their severity varies widely depending on annual rainfall in different parts of the archipelago. In general we<br />
follow the approach of the ministry of environment by using the estimates published by van der Werf et al.<br />
(2008), however as we use the 2000–2006 average our estimates vary slightly if compared with specific<br />
years during this period.<br />
Peat science<br />
Peat is an accumulation of partially decayed vegetation matter. It forms usually in marshy areas, when<br />
plant material is inhibited from decaying fully by acidic and anaerobic conditions. It is composed mainly of<br />
marshland vegetation, for example, trees, grasses, and fungi, as well as other types of organic remains, such<br />
as insect and animal corpses. Peat forms over thousands of years, growing at a rate of about a millimeter per<br />
year and is, under the right conditions, the earliest stage in the formation of coal (exhibit a1).<br />
Peatlands cover approximately 3 percent of the global land mass, storing a tremendous amount of 528 gt of<br />
carbon, equivalent to one-third of total global soil carbon. this carbon is under threat, as it is released as co 2<br />
to the atmosphere through two mechanisms (exhibit a2):<br />
1. Drainage of peatlands, which leads to aeration of the peat material and hence to oxidation (aerobic<br />
decomposition). this oxidation results in high co emissions as 50 percent to 60 percent of the peat dry<br />
2<br />
matter is carbon<br />
2. Fire in degraded peatland results in further co emissions; fire in non-degraded and non-drained<br />
2<br />
peatlands is extremely rare because of their naturally high moisture content<br />
currently, the most rapid degradation of peatland occurs in southeast asia and especially in Indonesia,<br />
which holds roughly 22 million ha of peatlands (5 percent of the total global peatland area). Indonesia’s<br />
peatlands are being deforested, drained, and burned to be developed primarily for estate crop plantations,<br />
timber plantations, and smallholder agriculture.
42<br />
IndonesIa’s <strong>greenhouse</strong> <strong>gas</strong> <strong>abatement</strong> <strong>cost</strong> <strong>curve</strong><br />
Exhibit A1<br />
Exhibit A2<br />
Thousands of years of very slow decomposition of organic matter creates<br />
an enormous carbon storage in peat soil<br />
Land under<br />
flooded<br />
conditions<br />
Slow drainage resulting in<br />
standing water and very<br />
slow decomposition of<br />
biomass<br />
Slow decomposing<br />
organic materials caused<br />
by lack of oxygen and low<br />
abundance of<br />
microorganisms<br />
Accumulation of<br />
organcic materials<br />
(peat)<br />
Peat emissions are a result of decomposition and fires of<br />
already degraded land; new land openings will increase<br />
emissions in the future<br />
Existing land<br />
openings<br />
Future land<br />
openings<br />
Removal of biomass<br />
above ground<br />
(logging)<br />
Decomposition<br />
after drainage<br />
Scientific challenges related to emissions from Indonesian peatlands<br />
▪ Indonesian peat<br />
is storing 36 Gt<br />
of carbon (132<br />
Gt of CO 2 e) at<br />
present below<br />
ground<br />
▪ Peat forest store<br />
4,2 Gt of carbon<br />
(15 Gt CO 2 e)<br />
above ground<br />
▪ As a comparison<br />
the worlds<br />
largest<br />
rainforest, the<br />
Amazon, is<br />
storing 46 Gt of<br />
carbon )(168 Gt<br />
of CO 2 e)<br />
Peat fire<br />
While peat science has a long history in the nordic region, scientific knowledge related to tropical peat is still<br />
at an early stage. since the dramatic peat fires of the 1997 and 1998 el nino events, scientists have shifted<br />
their focus to tropical peatlands and especially to emissions related to land use change. While the knowledge<br />
of peat fire related emissions has made good progress and scientists have been able to narrow down the<br />
uncertainty (van der Werf 2008), the picture of emissions related to peat decomposition is not fully clear.<br />
uncertainties around emissions from peat decomposition are large, as they are related to several factors.
IndonesIa’s <strong>greenhouse</strong> <strong>gas</strong> <strong>abatement</strong> <strong>cost</strong> <strong>curve</strong> 43<br />
Soil and root respiration<br />
most of the currently published research results were not able to fully exclude natural emissions of soil and<br />
root respiration from their carbon flux measurements. however, results from a small number of projects that<br />
have successfully done that report that 40 to 60 percent (couwenberg et al. 2009) of the below ground carbon<br />
emissions from peat soils come from respiration and not as a result of peat decomposition. since soil respiration<br />
is a natural emission, these emissions should not be counted for unfccc purposes. the implication is that<br />
emissions from peat decomposition may be overestimated by a factor of two in some published studies.<br />
Subsidence as a consequence of drainage<br />
Peat subsidence is, to a different extent, influenced by three different factors:<br />
mechanical compaction of the biomass as the water content of the peat soil is drained<br />
shrinkage of biomass after drying<br />
decomposition, as carbon from biomass components of cellulose, hemicellulose, and lignin are<br />
oxidized<br />
at present it is commonly accepted that extensive subsidence in the first and second year after drainage is<br />
mainly a result of the dewatering of the peat body. however, it is not clear how large the influence of the above<br />
mentioned factors is in the following years. some scientists (hooijer et al. 2006) state that decomposition is<br />
responsible for up to 60 percent of subsidence, while at the low end, Kool et al. (2006) report values around<br />
1 percent. the low range is more likely to be correct in areas where the peat is not compressed by heavy<br />
machinery, e.g., secondary forests and shrub land.<br />
Relation between drainage depth and decomposition<br />
at present, three potential models of the relation between drainage depth and composition are discussed.<br />
the most established model is a linear relationship developed by Wösten et al. (1997). other potential models<br />
being discussed are following an s-<strong>curve</strong> or even an inverted u-<strong>curve</strong> shape approach. however none of the<br />
latter models have yet been published in peer reviewed publications.<br />
Carbon storage in Indonesian peatland<br />
While the extent of the Indonesian peatland area, the carbon content of peat and the average bulk density<br />
are commonly acknowledged, actual peat thicknesses and development of the bulk density profile along the<br />
horizontal peat profile are still highly uncertain.<br />
all of the above mentioned factors and uncertainties have significant impact on estimates of current and<br />
future emissions from peat decomposition as well as on the overall <strong>abatement</strong> potential within the peat<br />
sector. the uncertainty results in publications presenting large ranges from 60 mtco 2 e annually at the low<br />
end up to 800 mtco 2 e at the high end for decomposition emissions alone.<br />
reconciliation of dnPI’s estimates with the second<br />
national communication<br />
In order to forecast Indonesia’s emissions in 2020, it is critical to first have a good understanding of current<br />
emissions. on august 27, 2009, the dnPI released an interim report providing an assessment of Indonesia’s<br />
2005 and projected co 2 emissions (to 2020 and 2030) as well as the scale and <strong>cost</strong> of co 2 e <strong>abatement</strong><br />
opportunities across different economic sectors. on november 24, 2009, the ministry of environment<br />
released its second national communication, which provided an estimate of Indonesia’s emissions in<br />
2000. the following reconciliation of the estimates from these two bodies is based on the revised estimates<br />
contained in the snc dated december 5, 2009. 28<br />
the overall estimates of co 2 net emissions in 2000 from the dnPI and the snc are very similar, differing by<br />
about 8 percent (exhibit a3).<br />
28 The SNC is currently under further revision.
44<br />
IndonesIa’s <strong>greenhouse</strong> <strong>gas</strong> <strong>abatement</strong> <strong>cost</strong> <strong>curve</strong><br />
there are however some significant differences in the composition of emissions reported by the dnPI and in<br />
the snc in the LuLucf and peat sectors, other non-LuLucf sectors, and in absorption.<br />
1.<br />
2.<br />
Exhibit A3<br />
LULUCF and peat sectors<br />
Comparing net emissions in 2000, DNPI and SNC estimates<br />
differ by less than 8 percent<br />
1,800<br />
1,600<br />
1,400<br />
1,200<br />
1,000<br />
800<br />
600<br />
400<br />
200<br />
0<br />
-200<br />
-400<br />
-600<br />
Net GHG emissions<br />
Mt CO 2 e; 2000<br />
the dnPI estimates emissions from LuLucf and peat to be 184 mtco2e higher than estimated in<br />
the snc, mostly made up of differences in timber extraction and peat decomposition (exhibit a4). 29<br />
sources for estimating emissions are in general not provided in the current snc report, which makes<br />
direct comparisons between dnPI and snc difficult. In general, both reports follow an IPcc compliant<br />
approach to deforestation, by calculating the change in time-averaged carbon stock, resulting in very<br />
similar emissions estimates for deforestation. however, differences in figures for timber extraction and<br />
peat decomposition might be a result of somewhat different methodologies. for example, the snc’s<br />
emissions are specifically for the year 2000, while the dnPI uses an average of the years 2000 to 2006.<br />
as harvesting levels depend on market demand, timber extraction can differ between years, and thus<br />
the dnPI chose to estimate emissions on an average of six years of data.<br />
Other (non-LULUCF) sectors<br />
1,415<br />
595<br />
1,231<br />
-411<br />
SNC<br />
the estimate in the snc for emissions from other sectors is 595 mtco2e, whereas the dnPI’s estimate<br />
from other sectors is approximately 349 mtco2e. the higher estimates in the snc appear due to<br />
the larger number of sectors covered. for example, the snc covers the waste sector, which was not<br />
included in the dnPI analysis. however, for those sectors covered by both analyses, the consistency<br />
varies significantly. estimates for the cement and transportation sectors appear to be very consistent;<br />
however, the dnPI’s emissions from the power sector (residential and electricity) are significantly higher<br />
than those reported in the snc (exhibit a5). the differences in the residential (30 percent) and electricity<br />
(100 percent) segments are difficult to account for as details on the underlying assumptions used in the<br />
snc calculation were not available at the time of publication.<br />
29 Regarding emissions from fire, the SNC and DNPI report estimates for peat fires from the same source (Van der Werf, 2008)<br />
and hence report identical emission estimates. For estimating future emissions, the DNPI uses an average of peat fire-related<br />
emissions from 2000–2006, which adjusts for potential biases occurring in any given year (for example, the year 2000 was an<br />
unusually wet year in Indonesia, and hence there were fewer peat fires than would be normally expected)<br />
1,535<br />
349<br />
1,415<br />
-229<br />
DNPI<br />
SOURCE: Indonesia 2nd National Communication; DNPI Indonesia Greenhouse Gas Emissions Cost Curve<br />
-8%<br />
Other Sectors<br />
LULUCF and Peat<br />
Absorption<br />
▪ Significantly higher<br />
absorption<br />
estimate (by 182<br />
MtCO 2 e) in SNC<br />
▪ Higher (by 184<br />
MtCO 2 e) emissions<br />
for LULUCF and<br />
peat in DNPI <strong>cost</strong><br />
<strong>curve</strong><br />
▪ Higher emissions<br />
(by 246 MtCO 2 e)<br />
from other sectors<br />
in SNC report
Peat decomposition and timber extraction are the main<br />
drivers of the higher DNPI estimates of LULUCF emissions<br />
3.<br />
1,500<br />
1,000<br />
500<br />
CO2e emissions from LULUCF in Indonesia 1<br />
Mt CO 2 e<br />
0<br />
1 Base year 2000 for all estimates<br />
2 Base year 2000<br />
3 Using SNC estimates of absorption<br />
1,231<br />
727<br />
110<br />
172<br />
222<br />
SNC net<br />
Absorption effects<br />
1,415<br />
717<br />
246<br />
172<br />
280<br />
DNPI net<br />
SOURCE: Indonesia 2nd National Communication; DNPI Indonesia Greenhouse Gas Emissions Cost Curve<br />
Energy sector emissions are ~35% higher in the DNPI<br />
analysis compared to the SNC<br />
200<br />
150<br />
100<br />
50<br />
0<br />
Energy sector emissions 1<br />
Mt CO 2 e<br />
149<br />
29<br />
72<br />
48<br />
200<br />
IndonesIa’s <strong>greenhouse</strong> <strong>gas</strong> <strong>abatement</strong> <strong>cost</strong> <strong>curve</strong> 45<br />
the dnPI estimates absorption to reduce emissions by 229 mtco2e, whereas the snc estimates an<br />
absorption reduction of 411 mtco2e. the difference is likely to be a result of different assumptions for<br />
the absorbing area and absorption rate. the underlying methodology and the assumptions and sources<br />
used in the snc calculation were not available at the time of publication.<br />
-18%<br />
SNC<br />
SOURCE: Indonesia 2nd National Communication; DNPI Indonesia Greenhouse Gas Emissions Cost Curve<br />
2<br />
DNPI3 1 Includes a comparison of only those sectors covered by both analyses – Residential, Transportation and Electricity.<br />
The SNC cover an additional two sectors Petroleum & Refining and Manufacturing<br />
2 SNC uses a 2000 base year<br />
3 DNPI uses a 2005 base year<br />
20<br />
70<br />
110<br />
Residential<br />
Transportation<br />
Electricity<br />
Deforestation<br />
Timber extraction<br />
Forest fire<br />
Peat decomposition<br />
▪ Residential and<br />
electricity related<br />
emissions from the<br />
DNPI model are 30<br />
and 100% higher<br />
(respectively) than<br />
those of the SNC<br />
▪ Additional details<br />
on assumptions<br />
would be required<br />
to account for the<br />
significant variance<br />
Exhibit A4<br />
Exhibit A5
46<br />
IndonesIa’s <strong>greenhouse</strong> <strong>gas</strong> <strong>abatement</strong> <strong>cost</strong> <strong>curve</strong><br />
bibliography<br />
Cross sector<br />
Indonesia’s Technology Needs Assessment on Climate Change Mitigation,<br />
ministry of environment<br />
(march 2009)<br />
The Economics of Climate Change in Southeast Asia: A Regional Review , asian development bank<br />
(april 2009)<br />
Pathways to a Low-Carbon Economy : Version 2 of Global Greenhouse Gas Abatement Cost<br />
Curve, mcKinsey & company (2009)<br />
Payment Mechanism, Distribution and Institutional Arrangement: Second Draft,<br />
Ifca (october<br />
2007)<br />
Indonesia Low Carbon Option study: Phase 1 Status: Report and Findings,<br />
ministry of finance and<br />
World bank (november 2008)<br />
Pathways to a Low-Carbon Economy for Brazil , mcKinsey & company<br />
Climate Change & Fiscal Policy Issues: 2008 Initiatives,<br />
fiscal Policy office ministry of finance<br />
republic of Indonesia, (december 2008)<br />
nancy L harris, silvia Petrova, fred stolle, and sandra brown et al, Identifying optimal area for REDD<br />
intervention: East Kalimantan, Indonesia as a case study, IoP Publishing Ltd (september 2008)<br />
van der Werf et al, CO emissions from forest loss, nature geoscience vol. 2 (2009)<br />
2<br />
Economic and fiscal policy strategies for climate change mitigation in Indonesia,<br />
ministry of<br />
finance and australia Indonesia Partnership (2009)<br />
Agriculture<br />
Adapting to Climate Change: The Case of Rice in Indonesia , World bank ( 2008)<br />
Yearly report: Research and Development for Agricultural Land Resources,<br />
ministry of agriculture<br />
(2008)<br />
http:// faostat.fao.org/, FAOSTAT, 2007, FAOSTAT Agricultural Data, (may 2009)<br />
ministry of forestry, Indonesia Forestry Statistics, 2007<br />
Guidelines for National inventory - AR4 -WG3 Chapter 8: Agriculture , cambridge university Press,<br />
IPcc, 2007<br />
Global Anthropogenic Non-CO Greenhouse Gas Emissisions, usePa, 1990-2002 2006<br />
2<br />
Greenhouse Gas Mitigation Potential in U.S Forestry and Agriculture,<br />
usePa, ePa 430-r-05-006,<br />
2005<br />
Inventory of U.S. Greenhouse Gas Emissions and Sinks , usePa, 1990-2005 (2006)<br />
hooijer et al, Peat CO : Assessment of CO Emissions from Drained Peatlands in SE Asia,. delft<br />
2 2<br />
hydraulics report Q3943 (2006)<br />
european union, regrin, Peat lands: Potential for Agriculture and Environmental Aspect, Ministry<br />
of Agriculture, Icraft (2008)<br />
euroconsult mott macdonald and deltares, Master Plan for the Rehabilitation and Revitalization<br />
of the Ex-Mega Rice Project Area in Central Kalimantan : Summary of Main Synthesis Report,<br />
(october 2008)<br />
Forestry and peatland management<br />
Methodology for Monitoring and Setting Baseline for Deforestation and Forest Degradation,<br />
IPcc
IndonesIa’s <strong>greenhouse</strong> <strong>gas</strong> <strong>abatement</strong> <strong>cost</strong> <strong>curve</strong> 47<br />
Towards the Inclusion of Forest-Based Mitigation in A Global Climate Agreement: Project<br />
Catalyst, the climate Works foundation (may 2009)<br />
G.R. Van der Werf, J. Dempewolf , Climate Regulation of Fire Emission and Deforestation in<br />
Equatorial Asia, ect Pnas vol.51 (december 2008)<br />
Ifca, forestry research and development agency (forda), Consolidation Report Reducing<br />
Emission From Deforestation And Forest Degradation in Indonesia, ministry of forestry(2007)<br />
adinugroho W.c., I nyoman n. suryadiputra, bambang h. saharjo, and Labueni siboro et al, Manual for<br />
the Control of Fire In Peatlands and Peatlands Forest. Climate Change, Forests and Peatlands in<br />
Indonesia Project, Wetlands International – Indonesia Programme and Wildlife habitat canada (2005)<br />
Reducing Emission from Deforestation and Forest Degradation (REDD): An Option Assessment<br />
Report, meridian Institute (march 2009 )<br />
suryadiputra, I n.n., alue dohong, roh, s.b. Waspodo, Lili muslihat, Irwansyah r. Lubis, ferry<br />
hasudungan, and Iwan t.c. Wibisono, A Guide to the Blocking of Canals and Ditches in Conjunction<br />
with the Community. Climate Change, Forests and Peatlands in Indonesia, Project. Wetlands<br />
International – Indonesia Programme and Wildlife habitat canada (2005)<br />
murdiyarso, d., atie Puntodewo, atiek Widayati, meine van noordwijk et al, Determination of Eligible<br />
Lands for A/R CDM Project Activities and for Priority Districts for Project Development Support in<br />
Indonesia, center for International forestry research (cIfor) (2006)<br />
Wosten, h, Strategies for Implementing Sustainable Management of Peatlands In Borneo,<br />
european commission Inco-dev 2005<br />
Do Trees Grow On our Money? The Implications of Deforestation Research Policies To Promote<br />
REDD, Kanninen, m. daniel murdiyarso, frances seymour, arild angelsen, sven Wunder, Laura german,<br />
center for International forestry research (cIfor) (2007)<br />
hooijer et al, Peat CO : Assessment of CO Emissions from Drained Peatlands in SE Asia, delft<br />
2 2<br />
hydraulics report Q3943 (2006)<br />
grieg-gran. m, Cost of Avoiding Deforestation, International Institute for environment and development<br />
(2006)<br />
van beukering et al, The Economic Value of Peatland Resources, Wetlands International (2008)<br />
matthews. e, State of World Forests – Indonesia, World resource International (2002)<br />
uryu et al, Deforestation, Forest Degradation, Biodiversity Loss and CO Emissions in Riau,<br />
2<br />
Sumatra, Indonesia, WWf (2007)<br />
Climate Change,<br />
financing global forest; eliasch review (2008)<br />
verwer et al, Review of Carbon Flux Estimates and Other GHG Emissions From Oil Palm Cultivation<br />
on Tropical Peatlands, alterra (2008)<br />
van der Werft et al, Climate Regulation of Fire Emission and Deforestation in Equatorial Asia, Pnas<br />
(2008)<br />
Forestry Executive Data Strategic,<br />
forest Planning and statistic, forest Planology agency, ministry of<br />
forestry (2008)<br />
Forestry Statistics of Indonesia, 2007,<br />
forestry Planning and statistic agency, forestry Planology<br />
agency, ministry of forestry<br />
Wahyunto, bambang heryanto, hasyim bekti dan fitri Widiastuti et al,<br />
Maps of Peatland Distribution,<br />
Area and Carbon Content in Papua, Wetlands International – Indonesia Programme and Wildlife habitat<br />
canada 2000-2001(2006)
48<br />
IndonesIa’s <strong>greenhouse</strong> <strong>gas</strong> <strong>abatement</strong> <strong>cost</strong> <strong>curve</strong><br />
Wahyunto, s. ritung dan h. subagjo Maps of Peatland Distribution, Area and Carbon Content in<br />
Kalimantan, Wetlands International – Indonesia Programme and Wildlife habitat canada 2000-2002<br />
(2004)<br />
Wahyunto, s. ritung dan h. subagjo, Maps of Peatland Distribution, Area and Carbon Content in<br />
Sumatera, Wetlands International – Indonesia Programme and Wildlife habitat, 1990-2002 (2003)<br />
Wahyunto, s. ritung, suparto, h. subagjo, Climate Change, Forests and Peatlands in Indonesia,<br />
Wetlands International – Indonesia Programme and Wildlife habitat canada (2005)<br />
Statistics of Timber Culture Estate,<br />
bureau of statistic (2006)<br />
Statistics of Timber Concession Estate,<br />
bureau of statistic (2006)<br />
Statistics of Timber Concession Estate,<br />
bureau of statistic (2004)<br />
Forest Inventory and Maps, Forest Planology Agency, Forest Resources Monitoring,<br />
ministry of<br />
forestry (2008)<br />
Environment Statistics Of Indonesia,<br />
bureau of statistic (2008)<br />
RISI – Analytical Cornerstone 2009<br />
NLK Associates - Global pulp mill database 2009<br />
Power, Petroleum and Gas<br />
Electricity for All: Options for Increasing Access in Indonesia,<br />
World bank (2005)<br />
Energy Information Administration, Country Analysis Brief: Indonesia,<br />
www.eja.doe.gov (2007)<br />
Key Indicators of Indonesia Energy and Mineral Resources,<br />
center for data and Information on<br />
energy and mineral resources (PusdatIn esdm) (2007)<br />
Indonesia Power Report Q1 2008 Including 5-year Industry Forecasts,<br />
business monitor<br />
International (2007)<br />
mr. Jérôme garcia, Indonesia Energy Statistics and Balances in the IEA Databases, Training<br />
Session Coal Statistics, nmc section, energy statistics division (2008)<br />
hardiv situmeang, Carbon Capture and Storage – Financing Challenges and Opportunities,<br />
Investment Drivers, Incentives and Financing Options - The Role of Developing Countries (2008)<br />
Geothermal Today,<br />
us department of energy (2005)<br />
EU-Indonesia Infrastructure Forum: Indonesian Power Sector,<br />
european business chamber of<br />
commerce in Indonesia (2006)<br />
Zuhal, Presentation on the Policy for Indonesia Sustainable Development<br />
tri murni soedyartomo soentono, Presentation on Indonesia Country Report, national nuclear<br />
agency of Indonesia (2008)<br />
Indonesia Country Report Annex 3, From Ideas To Action: Clean Energy Solutions For Asia To<br />
Address Climate Change, International resources group (Irg) (2007)<br />
Projection CO Sources For Power Sector (For Discussion Only), css-Working group PLn (2009)<br />
2<br />
teddy Lesmana, Presentation for the Community Based Educational and Partnership Actions<br />
- Carbon Neutral Initiative for Community Empowerment and Climate change Mitigation in<br />
Indonesia (2008)<br />
Electricity Governance Initiative: Case of Indonesia, Final Report,<br />
World resource Institute (2007)<br />
Power Generation Cost Assumption,<br />
International energy agency (2007)<br />
Rencana Usaha Penyediaan Tenaga Listrik 2009 - 2018 , Pt. PLn (dec 2008)
IndonesIa’s <strong>greenhouse</strong> <strong>gas</strong> <strong>abatement</strong> <strong>cost</strong> <strong>curve</strong> 49<br />
Rencana Umum Ketenagalistrikan Nasional 2008 – 2027,<br />
menteri energi dan sumberdaya mineral<br />
(nov 2008)<br />
Electricity Governance Initiative: Case of Indonesia, Final Report,<br />
World resource Institute (2007)<br />
Power Generation Cost Assumption,<br />
International energy agency (2007)<br />
World Energy Outlook 2009 , International energy agency (2009)<br />
BP Statistical Review of World Energy 2008 , bP (2009)<br />
Indonesia Associated Gas Survey,<br />
the World bank (2006)<br />
Petroleum Report Indonesia 2007-2008,<br />
embassy of the usa, Jakarta, (2008)<br />
chris elvidge, Preliminary estimation of annual <strong>gas</strong> flaring volumes in South and South East Asia,<br />
noaa – national geophysical data center (2006)<br />
Cement<br />
Mitigation Approach of Climate Change in Industry,<br />
agency of Industrial research and development,<br />
ministry of Industry (2008)<br />
Status of Efforts on CO Emission Reductions for Industry Sector, ministry of Industry (2009)<br />
2<br />
Statistical Yearbook of Indonesia 2008,<br />
bureau of statistics (2008)<br />
Annual Report Highlights 2008,<br />
Pt. holcim Indonesia<br />
Annual Report Highlights 2008,<br />
Pt. semen gresik<br />
Annual Report Highlights 2008,<br />
Pt. Indocement<br />
WBCSD CO Inventory Form, Pt. holcim Indonesia<br />
2<br />
WBCSD CO Inventory Form, Pt. Indocement<br />
2<br />
McKinsey GHG Abatement Cost Curve V2.0,<br />
mcKinsey & company, (2009)<br />
Transport<br />
Emission Factors,<br />
swisscontact (2005 )<br />
Promoting Green Diesel Technology and Introducing Green Diesel Passenger Cars in Indonesia –<br />
Executive Summary and Summary of Recommendations, PustraL ugm (2007)<br />
Clean Air Jakarta – Project Implementation Report For Clean Bus Program,<br />
swisscontact<br />
Final Report Clean Bus Program Phase II 1999-2000,<br />
swisscontact<br />
Implementation Report CAP Jakarta Phase III 2001-2003,<br />
swisscontact<br />
Fuel economy and & Vehicle Kilometers Traveled , swisscontact<br />
Lampiran & Asumsi Update November 2008 , PustraL ugm (2008)<br />
Urgensi Paket Kebijakan Dan Program Komprehensif Dalam Penghematan BBM Transportasi,<br />
tim Pemantauan dan evaluasi Kinerja transportasi nasional (tPeKtn) (2008)<br />
Vehicle Emission Per Sub-Category,<br />
swisscontact<br />
Averting an Infrastructure Crisis: A Framework For Policy And Action , the World bank (2004)<br />
Potential for Biofuels for Transport in Developing Countries,<br />
esmaP (2005)<br />
Energy Efficiency and Climate Change Considerations for On-road Transport in Asia,<br />
adb-dfId<br />
(2006)<br />
APEC Biofuels Task Force: Initial Findings and Next Steps Forward , nIst, brazilian national Institute<br />
of metrology, and Inmetro (2007)<br />
Palm Oil in Biodiesel- A Greenenergy Perspective,<br />
greenenergy
50<br />
IndonesIa’s <strong>greenhouse</strong> <strong>gas</strong> <strong>abatement</strong> <strong>cost</strong> <strong>curve</strong><br />
Buildings<br />
Technical Potential to Reduce Fossil Fuel Usage Through Solar Water Heating , national renewable<br />
energy Lab (nreL) (2007)<br />
“LED Sector: The Future’s Bright, The Future’s Green” , daiwa analyst report (2007)<br />
Presentation by Paul Waide “Why Were Here: The Potential To Lower Global Lighting Energy<br />
Consumption”, Iea<br />
rubenstein, neils, and colak ,<br />
“Daylight, Dimming, and The California Electricity Crisis” LbnL<br />
(2001)
IndonesIa’s <strong>greenhouse</strong> <strong>gas</strong> <strong>abatement</strong> <strong>cost</strong> <strong>curve</strong> 51
52<br />
IndonesIa’s <strong>greenhouse</strong> <strong>gas</strong> <strong>abatement</strong> <strong>cost</strong> <strong>curve</strong>
IndonesIa’s <strong>greenhouse</strong> <strong>gas</strong> <strong>abatement</strong> <strong>cost</strong> <strong>curve</strong> 53