You also want an ePaper? Increase the reach of your titles
YUMPU automatically turns print PDFs into web optimized ePapers that Google loves.
Denver’s Building Sector Embodied<br />
Carbon Emissions<br />
June <strong>2021</strong>
ACKNOWLEDGEMENTS AND CONTRIBUTORS<br />
The City and County of Denver Office of Climate Action, Sustainability, and Resiliency (CASR) and<br />
Community Planning and Development (CPD) Staff who collaborated and contributed including:<br />
Courtney Anderson, CASR<br />
Maria Thompson, CASR<br />
Katrina Managan, CASR
CONTENTS<br />
Acknowledgements and Contributors ........................................................................................................... i<br />
Introduction .................................................................................................................................................. 5<br />
The Significance of Embodied Carbon in Denver ...................................................................................... 5<br />
Key Findings .................................................................................................................................................. 7<br />
Comparing Operational to Embodied Carbon Emissions.......................................................................... 7<br />
Comparing Embodied to Lifetime Operational Emissions ........................................................................ 7<br />
Embodied Carbon Emissions by Building Type & Sector .............................................................................. 9<br />
Sources of Embodied Carbon .................................................................................................................. 10<br />
Recommendations ...................................................................................................................................... 11<br />
Embodied Carbon Emissions by Material Type ...................................................................................... 11<br />
Biggest Opportunities to Reduce Embodied Carbon ............................................................................... 11<br />
Recommendations for Policy Development ........................................................................................... 13<br />
Appendix A – Calculation Methodology ..................................................................................................... 14<br />
How Denver’s Embodied Carbon is Measured ....................................................................................... 14<br />
Emissions by Building Type ..................................................................................................................... 14<br />
Emissions by Material Type .................................................................................................................... 18<br />
General Embodied Carbon Calculation Approaches ............................................................................... 19
ABBREVIATIONS & TERMINOLOGY<br />
Buildings – All Commercial Buildings (commercial, industrial, multifamily).<br />
CLF – Carbon Leadership Forum.<br />
CASR – Denver’s Office of Climate Action, Sustainability, and Resiliency.<br />
EUI – Energy Use Intensity.<br />
EPD – Environmental Production Declaration.<br />
FSC - Forest Stewardship Council.<br />
GHG – Greenhouse Gas.<br />
Homes – All Single-family Dwellings (attached and detached).<br />
IECC – International Energy Conservation Code.<br />
LCA – Life-cycle Assessment.<br />
MFU – Multi-family Units.<br />
Natural gas – Gas.<br />
NZE – Net Zero Energy.<br />
Denver’s Building Sector Embodied Carbon Emissions<br />
Page i
INTRODUCTION & SUMMARY<br />
As Denver works to reduce operational <strong>emissions</strong> in <strong>building</strong>s over time, the importance of <strong>embodied</strong><br />
<strong>carbon</strong> grows. The City and County of Denver (Denver) contracted with Lotus Engineering and<br />
Sustainability, LLC (Lotus) to analyze Denver’s <strong>building</strong> <strong>sector</strong> <strong>embodied</strong> <strong>carbon</strong> <strong>emissions</strong>. This analysis<br />
will inform the City’s thinking on the value of <strong>embodied</strong> <strong>carbon</strong> policies. The hope is to also inform<br />
decisions made by Denver’s architects, developers, and other stakeholders as they build <strong>building</strong>s and<br />
homes in Denver and as they participate in Denver’s code adoption process.<br />
Based on the key findings, there are key recommendations for Denver as it considers widening <strong>building</strong><br />
policies to address both operational and <strong>embodied</strong> <strong>carbon</strong> <strong>emissions</strong>. Denver can prevent <strong>embodied</strong><br />
<strong>carbon</strong> <strong>emissions</strong> by using salvaged <strong>building</strong> materials. Embodied <strong>carbon</strong> can be reduced and optimized<br />
by adapting to different materials and specifications. Buildings can plan for <strong>embodied</strong> caron <strong>emissions</strong><br />
through <strong>building</strong> deconstruction techniques and end of life use. Policy development can create<br />
regulations and develop accountability measures to protect the environment such as, prioritizing<br />
<strong>embodied</strong> <strong>carbon</strong> <strong>building</strong> policies that address the commercial <strong>sector</strong>.<br />
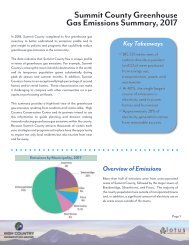
The Significance of Embodied Carbon in Denver<br />
The study of <strong>embodied</strong> <strong>carbon</strong> in Denver <strong>building</strong>s will help to develop policies and inform decisions<br />
made by Denver’s architects, developers, and stakeholders.<br />
A <strong>building</strong>’s life cycle GHG <strong>emissions</strong> are comprised of operational <strong>carbon</strong> and <strong>embodied</strong> <strong>carbon</strong>.<br />
Operational <strong>carbon</strong> <strong>emissions</strong> results from the on-site electricity and natural gas (gas) consumption<br />
required to operate <strong>building</strong>s and homes. Embodied <strong>carbon</strong> is generated from the materials used to<br />
build structures and includes material extraction, manufacturing, transportation, <strong>building</strong> construction,<br />
maintenance, demolition or deconstruction, and disposal. Refer to Figure 1.<br />
As Denver achieves the goal of all new <strong>building</strong>s and homes meeting net zero energy by 2030, the<br />
operational <strong>carbon</strong> <strong>emissions</strong> will significantly decline. By 2040, when Denver meets its goal for all<br />
<strong>building</strong>s and homes achieving net-zero by 2040, operational <strong>carbon</strong> <strong>emissions</strong> will disappear, and<br />
<strong>embodied</strong> <strong>carbon</strong> will become 100% of the <strong>emissions</strong>.<br />
Denver’s Building Sector Embodied Carbon Emissions Page 5
Figure 1. Life cycle stages of a typical <strong>building</strong>. i<br />
Denver’s Building Sector Embodied Carbon Emissions Page 6
KEY FINDINGS<br />
The first step of the analysis for Denver included quantifying <strong>emissions</strong> of both the operational <strong>carbon</strong><br />
and <strong>embodied</strong> <strong>carbon</strong>. Most importantly, it also compared the two in order for Denver to understand<br />
how best to reach Denver’s climate goals by understanding if the <strong>emissions</strong> are operational or <strong>embodied</strong><br />
and how this changes over time.<br />
Comparing Operational to Embodied Carbon Emissions<br />
The significance of <strong>embodied</strong> <strong>carbon</strong> grows over time as Denver’s climate goals to reduce operational<br />
<strong>emissions</strong> through net zero energy (NZE) are achieved for both new and existing <strong>building</strong>s. In 2020,<br />
operational <strong>carbon</strong> <strong>emissions</strong> far outweigh <strong>emissions</strong> from <strong>embodied</strong> <strong>carbon</strong>. In 2030, <strong>embodied</strong><br />
<strong>carbon</strong> <strong>emissions</strong> will make up 27 percent of all <strong>emissions</strong> from <strong>building</strong>s built in 2030 compared to<br />
annual operational <strong>emissions</strong> for all <strong>building</strong>s in 2030. By 2040, both existing and new <strong>building</strong>s will be<br />
NZE, so 100% of <strong>emissions</strong> will be from <strong>embodied</strong> <strong>carbon</strong>. As we meet Denver’s goals, the operational<br />
<strong>emissions</strong> disappear, and the <strong>embodied</strong> <strong>carbon</strong> becomes 100% of the <strong>emissions</strong>. Refer to Figure 2.<br />
Figure 2. Embodied <strong>carbon</strong> and operational <strong>emissions</strong> for all <strong>building</strong>s by year.<br />
Comparing Embodied to Lifetime Operational Emissions<br />
The effects of Denver’s net zero code impacts, <strong>building</strong> electrification, and renewable energy goals shift<br />
the emphasis towards <strong>embodied</strong> <strong>carbon</strong> <strong>emissions</strong> over time. The ratio shrinks with every year that<br />
Denver improves <strong>building</strong> performance requirements. By 2030, 100% of <strong>emissions</strong> for <strong>building</strong>s<br />
constructed that year will be <strong>embodied</strong> <strong>carbon</strong> <strong>emissions</strong>. The 2030 milestone is approaching, so the<br />
significance of addressing <strong>embodied</strong> <strong>carbon</strong> increases every year. Refer to Figure 3. Denver needs to<br />
account for the <strong>embodied</strong> <strong>carbon</strong> <strong>emissions</strong> as policies are built to protect people and the environment.<br />
Denver’s Building Sector Embodied Carbon Emissions Page 7
New homes<br />
electric by 2024.<br />
New <strong>building</strong>s<br />
electric by 2027.<br />
100% renewable<br />
by 2030.<br />
Figure 3. Comparison of <strong>embodied</strong> to lifetime operational <strong>emissions</strong> for <strong>building</strong>s built between 2020<br />
and 2030.<br />
Denver’s Building Sector Embodied Carbon Emissions Page 8
EMBODIED CARBON EMISSIONS BY BUILDING TYPE & SECTOR<br />
Some <strong>building</strong> types have higher <strong>embodied</strong> <strong>carbon</strong> by having a high <strong>embodied</strong> <strong>carbon</strong> emission factor or<br />
by having a large <strong>building</strong> footprint area. Both effects should be considered when addressing <strong>embodied</strong><br />
<strong>carbon</strong> by <strong>building</strong> type. When combined (i.e., the product of square footage and <strong>embodied</strong> <strong>carbon</strong><br />
emission factors), the <strong>building</strong> types that produce the most <strong>embodied</strong> <strong>carbon</strong> are represented by the<br />
largest and darkest circles in Figure 4.<br />
Other nonresidential <strong>building</strong>s have the most <strong>embodied</strong> <strong>carbon</strong> since they have the largest <strong>building</strong> area<br />
footprint and the highest <strong>carbon</strong> emission factor. Single-family homes have a large <strong>building</strong> area<br />
footprint but a low emission factor, so the high <strong>emissions</strong> result from the sheer number of homes.<br />
Building types with the largest <strong>embodied</strong> <strong>carbon</strong> <strong>emissions</strong> should be prioritized for policies that reduce<br />
<strong>embodied</strong> <strong>carbon</strong>.<br />
Figure 4. Ranking of <strong>embodied</strong> <strong>carbon</strong> <strong>emissions</strong> by <strong>building</strong> type in 2019.<br />
Most of Denver’s <strong>embodied</strong> <strong>carbon</strong> <strong>emissions</strong> are produced by the commercial <strong>sector</strong>, which includes<br />
commercial, industrial, and multifamily <strong>building</strong>s. Understanding that commercial <strong>building</strong>s have the<br />
highest impact can help when developing strategies and policies for targeting <strong>embodied</strong> <strong>carbon</strong><br />
<strong>emissions</strong>.<br />
Figure 5. 2019 Commercial to residential<br />
<strong>embodied</strong> <strong>carbon</strong>.<br />
Figure 6. 2040 Commercial to residential<br />
<strong>embodied</strong> <strong>carbon</strong>.<br />
Denver’s Building Sector Embodied Carbon Emissions Page 9
Sources of Embodied Carbon<br />
“Upfront <strong>carbon</strong>,” the <strong>emissions</strong> generated before the <strong>building</strong> is used, are estimated to be responsible<br />
for between 50 and 80 percent of all <strong>emissions</strong> from new construction by 2050. Upfront <strong>carbon</strong>,<br />
contributes the most to a <strong>building</strong>’s <strong>embodied</strong> <strong>carbon</strong> emission total, and these sources have the<br />
greatest opportunity to be reduced, refer to Figure 7 ii .<br />
<br />
<br />
<br />
<br />
Foundation: footings and retaining walls.<br />
Structure: framing, reinforcement, slabs, and decking.<br />
Enclosure: cladding, fenestration, insulation, and roofing.<br />
Additional assemblies: interior furnishings (equipment, fixtures, furniture), <strong>building</strong> systems<br />
(electrical, mechanical, and plumbing), and site work (excavation, exterior paving, and shoring<br />
and formwork).<br />
Most <strong>emissions</strong> are generated from the production of the following structural elements:<br />
<br />
<br />
<br />
Concrete<br />
Steel<br />
Wood<br />
The second-largest source of <strong>embodied</strong> <strong>carbon</strong> in <strong>building</strong>s is from the <strong>building</strong>’s enclosures.<br />
Some life-cycle assessment (LCA) studies 1 suggest that aluminum curtainwall and foam insulation are the<br />
greatest enclosure contributors to <strong>carbon</strong>.<br />
Figure 7. Typical hot spots of a <strong>building</strong>’s <strong>embodied</strong> <strong>carbon</strong>.<br />
1<br />
See The Urgency of Embodied Carbon and What You Can Do About It and Building Green<br />
Denver’s Building Sector Embodied Carbon Emissions Page 10
RECOMMENDATIONS<br />
Embodied Carbon Emissions by Material Type<br />
Using low-<strong>embodied</strong> <strong>carbon</strong> emission material types has the potential to reduce <strong>embodied</strong> <strong>carbon</strong><br />
<strong>emissions</strong> by up to 60 percent in an example home, see Figure 8.<br />
Figure 8. Embodied <strong>carbon</strong> <strong>emissions</strong> from different material types in example home.<br />
Biggest Opportunities to Reduce Embodied Carbon<br />
Based on the key findings comparing <strong>embodied</strong> <strong>carbon</strong> to operational <strong>carbon</strong>, <strong>emissions</strong> by <strong>building</strong><br />
type and <strong>sector</strong>, and <strong>emissions</strong> from material type, <strong>embodied</strong> <strong>carbon</strong> increasingly impacts the health of<br />
our environment. There are steps Denver can take to reduce the <strong>embodied</strong> <strong>carbon</strong> <strong>emissions</strong> on the<br />
planet. The following set of best practices may be used by Denver as it considers widening <strong>building</strong><br />
policies to address both operational and <strong>embodied</strong> <strong>carbon</strong> <strong>emissions</strong>.<br />
<br />
<br />
Prevent.<br />
o Reuse and repurpose existing <strong>building</strong>s – establish an adaptative reuse policy.<br />
o Use salvaged <strong>building</strong> materials in new construction.<br />
o Consider adaptive reuse during initial design to ensure that <strong>building</strong>s can be used for<br />
different purposes over their lifetime.<br />
Reduce and optimize.<br />
o Understand which materials contribute the most; limit their use.<br />
o Require transparent product documentation such as environmental product declarations<br />
(EPDs) to help decide which low-<strong>carbon</strong> materials to use.<br />
o Limit the use of and replace materials with the most <strong>embodied</strong> <strong>carbon</strong>.<br />
o Involve the structural engineers from the onset. The greatest amount of <strong>embodied</strong> <strong>carbon</strong><br />
is emitted from the <strong>building</strong>’s structural system – concrete, steel, or wood. Ensure<br />
composite design using concrete and steel are prioritized.<br />
Denver’s Building Sector Embodied Carbon Emissions Page 11
o<br />
o<br />
o<br />
o<br />
o<br />
o<br />
o<br />
o<br />
Plan.<br />
o<br />
o<br />
Denver should require concrete containing supplemental cementitious materials like fly<br />
ash or blast-furnace slag in place of Portland cement to be included in construction<br />
specifications.<br />
Avoid over-engineering <strong>building</strong> designs to reduce use of concrete, wood, and steel.<br />
If using steel, use steel sourced from North America, which typically has a lower <strong>carbon</strong><br />
footprint than steel manufactured overseas. Pueblo, CO plans to have the world’s first<br />
solar-powered steel mill. This factory will create jobs in the local economy, while lowering<br />
the <strong>carbon</strong> <strong>emissions</strong> impact.<br />
Require at least 50% recycled steel content in construction specifications.<br />
Use Forest Stewardship Council (FSC) certified wood and salvaged wood.<br />
Minimize aluminum curtainwalls.<br />
Use alternatives to foam insulations types that have high global warming potentials.<br />
Consider sourcing materials that meet steel and concrete low-<strong>embodied</strong> <strong>carbon</strong><br />
guidelines: ResponsibleSteel and Concrete Sustainability Council.<br />
Consider the end-of-life use – provide salvaged materials to another project or reuse<br />
<strong>building</strong>.<br />
Design for Deconstruction – Design <strong>building</strong> assemblies to make <strong>building</strong> materials more<br />
easily salvageable.<br />
Denver’s Building Sector Embodied Carbon Emissions Page 12
Recommendations for Policy Development<br />
Best practices will certainly make an impact, and policy development can create regulations and develop<br />
accountability measures to protect the environment. Integrate best practices 2 into policy design and<br />
further consider:<br />
<br />
<br />
<br />
<br />
<br />
<br />
<br />
<br />
<br />
<br />
<br />
<br />
Prioritizing <strong>building</strong> and home types with the greatest <strong>embodied</strong> <strong>carbon</strong> emission factors and<br />
most square footage when developing <strong>embodied</strong> <strong>carbon</strong> policies as well as those that<br />
contribute the most <strong>emissions</strong> to Denver’s <strong>building</strong> stock.<br />
Prioritizing <strong>embodied</strong> <strong>carbon</strong> <strong>building</strong> policies that address the commercial <strong>sector</strong>.<br />
From an annual operational <strong>carbon</strong> perspective, developing <strong>embodied</strong> <strong>carbon</strong> emission policies<br />
that affect <strong>building</strong> practices when operational <strong>emissions</strong> start to decline – in the latter half of<br />
the 2020s but no later than 2030.<br />
From a lifetime operational <strong>carbon</strong> perspective, developing <strong>embodied</strong> <strong>carbon</strong> emission policies<br />
that affect <strong>building</strong> practices when operational <strong>emissions</strong> become less dominant, in <strong>2021</strong>.<br />
Encouraging or mandating low-<strong>embodied</strong> <strong>carbon</strong> material types.<br />
Providing incentives or requirements for the use of low-<strong>carbon</strong> construction materials.<br />
Encouraging adaptive reuse policies for existing <strong>building</strong>s to avoid additional <strong>embodied</strong> <strong>carbon</strong><br />
<strong>emissions</strong>.<br />
Facilitating the development of construction material recycling and reuse programs, facilities,<br />
and networks.<br />
Developing a net-zero <strong>embodied</strong> <strong>carbon</strong> <strong>building</strong> policy, including:<br />
o Zoning for more multi-unit dwellings.<br />
o Removing minimum home size restrictions to allow for smaller dwellings.<br />
Including <strong>embodied</strong> <strong>carbon</strong> goals in <strong>building</strong> codes.<br />
Requiring <strong>building</strong> specs to include materials with a minimum percentage recycled content.<br />
Developing the <strong>building</strong> code to accommodate low <strong>embodied</strong> <strong>carbon</strong> <strong>building</strong> materials such as<br />
rammed earth or adobe block.<br />
2<br />
Includes guidance from the USDN Sustainable Consumption Toolkit.<br />
Denver’s Building Sector Embodied Carbon Emissions Page 13
APPENDIX A – CALCULATION METHODOLOGY<br />
How Denver’s Embodied Carbon is Measured<br />
We analyzed <strong>embodied</strong> <strong>carbon</strong> <strong>emissions</strong> by <strong>building</strong> type and by material type. Our analysis shows:<br />
<br />
<br />
<br />
<br />
Which <strong>building</strong> types produce the most <strong>embodied</strong> <strong>carbon</strong>.<br />
How <strong>emissions</strong> change over time.<br />
A comparison between <strong>embodied</strong> and operational <strong>emissions</strong>.<br />
Which materials should be used to lower <strong>embodied</strong> <strong>carbon</strong> footprints.<br />
Emissions by Building Type<br />
The following outlines our approach to estimating <strong>embodied</strong> <strong>carbon</strong> <strong>emissions</strong> from both existing and<br />
new <strong>building</strong>s. Detailed calculations can be referenced in the accompanying spreadsheet.<br />
1. Identified existing and new <strong>building</strong> square footage.<br />
a. Denver provided new construction square footage data from a Dodge Data dataset. We<br />
used this dataset to determine:<br />
i. Main <strong>building</strong> types. To stay consistent with Denver’s <strong>building</strong> policies, we<br />
included multi-family (MFU) (i.e., Dodge Data’s “apartments”) with the<br />
commercial <strong>sector</strong>; the residential <strong>sector</strong> only included Dodge Data’s categories<br />
of one-family houses (i.e., single-family homes) and two-family houses.<br />
ii. Additional square footage is built each year from 2019 until 2023 per <strong>building</strong><br />
type.<br />
iii. Average annual growth per <strong>building</strong> type, where a negative value indicates that<br />
there are fewer square feet of new <strong>building</strong>s being added each year.<br />
b. After 2023, we assumed a 1.5 percent growth every year based on predictions from<br />
Denver’s Assessor.<br />
c. We determined the total existing <strong>building</strong> stock data in two ways. Commercial <strong>sector</strong><br />
square footage was taken from the 2019 GHG inventory. Residential square footage was<br />
taken from Denver's Open Data Catalog. The total square footage equaled the sum of a<br />
finished basement, garden level, and above grade areas. Denver Open Data Catalog<br />
showed that duplexes and triplexes represented less than 0.001 percent of the total<br />
residential square footage.<br />
d. Existing square footage data was not available by <strong>building</strong> type. Therefore, we assumed<br />
the percent of existing square footage per <strong>building</strong> type using Energize Denver’s<br />
benchmarking dataset. We applied this distribution to the total square footage to<br />
estimate the existing square footage of <strong>building</strong>s per type.<br />
Denver’s Building Sector Embodied Carbon Emissions Page 14
Sector<br />
Dodge dataset <strong>building</strong> types<br />
Percent of total based<br />
on SF<br />
2019 Square<br />
Footage<br />
Amusement, Social and Recreational Bldgs 2% 15,210,338<br />
Dormitories 1% 5,456,090<br />
Government Service Buildings 1% 3,162,937<br />
Hospitals and Other Health Treatment 2% 10,440,476<br />
Hotels and Motels 5% 28,070,463<br />
Manufacturing Plants, Warehouses, Labs 8% 52,077,439<br />
Commercial<br />
Miscellaneous Nonresidential Buildings 23% 145,754,765<br />
Office and Bank Buildings 18% 110,390,419<br />
Parking Garages and Automotive Services 0.4% 2,788,246<br />
Religious Buildings 1% 3,824,169<br />
Schools, Libraries, and Labs (nonmfg) 7% 43,156,795<br />
Stores and Restaurants 1% 5,135,227<br />
Warehouses (excl. manufacturer owned) 5% 29,807,714<br />
Multifamily Apartments 27% 166,655,585<br />
Total square footage<br />
100% 621,930,664<br />
Residential<br />
Single Family 99.999% 264,818,339<br />
Other 0.001% 2,648<br />
Total square footage<br />
100% 264,820,987<br />
Figure 9. Building type distribution by square feet.<br />
e. Annual totals of square footage per <strong>building</strong> type were calculated by summing the<br />
square footage of existing <strong>building</strong> stock with Dodge Data’s projections of square<br />
footage.<br />
2. Retrieved <strong>embodied</strong> <strong>carbon</strong> emission factors. Using CLF’s Embodied Carbon Benchmark<br />
Research, we captured <strong>embodied</strong> <strong>carbon</strong> emission factors per square footage for different<br />
<strong>building</strong> types.<br />
3. Aligned Dodge Data <strong>building</strong> types with CLF’s <strong>building</strong> types. The <strong>building</strong> type definitions<br />
differed between CLF and Dodge Data’s datasets. We aligned the <strong>building</strong> types and assigned the<br />
emission factors to each. See Figure 10.<br />
Sector CLF Building Type Dodge Data Building Type<br />
Embodied Carbon<br />
Emissions (mt CO 2 e / m 2)<br />
Embodied Carbon<br />
Emissions (mt CO 2 e / ft 2 )<br />
Commercial<br />
Residential<br />
Education Schools, Libraries, and Labs (nomfg) 0.4606 0.0428<br />
Health Care Hospitals and Other Health Treatment 0.5116 0.0475<br />
Lodging Dormitories, Hotels and Motels 0.3525 0.0327<br />
Mercantile Stores and Restaurants 0.4788 0.0445<br />
Mixed Use Amusement, Social and Recreational Bldgs 0.4698 0.0436<br />
Office Government Service Buildings, Office and Bank Buildings 0.3246 0.0302<br />
Other Miscellaneous Nonresidential Buildings 0.5709 0.0530<br />
Parking Parking Garages and Autmotive Services 0.3402 0.0316<br />
Public Assembly Religious Buildings 0.5224 0.0485<br />
Warehouse<br />
Warehouses (excl manufacturer owned), Manufacturing Plans,<br />
Warehouses, Labs<br />
0.396 0.0368<br />
Multifamily Apartments 0.3468 0.0322<br />
Single Family One-Family Houses 0.2198 0.0204<br />
Other Two-Family Houses 0.2343 0.0218<br />
Figure 2. Embodied <strong>carbon</strong> emission factors by <strong>building</strong> type.<br />
4. Calculated <strong>embodied</strong> <strong>carbon</strong> <strong>emissions</strong> by <strong>building</strong> type. We multiplied Denver’s square footage<br />
from each <strong>building</strong> type by the <strong>embodied</strong> <strong>carbon</strong> emission factor for that <strong>building</strong> type to show<br />
<strong>embodied</strong> <strong>carbon</strong> by <strong>building</strong> type and total and annual increases in <strong>embodied</strong> <strong>carbon</strong>.<br />
Denver’s Building Sector Embodied Carbon Emissions Page 15
5. Calculated annual and lifetime (i.e., cumulative) <strong>embodied</strong> <strong>carbon</strong> <strong>emissions</strong> for existing and<br />
new <strong>building</strong>s and homes. To better understand the comparison between operational and<br />
<strong>embodied</strong> <strong>carbon</strong>, we separated <strong>embodied</strong> <strong>carbon</strong> from existing and new <strong>building</strong>s.<br />
a. Embodied <strong>carbon</strong> <strong>emissions</strong> from existing <strong>building</strong>s assumed the following:<br />
i. Embodied <strong>carbon</strong> <strong>emissions</strong> grew at the rate of square footage growth.<br />
ii. Operational <strong>emissions</strong> from 2005 until 2019 were taken from Denver’s GHG<br />
emission inventories. Operational <strong>emissions</strong> before 2005 were estimated<br />
assuming that:<br />
a. Natural gas <strong>emissions</strong> and electricity consumption decreased by the<br />
average annual <strong>building</strong> stock growth rate of 1.5 percent (Denver<br />
provided the assumed increase in overall <strong>building</strong> stock growth).<br />
b. The 2005 emission factor remained constant. The back casted<br />
operational <strong>emissions</strong> were the sum of the estimated natural gas and<br />
electricity <strong>emissions</strong>.<br />
b. Embodied <strong>carbon</strong> <strong>emissions</strong> from new <strong>building</strong>s considered the following:<br />
i. Operational <strong>emissions</strong> past 2020 were calculated assuming:<br />
a. Xcel’s emission factors gradually decreased until their GHG emission<br />
targets were reached in 2030 and 2050.<br />
b. Denver will be 100 percent renewable by 2030.<br />
c. New builds in 2020 follow the 2018 International Energy Conservation<br />
Code (IECC), new builds in <strong>2021</strong> through 2024 follow the <strong>2021</strong> IECC, and<br />
new builds in 2024 through 2025 follow the 2024 IECC.<br />
d. Per Denver’s net zero energy goals 3 : all new homes will be all electric<br />
by 2024 and all new <strong>building</strong>s will be all electric by 2027.<br />
e. Per Denver’s Climate Action Task Force goals 4 : all existing <strong>building</strong>s and<br />
homes will be all electric by 2040, with a linear increase in adoption of<br />
7 percent starting in 2026.<br />
f. Per projections provided to Denver’s Energize Denver Task Force,<br />
Denver’s <strong>building</strong>s will see an incremental increase in efficiency of 3<br />
percent each year between 2026 and 2031.<br />
g. The <strong>2021</strong> IECC will require an energy use index (EUI) value of 10 percent<br />
less than the 2018 IECC iii , and each subsequent IECC will be 10 percent<br />
more efficient than the previous IECC. .<br />
h. Residential and commercial EUI values for the 2018 and <strong>2021</strong> IECC were<br />
assumed based on recent research from the Pacific National<br />
Laboratories and the Department of Energy.<br />
i. Climate Zone 5 was used.<br />
j. Buildings’ and homes’ total energy consumption is approximately 50<br />
percent natural gas and 50 electricity.<br />
3<br />
For more information visit Denver’s Net Zero New Buildings & Homes website.<br />
4<br />
For more information see Denver’s Climate Action 2020 Recommendations Report.<br />
Denver’s Building Sector Embodied Carbon Emissions Page 16
DENVER’S BUILDING STOCK<br />
As Denver’s <strong>building</strong> stock grows, more <strong>embodied</strong> <strong>carbon</strong> <strong>emissions</strong> will be created. Metro Denver has a<br />
population of more than 3 million. iv The region grew steadily in the past 10 years, and by 2030, Metro<br />
Denver's population is anticipated to reach more than 3.6 million. v This growth leads to more home and<br />
<strong>building</strong> construction. Denver completed an analysis with Dodge Data and Analytics data (Dodge Data)<br />
on projected new construction from 2014 to 2023 (see Figure 11). vi This dataset suggests that <strong>embodied</strong><br />
<strong>carbon</strong> <strong>emissions</strong> have oscillated between 2014 and 2019 and will continue to change at different rates<br />
until 2023, but generally, <strong>embodied</strong> <strong>carbon</strong> <strong>emissions</strong> are expected to increase compared to the 2014<br />
value.<br />
20,000<br />
Square Footage (1,000)<br />
15,000<br />
10,000<br />
5,000<br />
0<br />
12,091 12,422<br />
2014 2015 2016 2017 2018 2019 2020 <strong>2021</strong> 2022 2023<br />
Amusement, Social and Recreational Bldgs<br />
Government Service Buildings<br />
Hotels and Motels<br />
Miscellaneous Nonresidential Buildings<br />
Parking Garages and Automotive Services<br />
Schools, Libraries, and Labs (nonmfg)<br />
Warehouses (excl. manufacturer owned)<br />
One-family Houses<br />
Total New Build Square Footage (thousand sf)<br />
Dormitories<br />
Hospitals and Other Health Treatment<br />
Manufacturing Plants, Warehouses, Labs<br />
Office and Bank Buildings<br />
Religious Buildings<br />
Stores and Restaurants<br />
Apartments<br />
Two-family Houses<br />
Figure 11. Expected square footage growth per <strong>building</strong> type. vii<br />
Denver’s Assessor’s data predicts that square footage will increase at a conservative rate of 1.5 percent<br />
per year after 2023 based on historic patterns between 1997 and 2016. viii<br />
While Denver expects operational <strong>emissions</strong> to decrease over time, <strong>embodied</strong> <strong>carbon</strong> <strong>emissions</strong> are<br />
likely to grow if there is no intervention. Unlike operational <strong>emissions</strong>, <strong>embodied</strong> <strong>carbon</strong> <strong>emissions</strong> are<br />
“irreversible” and are emitted once a <strong>building</strong>’s materials are made and the <strong>building</strong> is constructed. Even<br />
in the case of net zero energy new construction, the construction materials themselves have<br />
contributed such high <strong>emissions</strong> in their extraction and refining, that the <strong>building</strong> is essentially emitting<br />
for decades, see Figure 12.<br />
Denver’s Building Sector Embodied Carbon Emissions Page 17
Figure 12: Hypothesized Time of Carbon. ix<br />
Recognizing the impact this has on the global <strong>building</strong> <strong>sector</strong> <strong>emissions</strong>, green <strong>building</strong> experts are now<br />
encouraging practices that reduce <strong>embodied</strong> <strong>carbon</strong>, primarily in the early planning phases.<br />
Emissions by Material Type<br />
The following outlines our approach to estimating <strong>embodied</strong> <strong>carbon</strong> <strong>emissions</strong> from low- and high<strong>embodied</strong><br />
<strong>carbon</strong> materials. Detailed calculations can be referenced in the accompanying spreadsheet.<br />
1. Defined seven common <strong>building</strong> materials used in construction: Material inputs included material<br />
types, material specifications, and unit of material used. Concrete, Rebar, Framing, Sheathing,<br />
Insulation, Gypsum board, and Carpet. These were based on the available data in the CLF’s<br />
Embodied Carbon in Construction Calculator Tool. See Table 2.<br />
Denver’s Building Sector Embodied Carbon Emissions Page 18
Table 1. Carbon <strong>emissions</strong> by material type.<br />
Material<br />
Amount of material<br />
needed for 2019<br />
home size<br />
Unit of<br />
Material<br />
Standard Embodied<br />
Carbon Estimate (kg<br />
CO 2e)<br />
Standard Embodied<br />
Carbon Estimate<br />
(mt CO 2e)<br />
Low-<strong>carbon</strong><br />
Embodied Carbon<br />
Estimate (kg CO 2e)<br />
Low-<strong>carbon</strong><br />
Embodied Carbon<br />
Estimate (mt CO 2e)<br />
Concrete 10.79 1 yd3 4,370.28 4.37 2,244.49 2.24<br />
Rebar 20,285.62 1 lb. 12,779.94 12.78 6,349.40 6.35<br />
Framing 235.43 1 yd3 13,725.64 13.73 5,509.09 5.51<br />
Sheathing 42.54 1 yd3 10,592.40 10.59 5,189.85 5.19<br />
Insulation 3,216.15 1 ft2 9,005.21 9.01 749.36 0.75<br />
Gypsum Board 3.37 1000 ft2 1,704.46 1.70 784.86 0.78<br />
Carpet 2,384.00 1 ft2 3,599.85 3.60 1,995.41 2.00<br />
Total Embodied Carbon 55,777.78 55.78 22,822.46 22.82<br />
Difference between low- and standard <strong>embodied</strong> <strong>carbon</strong> houses 59%<br />
2. The defined average size of a residential single-family house in the US. According to the US EPA,<br />
the average size of a single-family residential house in the US in 2019 was 2,301 square feet.<br />
3. Collected high- and low-end estimates of <strong>embodied</strong> <strong>carbon</strong> emission factors for each material in<br />
CLF’s Embodied Carbon in Construction Calculator Tool. The low-end estimate is called<br />
“achievable” and the high-end estimate is called “conservative” in the Tool.<br />
4. Researched the average amount of the seven materials used in a typical residential house. These<br />
values were converted to the average value per square foot of house for ease of calculations.<br />
a. Calculated high- and low-end estimates of <strong>embodied</strong> <strong>carbon</strong> in an average US<br />
residential house.<br />
General Embodied Carbon Calculation Approaches<br />
Embodied <strong>carbon</strong> emission factors (also referred to as <strong>carbon</strong> intensity) are a component of a life-cycle<br />
assessment (LCA) calculation, which is commonly based on calculation methodologies from ISO 14040<br />
and ISO 14044 x . Embodied <strong>carbon</strong> emission factors typically provide an estimate of <strong>carbon</strong> generated<br />
per weight of the material. Unfortunately, it is difficult to compare different material weights (i.e., the<br />
weight of wood needed to construct a <strong>building</strong> versus the weight of steel) for all <strong>building</strong>s. Therefore,<br />
many <strong>embodied</strong> <strong>carbon</strong> analyses use environmental production declarations (EPDs) in place of standard<br />
emission factors. While EPDs are not always calculated consistently and some <strong>building</strong> experts caution<br />
using EPDs, EPDs are accompanied by transparent calculation documentation, and their use is frequently<br />
cited as the most objective way to compare products and select low-<strong>carbon</strong> materials. EPDs are used to<br />
compare a baseline or status-quo product or combination of products (i.e., an assortment of <strong>building</strong><br />
materials or a <strong>building</strong>) against an alternative low-<strong>carbon</strong> scenario.<br />
Denver’s Building Sector Embodied Carbon Emissions Page 19
Several free and fee-for-service EPDs databases have been developed, including:<br />
<br />
<br />
<br />
<br />
<br />
mindful MATERIALS.<br />
The International EPD System.<br />
Sustainable Minds.<br />
UL SPOT.<br />
CLF’s Embodied Carbon in Construction Calculator tool.<br />
The International Living Future Institute, a nonprofit designed to help <strong>building</strong>s achieve zero <strong>embodied</strong><br />
<strong>carbon</strong> certifications, has approved all of the databases listed above.<br />
Ideally, <strong>embodied</strong> <strong>carbon</strong> <strong>emissions</strong> would be estimated using a detailed <strong>building</strong> LCA. This analysis<br />
requires software modeling and is beyond the scope of this effort. Life-cycle analyses are complicated,<br />
rely on a variety of inputs from different sources (that do not always align), and are best used to<br />
examine <strong>emissions</strong> from a particular <strong>building</strong> or structure rather than an entire community. The<br />
International Living Future Institute approved the following tools to complete LCA analyses:<br />
<br />
<br />
<br />
<br />
<br />
Athena Impact Estimator.<br />
Environment Agency’s Carbon Calculator.<br />
eTool.<br />
One-Click LCA.<br />
Tally.<br />
LIMITATION OF ANALYSIS<br />
While the practice of quantifying <strong>emissions</strong> through an LCA has been around for a decade or more, the<br />
practical application of LCA findings and <strong>embodied</strong> <strong>carbon</strong> <strong>emissions</strong> has not been widely adopted, and<br />
is, therefore, relatively new. This produces extensive limitations.<br />
Varying perspectives on <strong>embodied</strong> <strong>carbon</strong> contributions. The Concrete Sustainability Hub of<br />
Massachusetts Institute of Technology wrote, “The operational phase of a <strong>building</strong>, however, makes the<br />
largest contribution to the life cycle impacts of a structure and can overshadow the <strong>embodied</strong><br />
<strong>emissions</strong>.” xi And “When the GWP [Global Warming Potential] for the total life cycle is calculated, it<br />
becomes clear that the <strong>embodied</strong> <strong>emissions</strong> are a small fraction of the life cycle <strong>emissions</strong>...” xii While<br />
the World Green Building Council xiii , the International Living Future Institute xiv , and Building Green xv note<br />
that operational and <strong>embodied</strong> <strong>emissions</strong> may contribute equally to a <strong>building</strong>’s overall <strong>emissions</strong> today,<br />
xvi<br />
<strong>embodied</strong> <strong>carbon</strong> <strong>emissions</strong> are expected to be more significant over the next several years and may<br />
represent up to 90 percent of a <strong>building</strong>’s total <strong>emissions</strong> by 2050 xvii . The baseline assumptions (i.e., grid<br />
makeup, etc.) from which each organization builds its calculations heavily influence the role of<br />
<strong>embodied</strong> <strong>carbon</strong> contributions.<br />
Denver’s Building Sector Embodied Carbon Emissions Page 20
Varying data inputs and complicated calculation<br />
methodologies. Because of the wide range of data<br />
inputs and the seemingly new calculation approach,<br />
LCA and <strong>embodied</strong> <strong>carbon</strong> <strong>emissions</strong> are complicated<br />
to calculate. Many calculations rely on proprietary<br />
software calculation tools and <strong>embodied</strong> <strong>carbon</strong><br />
<strong>emissions</strong> are the sum of individual metrics, such as<br />
EPDs. Plus, since the calculation methodology requires<br />
a reference and alternative state, it can be difficult to<br />
accurately complete these calculations on a large scale.<br />
“The more we’ve dug, the more [the<br />
numbers] seem to be all over the<br />
place. There is so much uncertainty<br />
carried with them.” Regarding<br />
uncertainty when comparing<br />
<strong>embodied</strong> <strong>carbon</strong> <strong>emissions</strong> of wood<br />
to steel and concrete. -- Frances Yang<br />
with Arup<br />
Emerging field with no standard guidance. Embodied <strong>carbon</strong> emission factors vary among sources. The<br />
Massachusetts Institute of Technology’s Methods, Impacts, and Opportunities in the Concrete Building<br />
Life Cycle states “The life cycle assessment of <strong>building</strong>s is now a well-established field and yet there is<br />
still no internationally agreed-upon standard for <strong>building</strong> LCAs.” LCAs form the basis for <strong>embodied</strong><br />
<strong>carbon</strong> emission factor methodologies.<br />
Definitions can vary. Even the definition of <strong>embodied</strong> <strong>carbon</strong> can vary. Some include a <strong>building</strong>’s<br />
operational <strong>emissions</strong>, while the majority do not.<br />
Based on the data available and the scope of our analysis, we recommend estimating <strong>embodied</strong> <strong>carbon</strong><br />
<strong>emissions</strong> on a <strong>building</strong> type basis using CLF’s emission factors per <strong>building</strong> type and by looking at the<br />
impacts of choosing low- and high-<strong>embodied</strong> <strong>carbon</strong> materials in a new build.<br />
i<br />
For more information see: https://journal-<strong>building</strong>scities.org/articles/10.5334/bc.31/.<br />
ii<br />
For more information see https://<strong>building</strong>transparency-live-87c7ea3ad4714-809eeaa.diviomedia.com/filer_public/32/d5/32d56e02-4513-4357-ab65-f3cd364e2c10/wc_ammaterialscanspotlightec<strong>building</strong>green2020.pdf.<br />
iii<br />
For more information see: https://new<strong>building</strong>s.org/code_policy/<strong>2021</strong>-iecc-base-codes/.<br />
iv<br />
Refer to U.S. American Factfinder.<br />
v<br />
http://www.metrodenver.org/dobusiness/demographics/population/#:~:text=Metro%20Denver%20has%20a%20population,to%20more%20than%2<br />
03.6%20million<br />
vi<br />
Analytics, D. D. (2019). Dodge_DenverCntyConstrStarts_19Q2_withPercentChng.<br />
vii<br />
Analytics, D. D. (2019). Dodge_DenverCntyConstrStarts_19Q2_withPercentChng.<br />
viii<br />
For more information refer to Denver’s spreadsheet Building Stock Growth, 1.5%, 8-1-19.<br />
ix<br />
Ecological Building Network. (2015). The Total Carbon Study. Retrieved from<br />
https://www.ecobuildnetwork.org/images/pdfs/The_Total_Carbon_Study_FINAL_White_Paper_published_2015111<br />
3.pdf and<br />
Ecological Citizen's Project, T. o.-L. (2020). Sink, Store, Reduce, Offset: Philipstown Inventory Report. Retrieved from<br />
https://philipstown.com/cs/2020-CSCommunityGHGEmissionsInventory.pdf<br />
x<br />
For more information see https://www.iso.org/standard/37456.html.<br />
xi<br />
For more information see https://dspace.mit.edu/handle/1721.1/105108.<br />
xii<br />
Ibid.<br />
xiii<br />
For more information see https://www.worldgbc.org/news-media/bringing-<strong>embodied</strong>-<strong>carbon</strong>-upfront.<br />
xiv<br />
For more information see https://trimtab.living-future.org/<strong>embodied</strong>-<strong>carbon</strong>/<strong>embodied</strong>-<strong>carbon</strong>-guidance-whatis-it-and-why-do-we-need-it/.<br />
Denver’s Building Sector Embodied Carbon Emissions Page 21
xv<br />
For more information see https://www.<strong>building</strong>green.com/feature/urgency-<strong>embodied</strong>-<strong>carbon</strong>-and-what-you-cando-about-it.<br />
xvi<br />
For more information see https://www.<strong>building</strong>transparency.org/en/materialscan/.<br />
xvii For more information see https://<strong>building</strong>transparency-live-87c7ea3ad4714-809eeaa.diviomedia.com/filer_public/32/d5/32d56e02-4513-4357-ab65-f3cd364e2c10/wc_ammaterialscanspotlightec<strong>building</strong>green2020.pdf.<br />
Denver’s Building Sector Embodied Carbon Emissions Page 22