Commerce City FINAL Action Plan for Sustainability_020623

Create successful ePaper yourself
Turn your PDF publications into a flip-book with our unique Google optimized e-Paper software.
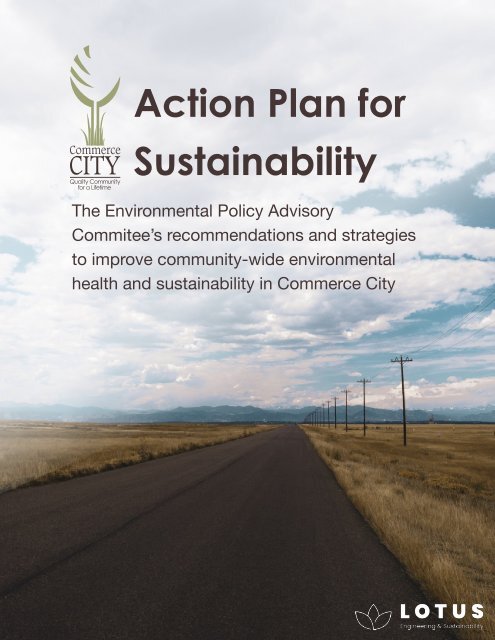
<strong>Action</strong> <strong>Plan</strong> <strong>for</strong><br />
<strong>Sustainability</strong><br />
The Environmental Policy Advisory<br />
Commitee’s recommendations and strategies<br />
to improve community-wide environmental<br />
health and sustainability in <strong>Commerce</strong> <strong>City</strong><br />
1
Table of Contents<br />
Section<br />
Acronyms and Abbreviations <br />
Land Acknowledgement <br />
Acknowledgements <br />
Letter from the Environmental Policy Advisory Committee <br />
Executive Summary ES 1<br />
Introduction 1<br />
Local <strong>Sustainability</strong> Work 3<br />
2022 Environmental Policy Recommendations 6<br />
Organizational <strong>Sustainability</strong> Recommendations 9<br />
Environmental Justice, Vulnerability, and Climate Equity 12<br />
Assessment of Air Quality Conditions and Concerns 16<br />
Assessment of Water Quality Conditions and Concerns 23<br />
Greenhouse Gas Inventory 28<br />
Strategy Models 35<br />
A Public Engagement-Driven Process 40<br />
<strong>Sustainability</strong> Focus Areas and Priorities 44<br />
Education and Outreach 49<br />
Energy Efficiency 56<br />
Renewable Energy 65<br />
Adaptation and Mitigation 71<br />
Recycling and Waste Diversion 74<br />
Water 81<br />
Transportation 87<br />
Community Health 98<br />
Funding and Economy 107<br />
Biodiversity, Tree Canopy, and Food 110<br />
Leading by Example 120<br />
Next Steps and Implementation 121<br />
Page<br />
i<br />
ii<br />
iii<br />
iv
Table of Contents<br />
Appendix<br />
Page<br />
Appendix A. <strong>Action</strong>s Matrix in Implementation Timeline Order 123<br />
Appendix B. Air and Water Quality Technical Documents 141<br />
Community-Wide Impacts Report 141<br />
Air Monitoring <strong>Plan</strong> Memo 189<br />
Modeling Thresholds Report 208<br />
Modeling Guidance Document 228<br />
Oil and Gas <strong>Plan</strong> Submittal Guidance Memo 251<br />
Air Quality Emissions Reduction Guidance 255<br />
Identification of Potential Point and Nonpoint Sources of Impacts to Water Quality 268<br />
Water Quality Evaluation, Summary, and Recommendations Memo 278<br />
Appendix C. Resolutions <strong>for</strong> Consideration 301<br />
Standing Environmental Policy Advisory Committee Resolution 301<br />
Measurable <strong>Sustainability</strong> Goals Resolution 304<br />
EV GO Resolution 305<br />
Low Impact Development Resolution 307<br />
Anti-Idling Ordinance 310<br />
Cardboard Recycling Ordinance 316<br />
Construction and Demolition Ordinance 318<br />
Appendix D. Community Engagement and Education 319<br />
Appendix E. Community Survey and Intercept Interviews 322<br />
Appendix F. Municipal Government Implementation <strong>Plan</strong> 329
Table of Contents<br />
Figures<br />
Page<br />
Figure ES 1 Total 2019 GHG emissions <br />
Figure ES 2 Core 2019 GHG emissions <br />
Figure ES 3 Share of emissions reductions by strategy type based on modeling <br />
Figure 1 <strong>Commerce</strong> <strong>City</strong>’s EPA EJScreen report 13<br />
Figure 2 Environmental Justice burden in <strong>Commerce</strong> <strong>City</strong> 14<br />
Figure 3 Ozone pollution in <strong>Commerce</strong> <strong>City</strong> relative to national levels 15<br />
Figure 4 Air quality study area 18<br />
Figure 5 VOC facilities 19<br />
Figure 6 Existing air monitors in <strong>Commerce</strong> <strong>City</strong> 20<br />
Figure 7 Point and nonpoint source pollution map 25<br />
Figure 8 Total 2019 GHG emissions 30<br />
Figure 9 Stationary emissions detail 32<br />
Figure 10 Core 2019 GHG emissions 32<br />
Figure 11 Business-as-Usual GHG emissions projections to 2050 34<br />
Figure 12 Emissions reduction model results 35<br />
Figure 13 Share of emissions reductions by strategy type based on modeling 39<br />
Figure 14 Community board in Spanish 50<br />
Figure 15 Energy burden in <strong>Commerce</strong> <strong>City</strong> 57<br />
Figure 16 Regional and local EV charging stations 88<br />
Figure 17 EPA EJ Screen results showing air toxics respiratory risk in <strong>Commerce</strong> <strong>City</strong> 99<br />
Figure 18 EPA EJ Screen results showing air toxics cancer risk in <strong>Commerce</strong> <strong>City</strong> 99<br />
Figure 19 <strong>Commerce</strong> <strong>City</strong>’s tree equity score 112<br />
Tables<br />
Page<br />
Table 1 <strong>Commerce</strong> <strong>City</strong>’s EJ Index, 2021 14<br />
Table 2 Annual tons of criteria air pollutant by local county, 2021 16<br />
Table 3 <strong>Commerce</strong> <strong>City</strong>’s GHG emissions compared with regional and national<br />
counterparts <br />
Table 4 <strong>Commerce</strong> <strong>City</strong>’s total 2019 GHG emissions by source and sector 31<br />
Table 5 <strong>Commerce</strong> <strong>City</strong>’s <strong>Sustainability</strong> Aspirations 37<br />
ES4<br />
ES5<br />
ES6<br />
29
Acronyms & Abbreviations<br />
AKA<br />
AQ<br />
BACT<br />
BAU<br />
C3<br />
C&D<br />
CDOT<br />
CDPHE<br />
COGCC<br />
DI<br />
EJ<br />
EPA<br />
EPAC<br />
EV<br />
GHG<br />
GPC<br />
HAP<br />
HOA<br />
HVAC<br />
ICE<br />
Also Known As<br />
Air Quality<br />
Best Available Control<br />
Technology<br />
Business-As-Usual<br />
<strong>Commerce</strong> <strong>City</strong><br />
Construction and Demolition<br />
Colorado Department of<br />
Transportation<br />
Colorado Department of Public<br />
Health and the Environment<br />
Colorado Oil and Gass<br />
Conservation Comission<br />
Disproportionally Impacted<br />
Environmental Justice<br />
United States Environmental<br />
Protection Agency<br />
Environmental Policy Advisory<br />
Committee<br />
Electric Vehicle<br />
Greenhouse Gas<br />
Global Protocol <strong>for</strong> Community-<br />
Scale GHG Inventories<br />
Hazardous Air Pollutant<br />
Homeowners Association<br />
Heating, Ventilation, and Air<br />
Conditioning<br />
Internal Combustion Engine<br />
IPPU<br />
LID<br />
MS4<br />
mt CO2e<br />
NAAQS<br />
NOx<br />
PFAS/<br />
PFOA<br />
PM<br />
PV<br />
RTD<br />
SACWSD<br />
SOx<br />
State<br />
TMDL<br />
VOC<br />
WQ<br />
Industrial Processes and Product<br />
Use<br />
Low Impact Development<br />
Municipal Separate Storm Sewer<br />
System Permit<br />
Metric tons of carbon dioxide<br />
equivalent<br />
National Ambient Air Quality<br />
Standards<br />
Nitrogen Oxides (including<br />
Nitric Oxide and Nitrogen<br />
Dioxide)<br />
Perfluoroalkyl and<br />
Polyfluoroalkyl Substances and<br />
Perfluorooctanoic Acid<br />
Particulate Matter (Numbers<br />
associated with PM refer to<br />
the size classification of the<br />
particles)<br />
Solar Photovoltaic<br />
Regional Transportation District<br />
South Adams County Water and<br />
Sanitation District<br />
Sulfur Oxides<br />
State of Colorado<br />
Total Maximum Daily Load<br />
Volatile Organic Compounds<br />
Water Quality<br />
IECC<br />
International Energy<br />
Conservation Code<br />
ii
Land Acknowledgement<br />
The history of what we now call <strong>Commerce</strong> <strong>City</strong> begins not in 1952 as we celebrated in 2022, but<br />
centuries prior. Diving deeper into this land’s past, we see that immigrants have always come to<br />
this region searching <strong>for</strong> a place to call home, just as thousands of newcomers to <strong>Commerce</strong> <strong>City</strong><br />
have done so in recent years.<br />
In the early 1800s, what is now called Adams County became home to Arapaho and Cheyenne<br />
people who arrived in the region after being <strong>for</strong>ced out of their traditional homelands in the<br />
Midwest. Settlers then founded <strong>Commerce</strong> <strong>City</strong> on these historic Ute, Arapaho, Cheyenne, and<br />
Apache lands. Today, <strong>Commerce</strong> <strong>City</strong>’s indigenous population stands at just under one percent<br />
and we acknowledge the history of systematic removal in shaping this community.<br />
“Healing old<br />
wounds will make<br />
us stronger and<br />
more resilient<br />
<strong>for</strong> a future of<br />
uncertainty.”<br />
We recognize that we must do more to redress<br />
past and ongoing injustices. Many of the current<br />
environmental harms and community health issues<br />
we seek to remediate through this <strong>Plan</strong> trace their<br />
roots back to this history. By undertaking this work,<br />
we understand that we bear a responsibility to care<br />
<strong>for</strong> the Earth, the residents of <strong>Commerce</strong> <strong>City</strong>, and<br />
our non-human relations with respect and humility.<br />
<strong>Commerce</strong> <strong>City</strong> prides itself on our sense of<br />
community; <strong>for</strong> every individual in this <strong>City</strong> to feel<br />
equally welcomed we must commit ourselves to<br />
repairing our relationships with the tribal nations<br />
whose traditions, history, and culture leave such<br />
indelible legacies on this land. The sustainability<br />
of <strong>Commerce</strong> <strong>City</strong> means sustaining the health of<br />
our land and broader community, including Native<br />
peoples. Healing old wounds will make us stronger<br />
and more resilient <strong>for</strong> a future of uncertainty.<br />
ii
Acknowledgements<br />
<strong>Commerce</strong> <strong>City</strong> would like to express appreciation and gratitude to the many community<br />
members, businesses, and industry representatives who shared their time and energy to provide<br />
input and feedback on this work. We recognize their contributions as essential to the success of<br />
the planning process and the future implementation of the recommendations.<br />
Environmental PolicyAdvisory<br />
Committee (EPAC)<br />
Thank you to the Environmental Policy Advisory<br />
Committee (EPAC) <strong>for</strong> their time, energy, and<br />
valuable wisdom that shaped the recommendations<br />
in this <strong>Plan</strong>.<br />
Rene Bullock<br />
Laura Hellewell<br />
Melinda Larson<br />
Heather Marr<br />
Darci Martinez<br />
Richard Martinez<br />
<strong>City</strong> Council<br />
Consultant Team<br />
Lucy Molina<br />
Aracely Navarro<br />
Ronna Sanchez<br />
Trudy Smith<br />
Paul Solano<br />
Trudy Smith<br />
Thank you to the <strong>City</strong> Council members who passed<br />
Res. 2021-38 on June 7, 2021 to establish the EPAC.<br />
Mayor Benjamin Huseman<br />
Mayor Pro Tem Jennifer Allen-Thomas, Ward II<br />
Councilmember Oscar Madera, Ward I<br />
Former Councilmember Rick Davis, Ward III<br />
Councilmember Renee Millard-Chacon, Ward III<br />
Councilmember Susan Noble, Ward IV<br />
Councilmember Kristi Douglas, At Large<br />
Councilmember Sean Ford, At Large<br />
Councilmember Craig Hurst, At Large<br />
Councilmember Craig Kim, At Large<br />
Abby Bohannan, AMBG<br />
Caroline Byus, Pinyon Environmental<br />
Dustin Collins, Pinyon Environmental<br />
Anthony Der Tatevasion, Pinyon Environmental<br />
Miles Hoffman, Lotus Engineering & <strong>Sustainability</strong><br />
Brianna Johnson, Lotus Engineering & <strong>Sustainability</strong><br />
iii<br />
Business and Industry<br />
Community<br />
Dawn Ambrosio, Metro Water Recovery<br />
Erin Bertoli, Metro Water Recovery<br />
Lisha Burnett, Suncor<br />
Steve Derus, Republic Services<br />
Dan Dewaard, Advanced Disposal<br />
Dalton Ellis, Waste Connections<br />
Charlie Goldberg, Allied Aggregates<br />
Mark Petrovich, Republic Services<br />
Barrett Jensen, Waste Connections<br />
Brandy Radey, Suncor<br />
<strong>City</strong> Staff<br />
Thank you to <strong>City</strong> Staff that participated in a<br />
Working Group to further vet the recommendations.<br />
Felix Abel<br />
Kim Adame<br />
Deanna Byer<br />
Traci Ferguson<br />
Dylan Gibson<br />
Jenna Hahn<br />
Chris Hodyl<br />
Alice McCarthy<br />
Shawn Po<br />
Rosemarie Russo<br />
(Project Lead)<br />
Chad Redin<br />
Kirk Reiber<br />
Trent Robinson<br />
Jen Strauss<br />
Steve Timms<br />
Jim Tolbert<br />
Alex VanZante<br />
Ryan Webster<br />
Andrew Wozniak<br />
Pam Young<br />
Ally Mark, Lotus Engineering & <strong>Sustainability</strong><br />
Kaitlin Meszaros, Pinyon Environmental<br />
Bridget Mitchell, Pinyon Environmental<br />
Julia Newman, Lotus Engineering & <strong>Sustainability</strong><br />
Sydney Shell, Pinyon Environmental
Letter from the Environmental<br />
Policy Advisory Committee<br />
O n June 7, 2021, the <strong>City</strong> Council took a major leap into finding solutions to improve<br />
the environment in our community by establishing the Environmental Policy Advisory<br />
Committee (EPAC). This 11-member resident board was conceived to provide recommendations<br />
to the <strong>City</strong> about how to improve the environmental quality across our community. The EPAC<br />
was designed to inspire the <strong>City</strong> to create equitable environmental policies centered on the needs<br />
of populations and areas in the <strong>City</strong> that are most directly affected by negative environmental<br />
impact. The group has been meeting monthly with the <strong>City</strong> Environmental <strong>Plan</strong>ner and<br />
consultants from Lotus Engineering and <strong>Sustainability</strong> and AMBG to identify goals, policies,<br />
strategies, and regulations that will improve overall environmental quality in <strong>Commerce</strong> <strong>City</strong> to<br />
truly make <strong>Commerce</strong> <strong>City</strong> a “Quality Community <strong>for</strong> a Lifetime.”<br />
In addition to gathering research regarding current trends in sustainability, the EPAC has also<br />
received valuable input from significant stakeholders. These include members of the community,<br />
business owners, local leaders, city staff, and professionals with expertise from all areas of<br />
<strong>Commerce</strong> <strong>City</strong>, including the Core and North regions.<br />
Goals were developed <strong>for</strong> the following sectors:<br />
► Education and Outreach<br />
► Energy Efficiency and Renewable Energy;<br />
► Adaptation and Mitigation (i.e., GHG emission<br />
reductions);<br />
► Waste Diversion and Recycling;<br />
► Water Conservation and Quality Improvements;<br />
► Alternative Fuels and Active Transportation (i.e.,<br />
Air Quality)<br />
► Funding<br />
► Health Equity (i.e., Healthy Food and Medical<br />
Access)<br />
► Land Use (i.e., biodiversity and <strong>for</strong>est canopy)<br />
Sector targets from a 2019 baseline proposed by the<br />
EPAC are:<br />
► Energy use reduction by 25% by 2030;<br />
► Electrification is adopted by 15% of new buildings;<br />
► Light-duty vehicles on the road are 30% EV’s;<br />
► Idling time is reduced by 78%; and<br />
► Waste diversion increases to 85% by 2050.<br />
We are excited about the potential regarding improving our environment and remain dedicated<br />
to supporting our community and the <strong>City</strong> government in pursuit of a better environment <strong>for</strong><br />
all of <strong>Commerce</strong> <strong>City</strong>. The continued work of EPAC to support this process through becoming<br />
a permanent Committee is essential given the lack of staff dedicated to community health. As<br />
<strong>Commerce</strong> <strong>City</strong> is one of the fastest growing communities in Colorado, it is critical <strong>for</strong> us to<br />
consider the impacts we are having on our environment and what we can do to make<br />
this community a healthy, vibrant, economically sound, and quality place to live <strong>for</strong><br />
everyone.<br />
Sincerely,<br />
The Environmental Policy Advisory Committee<br />
iv
Executive Summary<br />
Environmental <strong>Action</strong> in<br />
<strong>Commerce</strong> <strong>City</strong><br />
Just 70 years after incorporation, <strong>Commerce</strong><br />
<strong>City</strong> (the <strong>City</strong>/C3) has blossomed into one<br />
of the most popular places to move to in<br />
the State of Colorado (State). Sitting on the<br />
northern edge of Denver in Adams County,<br />
C3 now boasts one of Colorado’s fastest<br />
growing economies and populations.<br />
Under these conditions, the <strong>City</strong> began<br />
updating its Comprehensive <strong>Plan</strong> to guide the<br />
next two decades of growth and development.<br />
However, the Comprehensive <strong>Plan</strong> does not<br />
address baseline data <strong>for</strong> environmental<br />
conditions, measurable targets, or numerical<br />
goals to remediate and restore vital natural<br />
resources that are critical <strong>for</strong> a thriving<br />
community. In conjunction with this major<br />
planning ef<strong>for</strong>t, the <strong>City</strong> Council issued<br />
a directive commissioning a series of<br />
environmental policy recommendations that<br />
will support C3’s ef<strong>for</strong>ts to grow sustainably,<br />
remediate environmental justice and public<br />
health issues, and prepare <strong>for</strong> a future with an<br />
uncertain, changing climate.<br />
The result of this planning ef<strong>for</strong>t is a robust<br />
set of policy recommendations to enhance<br />
sustainability and community health, which<br />
the <strong>City</strong> will implement over the coming<br />
five to ten years. If all strategies and actions<br />
are implemented and the <strong>City</strong>’s targets are<br />
reached, community-wide carbon pollution<br />
will reduce by 46% by 2030 and 77% by 2050 * .<br />
<strong>Commerce</strong> <strong>City</strong> Targets<br />
Energy use is reduced by 25% by<br />
2030 and 40% by 2050.<br />
Electrification is adopted by 15%<br />
of all buildings by 2030 and 60%<br />
by 2050.<br />
Rooftop and community solar is<br />
utilized by 40% of households and<br />
commercial buildings by 2050.<br />
The share of renewables in the C3<br />
community’s energy mix increases<br />
by 10% annually.<br />
Vehicles on the road are 30% EVs<br />
by 2030 and 75% EVs by 2050.<br />
Idling time is reduced by 78% by<br />
2030.<br />
There is a 20% mode shift by<br />
2030 and 50% mode shift by 2050<br />
towards greater use of transit,<br />
bikes, walking, etc.<br />
Waste diversion increases to 85%<br />
by 2050.<br />
Any new oil and gas wells<br />
developed within <strong>City</strong> limits are<br />
carbon neutral.<br />
Reduce GHG emissions by 50% by<br />
2030 and 90% by 2050, in line with<br />
the State of Colorado’s goals.<br />
This is short of the <strong>City</strong>’s goal of aligning with<br />
the State’s reductions of 50% by 2030 and<br />
90% by 2050 but shows significant progress<br />
towards reaching those reductions.<br />
* Emissions savings are based on the <strong>City</strong>’s core 2019 GHG emissions, which includes emissions from<br />
building energy use, transportation activities, and waste. Industrial emissions are not included in the core<br />
baseline from which reduction goals are based.<br />
ES1
Executive Summary<br />
As carbon pollution declines, so too will<br />
other pollutants of concern (e.g., NOx, SOx,<br />
and VOCs) that create ozone <strong>for</strong>mation<br />
and contribute to the community’s health<br />
problems.<br />
Environmental Justice,<br />
Vulnerability, and Climate<br />
Equity<br />
Community members have been active<br />
in the fight <strong>for</strong> environmental justice<br />
(EJ) <strong>for</strong> years. The public health impacts<br />
of industrial pollution, particularly in<br />
communities of color and those classified<br />
as disproportionately impacted by the State,<br />
drives much of the community’s activism and<br />
remains a critical issue that the environmental<br />
policy recommendations in this <strong>Action</strong> <strong>Plan</strong><br />
<strong>for</strong> <strong>Sustainability</strong> (<strong>Plan</strong>) seek to address.<br />
Furthermore, the acceleration of extreme<br />
weather events (i.e., drought) and intensifying<br />
climatic conditions (i.e., wildfire) define the<br />
urgency of these policy recommendations.<br />
As the impacts of extreme weather accelerate,<br />
C3 must carefully plan and implement<br />
policies to end the historic cycles of inequity<br />
and disinvestment in the community. While<br />
extreme weather events affect all peoples,<br />
they harm those with vulnerabilities most,<br />
imposing a major equity concern. The <strong>City</strong><br />
seeks to manage its growth more sustainably;<br />
this demands a focus on equity, to repair<br />
historic injustice, and on the environment, to<br />
mitigate extreme weather impacts. Ultimately,<br />
through these two lenses, this <strong>Plan</strong> envisions<br />
a C3 with a more diverse economic and<br />
housing base in which all can thrive.<br />
ES2<br />
In June of 2021, the <strong>City</strong> created a citizen-led<br />
Environmental Policy Advisory Committee<br />
(EPAC) that was charged with defining the<br />
actions the <strong>City</strong> should take over the coming<br />
years to improve community wide health and<br />
sustainability outcomes. This act recognized<br />
the impact of environmental justice issues on<br />
the residents of C3 and honored the wisdom<br />
and lived experiences of those who call C3<br />
home. The EPAC first convened in the fall of<br />
2021 and met regularly until the fall of 2022,<br />
when the recommendations in this <strong>Plan</strong><br />
were finalized. The strategies recommended<br />
in this document represent the future state<br />
that community members believe is not only<br />
possible in <strong>Commerce</strong> <strong>City</strong>, but one that will<br />
support long-term community health and<br />
well-being, enhance the quality of life <strong>for</strong><br />
residents, improve business opportunities,<br />
and ensure <strong>Commerce</strong> <strong>City</strong> truly remains a<br />
“quality community <strong>for</strong> a lifetime.”<br />
Air and Water Quality<br />
Running concurrently to the policy<br />
development process were ef<strong>for</strong>ts to quantify<br />
and analyze air and water quality challenges<br />
and opportunities in C3. These analyses<br />
build a more accurate, detailed picture of the<br />
<strong>City</strong>’s air and water pollution, capturing the<br />
community’s concerns with the amount of<br />
industrial pollutants, including those beyond<br />
legacy contaminants, released into the local<br />
environment.<br />
The air quality (AQ) work<br />
undertaken <strong>for</strong> this planning<br />
process culminated in a<br />
compilation of technical,
Executive Summary<br />
legal, and operational recommendations<br />
that the <strong>City</strong> can implement to stem AQ<br />
degradation and begin improvements. The<br />
recommendations include the following:<br />
► Continue updating the communitywide<br />
AQ impacts inventory to keep<br />
residents in<strong>for</strong>med of details regarding<br />
new pollutant sources and existing source<br />
modifications.<br />
► Implement a monitoring network and<br />
database that supplements existing<br />
and planned monitoring to help the<br />
community better understand how<br />
existing pollutant sources impact public<br />
health, with a focus on locations such as<br />
schools and parks.<br />
► Incorporate AQ threshold levels into<br />
<strong>City</strong> ordinances and state issued permits<br />
that would require additional analysis,<br />
reporting, and potentially mitigation <strong>for</strong><br />
existing, modified, and planned emission<br />
sources.<br />
► Work with State and federal agencies to<br />
update oil and gas regulatory requirements<br />
on a continuous basis to keep up with<br />
evolving industry technologies and<br />
practices.<br />
► Partner with local and state agencies<br />
to reduce current and future emissions<br />
by implementing practices such as best<br />
available control technology (BACT)<br />
analysis requirements and targeted<br />
emissions control requirements as needed.<br />
The <strong>City</strong> has limited authority in this<br />
space, so it is essential to partner on this<br />
work.<br />
The water quality (WQ) analysis encompassed<br />
several aspects of the <strong>City</strong>’s water resources<br />
and the initial findings can be summarized by<br />
the following recommendations:<br />
► Track WQ monitoring activities and<br />
discharge permit violations. While<br />
no immediate need was identified <strong>for</strong><br />
selective WQ monitoring at the time<br />
of this analysis, the consultant team<br />
recommended that the <strong>City</strong> develop a<br />
system to track WQ monitoring activities<br />
and discharge permit compliance <strong>for</strong><br />
water bodies within its boundaries.<br />
Additionally, non-point illicit discharges<br />
enter C3’s receiving waters each year and<br />
staff regularly converse with Colorado<br />
Department of Public Health and<br />
Environment (CDPHE) to locate priority<br />
areas of pollution. Tracking WQ and<br />
violations in real-time will allow the <strong>City</strong><br />
to flag and respond to pollution issues<br />
more quickly.<br />
► Develop a high-level Stream Corridor<br />
Management Reference Document with<br />
a limited menu of easily implementable<br />
tools and approaches designed specifically<br />
<strong>for</strong> C3.<br />
► Adopt <strong>City</strong> ordinances related to lowimpact<br />
development (LID) requirements.<br />
The consultant team worked closely with<br />
<strong>City</strong> staff to develop an ordinance and<br />
detailed LID guidance materials.<br />
ES3
Executive Summary<br />
Figure ES 1 Total 2019 GHG emissions.<br />
Greenhouse Gas Inventory<br />
C3 recognizes the increasingly urgent need<br />
to address the rising onslaught of extreme<br />
weather events and enact strategies to adapt<br />
to these new uncertain patterns. To identify<br />
the strategies with the highest greenhouse gas<br />
(GHG) reduction impact in the community,<br />
the <strong>City</strong> completed its first community-wide<br />
GHG inventory, which accounted <strong>for</strong> all GHG<br />
emissions generated in the community <strong>for</strong> the<br />
year 2019. It will serve as the baseline against<br />
which the <strong>City</strong>’s future inventories will be<br />
compared, and on which the <strong>City</strong>’s mitigation<br />
strategies can be set. C3 has contracted<br />
with Lotus Engineering and <strong>Sustainability</strong>,<br />
LLC (Lotus) to update the municipal GHG<br />
inventory from 2010 in 2023.<br />
Electricity 15%<br />
Residential 6%<br />
Commercial 9%<br />
Industrial 0.5%<br />
Natural Gas 10%<br />
Residential 4%<br />
Commercial 6%<br />
Fugitive Emissions 0.3%<br />
Other Building Fuel Use 0.0%<br />
Transportation 14%<br />
Fossil Fuel Vehicles 14%<br />
Electric Vehicles 0.1%<br />
Transit 0.1%<br />
Rail 0.0%<br />
Waste 4%<br />
Solid Waste 4%<br />
Wastewater 0.3%<br />
IPPU 57%<br />
Refrigerants 0.4%<br />
Industrial Emitters 56%<br />
The inventory revealed that <strong>Commerce</strong> <strong>City</strong><br />
emitted a total of 1,945,937 metric tons of<br />
carbon dioxide equivalent (mt CO2e). As<br />
seen in Figure ES 1, the largest emissionsproducing<br />
sector was the Industrial Processes<br />
and Product Use (IPPU) sector, which<br />
accounted <strong>for</strong> 57% of all GHG emissions;<br />
86% of IPPU emissions are generated from<br />
activities at the Suncor facility. Following<br />
this, building energy use and transportation<br />
made up 15% and 14% of total emissions,<br />
respectively. However, when removing<br />
the IPPU sector and looking only at the<br />
<strong>City</strong>’s core emissions, the building energy<br />
sector, broken out by source into<br />
electricity and natural gas in Figure<br />
ES 2, comprises half of<br />
ES4
Executive Summary<br />
Figure ES 2 Core 2019 GHG emissions.<br />
the <strong>City</strong>’s carbon pollution. Transportation<br />
follows at 28%; last is waste at 21%.<br />
This analysis of carbon pollution sources will<br />
help the <strong>City</strong> and the larger C3 community<br />
assess which policy strategies will result in<br />
the largest pollution reductions. From this<br />
in<strong>for</strong>mation, the <strong>City</strong> can make decisions<br />
about where to direct its resources to achieve<br />
the greatest impact.<br />
Modeling Strategies<br />
Once the inventory process was complete,<br />
emissions were <strong>for</strong>ecasted to 2050 based<br />
on a business-as-usual case scenario,<br />
accounting <strong>for</strong> population growth and state<br />
and utility level policies. Using these baseline<br />
analyses, a model was developed to evaluate<br />
the GHG emissions impact of the policy<br />
recommendations. The community’s highest<br />
priority strategies were modeled against the<br />
baseline emissions provided by the inventory,<br />
Electricity 35%<br />
Residential 13%<br />
Commercial 21%<br />
Industrial 01.1%<br />
Natural Gas 23%<br />
Residential 9%<br />
Commercial 14%<br />
Fugitive Emissions 0.8%<br />
Other Building Fuel Use 0.0%<br />
Transportation 33%<br />
Fossil Fuel Vehicles 32%<br />
Electric Vehicles 0.3%<br />
Transit 0.3%<br />
Rail 0.0%<br />
Waste 9%<br />
Solid Waste 9%<br />
Wastewater 0.7%<br />
as was the potential increase in GHG<br />
emissions due to potential newly permitted<br />
oil and gas wells. Ultimately, the most<br />
important strategies from a GHG emissions<br />
reduction perspective are the prioritization of<br />
residential and commercial building energy<br />
efficiency, which would together comprise<br />
39% of emissions reductions by 2050,<br />
and, secondly, the prioritization of multimodal<br />
transportation options, which would<br />
comprise 25% of total emissions reductions<br />
by 2050.<br />
Figure ES 3 shows the carbon pollution<br />
reductions estimated by the model by sector,<br />
and underscores the significance of building<br />
energy and transportation strategies. By<br />
contrast, increased oil and gas<br />
activity would add back 19,985<br />
mt CO2e, or approximately onequarter<br />
of the anticipated GHG<br />
emissions savings from other<br />
strategies.<br />
ES5
Executive Summary<br />
Figure ES 3 Share of emissions reductions by strategy type based on modeling.<br />
Strategy Sector<br />
Transporation Building Energy Waste<br />
Strategy<br />
Share of Emissions<br />
Prioritize muilti-modal transporation options. 25%<br />
Support & promote equitable electric vehicle adaptation. 22%<br />
Reduce idling & air pollution from traffic. 2%<br />
Promote energy efficiency <strong>for</strong> commercial buildings. 24%<br />
Promote energy efficiency <strong>for</strong> residential buildings. 14%<br />
Promote fuel switching (i.e. electrification) through<br />
incentive programs & public campaigns/initaitives.<br />
10%<br />
Promote rooftop & community solar. 2%<br />
Achieve 85% waste diversion by 2050. 0.7%<br />
ES6
Executive Summary<br />
Policy Development Process<br />
A key EJ principle is that those most impacted<br />
should define the scope of the problems and<br />
drive their solutions. The <strong>City</strong> worked to<br />
incorporate this principle by turning policy<br />
development over to the citizen-led EPAC.<br />
EPAC members, in collaboration with policy<br />
and subject matter experts, developed the<br />
strategies and actions presented in this <strong>Plan</strong><br />
over the course of seven months.<br />
Beyond the EPAC, the <strong>City</strong> dedicated<br />
significant resources toward engaging the<br />
broader C3 community to collect input and<br />
feedback on the EPAC’s work. To ensure this<br />
engagement and outreach remained authentic<br />
to the communities, the <strong>City</strong> worked closely<br />
with EPAC members to recruit residents’<br />
participation in a community-wide survey, a<br />
civic engagement training, event attendance<br />
(i.e., Ecofiesta), key in<strong>for</strong>mant interviews,<br />
and a community meeting. Additionally,<br />
they worked with key <strong>City</strong> staff and business<br />
ES7
Executive Summary<br />
and industry leaders to cultivate buy-in, vet<br />
the policies, and begin fostering the publicprivate<br />
collaborations and relationships<br />
necessary to push <strong>for</strong> community-wide<br />
implementation of the recommendations.<br />
<strong>Commerce</strong> <strong>City</strong> has a long history of<br />
acknowledging environmental conservation<br />
and stewardship. Past planning documents<br />
have noted that communities and local<br />
governments are first to deal with volatile<br />
energy costs, diminishing natural resources,<br />
and the impacts of climate change. The 2010<br />
Comprehensive <strong>Plan</strong> vision kicked off two<br />
key <strong>City</strong> initiatives to assess the <strong>City</strong>’s baseline<br />
<strong>for</strong> sustainability work, the McKinstry<br />
Energy Per<strong>for</strong>mance Contract and the <strong>City</strong>’s<br />
Green Team <strong>Sustainability</strong> <strong>Plan</strong>. In 2022, the<br />
<strong>City</strong> <strong>for</strong>med a <strong>Sustainability</strong> Committee to<br />
coordinate internal environmental initiatives<br />
and assist with implementing the EPAC’s<br />
recommendations.<br />
Process <strong>for</strong> Success<br />
To assess current conditions and<br />
comprehensive strategies, the <strong>City</strong> contracted<br />
Lotus and Pinyon Environmental (Pinyon),<br />
Inc. to conduct several scientific technical<br />
tasks such as the GHG emissions inventory,<br />
the Air Quality Significance Threshold<br />
Report, Air Quality Modeling Guidance, and<br />
Significant Point and Nonpoint Pollutant<br />
Source Identification. Lotus, in collaboration<br />
with AMBG Consulting (AMBG), led ef<strong>for</strong>ts<br />
to engage the community and summarize the<br />
EPAC recommendations gathered through a<br />
year of monthly meetings.<br />
“The most important piece is stakeholding- I’ve seen communities<br />
move <strong>for</strong>ward without doing that and it’s not efficient. To have<br />
stakeholders and gather feedback is important, as a resident and a<br />
business. It’s important that we take part in it.”<br />
- Worker and Resident of <strong>Commerce</strong> <strong>City</strong><br />
ES8
Executive Summary<br />
<strong>Sustainability</strong> Focus Areas<br />
This community-led ef<strong>for</strong>t developed recommendations that focus on the needs and<br />
opportunities at the local level. The resulting impacts expect to positively contribute to the lives<br />
and health of <strong>Commerce</strong> <strong>City</strong> residents. The EPAC’s journey of learning led the group to develop<br />
some initial high-level priorities <strong>for</strong> the <strong>City</strong>:<br />
1<br />
2<br />
3<br />
4<br />
First and <strong>for</strong>emost, the EPAC has a desire to continue their work as a permanent<br />
<strong>City</strong>-sanctioned advisory committee. They desire to continue to be community<br />
led, by residents, <strong>for</strong> residents, with support from the <strong>City</strong>.<br />
Second, there are opportunities throughout the <strong>Plan</strong> to leverage existing <strong>City</strong><br />
initiatives and projects by further incorporating environmental and public health<br />
considerations.<br />
Third, <strong>Commerce</strong> <strong>City</strong> has extensive networks that can be utilized to provide<br />
education and engagement opportunities to residents and businesses to<br />
accelerate sustainable trans<strong>for</strong>mation. Initial education and outreach should<br />
focus on air and water quality protection and restoration. Continued work<br />
should focus on developing deep and consistent partnerships with community<br />
institutions and organizations.<br />
Lastly, the EPAC would relish ongoing study sessions throughout the year with<br />
the <strong>City</strong> Council to analyze sustainability solutions, evaluate implementation<br />
progress, and provide input into community decisions.<br />
The policy recommendations in this plan are divided into 10 focus areas in which the <strong>City</strong><br />
should target its sustainability work. Together these focus areas build a comprehensive, wholeof-government<br />
framework that can define the <strong>City</strong>’s approach to environmental sustainability<br />
and community health, as well as a vision <strong>for</strong> a quality community <strong>for</strong> all residents.<br />
The recommendations represent what the <strong>City</strong> can effectively take action on in the<br />
next five to ten years.<br />
ES9
Executive Summary<br />
Education<br />
and<br />
Outreach<br />
Energy<br />
Efficiency<br />
Renewable<br />
Energy<br />
Adaptation<br />
and<br />
Mitigation<br />
Recycling<br />
and<br />
Waste<br />
Diversion<br />
Throughout this planning ef<strong>for</strong>t, the <strong>City</strong> has sought to invest in building<br />
trust with the community and to identify opportunities to reach the<br />
most impacted communities (i.e., those overburdened by environmental<br />
pollution). Additionally, building the capacity of businesses, <strong>City</strong> staff, and<br />
residents through communications, engagement, and training will support<br />
the implementation of the remaining policy recommendations and ensure<br />
this work remains community-driven and validated. Appendix D includes<br />
recommendations <strong>for</strong> community engagement and education campaigns based<br />
on community insight and best practices in equitable community engagement.<br />
As the <strong>City</strong> looks to act on the results of its inaugural GHG inventory, energy<br />
efficiency strategies have the potential to significantly reduce energy costs <strong>for</strong><br />
residents and businesses while also reducing GHG emissions from across the<br />
community. Energy efficiency technologies are some of the most cost-effective<br />
strategies to reduce carbon pollution and support community members,<br />
including businesses, that cannot af<strong>for</strong>d infrastructure overhauls immediately.<br />
Renewable energy plays a crucial role in global ef<strong>for</strong>ts to reduce carbon<br />
pollution, improve AQ, and develop energy independence and resilience against<br />
predicted extreme weather events such as flooding and drought. The <strong>City</strong><br />
can support its pollution reduction goals by demonstrating leadership in the<br />
community’s conversion to renewable energy.<br />
As the climate continues to shift, communities can respond to the associated rise<br />
in extreme weather through two approaches, adaptation (i.e., changing processes<br />
and infrastructure to thrive in a new normal) and mitigation (i.e., reducing<br />
carbon pollution). Implementing strategies from both of these approaches will<br />
ensure the community thrives against the escalation of extreme weather events<br />
and climatic shifts, while working to prevent additional future harm.<br />
By diverting certain kinds of waste from their endpoints in landfills, the<br />
<strong>City</strong> can reframe waste as “new” materials <strong>for</strong> reuse and provide new<br />
opportunities <strong>for</strong> job creation. Use of these materials can provide new<br />
business opportunities, extend the life of the landfill, reduce pollution<br />
of the natural environment, and cut air pollutants emitted by landfills.<br />
The diversion of organic material (i.e., yard and food waste) into<br />
compost can help improve soil health and reduce particulate matter<br />
(PM) emissions, which are currently three times higher in Adams<br />
County than surrounding Arapahoe and Denver counties.<br />
ES10
Executive Summary<br />
Water<br />
Transportation<br />
Community<br />
Health<br />
Funding and<br />
Purchasing<br />
Biodiversity,<br />
Tree Canopy,<br />
and Food<br />
Water challenges will undoubtedly continue to plague the <strong>City</strong> and the State<br />
as drought conditions contribute to the over-extraction of State waters and<br />
increases in the cost of water. Policies that encourage conservation, low<br />
impact development, and investment in infrastructure upgrades will be<br />
crucial to guaranteeing the continuation of C3’s water supplies and WQ,<br />
including addressing emerging contaminants like per- and polyfluorinated<br />
(PFAS), which currently exceed federal health advisory levels.<br />
As the <strong>City</strong> reassesses its plans <strong>for</strong> sustainable growth into the future, it must<br />
consider the critical ways in which transportation infrastructure contributes<br />
to air pollution, resilience, and community accessibility. Transportation<br />
infrastructure – from public transit to active transportation – in many ways<br />
shapes what communities look like, how people behave, and the overall<br />
quality of life in the <strong>City</strong>. Strategies in this sector include those that address<br />
the lack of accessibility <strong>for</strong> public transit and active transportation networks<br />
(i.e., protected bike lanes).<br />
Industrial pollution issues impact all <strong>Commerce</strong> <strong>City</strong> residents, crossing<br />
racial and socioeconomic lines. This focus area seeks to tackle industryrelated<br />
AQ issues and health justice, a major priority <strong>for</strong> all C3 residents,<br />
particularly residents of color who disproportionately live near industrial<br />
facilities.<br />
Critical to the success of any <strong>City</strong> sustainability policy is the ability and<br />
commitment to invest resources towards implementing and sustaining<br />
this work. The community will recognize the allocation of <strong>City</strong> funds<br />
as a demonstration of genuine commitment to community health and<br />
sustainability; there<strong>for</strong>e, funding programs and hiring dedicated staff to<br />
manage grant requests and projects, along with providing support <strong>for</strong><br />
community-level incentive programs, will work to build trust with the<br />
community.<br />
Access to green spaces and adequate tree canopy plays a critical<br />
mitigating role in environmental and public health, particularly<br />
as temperatures grow hotter and <strong>for</strong> vulnerable communities.<br />
Biodiversity is crucial to the resilience of natural ecosystems; local<br />
food access can likewise enhance resilience <strong>for</strong> urban communities.<br />
C3’s current tree canopy level is at 3%, which is well below the 24%<br />
level recommended <strong>for</strong> a prairie ecosystem.<br />
ES11
Executive Summary<br />
What Comes Next<br />
As <strong>Commerce</strong> <strong>City</strong> embarks on operationalizing<br />
and implementing the recommendations within<br />
this <strong>Plan</strong>, six key components will be integral to<br />
this work:<br />
Working closely with the community,<br />
including a permanent EPAC, to engage all<br />
of <strong>Commerce</strong> <strong>City</strong> in this work.<br />
Engaging institutional, organizational, and<br />
business partners throughout <strong>Commerce</strong><br />
<strong>City</strong> to implement recommendations<br />
and leverage existing work to advance<br />
sustainability.<br />
Applying <strong>for</strong> relevant funding<br />
opportunities, including grants and<br />
<strong>for</strong>thcoming federal funds, to ensure<br />
this work is fully funded and fiscally<br />
sustainable in the long run.<br />
ES12<br />
Developing a process <strong>for</strong> integrating<br />
economic, environmental, and social<br />
considerations – known as a triple bottom<br />
line analysis – into <strong>City</strong>-funded projects,<br />
policies and programs.<br />
Evaluating and implementing proposed<br />
amendments and ordinances necessary to<br />
address community health concerns and<br />
build a more diverse economic base.<br />
Coordinating policies with neighboring<br />
municipalities and jurisdictions to infuse<br />
sustainability principles into regional-scale<br />
short- and long-term planning.
Introduction<br />
Just 70 years after incorporation, <strong>Commerce</strong><br />
<strong>City</strong> (<strong>City</strong>/C3) has blossomed into one<br />
of the most popular places to move in the<br />
State of Colorado (State). Sitting on the<br />
northern edge of Denver in Adams County,<br />
C3 now boasts one of Colorado’s fastest<br />
growing economies and populations. The<br />
State’s professional soccer team, the Colorado<br />
Rapids, calls <strong>Commerce</strong> <strong>City</strong> home, along<br />
with over 64,000 residents. This number<br />
represents an approximate 40% increase<br />
since the 2010 Census * . With an abundance<br />
of parks, open space, and outdoor recreation<br />
opportunities, the <strong>City</strong> is known <strong>for</strong> its<br />
family-friendly, small-town community<br />
culture. The <strong>City</strong> is also one of the primary<br />
industrial and business centers in the Denver<br />
metro region, and is home to locally-owned<br />
businesses, along with a significant number of<br />
transportation, distribution, manufacturing,<br />
refining, and aggregate operations.<br />
Established on ancestral Arapaho, Cheyenne,<br />
Apache, and Ute lands, the <strong>City</strong> traces its<br />
modern settler roots back to an 1859 trading<br />
post <strong>for</strong> miners on their way to the Pike’s<br />
Peak Gold Rush. Native Americans were<br />
ultimately marginalized as a result. The<br />
area in and around what is now <strong>Commerce</strong><br />
<strong>City</strong> has evolved many times since this<br />
modest beginning including cemeteries,<br />
agricultural land, and a slew of small, now<br />
largely-vacated towns ** . Today, amidst a<br />
rapidly shifting urban landscape, <strong>Commerce</strong><br />
<strong>City</strong> is once again undergoing a significant<br />
evolution in its community character. C3<br />
is not alone; communities across the State<br />
face similar challenges with population<br />
growth, economic ups and downs, societal<br />
shifts, drought, threats to public health,<br />
and other environmental issues. The <strong>City</strong><br />
recognizes that how it adapts and responds<br />
to this multitude of changes will<br />
determine its long-term vibrancy.<br />
* https://www.census.gov/quickfacts/commercecitycitycolorado<br />
** https://www.cchistoric.com/commerce-city-history<br />
1
Introduction<br />
To assess current conditions and strategies,<br />
the <strong>City</strong> contracted Lotus Engineering and<br />
<strong>Sustainability</strong>, LLC (Lotus) and Pinyon<br />
Environmental, Inc. (Pinyon) to conduct<br />
several scientific technical tasks such as<br />
the GHG emissions inventory, the Air<br />
Quality Significance Threshold Report, Air<br />
Quality Modeling Guidance, and Significant<br />
Point and Nonpoint Pollutant Source<br />
Identification. Lotus, in collaboration with<br />
AMBG Consulting (AMBG), led ef<strong>for</strong>ts<br />
to engage the community and summarize<br />
the recommendations from the citizen-led<br />
Environmental Policy Advisory Committee<br />
(EPAC), which the <strong>City</strong> convened <strong>for</strong> this<br />
planning process over the course of a year.<br />
Synergies with the<br />
Comprehensive <strong>Plan</strong> Update<br />
With this understanding, <strong>Commerce</strong> <strong>City</strong><br />
is working hard to define itself against<br />
the recent population, economic, and<br />
environmental changes being experienced<br />
across the community. Currently, C3 is<br />
embarking on an update to its Comprehensive<br />
<strong>Plan</strong>, the document that will guide the <strong>City</strong>’s<br />
development <strong>for</strong> the next 25 years. This ef<strong>for</strong>t<br />
will encapsulate the <strong>City</strong>’s vision and goals<br />
related to planning out a future reflective of<br />
the <strong>City</strong>’s changing priorities, values, and<br />
challenges. The 2045 Vision Statement states<br />
the <strong>City</strong>’s desire to grow into:<br />
► “a thriving community: economically<br />
strong, environmentally sustainable, and<br />
socially equitable;<br />
► a healthy and safe city where fresh<br />
air, clean water, public health, and the<br />
2<br />
preservation of natural open space are<br />
paramount;<br />
► a financially sound city where businesses<br />
flourish through collaboration and<br />
innovation;<br />
► [and] a diverse community that celebrates<br />
its unique history, identity, and culture,<br />
where families and individuals of all ages<br />
can live, work, and play.”<br />
Many of these aspirations hinge on<br />
<strong>Commerce</strong> <strong>City</strong>’s ability to embrace and<br />
incorporate measurable targets, numerical<br />
goals, and sustainable policies that<br />
promote environmental and community<br />
health and restore compromised<br />
ecosystems. In recognition of the complex<br />
interconnectedness between population<br />
growth, economic development,<br />
environmental sustainability, and public<br />
health, C3 initiated a process to draft a<br />
set of specific environmental policy and<br />
community health recommendations. These<br />
recommendations set out to address some<br />
of the core challenges of the community’s<br />
rapid change: economic growth; equity;<br />
energy use; and environmental impacts<br />
like drought, social well-being, health, and<br />
waste management. The resulting suite<br />
of policies aims to tackle this wide range<br />
of issues through a holistic, whole-ofgovernment<br />
approach that will increase<br />
community resilience and improve public and<br />
environmental health. Ultimately,<br />
the policies in this document will<br />
play a critical role in realizing the<br />
vision <strong>for</strong> a thriving C3 laid out in<br />
its new Comprehensive <strong>Plan</strong>.
Local <strong>Sustainability</strong> Work<br />
The recent Comprehensive <strong>Plan</strong> update<br />
and this <strong>Plan</strong> build on a long history<br />
of the <strong>City</strong> acknowledging environmental<br />
conservation and stewardship. Past planning<br />
documents have noted that communities<br />
and local governments are first to deal with<br />
volatile energy costs, diminishing natural<br />
resources, and the impacts of the environment<br />
on public health. The 2010 Comprehensive<br />
<strong>Plan</strong> recognizes that to achieve its goals<br />
of high environmental quality, economic<br />
prosperity, and community longevity and<br />
health, the <strong>City</strong> must reduce energy use,<br />
waste, and GHG emissions; improve water<br />
conservation; and increase renewable energy<br />
use.<br />
The 2010 Comprehensive <strong>Plan</strong> vision kicked<br />
off two key <strong>City</strong> initiatives to assess the <strong>City</strong>’s<br />
baseline <strong>for</strong> sustainability work. First, the <strong>City</strong><br />
contracted McKinstry to conduct an Energy<br />
Per<strong>for</strong>mance Contract in 2010, resulting in<br />
numerous recommendations. In 2012, the<br />
<strong>City</strong>’s Green Team published its first internal<br />
<strong>Sustainability</strong> <strong>Plan</strong> centered on maximizing<br />
the efficiency of operations and minimizing<br />
resource use. The combination of these ef<strong>for</strong>ts<br />
underpins many current and ongoing staff-led<br />
sustainability initiatives.<br />
Current and Ongoing<br />
Initiatives<br />
BUILDINGS | To begin implementing<br />
the recommendations developed through<br />
the recent Facility Assessment and the<br />
McKinstry Energy Per<strong>for</strong>mance Contract, the<br />
Community Development Building Safety<br />
Division determined that the <strong>City</strong> should<br />
adopt Leadership in Energy and Efficiency<br />
3<br />
Design (LEED) Silver or equivalent <strong>for</strong> all<br />
new <strong>City</strong> buildings and remodels over 50,000<br />
square feet. The <strong>City</strong> will be adopting the 2018<br />
International Green Building Code, including<br />
the International Energy Conservation Code<br />
(IECC) and plans to amend the code to 2021<br />
standards in 2025. The <strong>City</strong> began providing<br />
leave compensation <strong>for</strong> staff to attend LEED,<br />
WELL Building, Passive Building, and other<br />
sustainable building trainings to increase<br />
the <strong>City</strong>’s capacity to support sustainable<br />
construction. These ef<strong>for</strong>ts have yielded a 43%<br />
reduction in water use <strong>for</strong> a <strong>City</strong> building and<br />
solar array on the Civic Center which reduces<br />
costs by over $4,000 annually. Staff continue<br />
to research grant opportunities <strong>for</strong> additional<br />
solar and low-impact green stormwater<br />
infrastructure installations.<br />
WASTE | Waste reduction ef<strong>for</strong>ts include<br />
minimizing paper use in the Finance<br />
Department and transitioning to electronic<br />
file storage. The Community Development<br />
Department will also transition to an<br />
electronic permitting review software in<br />
2023. In a situation that is fairly unique<br />
across the Front Range, <strong>Commerce</strong> <strong>City</strong><br />
pays <strong>for</strong> the trash service <strong>for</strong> all residential<br />
accounts. Staff began examining trash bills<br />
to establish a baseline <strong>for</strong> trash collection<br />
costs and discovered an almost tripling in<br />
annual costs to approximately $3.3 million<br />
between 2018 to 2021. Given these trends,<br />
staff have begun examining opportunities<br />
to increase diversion rates and<br />
lower overall trash quantities,<br />
including recommendations by<br />
EPAC and Republic Services to<br />
increase education, recycling, and<br />
composting.
Local <strong>Sustainability</strong> Work<br />
WATER | Given the ongoing State-wide<br />
drought and increase in severe wildfires,<br />
staff have also spearheaded several water<br />
conservation initiatives, including revising the<br />
<strong>City</strong>’s tree and plant list to promote drought<br />
tolerant and fire-resistant species. In 2022,<br />
the Parks, Recreation, and Golf Department<br />
(Parks) hired its first park rangers to<br />
protect open space and trails. Parks also<br />
allocates annual funding <strong>for</strong> tree and shrub<br />
replacements, removing and replacing around<br />
40 dead trees in 2022. A volunteer group<br />
also recently helped the <strong>City</strong> plant 16 trees<br />
at Pioneer Park. Moreover, the Community<br />
Development Department has observed<br />
a groundswell of interest in replacing turf<br />
and planting trees, but residents ultimately<br />
face challenges with code and homeowners’<br />
association (HOA) turf requirements.<br />
The Parks Department uses irrigation<br />
controllers to detect overflows in the<br />
irrigation systems. The controllers allow<br />
Parks to utilize evaporation transpiration<br />
rates and weather stations to help monitor<br />
water use. On the other end of the water use<br />
spectrum, the Public Works and Community<br />
Development Departments are collaborating<br />
on a draft of new development standards to<br />
incorporate green infrastructure principles<br />
to manage stormwater flows and reduce<br />
pollution from entering water sources. To<br />
complement these ef<strong>for</strong>ts, the Community<br />
Relations Division launched a “Only Rain in<br />
the Drain” education campaign.<br />
POLLUTION | Finally, to reduce carbon<br />
pollution associated with vehicle travel, many<br />
<strong>City</strong> departments encourage hybrid work<br />
4<br />
options, including staff from the Finance<br />
Department working remotely on Fridays.<br />
Staff are evaluating options <strong>for</strong> electrifying<br />
various <strong>City</strong> fleets.<br />
<strong>Sustainability</strong> Initiatives<br />
Committee<br />
In 2022, the <strong>City</strong> <strong>for</strong>med an internal<br />
staff <strong>Sustainability</strong> Initiatives Committee<br />
(Committee) to begin coordinating the<br />
sustainability-related projects in various<br />
departments and encourage crossdepartmental<br />
collaboration. The Committee<br />
began to ascertain current conditions,<br />
barriers, and opportunities to lead by example<br />
within municipal operations and address<br />
sustainability throughout the community.<br />
To date, the Committee has focused largely<br />
on tackling building energy use, the <strong>City</strong>’s<br />
largest source of carbon pollution and<br />
energy consumption (see Greenhouse Gas<br />
Inventory section <strong>for</strong> more in<strong>for</strong>mation).<br />
Much of this work has gone toward meeting<br />
the requirements of the new State energy<br />
disclosure laws, planning to create a 100%<br />
renewable electricity system, and identifying<br />
opportunities to save on energy bills. Staff<br />
developed an in<strong>for</strong>mational fact sheet to<br />
help local businesses with the disclosure<br />
regulations. These ef<strong>for</strong>ts are likely to reduce<br />
community-wide electricity consumption,<br />
which also lowers energy costs and the<br />
amount of renewable electricity<br />
needed to achieve a 100%<br />
renewable electricity scenario.<br />
Finally, the <strong>City</strong> publishes<br />
sustainability news through
Local <strong>Sustainability</strong> Work<br />
<strong>Commerce</strong> <strong>City</strong> Connected and hosts<br />
resources on air and water quality<br />
conservation and in<strong>for</strong>mation on the EPAC<br />
on the <strong>Sustainability</strong> webpage. Currently<br />
under development is a Green Code website<br />
to communicate new standards and an<br />
expedited permit review process to promote<br />
sustainable development.<br />
State and Local Level<br />
Climate Policy<br />
It should be noted that C3 did not initiate<br />
its sustainability work in a vacuum. Several<br />
<strong>City</strong> staff serve on sustainability-related<br />
State, regional, federal, and international<br />
organizations such as the Colorado Green<br />
Business Network, Metro Denver Public<br />
Health Climate Group, Municipal Water<br />
Conservation Working Group Urban<br />
<strong>Sustainability</strong> Directors Network, and<br />
the International Society of <strong>Sustainability</strong><br />
Professionals. Many neighboring<br />
communities including Thornton,<br />
Westminster, Northglenn, Lakewood, and<br />
Denver have all developed climate and/<br />
or sustainability action plans. This regional<br />
momentum indicates popular support <strong>for</strong><br />
a broad approach to sustainability, from<br />
strengthening building codes to expanding<br />
regional transportation networks. With the<br />
policy recommendations in this <strong>Plan</strong>, the <strong>City</strong><br />
can join in a regional approach and leverage<br />
existing work with its neighbors.<br />
At the State level, Colorado has grown<br />
into a national leader in climate action,<br />
spearheading significant steps towards<br />
mitigating carbon emissions, enhancing<br />
sustainability, and addressing environmental<br />
5<br />
justice issues.<br />
House Bill (HB) 19-1261, Climate <strong>Action</strong> <strong>Plan</strong><br />
to Reduce Pollution, set the tone of recent<br />
legislation by outlining the State’s official<br />
greenhouse gas (GHG) pollution reduction<br />
goals. Several following bills continue to<br />
define the State’s goals <strong>for</strong> a climate-resilient,<br />
sustainable Colorado. This includes bold,<br />
cutting edge steps to reduce single-use plastic<br />
products (HB 21-1162, Plastic Pollution<br />
Reduction Act) and energy consumption<br />
(HB 21-1286, Energy Per<strong>for</strong>mance <strong>for</strong><br />
Buildings Act). Crucially, this legislation was<br />
accompanied by an official definition <strong>for</strong><br />
disproportionately impacted communities<br />
in HB 21-1266, Environmental Justice<br />
Disproportionate Impacted Community, so<br />
the State can begin addressing environmental<br />
justice (EJ) on a more systemic, statewide<br />
basis.<br />
2022 saw a continuation of this state-wide<br />
momentum. The legislature expanded on its<br />
work in the built environment with Senate Bill<br />
(SB) 22-051, Policies to Reduce Emissions From<br />
Built Environment, and HB22-1362, Building<br />
Greenhouse Gas Emissions. As buildings<br />
comprise approximately one-third of all<br />
GHGs emitted globally, these bills provide<br />
significant incentives <strong>for</strong> clean building<br />
technologies, such as heat pumps and energy<br />
storage, and update the State’s energy codes<br />
to spur building electrification. Notably, this<br />
legislation also codifies support<br />
<strong>for</strong> disproportionately impacted<br />
communities which will benefit<br />
many facing EJ harms like in<br />
<strong>Commerce</strong> <strong>City</strong>.
2022 Environmental Policy<br />
Recommendations<br />
In 2021, the <strong>City</strong> Council resolved to tackle<br />
this wide-ranging, complex set of issues<br />
related to sustainability and environmental<br />
health in collaboration with the community,<br />
to ensure the current and future C3<br />
community will be able to enjoy the same<br />
small-town atmosphere and an even better<br />
quality of life than today.<br />
C3 hired the consultant team led by Lotus<br />
and including AMBG and Pinyon, to engage<br />
the community; develop organizational<br />
sustainability recommendations; analyze air<br />
and water quality issues and recommend<br />
improvements; analyze communitygenerated<br />
GHG emissions; and develop<br />
recommendations <strong>for</strong> the <strong>City</strong> to implement.<br />
The result of this planning ef<strong>for</strong>t is a<br />
robust set of sustainability and community<br />
health recommendations that the <strong>City</strong> will<br />
implement over the coming five to ten years.<br />
If all strategies and actions are<br />
implemented and the <strong>City</strong>’s targets<br />
are reached, community-wide<br />
carbon pollution will reduce by 46%<br />
by 2030 and 77% by 2050 * .<br />
These targets fall short of the <strong>City</strong>’s desire to<br />
align with the State’s reductions of 50% by<br />
2030 and 90% by 2050 but show significant<br />
progress towards reaching those reductions.<br />
Additionally, it should be noted that these<br />
carbon pollution reduction goals represent<br />
<strong>Commerce</strong> <strong>City</strong> Targets<br />
Energy use is reduced by 25% by<br />
2030 and 40% by 2050.<br />
Electrification is adopted by 15%<br />
of all buildings by 2030 and 60%<br />
by 2050.<br />
Rooftop and community solar is<br />
utilized by 40% of households and<br />
commercial buildings by 2050.<br />
The share of renewables in the C3<br />
community’s energy mix increases<br />
by 10% annually.<br />
Vehicles on the road are 30% EVs<br />
by 2030 and 75% EVs by 2050.<br />
Idling time is reduced by 78% by<br />
2030.<br />
There is a 20% mode shift by<br />
2030 and 50% mode shift by 2050<br />
towards greater use of transit,<br />
bikes, walking, etc.<br />
Waste diversion increases to 85%<br />
by 2050.<br />
Any new oil and gas wells<br />
developed within <strong>City</strong> limits are<br />
carbon neutral.<br />
Reduce GHG emissions by 50% by<br />
2030 and 90% by 2050, in line with<br />
the State of Colorado’s goals.<br />
* Based on a 2019 baseline of core emissions from activities in <strong>Commerce</strong> <strong>City</strong>, which includes emissions from building<br />
energy use, transportation, and waste. Industrial process emissions are not included in the 2019 core emissions totals.<br />
6
2022 Environmental Policy<br />
Recommendations<br />
several other co-benefits that the <strong>City</strong> can<br />
achieve, including reductions in other criteria<br />
air pollutants and their precursors that<br />
contribute to public health issues.<br />
Policy Development Process<br />
The C3 team approached the development of<br />
environmental policy recommendations in<br />
multiple phases, beginning with <strong>Commerce</strong><br />
<strong>City</strong>’s first-ever community-wide GHG<br />
inventory and an assessment of air and water<br />
quality concerns and impacts. The GHG<br />
inventory process established a baseline<br />
of carbon pollution <strong>for</strong> the community in<br />
the year 2019. The inventory gives the <strong>City</strong><br />
baseline data from which to establish all<br />
following work, such as guiding key strategies<br />
to develop measurable targets and maximize<br />
carbon pollution reductions and investment<br />
opportunities.<br />
Next, the <strong>City</strong> underwent an evaluation<br />
of its internal municipal operations as<br />
they relate to sustainability. A vision<br />
statement <strong>for</strong> the <strong>City</strong>’s organizational<br />
sustainability approach emerged from<br />
this work, as well as recommendations to<br />
increase the C3 organization’s sustainability.<br />
Recommendations, which are detailed on<br />
pages 9-11, include opportunities to enhance<br />
energy efficiency, improve sustainability<br />
within fleet management, reduce waste,<br />
conserve water, and build internal capacity<br />
to support sustainability work. These<br />
recommendations were derived from<br />
extensive research into similar communities<br />
7<br />
across the country and consultant expertise<br />
but tailored to meet the <strong>City</strong>’s specific needs.<br />
See Appendix F <strong>for</strong> further in<strong>for</strong>mation<br />
on the <strong>City</strong>’s organizational sustainability<br />
opportunities.<br />
Given the community’s concern over public<br />
health and natural resources, the <strong>City</strong> also<br />
commenced an in-depth analysis of air and<br />
water quality. This analysis encompassed a<br />
wide range of work which added crucial data<br />
to the body of in<strong>for</strong>mation on the quality of<br />
C3’s environment, including:<br />
► Community-wide air pollutant and<br />
impacts of concern inventory;<br />
► Air quality (AQ) monitoring plan based<br />
on the above inventory;<br />
► Strategies <strong>for</strong> reducing known air<br />
pollutants;<br />
► AQ significance thresholds to screen<br />
future projects and plans;<br />
► AQ modeling guidance <strong>for</strong> development<br />
projects that exceed screening standards;<br />
► Policy analysis <strong>for</strong> setting local oil and gas<br />
AQ standards;<br />
► Identification of significant nonpoint and<br />
point sources of water pollution;<br />
► Water quality (WQ) Evaluation, Summary,<br />
and Recommendations;<br />
► Low-impact development (LID)<br />
and stormwater infrastructure best<br />
management practices guidance;<br />
and<br />
► Land use policy<br />
recommendations designed to<br />
improve WQ.
2022 Environmental Policy<br />
Recommendations<br />
The analysis completed in this phase creates<br />
a baseline understanding of the current state<br />
of C3’s natural resources, helps elucidate the<br />
community’s confusion over local air and<br />
water quality, and provides valuable guidance<br />
on natural resource management to the<br />
<strong>City</strong> as it expands its infrastructure to meet<br />
population growth.<br />
The air and water quality assessment work<br />
ran parallel to the environmental policy<br />
development phase. This process relied<br />
on extensive stakeholder and community<br />
engagement, featuring the a<strong>for</strong>ementioned<br />
citizen EPAC to develop the policy<br />
recommendations. Recognizing the impact of<br />
EJ issues and extreme climate conditions on<br />
the residents of C3 and honoring the wisdom<br />
and lived experiences of those who call C3<br />
home, the <strong>City</strong> opted to create the EPAC to<br />
serve as the broader C3 community’s voice<br />
in guiding the <strong>City</strong>’s actions over the coming<br />
years. The EPAC’s goal is ultimately to define<br />
the community’s desired outcomes and drive<br />
the <strong>City</strong> to improve community-wide health<br />
and sustainability.<br />
The EPAC was <strong>for</strong>med in the fall of 2021 and<br />
met regularly until the fall of 2022, when<br />
they finalized their recommendations. The<br />
strategies and actions recommended in this<br />
document represent the future state that<br />
community members believe is not only<br />
possible in <strong>Commerce</strong> <strong>City</strong>, but one that will<br />
support long-term community health and<br />
well-being, enhance the quality of life <strong>for</strong><br />
residents, improve business opportunities,<br />
and ensure <strong>Commerce</strong> <strong>City</strong> truly remains a<br />
“quality community <strong>for</strong> a lifetime.” Outside<br />
of the EPAC meetings, a variety of additional<br />
creative strategies were employed to seek<br />
input from residents, businesses, and<br />
<strong>City</strong> staff, including a civics engagement<br />
training, community dinner conversations, a<br />
community survey, key in<strong>for</strong>mant interviews,<br />
and a community meeting (see Appendix E<br />
<strong>for</strong> an overview of insights gleaned from the<br />
survey and in<strong>for</strong>mational interviews.<br />
“Living close to factories makes the air quality poor. In addition<br />
the lack of green spaces contributes to this. Poor air quality and<br />
poor water quality lead to public health concerns and increased<br />
illnesses that could be preventable.”<br />
- Survey Respondent<br />
8
Organizational <strong>Sustainability</strong><br />
Recommendations<br />
Organizational <strong>Sustainability</strong> Recommendations<br />
Consultants worked with staff from departments across C3 to develop a vision <strong>for</strong> organizational<br />
sustainability, as well as specific recommendations that the <strong>City</strong> can implement to improve<br />
sustainability throughout the <strong>City</strong> organization. Recommendations were developed based on<br />
input from staff interviews, a <strong>City</strong> staff-wide survey, focus groups, and a review of best practices<br />
implemented in other municipal organizations.<br />
Vision Statement<br />
The <strong>City</strong> of <strong>Commerce</strong> <strong>City</strong> is committed to environmental stewardship and is dedicated to<br />
making internal improvements that foster a sustainable future.<br />
─ First Tier Recommendations | High Impact, Low Ef<strong>for</strong>t (1-2 years)<br />
1. Implement digital systems to reduce the amount of paper used.<br />
2. Make it a policy to upgrade facility, street, and trail lights to high-efficiency LEDs.<br />
3. Develop processes and policies <strong>for</strong> maintaining and replacing equipment to reduce energy<br />
use, conserve fuel, and reduce air pollution.<br />
4. Develop a Green Meetings and Events Policy<br />
with checklists and resources <strong>for</strong> staff.<br />
5. Ensure all waste disposal systems are<br />
consistent in terms of look, style, and<br />
signage.<br />
6. Create a <strong>City</strong>-wide Green Team with<br />
representation from each department to lead<br />
sustainability ef<strong>for</strong>ts.<br />
7. Provide incentives <strong>for</strong> sustainability-based<br />
professional development.<br />
8. Recognize staff <strong>for</strong> sustainable decisionmaking.<br />
9. Adopt work-from-home policies.<br />
10. Purchase Renewable Energy Credits.<br />
9
Organizational <strong>Sustainability</strong><br />
Recommendations<br />
─ Second Tier Recommendations | Low Impact, Low Ef<strong>for</strong>t (2-4 years)<br />
1. Improve AQ in buildings.<br />
2. Develop a <strong>City</strong>-wide environmental<br />
management system (EMS) that is fully<br />
integrated and operational across all<br />
facilities.<br />
3. Develop a program <strong>for</strong> employees that<br />
provides sustainable education, training,<br />
and incentives.<br />
4. Develop a policy <strong>for</strong> recycling electronic<br />
office equipment and other hard to recycle<br />
items.<br />
5. Establish an employee donation or volunteer program.<br />
6. Require that new <strong>City</strong> infrastructure projects be evaluated <strong>for</strong> environmental and social<br />
impacts.<br />
7. Develop a municipal policy and procedure to consider life-cycle costs in procurement.<br />
8. Develop waste reduction and diversion policies that are aligned with zero-waste practices<br />
and include green standards.<br />
9. Ensure facilities cleaning contractors are utilizing sustainable practices.<br />
─ Third Tier Recommendations | High Impact, High Ef<strong>for</strong>t (4+ years)<br />
1. Improve building efficiency.<br />
2. Introduce electric and hybrid vehicles into the fleet and invest in the charging<br />
infrastructure needed to support electric vehicles.<br />
3. Implement xeriscaping in <strong>City</strong> landscaping.<br />
4. Identify and develop projects to expand local renewable energy generation and<br />
use on <strong>City</strong> facilities and land.<br />
5. Collect data to start building climate action plans and goals.<br />
10
Organizational <strong>Sustainability</strong><br />
Recommendations<br />
6. Develop a policy to increase construction<br />
recycling <strong>for</strong> <strong>City</strong>-funded projects.<br />
7. Diversify staff.<br />
8. Develop a sustainability or innovation grant<br />
program <strong>for</strong> staff to implement and make<br />
operations more sustainable.<br />
9. Adopt a policy that all new <strong>City</strong> facilities or<br />
major renovations will be built to a highefficiency<br />
standard (e.g., LEED).<br />
A final recommendation that is crucial to ensuring<br />
the success of both <strong>Commerce</strong> <strong>City</strong>’s internal (i.e.,<br />
organizational) and external (i.e., community-wide)<br />
sustainability work is to build capacity and skill<br />
within the organization to lead sustainability<br />
ef<strong>for</strong>ts. <strong>Commerce</strong> <strong>City</strong> should consider creating a<br />
staff position specifically dedicated to leading <strong>City</strong>wide<br />
organizational and community sustainability<br />
ef<strong>for</strong>ts. This position could be housed in the <strong>City</strong><br />
Manager’s Office or Community Development, but<br />
it is recommended that the position be structured<br />
to specially work on sustainability projects alone,<br />
including implementing the recommendations herein<br />
and the <strong>for</strong>thcoming community-wide sustainability<br />
strategies developed in partnership with the EPAC.<br />
By maintaining the core functions of the position discreetly on sustainability, staff in this<br />
position would have the ability to focus time on implementing sustainability policies<br />
and programs, collaborating with other <strong>City</strong> departments to ensure success, and<br />
facilitating the <strong>City</strong>-wide Green Team to continue to build capacity <strong>for</strong> sustainability<br />
throughout the organization.<br />
11
Environmental Justice,<br />
Vulnerability, & Climate Equity<br />
As an EJ community, C3 must inevitably<br />
address its long history of industrial<br />
pollution as it embarks on the work of<br />
implementing the Comprehensive <strong>Plan</strong> and<br />
the <strong>Action</strong> <strong>Plan</strong> <strong>for</strong> <strong>Sustainability</strong> (<strong>Plan</strong>).<br />
The concept of EJ, according to the federal<br />
Environmental Protection Agency (EPA),<br />
encompasses the goals that all people should<br />
enjoy the same degree of protection from<br />
environmental and health hazards and equal<br />
access to the decision-making processes that<br />
shape the healthy environment in which they<br />
live, learn, and work.<br />
The legacy and levels of pollution manifests<br />
in the community’s stated mistrust in both<br />
government and polluters. The community is<br />
keenly aware of environmental and pollution<br />
issues and the health consequences. Although<br />
wealth does not prevent pollution, lowincome<br />
communities, particularly those of<br />
color, face particularly severe impacts of<br />
industrial pollution. Figure 1 reveals the many<br />
severe EJ concerns in the C3 community as<br />
compared to other communities in the State<br />
and the country. These percentiles are based<br />
on the US EPA’s EJ index. Higher percentiles<br />
indicate higher levels of pollution.<br />
Air and water quality both suffer as a result<br />
of this ongoing legacy of environmental<br />
injustice, impacting the <strong>City</strong>’s public health.<br />
Residents near industrial facilities, often of<br />
Latinx heritage, report higher rates of cancer<br />
and other serious health issues like migraines,<br />
nausea, and difficulty breathing. According<br />
to the Colorado Department of Public<br />
12<br />
Health and the Environment’s (CDPHE)<br />
EnviroScreen, Adams County scored in the<br />
86th percentile <strong>for</strong> environmental burden<br />
out of all Colorado counties (See Table 1).<br />
Several Census tracts within <strong>Commerce</strong> <strong>City</strong><br />
ranked within the 90th percentile (Figure<br />
2). While these analyses demonstrate the<br />
concerning impact of pollution, many of the<br />
recommendations in this <strong>Plan</strong> suggest studies<br />
and capacity-building groundwork that will<br />
prepare C3 to accept and implement a slew of<br />
2023 State and federal grant funds to address<br />
health and economic disparities to maximum<br />
benefit.<br />
Given that much of the available AQ<br />
measurements still rely on industries selfreporting<br />
data, an atmosphere of distrust,<br />
anger, and uncertainty exists amongst<br />
community members. Policies that strive<br />
to increase monitoring of local AQ, analyze<br />
“I am concerned about<br />
the inequities that exist in<br />
CC. I’d love to see ef<strong>for</strong>ts<br />
supported in the lower<br />
and middle CC areas,<br />
led by residents of these<br />
areas with the history and<br />
lived experience to guide<br />
priorities.”<br />
- Survey Respondent
Environmental Justice,<br />
Vulnerability, & Climate Equity<br />
Figure 1 <strong>Commerce</strong> <strong>City</strong>’s EPA EJScreen report.<br />
cumulative pollutant exposure levels, and<br />
reduce toxic air pollutants emitted by<br />
industrial facilities will offer the community<br />
a step towards repairing the damage inflicted<br />
on community health and on the relationship<br />
between residents and <strong>City</strong>.<br />
Ultimately, these community health concerns,<br />
particularly those involving AQ, underpin<br />
the motivation behind this <strong>Plan</strong> and define<br />
the urgency of its policy recommendations.<br />
Additionally, scientists predict that extreme<br />
weather events will continue to escalate<br />
unless drastic measures are taken to curb<br />
13<br />
carbon pollution. Moreover, data shows that<br />
these climatic shifts degrade air and water<br />
quality, worsen flooding and drought, and<br />
harm public health. Some climate-related<br />
impacts will compound on existing issues<br />
like ozone pollution (see Figure 3), worsen<br />
health conditions like asthma, and lead to<br />
increases in mortality. In commissioning this<br />
<strong>Plan</strong>, C3 understands the urgent imperative of<br />
solving existing air and WQ issues<br />
and infrastructure shortcomings<br />
to reduce the public health and<br />
resource management issues.
Environmental Justice,<br />
Vulnerability, & Climate Equity<br />
Table 1 <strong>Commerce</strong> <strong>City</strong>’s EJ Index, 2021.<br />
Selected Variables<br />
Percentile in<br />
State<br />
Percentile in<br />
EPA Region<br />
Percentile in<br />
USA<br />
Particulate Matter 2.5 94 96 85<br />
Ozone 94 95 90<br />
2017 Diesel Particulate Matter 96 98 91<br />
2017 Air Toxics Cancer Risk 97 98 93<br />
2017 Air Toxics Respiratory Health Index 95 97 89<br />
Traffic Proximity 92 94 86<br />
Lead Paint 97 98 92<br />
Superfund Proximity 99 99 98<br />
RMP Facility Proximity 99 99 98<br />
Hazardous Waste Proximity 99 98 90<br />
Figure 2 Environmental Justice burden in <strong>Commerce</strong> <strong>City</strong>.<br />
14
Environmental Justice,<br />
Vulnerability, & Climate Equity<br />
To that end, the <strong>Commerce</strong> <strong>City</strong> community<br />
has spearheaded multiple initiatives,<br />
described in the recommendations section<br />
below, to address EJ issues and monitor air<br />
and water quality. These initiatives and the<br />
air and water monitoring work completed<br />
through this planning process will prepare the<br />
C3 community <strong>for</strong> a future of ever-changing<br />
conditions and uncertainties.<br />
Parallel to the community’s health concerns<br />
is the issue of environmental equity. Rapidly<br />
changing climatic conditions exploit existing<br />
vulnerabilities, disproportionately harming<br />
already struggling communities and reducing<br />
their resiliency. <strong>Commerce</strong> <strong>City</strong> must<br />
carefully plan and implement policies that<br />
invest equitably in communities, reduce<br />
their cost burden, and build capacity. The<br />
recommendations made in this <strong>Plan</strong> offer<br />
ample opportunities to address equity issues<br />
while promoting economic vitality, such as<br />
through reducing energy burden * . The <strong>City</strong><br />
seeks to manage its growth more sustainably;<br />
this demands a dual focus on equity and<br />
climate to break the cycle of carbon pollution<br />
and ensure all can thrive.<br />
* “Energy burden” refers to the percent of a household’s income that goes to pay <strong>for</strong> energy expenditures, such as heating,<br />
cooling, and powering lights and appliances. An energy burden above 6% is considered high, and severe energy burden is<br />
defined as above 10%.<br />
Figure 3 Ozone pollution in <strong>Commerce</strong> <strong>City</strong> relative to national levels.<br />
15
Assessment of Air Quality<br />
Conditions & Concerns<br />
Throughout the EPAC meetings, the<br />
team presented various datasets to<br />
provide context <strong>for</strong> environmental policy<br />
development and prioritization. For example,<br />
according to the CDPHE, Adams County far<br />
outstrips Arapahoe and Denver Counties in<br />
many of the federal Clean Air Act’s criteria<br />
pollutant categories, known as the National<br />
Ambient Air Quality Standards (NAAQS).<br />
These pollutants trend are particularly high<br />
<strong>for</strong> carbon monoxide, nitrogen oxides (NOx),<br />
volatile organic compounds (VOCs), and<br />
sulfur oxides (SOx) (Table 1). These pollutants<br />
and their precursors contribute significantly<br />
to ozone <strong>for</strong>mation and its associated health<br />
problems. As noted previously, the C3 area<br />
ranks within the 90th percentile State-wide<br />
and regionally <strong>for</strong> the EPA’s EJScreen <strong>for</strong><br />
almost every category.<br />
Given this landscape of concerns, the<br />
consultant team completed several AQ<br />
analyses to develop a better understanding of<br />
potential pollution-related impacts to AQ, the<br />
amount of pollution in C3, and the location<br />
of pollutant sources. Air quality refers to the<br />
concentration of solid particle and chemical<br />
pollution in the air of a particular location.<br />
The results of these AQ analyses ultimately<br />
intend to clarify <strong>for</strong> C3 residents one of their<br />
top environmental priority issues and lead to<br />
strategies that limit and reverse the ongoing<br />
degradation of AQ in the <strong>City</strong>.<br />
Completed analyses, such as the AQ<br />
Threshold Report, reveal an inordinate<br />
amount of air emissions sources clustered<br />
in the <strong>City</strong>’s residential areas. The following<br />
subsections summarize the in<strong>for</strong>mation from<br />
each AQ analysis completed. Copies of the<br />
full reports can be found in Appendix B.<br />
“Suncore is killing us.”<br />
- Survey Respondent<br />
Table 2 Annual tons of criteria air pollutant by local county, 2021.<br />
Annual Tons of Criteria Pollutant<br />
Adams County<br />
Arapahoe<br />
County<br />
Denver County<br />
Carbon Monoxide (CO) 2762 938 528<br />
PM 10 773 557 209<br />
PM 2.5 453 506 125<br />
Nitorgen Oxides (NOx) 3367 895 750<br />
VOCs 3719 2059 879<br />
Sulfur Dioxide (SOx) 462 32 99<br />
16
Assessment of Air Quality<br />
Conditions & Concerns<br />
Community-Wide Air<br />
Pollutant and Impacts of<br />
Concern Inventory<br />
The Community-Wide Air Pollutant and<br />
Impacts of Concern Inventory presents a<br />
summary of the <strong>City</strong>’s pollutant sources,<br />
itemized by pollutant and ranked by the<br />
size of pollutant release, within a ½-mile<br />
of the <strong>City</strong> boundary, known as the study<br />
area (Figure 4). Data was compiled <strong>for</strong> each<br />
pollutant of interest, including their relevant<br />
precursors, along with total hazardous<br />
air pollutants (HAPs). The inventory <strong>for</strong><br />
each pollutant contains the total potential<br />
emissions in the study area, a breakdown<br />
of emissions percentage by industry, and<br />
the top ten highest sources of the pollutant.<br />
The reported data is also presented visually<br />
to display the geographic distribution of<br />
emission sources and ground the analysis in<br />
the context of the community.<br />
Figure 5 exemplifies this visual depiction of<br />
the pollutants of concern, in this case <strong>for</strong><br />
the emissions sources of volatile organic<br />
compounds (VOCs) tabulated in the report.<br />
Similar figures <strong>for</strong> each analyzed pollutant<br />
of concern can be reviewed in the original<br />
inventory report on <strong>Commerce</strong> <strong>City</strong>’s website<br />
and in Appendix B.<br />
Air Quality Monitoring <strong>Plan</strong><br />
The Air Quality Monitoring <strong>Plan</strong> identified<br />
locations of existing air monitoring in the<br />
<strong>City</strong>, shown in Figure 6, potential locations<br />
that could fill in gaps in monitoring, and<br />
pollutants of concern that would build a more<br />
comprehensive pollutant impacts database.<br />
Air Quality Significance<br />
Thresholds<br />
The Air Quality Significance Thresholds<br />
report recommends levels of AQ significance,<br />
or the minimum amount of a pollutant<br />
released into the air that experts believe to<br />
warrant additional analysis. The <strong>City</strong> may<br />
wish to use these thresholds to prompt<br />
further evaluation, reporting, and mitigation<br />
actions. For example, dispersion modeling<br />
beyond CDPHE requirements could be<br />
implemented <strong>for</strong> future sources that exceed<br />
these thresholds.<br />
Air Quality Modeling<br />
Guidance<br />
The <strong>City</strong> can publicize the Air Quality<br />
Modeling Guidance document as a tool to<br />
help potential emission sources complete<br />
screening and/or refined dispersion modeling<br />
to demonstrate compliance with NAAQS.<br />
Dispersion modeling is a nuanced technical<br />
exercise, and the document provides direction<br />
on the various factors that shape the modeling<br />
results, like meteorological data,<br />
source input parameters, and more.<br />
17
Figure 4 Air quality study area.<br />
18
Figure 5 VOC facilities.<br />
19
Figure 6 Existing air monitors in <strong>Commerce</strong> <strong>City</strong>.<br />
20
Assessment of Air Quality<br />
Conditions & Concerns<br />
Oil and Gas Air Quality Policy<br />
Analysis<br />
This Policy Analysis originally intended to<br />
develop recommendations <strong>for</strong> additional oil<br />
and gas requirements, but due to the passage<br />
of Ordinance 2266 in 2021, was revised to<br />
encompass the completion of an analysis of<br />
that policy and a comparison to the policies<br />
of nearby municipalities. The Ordinance adds<br />
comprehensive AQ requirements that oil and<br />
gas companies must follow when drilling<br />
and operating new facilities. Examples of<br />
requirements in the Ordinance include<br />
equipment electrification, leak detection<br />
and repair programs, and green completion<br />
utilization.<br />
Emissions Reduction<br />
Guidance<br />
The Emissions Reduction Guidance<br />
document provides additional mitigation<br />
measures not identified in other tasks that the<br />
<strong>City</strong> could implement through rulemaking<br />
to reduce AQ pollutants and emissions. For<br />
example, integrating a best available control<br />
technology (BACT) analysis beyond current<br />
regulatory requirements will demonstrate<br />
that pollutant sources are keeping up with<br />
the rapidly changing technological advances<br />
in emissions control technologies. In<br />
addition to BACT, the <strong>City</strong> could work with<br />
CDPHE, Colorado Oil and Gas Conservation<br />
Commission, EPA, and local environmental<br />
regulators to set targeted control<br />
requirements to larger and more concerning<br />
emission sources in the <strong>City</strong>.<br />
“Muchos venenos como venceno en el aire y otros mas el agua no<br />
sabe bien y no es agradable tomar y muchas enfermedades en<br />
la comunidad en la piel respiratorio sangrado por la nariz migraña<br />
etc.”- Survey Respondent<br />
“There are many toxins here, such as in the air and other places. The water does not<br />
taste good and it isn’t pleasant to drink. There are many diseases in the community<br />
such as respiratory diseases, skin diseases, nose bleeds, migraines, etc.”<br />
- Survey Respondent<br />
21
Assessment of Air Quality<br />
Conditions & Concerns<br />
Summary Air Quality Recommendations<br />
These various AQ analyses undertaken by the <strong>City</strong>, with support from Pinyon, culminated in<br />
a compilation of recommendations that the <strong>City</strong> can implement to stem AQ degradation and<br />
potentially begin improvements.<br />
The following includes those recommendations:<br />
1<br />
2<br />
3<br />
4<br />
5<br />
Continue updates to the impacts inventory to keep residents in<strong>for</strong>med on new<br />
pollutant source details and existing source modifications.<br />
Implement a monitoring network that supplements existing and planned<br />
monitoring to help the community better understand how the existing pollutant<br />
sources impact residents and/or other specific locations such as schools and<br />
parks.<br />
Incorporate AQ threshold levels into <strong>City</strong> ordinances that would require<br />
additional analysis, reporting, and potentially mitigation <strong>for</strong> planned emission<br />
sources.<br />
Update oil and gas regulatory requirements on a continuous basis to keep up<br />
with evolving industry technologies, legal requirements, and best practices.<br />
Reduce current and future emissions by implementing practices such as BACT<br />
analysis requirements and targeted emissions control requirements as needed.<br />
“The quality of our water and air is horrible and affects our health.<br />
I love the area but have concerns about the health safety of my<br />
children.” - Survey Respondent<br />
22
Assessment of Water Quality<br />
Conditions & Concerns<br />
While AQ issues receive much of<br />
the C3 community’s attention and<br />
resources, in recent years, WQ has become<br />
a greater priority <strong>for</strong> the public. With the<br />
State-wide drought impacting millions<br />
of Coloradans, water resources have an<br />
increasing significance in the State’s longterm<br />
sustainability, as well as that of C3<br />
by extension. When drought reduces the<br />
quantity of available water, WQ also suffers<br />
as a result, with less water to dilute pollution<br />
and lower stream flows to carry pollutants<br />
away. WQ specifically describes the condition<br />
of waterbodies - including chemical, physical,<br />
and biological characteristics - in relation<br />
to how suitable the water is <strong>for</strong> particular<br />
purposes such as drinking, recreation,<br />
irrigation, and more.<br />
Moreover, anxieties surrounding emerging<br />
pollutants have spurred concern over the<br />
health impacts of industrial pollution<br />
in C3’s water bodies. In response to the<br />
public’s dual concerns, Pinyon completed<br />
several WQ-related analyses to improve<br />
understanding of the current conditions and<br />
potential pollutant sources <strong>for</strong> waterbodies<br />
flowing through the <strong>City</strong> and to develop<br />
policy recommendations to protect WQ<br />
through low-impact development (LID)<br />
strategies. Westwater Hydrology and<br />
Geomega conducted additional WQ studies<br />
regarding per-and polyfluoroalkyl substances<br />
(PFAS)/ perfluorooctanesulphonate (PFO)<br />
contamination <strong>for</strong> Ecojustice and Suncore,<br />
respectively. Because C3 does not serve as<br />
a water provider or wastewater treatment<br />
utility, the <strong>City</strong> will ultimately need to work<br />
closely with South Adams County Water and<br />
Sewer District (SACWSD) to address WQ<br />
and quantity issues. The following subsections<br />
summarize the analyses completed as part<br />
of the <strong>City</strong>’s overall sustainability planning<br />
process. Full reports related to the below<br />
analyses can be found in Appendix B.<br />
Significant Point and<br />
Nonpoint Pollution Source<br />
Identification<br />
Pollution of surface and groundwater<br />
resources occurs through point and nonpoint,<br />
or diffuse, sources. Point source pollution<br />
includes effluent, or liquid waste, from<br />
industries and wastewater treatment plants<br />
that enters a water body and can be controlled<br />
by treatment of waste materials prior to<br />
discharge. Under the federal Clean Water Act,<br />
the State requires all facilities that discharge<br />
into public water resources to obtain permits<br />
and administers en<strong>for</strong>cement actions to<br />
address permit violations.<br />
In contrast, nonpoint source pollution results<br />
from land-use activities such as application<br />
of fertilizers and pesticides, chemical spills,<br />
mining, or illegal discharges to groundwater.<br />
Other sources may include natural<br />
contamination of groundwater due<br />
to geochemical conditions (e.g.,<br />
arsenic and selenium). Unlike<br />
point sources, nonpoint sources of<br />
23
Assessment of Water Quality<br />
Conditions & Concerns<br />
pollution are difficult to identify and quantify<br />
due to their dispersed nature. For example,<br />
excess nitrogen from synthetic fertilizers<br />
applied to golf courses or athletic fields will<br />
run off the grass in many distributed streams<br />
and may enter different water bodies via<br />
different entry points. In an attempt to corral<br />
nonpoint pollution, the federal Clean Water<br />
Act requires the State to develop reports<br />
identifying which water bodies exceed federal<br />
WQ standards. These reports designate water<br />
bodies with a status known as “impaired,”<br />
and classify the water bodies by pollutant<br />
impairment.<br />
Pinyon identified potential point and<br />
nonpoint pollutant sources <strong>for</strong> <strong>Commerce</strong><br />
<strong>City</strong> that may impact WQ within the <strong>City</strong><br />
boundary. A series of maps (see Figure<br />
7) were developed to provide a highlevel<br />
understanding of source categories,<br />
densities, and locations. The <strong>City</strong> may use<br />
this in<strong>for</strong>mation <strong>for</strong> a range of planning<br />
and general in<strong>for</strong>mation purposes such as<br />
developing construction or LID plans that<br />
position projects to avoid land disturbances<br />
that could release pollutants into vulnerable<br />
water bodies and remediate soils with high<br />
contaminant levels through tree plantings,<br />
mycellium, and other nature-based<br />
restoration and regeneration techniques.<br />
Water Quality Evaluation<br />
To kick off the WQ evaluation process,<br />
Pinyon began with a high-level assessment<br />
to understand the current conditions of C3’s<br />
water resources. This analysis component<br />
included a review of stream monitoring<br />
activities to assess any data gaps and advise<br />
the <strong>City</strong> on any additional monitoring<br />
needed; additionally, an examination of WQ<br />
data was conducted to provide a basis <strong>for</strong><br />
recommendations regarding the maintenance,<br />
improvement, and protection of C3’s water<br />
resources.<br />
The evaluation confirmed that most of the<br />
identified WQ issues within the <strong>City</strong> either<br />
have been, or are in the process of being,<br />
addressed through regulatory processes.<br />
The identification of WQ issues and<br />
subsequent impairment status will trigger<br />
certain treatment action requirements and<br />
unlock State or federal funds to remediate<br />
the pollution. Pinyon’s evaluation did<br />
identify nutrients (total nitrogen and total<br />
phosphorus) and temperature as potential<br />
future contaminants of concern. Finally,<br />
despite ef<strong>for</strong>ts to achieve compliance with E.<br />
coli WQ standards, multiple stream segments<br />
are still in non-compliance <strong>for</strong> this pollutant.<br />
Low-Impact Development<br />
Guidance Manual<br />
The <strong>City</strong> can use the LID Guidance Manual<br />
(Manual) developed by Pinyon as a<br />
tool to help shape their sustainable<br />
response to growth by integrating<br />
the C3 community’s environmental,<br />
social, and economic needs.<br />
24
Figure 7 Point and nonpoint source pollution map.<br />
25
Assessment of Water Quality<br />
Conditions & Concerns<br />
LID is a comprehensive land planning and<br />
engineering design approach to managing<br />
stormwater runoff by mimicking how water<br />
used to cycle through the environment be<strong>for</strong>e<br />
significant manmade alterations occurred,<br />
like paving over grasslands. The Manual<br />
provides a road map <strong>for</strong> <strong>City</strong> staff, developers,<br />
and designers to implement LID.<br />
By maintaining the local watershed’s historic<br />
water cycle, LID aims to protect the ecological<br />
quality of C3’s water bodies and reduce<br />
flooding. This approach is accomplished by<br />
estimating what the region’s pre-development<br />
water cycle looked like, through modeling of<br />
infiltration rates (how fast water absorbs into<br />
the ground), how much and how often water<br />
flows through the area, and groundwater<br />
recharge. Ultimately, these strategies slow<br />
down the flow of urban stormwater that<br />
typically contains a variety of harmful<br />
pollutants, remove those pollutants, and<br />
release cleaner water into the surrounding<br />
water bodies or drinking water sources.<br />
LID emphasizes the conservation of green<br />
spaces, the use of native plants, and the<br />
implementation of dispersed stormwater<br />
control measures (SCMs), which means<br />
that stormwater is managed on a site-by-site<br />
basis throughout the <strong>City</strong> with many small<br />
installations rather than one large centralized<br />
SCM. Practitioners will often use the terms<br />
Green Infrastructure and Better Site Design<br />
interchangeably with LID.<br />
Land-use Policy<br />
Recommendations<br />
Pinyon and <strong>City</strong> staff also drafted a LID policy<br />
<strong>for</strong> passage into a <strong>City</strong> ordinance establishing<br />
a LID criterion <strong>for</strong> all projects that require<br />
a grading permit; checklists were developed<br />
that will be available to share with developers.<br />
For all grading permit applications reviewed<br />
by the <strong>City</strong>’s Public Works Department,<br />
the policy would require the use of one or<br />
a combination of LID techniques, designed<br />
to treat the stormwater resulting from<br />
no less than 75% of the total disturbed<br />
project area. If, in the judgment of the <strong>City</strong><br />
Engineer, the project site’s unique engineering<br />
characteristics preclude the applicant<br />
from meeting one or more requirements,<br />
then a design alternative will be allowed,<br />
provided that the design results in equal<br />
or better stormwater quality than through<br />
compliance with the otherwise applicable<br />
requirement. The requirements must comply<br />
with <strong>Commerce</strong> <strong>City</strong>’s municipal separate<br />
storm sewer system (MS4) permit, lessen<br />
the WQ impacts of development by using<br />
smart growth practices, and integrate LID<br />
practices and standards <strong>for</strong> stormwater<br />
pollution mitigation through means of<br />
infiltration, evapotranspiration, and rainfall<br />
harvest and use. LID shall be inclusive of new<br />
development or redevelopment requirements.<br />
26
Assessment of Water Quality<br />
Conditions & Concerns<br />
Summary Water Quality Recommendations<br />
Based on the initial findings of the above WQ analyses, recommendations include:<br />
1<br />
Track WQ monitoring activities and discharge permit violations. While the<br />
Pinyon team concluded that there was no immediate need <strong>for</strong> selective WQ<br />
monitoring at this time, they recommended that the <strong>City</strong> develop a system<br />
to track WQ monitoring activities and discharge permit compliance <strong>for</strong><br />
waterbodies within <strong>City</strong> boundaries. Illicit discharges enter all of C3’s receiving<br />
waters each year and <strong>City</strong> staff regularly converse with CDPHE to locate priority<br />
areas <strong>for</strong> pollution. Tracking WQ and violations real-time will allow the <strong>City</strong> to<br />
flag issues of concern and facilitate discussions with CDPHE and Adams County<br />
to address these hotspots. Real-time monitoring will require the purchase of<br />
equipment and additional staff <strong>for</strong> data analysis.<br />
Develop a high-level Stream Corridor Management Reference Document with a<br />
limited menu of easily implementable tools and approaches designed specifically<br />
<strong>for</strong> C3. Examples of the types of approaches that will help C3 improve the WQ<br />
in their rivers and streams include:<br />
► Managing impacts associated with riparian buffer degradation and maintenance and<br />
protection of undeveloped buffers, or strips of land that protects a river ecosystem from<br />
human disturbance.<br />
2<br />
► Managing impacts associated with impervious cover, such as parking lots, roads, and<br />
buildings, and the associated urban runoff through the implementation of stormwater<br />
infrastructure design standards that incorporate LID and green infrastructure practices<br />
and design criteria.<br />
► Managing impacts of pollutants associated with land-use activities such as establishing and<br />
en<strong>for</strong>cing restricted spray zones <strong>for</strong> pesticides; educating citizens, HOAs, and businesses<br />
about the use of lawn care chemicals; banning dangerous chemicals such as neonicotinoid<br />
and glyphosate; requiring licensing of pesticide applications; and establishing an Integrated<br />
Pest Management Policy.<br />
► Investigating sources of E. coli (i.e., pet waste, human waste) and developing a program to<br />
install pet waste clean-up stations, public restrooms, and signs.<br />
27
Greenhouse Gas Inventory<br />
Beyond the <strong>City</strong>’s existing and historic<br />
air and water pollution concerns, recent<br />
climatological data reveals a worrying<br />
acceleration in the impacts of shifting climate<br />
conditions across the State. C3 recognizes the<br />
increasingly urgent need to address its own<br />
role in the climate crisis and enact strategies<br />
to adapt to these new uncertain conditions,<br />
such as drought, extreme weather events, and<br />
wildfires.<br />
To identify the strategies with the highest<br />
GHG reduction impact in the community,<br />
Lotus completed a GHG emissions inventory<br />
analysis on behalf of the <strong>City</strong>. The results of<br />
the inventory revealed high emissions per<br />
capita and per household rates as compared<br />
to several similar cities in the State and<br />
nationally, especially when factoring in the<br />
<strong>City</strong>’s industrial sources (see Table 3).<br />
The inventory will serve as the baseline<br />
against which the <strong>City</strong>’s future inventories will<br />
be compared and which targets should be set.<br />
By tracking emissions reductions bi-annually,<br />
the <strong>City</strong> will improve their understanding<br />
of emissions reduction trends and sectors to<br />
focus ef<strong>for</strong>ts <strong>for</strong> improvement.<br />
Based on the GHG inventory, a business-asusual<br />
(BAU) model <strong>for</strong> the entire community<br />
was created, which estimates the predicted<br />
year-by-year emissions until 2050. BAU<br />
assumes current demographic and growth<br />
conditions and statewide policy trends, as<br />
well as no additional policy actions on the<br />
part of C3. During the policy development<br />
process, these findings were disseminated<br />
as background in<strong>for</strong>mation to provide <strong>City</strong><br />
staff and the community with real data and<br />
28<br />
context <strong>for</strong> their feedback and input on policy<br />
development.<br />
Methodology<br />
The GHG inventory accounted <strong>for</strong> all carbonemitting<br />
activities occurring within the<br />
municipal boundaries <strong>for</strong> the year 2019. This<br />
year was chosen to capture the most recently<br />
available, complete data that reflected typical<br />
activities and behaviors in the community,<br />
as the COVID-19 pandemic created unusual<br />
circumstances that impacted GHG emissions.<br />
The inventory involved calculating key<br />
metrics, including emissions by sector and by<br />
source. Sectors refer to the general categories<br />
of activities that produce emissions and<br />
include:<br />
► Building Energy Use (residential and<br />
commercial).<br />
► Transportation.<br />
► Waste.<br />
► Industrial Processes and Product Use<br />
(IPPU).<br />
The accounting process employed a globallyaccepted<br />
standard, the Global Protocol <strong>for</strong><br />
Community-Scale GHG Inventories (GPC),<br />
to generate a standard BASIC inventory. A<br />
BASIC inventory standardizes the reporting<br />
of emissions by emissions source rather<br />
than scope, which refers in this context<br />
to the physical boundaries drawn around<br />
which emissions to count. Using this widely<br />
recognized method allows C3 to compare<br />
its GHG emissions to those of similar<br />
communities and measure changes over time.
Table 3 <strong>Commerce</strong> <strong>City</strong>’s GHG emissions compared with regional and national counterparts.<br />
Comparision <strong>City</strong> Inventory Year Population<br />
Number of<br />
Households<br />
BASIC GHG<br />
Emissions<br />
(mtCO2e)<br />
Emissions<br />
per Capita<br />
Emissions per<br />
Household<br />
<strong>Commerce</strong> <strong>City</strong>, CO 2019 56,448 16,818 842,144 14.9 50.1<br />
<strong>Commerce</strong> <strong>City</strong>, CO with<br />
Industrial Sources<br />
2019 56,448 16,818 1,945,937 34.5 115.7<br />
Denver, CO 2019 727,211 294,358 8,428,848 11.6 28.6<br />
Boulder, CO 2019 119,006 46,217 1,466,276 12.3 31.7<br />
Lakewood, CO 2018 151,411 67,238 1,480,119 9.8 22.0<br />
Fort Collins, CO 2019 170,245 72,603 2,100,000 12.3 28.9<br />
Longmont, CO 2019 96,577 36,336 991,627 10.3 27.3<br />
San Antonio, TX 2019 1,508,083 501,400 15,612,494 10.4 31.1<br />
Concord, NH 2019 43,244 18,663 415,727 9.6 22.3<br />
San Jose, CA 2019 1,027,690 325,114 5,477,619 5.3 16.8<br />
Tacoma, WA 2019 212,869 83,688 1,678,000 7.9 20.1<br />
Eugene, OR 2019 186,302 70,332 1,000,000 5.9 14.2<br />
Ann Arbor, MI 2019 120,735 47,765 2,100,000 17.4 44.0<br />
Milwaukee County, WI 2018 954,209 382,070 12,550,249 13.2 32.8<br />
Las Cruces, NM 2018 101,742 39,934 904,109 22.6 22.6<br />
29
Greenhouse Gas Inventory<br />
Data Sources<br />
The consultant team aggregated data from<br />
across the municipality as well as regional,<br />
State, and federal sources to develop<br />
the inventory. A GPC BASIC inventory<br />
involves counting all emissions related<br />
to energy, which includes transportation<br />
fuels, electricity, natural gas from stationary<br />
sources, emissions generated from certain<br />
aspects of waste, and, importantly <strong>for</strong> C3,<br />
fugitive emissions. Additional data from<br />
industrial activities within the C3 boundary<br />
were obtained to capture a more accurate<br />
picture. The BAU and policy models were<br />
developed using predictions from commonly<br />
accepted assumptions, academic research,<br />
and trend analyses to estimate growth and<br />
external policy developments.<br />
In 2019, total greenhouse gas emissions in<br />
<strong>Commerce</strong> <strong>City</strong> were 1,945,937 metric tons<br />
of carbon dioxide equivalent (mt CO2e).<br />
As shown in Figure 8, the largest emissionsproducing<br />
sector was the IPPU sector, which<br />
accounted <strong>for</strong> 57% of all GHG emissions.<br />
When looking at only core emissions by<br />
source, building electricity produced the<br />
most emissions (35%), followed by on-road<br />
transportation activities (32%) and natural<br />
gas use (23%). 10% of emissions came<br />
from waste activities (including wastewater<br />
treatment). See Table 3 <strong>for</strong> a breakdown of<br />
emission by sector and source.<br />
Figure 8 Total 2019 GHG emissions.<br />
Electricity 15%<br />
Residential 6%<br />
Commercial 9%<br />
Industrial 0.5%<br />
Natural Gas 10%<br />
Residential 4%<br />
Commercial 6%<br />
Fugitive Emissions 0.3%<br />
Other Building Fuel Use 0.0%<br />
Transportation 14%<br />
Fossil Fuel Vehicles 14%<br />
Electric Vehicles 0.1%<br />
Transit 0.1%<br />
Rail 0.0%<br />
Waste 4%<br />
Solid Waste 4%<br />
Wastewater 0.3%<br />
IPPU 57%<br />
Refrigerants 0.4%<br />
Industrial Emitters 56%<br />
30
Greenhouse Gas Inventory<br />
Table 4 <strong>Commerce</strong> <strong>City</strong>’s total 2019 GHG emissions by source and sector.<br />
Emissions Sector<br />
GHG Emissions<br />
(mt CO2e)<br />
Percent of Total<br />
Percent of Core<br />
Emissions<br />
Buildings 489,212 25% 58%<br />
Electricity Use 293,612 15% 35%<br />
Natural Gas 195,477 10% 23%<br />
Other Energy Use 114 0.01% 0.01%<br />
Transportation 274,753 14% 33%<br />
Waste 78,179 4% 9%<br />
Solid Waste 72,656 4% 9%<br />
Wastewater Treatment 5,523 0.3% 1%<br />
Industrial Processes & Product<br />
Use (IPPU)<br />
1,103,792 57% NA<br />
Suncor Energy 949,972 49% NA<br />
Total 1,945,937 100%<br />
Based on this analysis, the greatest impact<br />
on overall GHG emissions will come from<br />
the <strong>City</strong> working with industry partners to<br />
develop targeted reduction strategies and<br />
policies addressing energy efficient and<br />
photovoltaic (PV) ready building codes.<br />
Another significant target <strong>for</strong> emissions<br />
reductions is the buildings sector (Figure 9),<br />
of which commercial and industrial buildings<br />
comprise 61% of the emissions. Homes<br />
accounted <strong>for</strong> 38% of building emissions.<br />
The source of those emissions was split 60%<br />
from electricity and 40% from natural gas<br />
use, indicating policies that encourage energy<br />
efficiency, deployment of renewables, building<br />
electrification, and engagement with the<br />
business and industry sector will play a major<br />
role in C3’s GHG reduction strategy.<br />
The third largest sector, transportation, can be<br />
broken down into type of vehicle: passenger<br />
vehicles account <strong>for</strong> 39% of transportation<br />
emissions, while light duty trucks comprise<br />
50%. Freight contributed 10%, while rail,<br />
transit, and electric vehicles (EV) emitted an<br />
insignificant percentage of the total. Given<br />
these findings, community-wide promotion<br />
of EVs and support <strong>for</strong> accessible, creative<br />
multi-modal transportation options – from<br />
protected bicycle lanes to public transit to<br />
bike-, scooter-, and car-share programs – can<br />
significantly reduce overall emissions.<br />
The inventory paints a picture of how the C3<br />
community’s activities contribute<br />
to global emissions and local AQ<br />
issues. When integrated with<br />
the final sustainability strategy<br />
31
Greenhouse Gas Inventory<br />
Figure 9 Stationary emissions detail*.<br />
*3 sources were
Greenhouse Gas Inventory<br />
matrix, the core emissions inventory results<br />
(see Figure 10) contextualizes the final set<br />
of policy recommendations and in<strong>for</strong>ms<br />
the prioritization of actions. As C3 pursues<br />
environmental action future inventories<br />
can be compared against the baseline and<br />
model results to assess progress towards C3’s<br />
environmental goals. C3 can compare results<br />
with surrounding communities to set targets<br />
<strong>for</strong> regional collaboration and leadership (see<br />
below and Table 3).<br />
Climate action goals adopted by<br />
neighboring communities:<br />
State of Colorado<br />
26% by 2025 | 50% by 2030 | 90% by 2050<br />
Denver<br />
65% emissions reductions by 2030<br />
Carbon neutral by 2040<br />
Westminster<br />
26% by 2025, 50% by 2030, 90% by 2050<br />
Thornton<br />
50% by 2030<br />
Longmont<br />
66% by 2030 | 69% by 2050<br />
Following the inventory process, a GHG<br />
emissions model was used to assess the<br />
impact of specific policy recommendations.<br />
This modeling ef<strong>for</strong>t will help in<strong>for</strong>m<br />
the <strong>City</strong>’s priorities moving <strong>for</strong>ward and<br />
demonstrate to C3 residents and the business<br />
community the potential GHG emissions<br />
reduction impact of implementing their<br />
recommendations in the long run.<br />
Business-As-Usual Forecast<br />
Lotus began with building the <strong>City</strong>’s BAU<br />
model, which estimated the community-wide<br />
GHG emissions by 2030 and 2050. The BAU<br />
model projections were based on estimates<br />
of population growth, number of registered<br />
vehicles, the intensity of greenhouse effect of<br />
different energy sources, and fuel efficiency<br />
<strong>for</strong>ecasts. Ultimately, the model predicts C3<br />
will reduce its total emissions by 2030 to<br />
1,905,000 mt CO2e but see an increase by<br />
2050 to 2,058,000 mt CO2e. Figure 11 breaks<br />
down these projections by emissions source.<br />
These conflicting results can be explained by<br />
analyzing the factors that build the model. As<br />
the grid serving C3 increases the percentage<br />
of renewable energy sources and grows<br />
cleaner, the intensity of the greenhouse gas<br />
effect of electricity will diminish. Critical to<br />
33
Greenhouse Gas Inventory<br />
Figure 11 Business-as-Usual GHG emissions projections to 2050.<br />
these projections is the assumption that Xcel Energy and United Power, the electricity providers in <strong>Commerce</strong> <strong>City</strong>, will meet<br />
their renewable energy targets on time and in accordance with the State’s GHG roadmap. The State requires private utilities to<br />
meet renewable portfolio standards (RPS) and select utilities to transition to 100% clean energy by 2050. Xcel Energy has pledged<br />
to achieve an 80% reduction in carbon emissions from its electricity by 2030 and carbon-free electricity and net-zero emissions<br />
gas by 2050. The <strong>City</strong> will reap the benefits of these trends toward renewable energy by 2030, accounting <strong>for</strong> that decrease in<br />
BAU emissions.<br />
However, by 2050, population growth and the diminishing returns of emissions savings from energy efficiency and<br />
building electrification will compensate <strong>for</strong> any reductions in emission factors. The balance between all these factors<br />
will ultimately tip towards increasing pollution if the <strong>City</strong> takes no significant actions, underscoring the need <strong>for</strong><br />
sustainability policy, planning, and implementation.<br />
34
Strategy Models<br />
During the policy development process, the EPAC and the<br />
community provided input to select their highest priority<br />
policy strategies (see <strong>Sustainability</strong> Focus Area chapters below<br />
<strong>for</strong> more in<strong>for</strong>mation on these policies). These top priorities<br />
were modeled against the 2019 baseline core emissions and<br />
the BAU <strong>for</strong>ecast to determine the estimated reductions in<br />
GHG emissions (Figure 12). Also modeled was the potential<br />
increase in GHG emissions due to the newly permitted oil and<br />
gas wells.<br />
<strong>Commerce</strong> <strong>City</strong> is striving to achieve GHG reductions that<br />
align with State level goals, which call <strong>for</strong> a 50% reduction<br />
in emissions by 2030 and a 90% reduction by 2050.<br />
The modeled strategies are estimated to result in a 46%<br />
reduction in emissions by 2030 and a 77% reduction by<br />
2050. While <strong>Commerce</strong> <strong>City</strong> can make significant progress<br />
to reduce emissions, additional work will be needed to<br />
reach the <strong>City</strong>’s goal of aligning with the State.<br />
Figure 12 Emissions reduction model results.<br />
35
Strategy Models<br />
The modeled strategies include the following list:<br />
Promote energy efficiency <strong>for</strong> residential buildings.<br />
Promote energy efficiency <strong>for</strong> commercial buildings.<br />
Promote fuel switching (i.e., building electrification) through<br />
incentive programs, public campaigns, and initiatives.<br />
Promote rooftop and community solar energy production.<br />
Support and promote equitable EV adoption.<br />
Reduce idling and air pollution from vehicles.<br />
Prioritize multi-modal transportation options.<br />
Achieve 85% waste diversion by 2050.<br />
All new oil and gas developments are carbon neutral.<br />
36
Strategy Models<br />
Table 5 <strong>Commerce</strong> <strong>City</strong>’s <strong>Sustainability</strong> Aspirations.<br />
Sector Strategy Model Assumptions<br />
Building Energy<br />
On-Road<br />
Transporation<br />
Waste<br />
Oil and Gas<br />
Promote energy efficiency <strong>for</strong><br />
residential buildings.<br />
Promote energy efficiency <strong>for</strong><br />
commercial buildings.<br />
Promote fuel switching (i.e.,<br />
electrification) through incentive<br />
programs and public campaigns/<br />
initiatives.<br />
Promote rooftop and community<br />
solar.<br />
Support and promote equitable<br />
electric vehicle adoption.<br />
Reduce idling and air pollution<br />
from traffic.<br />
Prioritize multi-modal<br />
transportation options.<br />
Achieve 85% waste diversion by<br />
2050.<br />
All new oil and gas developments<br />
are carbon neutral.<br />
Reduce energy use by 25% by<br />
2030 and 40% by 2050.<br />
Reduce energy use by 25% by<br />
2030 and 40% by 2050.<br />
Electrify 15% of all buildings by<br />
2030 and 60% by 2050.<br />
15% increase in solar adoption<br />
in first 5 years after streamlined<br />
permitting.<br />
30% of light duty vehicles in the<br />
community are EVs by 2030 and<br />
75% of light duty vehicles in the<br />
community are EVs by 2050.<br />
Reduce idling by 20% by 2030 and<br />
80% by 2050.<br />
Mode shift of 20% by 2030 and<br />
50% by 2050.<br />
85% waste diversion by 2050.<br />
Offsetting 46 standard new wells<br />
in 2024 with 5% annual increase.<br />
37
Strategy Models<br />
Estimated Impact of<br />
Strategies<br />
The estimated emissions reduction potential<br />
of the strategies as detailed in Table 4 above<br />
are compared against the <strong>City</strong>’s 2019 core<br />
emissions (i.e., those from building energy<br />
use, transportation, and waste activities).<br />
While reducing industrial emissions is<br />
imperative to improving community health<br />
and sustainability, and preventing the worst<br />
impacts of the climate crisis, <strong>Commerce</strong> <strong>City</strong><br />
has fewer opportunities to directly impact<br />
industrial emissions within its jurisdiction.<br />
There<strong>for</strong>e, the <strong>City</strong> is focusing its emissions<br />
reduction work on the areas where it may be<br />
able to exert greater impact through policy<br />
and programs to reduce emissions.<br />
All the highest priority strategies combined<br />
are estimated to reduce the <strong>City</strong>’s core GHG<br />
emissions over the 2019 baseline by about<br />
46% by 2030 and about 77% by 2050. By<br />
sector, the greatest reductions will come from<br />
the building energy sector, followed by onroad<br />
transportation.<br />
Ultimately, the most important strategies<br />
from a GHG emissions reduction perspective<br />
are the prioritization of residential and<br />
commercial building energy efficiency, which<br />
would together comprise 39% of emissions<br />
reductions by 2050, and, secondly, the<br />
prioritization of multi-modal transportation<br />
options, which would comprise 25% of total<br />
emissions reductions by 2050.<br />
Figure 13 shows the carbon pollution<br />
reductions estimated by the model by sector,<br />
and underscores the significance of building<br />
energy and transportation strategies. By<br />
contrast, increased oil and gas activity would<br />
add back 19,985 mt CO2e, or approximately<br />
one-quarter of the anticipated GHG<br />
emissions savings from other strategies.<br />
It should be noted that modeling these<br />
strategies provides an assessment only of<br />
their GHG emissions reduction potential.<br />
Many of these strategies, such as reducing<br />
idling and diverting waste, will provide the<br />
community with additional co-benefits<br />
including improving physical health and<br />
AQ and supporting economic development<br />
opportunities.<br />
Finally, these modeling results are estimates<br />
built on many assumptions. The degree to<br />
which trends in the <strong>City</strong> end up following<br />
these assumptions and meet or exceed the<br />
assumed targets (see Table 5) will influence<br />
the accuracy of these predictions. The <strong>City</strong><br />
may choose to pursue different combinations<br />
of strategies and with different targets as<br />
well; the modeled policies represent a few of<br />
many recommendations detailed in following<br />
sections of the <strong>Plan</strong>.<br />
38
Strategy Models<br />
Figure 13 Share of emissions reductions by strategy type based on modeling.<br />
Strategy Sector<br />
Transporation Building Energy Waste<br />
Strategy<br />
Share of Emissions<br />
Prioritize muilti-modal transporation options. 25%<br />
Support & promote equitable electric vehicle adaptation. 22%<br />
Reduce idling & air pollution from traffic. 2%<br />
Promote energy efficiency <strong>for</strong> commercial buildings. 24%<br />
Promote energy efficiency <strong>for</strong> residential buildings. 14%<br />
Promote fuel switching (i.e. electrification) through<br />
incentive programs & public campaigns/initaitives.<br />
10%<br />
Promote rooftop & community solar. 2%<br />
Achieve 85% waste diversion by 2050. 0.7%<br />
39
A Public Engagement-Driven<br />
Process<br />
A<br />
key EJ principle is that those most<br />
impacted should frame the scope of<br />
the problems and drive their solutions.<br />
In recognition of this, the <strong>City</strong> supported<br />
an EPAC-driven process that developed<br />
most of the policy recommendations from<br />
community input and priorities. Some<br />
recommendations have been modified<br />
slightly to include C3 staff ’s expertise, as<br />
well as extensive research into best practices<br />
employed in other communities with<br />
characteristics similar to C3.<br />
With assistance from the EPAC members,<br />
extensive public engagement was conducted<br />
to capture valuable feedback from the<br />
broader public on the draft policies. These<br />
include a variety of outreach opportunities<br />
such as community meetings, EPAC-hosted<br />
dinners (i.e., meetings in a box), high<br />
school student intern input, attendance at<br />
community events, intercept interviews, and<br />
a public survey (see the section Community<br />
Survey and In<strong>for</strong>mant Interviews in<br />
Appendix E <strong>for</strong> details on the findings from<br />
these outreach ef<strong>for</strong>ts). By allowing the<br />
voices of the community to drive policy<br />
development, the <strong>City</strong> intends<br />
<strong>for</strong> the recommendations made<br />
in this <strong>Plan</strong> to reflect the specific<br />
C3 context and the community’s<br />
values, priorities, and culture.<br />
40
A Public Engagement-Driven<br />
Process<br />
Meetings in a Box<br />
In collaboration with the <strong>City</strong>, EPAC<br />
members hosted Meetings in a Box to seek<br />
community input on the environmental<br />
policy recommendations. The goals of<br />
these meetings were to connect community<br />
members to the planning process,<br />
gather feedback on key sustainability<br />
and environmental issues in their local<br />
communities, and capture their visions <strong>for</strong><br />
the <strong>City</strong>’s future.<br />
Over dinner, EPAC members facilitated<br />
conversations with their invited guests through a number of activities including a worksheet to<br />
brainstorm civic engagement opportunities, a ranking of environmental concerns, and creative<br />
visioning exercises.<br />
─ Activity 1: Civic Engagement<br />
In acknowledgement of the importance of building trust with the larger C3 community, the<br />
<strong>City</strong> has sought to improve ways to reach its residents. The consultant team and EPAC worked<br />
together to develop a brainstorming exercise to encourage dinner guests to think broadly about<br />
community engagement.<br />
─ Activity 2: Environmental Challenges<br />
Guests were asked to discuss and rank their top environmental concerns in the <strong>City</strong>. After the<br />
ranking activity, guests brainstormed solutions and ways <strong>for</strong> the community to support the<br />
policy recommendations.<br />
─ Activity 3: Visualizations<br />
Guests were asked to use markers to draw out their vision <strong>for</strong> their ideal future <strong>Commerce</strong> <strong>City</strong><br />
or take photos of what they love about their community, what they want to change,<br />
and what represents their community.<br />
Throughout the dinner, guests were encouraged to jot down any thoughts, concerns,<br />
or questions on notecards as conversations progressed.<br />
41
A Public Engagement-Driven<br />
Process<br />
Meetings in a Box Artifacts<br />
42
A Public Engagement-Driven<br />
Process<br />
To supplement the policy recommendations<br />
and provide a more tangible implementation<br />
approach, the <strong>City</strong> hosted an additional<br />
outreach event with the business and<br />
industry community and vetted the<br />
strategies and actions with key <strong>City</strong> staff.<br />
These engagements focused on ensuring<br />
that the <strong>City</strong> and community can act on<br />
and integrate the proposed actions and<br />
strategies into existing operations; leverage<br />
partnerships and synergies to support<br />
existing and new work; and position C3 to<br />
stay competitive and implement upcoming<br />
federal and State funding opportunities,<br />
including turf replacement programs, EV<br />
and solar photovoltaic (PV) installations,<br />
and brownfield redevelopment. Ultimately,<br />
this comprehensive, whole-of-government<br />
approach works to realize the collective vision<br />
<strong>for</strong> a sustainable <strong>Commerce</strong> <strong>City</strong>.<br />
Prioritizing the voices of the community roots<br />
the recommended strategies and actions in<br />
the <strong>City</strong> firmly in the local context and values.<br />
Equally important to consider is the potential<br />
cost, staff capacity requirements, and priority<br />
level of the various strategies; this in<strong>for</strong>mation<br />
will allow the <strong>City</strong> to better plan and budget<br />
<strong>for</strong> subsequent implementation work.<br />
43
<strong>Sustainability</strong> Focus Areas<br />
& Priorities<br />
This community-led ef<strong>for</strong>t developed recommendations that focus on the needs and<br />
opportunities at the local level. The resulting impacts are expected to positively contribute<br />
to the lives and health of <strong>Commerce</strong> <strong>City</strong> residents as well as the vibrancy of the business<br />
community. The EPAC’s journey of learning led the group to develop some initial high-level<br />
priorities <strong>for</strong> the <strong>City</strong>:<br />
1<br />
2<br />
3<br />
4<br />
First and <strong>for</strong>emost, the EPAC has a desire to continue their work as a permanent<br />
<strong>City</strong>-sanctioned advisory committee. They desire to continue to be community<br />
led, by residents, <strong>for</strong> residents, with support from the <strong>City</strong>.<br />
Second, there are opportunities throughout the recommendations to leverage<br />
existing <strong>City</strong> initiatives and projects by further incorporating environmental and<br />
public health considerations.<br />
Third, <strong>Commerce</strong> <strong>City</strong> has extensive networks that can be utilized to provide<br />
education and engagement opportunities to residents and businesses to accelerate<br />
sustainable trans<strong>for</strong>mation. Initial education and outreach should focus on air<br />
and water quality preservation and restoration. Continued work should focus on<br />
developing deep and consistent partnerships with community institutions and<br />
organizations.<br />
Lastly, the EPAC would relish ongoing study sessions throughout the year with<br />
<strong>City</strong> Council and utility providers to analyze sustainability solutions, evaluate<br />
implementation progress, and provide input into community decisions.<br />
The <strong>City</strong> identified several key sustainability focus areas around which to center the policy<br />
recommendations. These were developed to reflect the broad scope of sustainability action<br />
that the <strong>City</strong> intends to take and each of the policy strategies and actions are categorized under<br />
one focus area. By adopting this expansive, comprehensive lens the <strong>City</strong> can work<br />
towards integrating climate considerations and sustainability actions throughout the<br />
government and the community. A whole-of-government, equity-focused approach<br />
to public and environmental health will ensure the entire community will be able to<br />
thrive in a future of uncertainty and change.<br />
44
<strong>Sustainability</strong> Focus Areas<br />
& Priorities<br />
The focus areas include the<br />
following:<br />
► Education and Outreach<br />
► Energy Efficiency<br />
► Renewable Energy<br />
► Adaptation and Mitigation<br />
► Recycling and Waste Diversion<br />
► Water<br />
► Transportation<br />
► Community Health<br />
► Funding and Purchasing<br />
► Biodiversity, Tree Canopy, and Food<br />
Each of the following sections describes<br />
a particular focus area, the key policy<br />
strategies and actions, and opportunities to<br />
promote equity throughout C3. Although<br />
policies are grouped under one focus area<br />
each, they all interact and support crossfocus<br />
area strategies and actions to varying<br />
degrees. Some policies may fall into multiple<br />
categories, which will be noted, but are listed<br />
in the focus area by their greatest estimated<br />
impact. The sum total of these policies will<br />
ultimately push the <strong>City</strong> towards a more<br />
sustainable future. The recommendations<br />
represent actions that the <strong>City</strong> can effectively<br />
take over the next five to ten years.<br />
Overview of Focus Areas<br />
<strong>Commerce</strong> <strong>City</strong> has divided its sustainability<br />
work into 10 different focus areas to identify<br />
the key paths of action <strong>for</strong> the <strong>City</strong> to target<br />
its sustainability work. Together these focus<br />
areas build a comprehensive, whole-ofgovernment<br />
framework that defines the <strong>City</strong>’s<br />
approach to environmental and resiliency<br />
action and a vision <strong>for</strong> a sustainable C3.<br />
“The most important piece<br />
is stakeholding- I’ve seen<br />
communities move <strong>for</strong>ward<br />
without doing that and it’s not<br />
efficient. To have stakeholders<br />
and gather feedback is<br />
important, as a resident and a<br />
business. It’s important that we<br />
take part in it.”<br />
- Worker and Resident of<br />
<strong>Commerce</strong> <strong>City</strong><br />
45
<strong>Sustainability</strong> Focus Areas<br />
Education<br />
and<br />
Outreach<br />
Energy<br />
Efficiency<br />
Renewable<br />
Energy<br />
Adaptation<br />
and<br />
Mitigation<br />
Recycling<br />
and<br />
Waste<br />
Diversion<br />
Throughout this planning ef<strong>for</strong>t, the <strong>City</strong> has sought to invest in building<br />
trust with the community and to identify opportunities to reach the<br />
most impacted communities (i.e., those overburdened by environmental<br />
pollution). Additionally, building the capacity of businesses, <strong>City</strong> staff, and<br />
residents through communications, engagement, and training will support<br />
the implementation of the remaining policy recommendations and ensure<br />
this work remains community-driven and validated. Appendix D includes<br />
recommendations <strong>for</strong> community engagement and education campaigns based<br />
on community insight and best practices in equitable community engagement.<br />
As the <strong>City</strong> looks to act on the results of its inaugural GHG inventory, energy<br />
efficiency strategies have the potential to significantly reduce energy costs <strong>for</strong><br />
residents and businesses while also reducing GHG emissions from across the<br />
community. Energy efficiency technologies are some of the most cost-effective<br />
strategies to reduce carbon pollution and support community members,<br />
including businesses, that cannot af<strong>for</strong>d infrastructure overhauls immediately.<br />
Renewable energy plays a crucial role in global ef<strong>for</strong>ts to reduce carbon<br />
pollution, improve AQ, and develop energy independence and resilience against<br />
predicted extreme weather events such as flooding and drought. The <strong>City</strong><br />
can support its pollution reduction goals by demonstrating leadership in the<br />
community’s conversion to renewable energy.<br />
As the climate continues to shift, communities can respond to the associated rise<br />
in extreme weather through two approaches, adaptation (i.e., changing processes<br />
and infrastructure to thrive in a new normal) and mitigation (i.e., reducing<br />
carbon pollution). Implementing strategies from both of these approaches will<br />
ensure the community thrives against the escalation of extreme weather events<br />
and climatic shifts, while working to prevent additional future harm.<br />
By diverting certain kinds of waste from their endpoints in landfills, the<br />
<strong>City</strong> can reframe waste as “new” materials <strong>for</strong> reuse and provide new<br />
opportunities <strong>for</strong> job creation. Use of these materials can provide new<br />
business opportunities, extend the life of the landfill, reduce pollution<br />
of the natural environment, and cut air pollutants emitted by landfills.<br />
The diversion of organic material (i.e., yard and food waste) into<br />
compost can help improve soil health and reduce particulate matter<br />
(PM) emissions, which are currently three times higher in Adams<br />
County than surrounding Arapahoe and Denver counties.<br />
46
<strong>Sustainability</strong> Focus Areas<br />
Water<br />
Transportation<br />
Community<br />
Health<br />
Funding and<br />
Purchasing<br />
Biodiversity,<br />
Tree Canopy,<br />
and Food<br />
Water challenges will undoubtedly continue to plague the <strong>City</strong> and the State<br />
as drought conditions contribute to the over-extraction of State waters and<br />
increases in the cost of water. Policies that encourage conservation, low<br />
impact development, and investment in infrastructure upgrades will be<br />
crucial to guaranteeing the continuation of C3’s water supplies and WQ,<br />
including addressing emerging contaminants like per- and polyfluorinated<br />
(PFAS), which currently exceed federal health advisory levels.<br />
As the <strong>City</strong> reassesses its plans <strong>for</strong> sustainable growth into the future, it must<br />
consider the critical ways in which transportation infrastructure contributes<br />
to air pollution, resilience, and community accessibility. Transportation<br />
infrastructure – from public transit to active transportation – in many ways<br />
shapes what communities look like, how people behave, and the overall<br />
quality of life in the <strong>City</strong>. Strategies in this sector include those that address<br />
the lack of accessibility <strong>for</strong> public transit and active transportation networks<br />
(i.e., protected bike lanes).<br />
Industrial pollution issues impact all <strong>Commerce</strong> <strong>City</strong> residents, crossing<br />
racial and socioeconomic lines. This focus area seeks to tackle industryrelated<br />
AQ issues and health justice, a major priority <strong>for</strong> all C3 residents,<br />
particularly residents of color who disproportionately live near industrial<br />
facilities.<br />
Critical to the success of any <strong>City</strong> sustainability policy is the ability and<br />
commitment to invest resources towards implementing and sustaining<br />
this work. The community will recognize the allocation of <strong>City</strong> funds<br />
as a demonstration of genuine commitment to community health and<br />
sustainability; there<strong>for</strong>e, funding programs and hiring dedicated staff to<br />
manage grant requests and projects, along with providing support <strong>for</strong><br />
community-level incentive programs, will work to build trust with the<br />
community.<br />
Access to green spaces and adequate tree canopy plays a critical<br />
mitigating role in environmental and public health, particularly<br />
as temperatures grow hotter and <strong>for</strong> vulnerable communities.<br />
Biodiversity is crucial to the resilience of natural ecosystems; local<br />
food access can likewise enhance resilience <strong>for</strong> urban communities.<br />
C3’s current tree canopy level is at 3%, which is well below the 24%<br />
level recommended <strong>for</strong> a prairie ecosystem.<br />
47
<strong>Sustainability</strong> Focus Areas &<br />
Priorities<br />
Throughout the remaining focus area chapters, the strategies, actions, and implementation<br />
details regarding the coming work are included. Strategy details may include the following<br />
components:<br />
Low ($100,000 annually)<br />
Staffing Requirements are<br />
defined as:<br />
GHG reduction potentials is<br />
defined as the estimated GHG<br />
savings in 2050:<br />
Level of <strong>City</strong> Control is defined<br />
as:<br />
Responsible Party:<br />
Implementation Timeline is<br />
provided at the action level, and<br />
is defined as:<br />
Low (less than 5 hours/week of staff time)<br />
Medium (between 5-10 hours/week of staff time)<br />
High (more than 10 hours/week of staff time)<br />
Low (0% - 5% potential reduction from total)<br />
Medium (5% - 9% potential reduction from total)<br />
High (10%+ potential reduction from total)<br />
Low (the <strong>City</strong> has little control and would play a<br />
supporting and influencing role)<br />
Medium (the <strong>City</strong> has some control, but partnerships<br />
may be necessary <strong>for</strong> success)<br />
High (the <strong>City</strong> has near or full autonomy and<br />
jurisdiction to implement)<br />
<strong>City</strong>—C3 will lead this ef<strong>for</strong>t<br />
Community—C3 will support and collaborate on<br />
community-led initiatives related to this work.<br />
Short term (next 1-2 years)<br />
Medium term (next 3-5 years)<br />
Long term (next 6-10 years)<br />
48
Education & Outreach<br />
Even as it experiences such rapid<br />
population growth, <strong>Commerce</strong> <strong>City</strong><br />
prides itself on its small-town sense<br />
of community. Despite this close-knit<br />
atmosphere, ongoing, acute, chronic, and<br />
cumulative pollution issues due to heavy<br />
industrial activity – including those of the<br />
State’s only major petroleum refinery –<br />
continue to erode the community’s trust in<br />
institutions both public and private.<br />
This distrust creates challenges <strong>for</strong> the<br />
<strong>City</strong> as it embarks on its sustainability and<br />
resiliency action work, especially as it seeks<br />
to implement community-validated actions<br />
and strategies. If residents do not trust<br />
government and industry as partners, they<br />
will not respond to the <strong>City</strong>’s ef<strong>for</strong>ts to engage<br />
with environmental action. Throughout this<br />
policy development phase, the <strong>City</strong> has sought<br />
to invest in the process of building trust with<br />
the community and identify opportunities to<br />
reach the underserved communities where<br />
they are at, such as attending the Cultivando<br />
Eco-Fiesta celebration and providing<br />
community boards in Spanish (see Figure 14).<br />
Because of this history, the C3 community has<br />
often embraced paths outside the government<br />
to make their concerns heard. Community<br />
groups and nonprofits continue to add to<br />
a rich legacy of activism, engagement, and<br />
organizing. Some examples include:<br />
GreenLatinos organized their community to advocate <strong>for</strong> laws restricting<br />
industrial GHG pollution through the Greenhouse Gas Emissions and Energy<br />
Management <strong>for</strong> Manufacturing (GEMM) Phase 2 rulemaking process;<br />
Cultivando installed AQ monitors around the <strong>City</strong> and at community<br />
members’ homes to provide additional, third-party exposure data to improve<br />
the C3 community’s understanding of its pollution issues; and<br />
350 Colorado has partnered with staff on educational campaigns.<br />
These non-governmental organizations<br />
will continue to play an important role in<br />
the promotion of community health and<br />
sustainability initiatives moving <strong>for</strong>ward.<br />
For example, the <strong>City</strong> could build a more<br />
comprehensive AQ database if they aggregate<br />
the data from monitors installed by the local<br />
health department, Suncor’s ten monitors,<br />
and the community monitors supported<br />
by Cultivando. The <strong>City</strong> is committed to<br />
cultivating positive relationships with<br />
community partners and building up its<br />
own capacity and the capacity<br />
of businesses, residents, and<br />
other partners to implement the<br />
recommendations through a<br />
community-driven and validated<br />
approach.<br />
49
Education & Outreach<br />
¿Cómo pueden benefícianos los<br />
árboles? | How do trees benefit us?<br />
La biodiversidad<br />
y el dosel arbóreo<br />
Biodiversity & Tree Canopy<br />
Aire limpio | Clean air<br />
Crear conexión | Build connection<br />
Eventos de calor extremo<br />
Extreme heat events<br />
Los eventos de calor extremo pueden<br />
desencadenar una variedad de<br />
condiciones de estrés por calor.<br />
Los niños pequeños, las personas<br />
mayores y otros grupos específicos,<br />
incluyendo a las personas con<br />
enfermedades crónicas, las poblaciones<br />
de bajos ingresos y personas que<br />
trabajan al aire libre, tienen un mayor<br />
riesgo de contraer enfermedades<br />
relacionadas con el calor.<br />
Las temperaturas más altas también<br />
contribuyen a la acumulación de<br />
contaminantes atmosféricos dañinos.<br />
Extreme heat events can trigger a variety<br />
of heat stress conditions.<br />
Small children, the elderly, and certain<br />
other groups including people with<br />
chronic diseases, low-income<br />
populations, and outdoor workers have<br />
higher risk <strong>for</strong> heat-related illness.<br />
Higher temperatures also contribute to<br />
the build-up of harmful air pollutants.<br />
Mantenerse activo | Getting active<br />
Espacios frescos | Cool spaces<br />
Moderador de seguridad | Safety buffer<br />
Apoyar la salud a largo plazo | Support long-term health<br />
Reducir el estrés | Reduce stress<br />
Acceso a alimentos (tiendas de<br />
comestibles y jardines comunitarios)<br />
Food Access (Grocery Stores<br />
& Community Gardens)<br />
Puntuación de<br />
equidad del árbol<br />
Tree Equity score<br />
Green Spaces | Espacios verdes<br />
Muchos estudios han<br />
encontrado que los<br />
árboles no están<br />
distribuidos<br />
equitativamente en<br />
nuestras ciudades y<br />
pueblos, y la mayoría<br />
de las comunidades<br />
negras, indígenas y<br />
otras comunidades de<br />
primera línea<br />
experimentan con<br />
menos dosel arbóreo<br />
que en otras áreas.<br />
Many studies have<br />
found that trees are<br />
not equitably<br />
distributed<br />
throughout our cities<br />
and towns, with the<br />
majority Black,<br />
Indigenous, and other<br />
frontline communities<br />
experiencing lower<br />
tree canopy than<br />
other areas.<br />
Puntuación de equidad del árbol<br />
Figure 14 Community board in Spanish.<br />
50
Education & Outreach<br />
Community Vision<br />
As the <strong>City</strong> considers its next steps towards<br />
environmental and community sustainability,<br />
the community wants to be consulted early,<br />
often, and throughout. The community is<br />
poised to actively support and collaborate<br />
with <strong>City</strong> ef<strong>for</strong>ts to remediate environmental<br />
and community health issues; rebuilding<br />
trust with the community through goodfaith<br />
engagement will create space <strong>for</strong> the<br />
community to do so. Because their help<br />
is critical to the implementation of this<br />
work, the <strong>City</strong> must approach community<br />
engagement in culturally-sensitive ways,<br />
meaning tailored communications, education<br />
campaigns, and outreach activities aimed at<br />
different audiences. Moreover, the community<br />
needs to see a whole-of-government approach<br />
and whole-of-community involvement: the<br />
<strong>City</strong> must also demand action from its staff,<br />
business and industry, schools, and more.<br />
More details on the suggested approach <strong>for</strong><br />
a community engagement and education<br />
campaign to support the <strong>City</strong>’s sustainability<br />
work can be found in Appendix D.<br />
Strategies and <strong>Action</strong>s<br />
The community identified numerous<br />
education and outreach opportunities that<br />
will help open <strong>City</strong>-wide conversations on<br />
sustainability over the course of this <strong>Plan</strong>’s<br />
five-to-ten-year timeframe. The following<br />
strategies and actions will build the <strong>City</strong>’s<br />
capacity to expand its environmental<br />
work while fostering the trust necessary to<br />
collaboration.<br />
51
Education & Outreach<br />
Strategy<br />
Promote and publicize the <strong>City</strong>’s climate and sustainability work<br />
through ongoing educational campaigns targeted towards various<br />
audiences, with a focus on connecting residents to the <strong>City</strong>’s<br />
participatory opportunities.<br />
Cost<br />
Staffing Requirements<br />
GHG Reduction Potential<br />
Level of <strong>City</strong> Control<br />
<strong>Action</strong>s<br />
Timeline<br />
EO 1. Develop accessible, multilingual educational campaigns through a<br />
dedicated public outreach program targeted towards the community to<br />
disseminate in<strong>for</strong>mation on <strong>City</strong> sustainability actions and goals and ways <strong>for</strong><br />
the community to participate and provide feedback. Publicize in<strong>for</strong>mation<br />
and public feedback opportunities through multimedia channels, including<br />
<strong>Commerce</strong> <strong>City</strong> Connected.<br />
EO 2. Create and publicize new web pages on the <strong>City</strong>’s <strong>Sustainability</strong> and<br />
Environment webpages to display sustainability goals and other in<strong>for</strong>mation,<br />
including important opportunities <strong>for</strong> residents to help the city achieve<br />
sustainability goals.<br />
EO 3. Develop a stronger feedback mechanism to improve the flow of<br />
in<strong>for</strong>mation on <strong>City</strong> sustainability actions and goals and community<br />
experiences and knowledge on the ground between city leadership, staff,<br />
and council and their districts. Supplement with sustainability-focused<br />
workshops and other community engagement activities <strong>for</strong> residents, city<br />
staff, and leadership to increase collaboration and in<strong>for</strong>mation-sharing.<br />
52
Education & Outreach<br />
Strategy<br />
Develop a culture of sustainability in local businesses and<br />
community organizations.<br />
Cost<br />
Staffing Requirements<br />
GHG Reduction Potential<br />
Level of <strong>City</strong> Control<br />
<strong>Action</strong>s<br />
Timeline<br />
EO 4. Develop and promote a local sustainability business program or<br />
coordinate with the new State program, the Colorado Green Business<br />
Network.<br />
EO 5. Support local work<strong>for</strong>ce development programs <strong>for</strong> the green<br />
transition (e.g., mechanics <strong>for</strong> EVs, HVAC, etc.). Partner with the local<br />
school district, community college, and businesses.<br />
EO 6. Develop a public education and awareness campaign to encourage<br />
small businesses, community organizations, and institutions such as schools<br />
to purchase green products, i.e., restaurant takeout containers, and transition<br />
away from purchases of single-use plastic products. Work with community<br />
members to advocate <strong>for</strong> strong State-level regulation of single-use plastics<br />
and incentives <strong>for</strong> green products.<br />
EO 7. Create programs to support local businesses in their emissions<br />
reduction and sustainability work.<br />
53
Education & Outreach<br />
Strategy<br />
CONTINUED: Develop a culture of sustainability in local<br />
businesses and community organizations.<br />
Cost<br />
Staffing Requirements<br />
GHG Reduction Potential<br />
Level of <strong>City</strong> Control<br />
<strong>Action</strong>s<br />
Timeline<br />
EO 8. Promote green networking programs.<br />
EO 9. Explore options <strong>for</strong> <strong>City</strong> incentive programs aimed at attracting new<br />
clean and efficiency-related industries, including building retrofits, etc.<br />
EO 10. Host sustainability brown bags <strong>for</strong> residents and businesses.<br />
EO 11. Participate in and disseminate results from National Renewable<br />
Energy Laboratory (NREL) programs.<br />
Implementation Notes<br />
► The community engagement processes built into these environmental policy<br />
recommendations can serve as a basis <strong>for</strong> ongoing <strong>City</strong> outreach. Any momentum <strong>for</strong> EJ<br />
and resiliency action generated through this process must be leveraged to push <strong>for</strong> bold<br />
commitments and implementation of these community-driven strategies. Provided that<br />
a permanent EPAC is established, the EPAC can continue to lead conversations with the<br />
<strong>City</strong> as the community’s voice.<br />
54
Education & Outreach<br />
Strategy<br />
Create a <strong>City</strong>-wide brand and campaign <strong>for</strong> sustainability and<br />
partner with community entities to engage, educate, and empower<br />
the community to support a sustainable future.<br />
Cost<br />
Staffing Requirements<br />
GHG Reduction Potential<br />
Level of <strong>City</strong> Control<br />
<strong>Action</strong>s<br />
Timeline<br />
EO 12. Publicize on <strong>City</strong> websites and outreach materials the benefits and<br />
importance of native species, urban <strong>for</strong>est canopy, and biodiversity, and<br />
develop workshops to promote native landscaping and tree planting.<br />
EO 13. Create a <strong>City</strong>-sponsored public education campaign on recycling,<br />
composting, and the energy transition, including the differences between<br />
electric and traditional internal combustion engine vehicles, <strong>for</strong> residents.<br />
EO 14. Develop educational programs that recognize the history of<br />
<strong>Commerce</strong> <strong>City</strong>.<br />
EO 15. Collaborate with HOAs and community organizations to encourage<br />
residents to participate in sustainable home practices such as employing<br />
clotheslines instead of energy-intensive dryers.<br />
EO 16. Implement programs and hiring practices aimed at diversifying <strong>City</strong><br />
staff and leadership.<br />
EO 17. Develop a roadmap to removing and preventing pollution created by<br />
the Suncor facility, including options to revoke the Suncor permit to operate.<br />
EO 18. Partner with other local cities and communities on their sustainability<br />
programs.<br />
55
Energy Efficiency<br />
The 2019 GHG inventory revealed that<br />
buildings contributed a quarter of the<br />
<strong>City</strong>’s total GHG emissions. Renewable<br />
energy is often pointed to as a silver bullet<br />
solution to carbon pollution; however, as<br />
the <strong>City</strong> looks to implement resiliency and<br />
sustainability policies, energy efficiency<br />
strategies have the potential to significantly<br />
cut emissions from buildings. Because energy<br />
efficient technologies reduce the amount of<br />
energy used to per<strong>for</strong>m the same task, they<br />
are often the most cost-effective strategies to<br />
increase resilience while decreasing energy<br />
and maintenance costs <strong>for</strong> residents.<br />
These technologies also bring several equity<br />
co-benefits because of their role in reducing<br />
energy burden and costs (Figure 15 projects<br />
C3’s energy expenditures by sector). As costburdened<br />
and low-income communities<br />
benefit from these reduced energy costs,<br />
they will also realize benefits from improved<br />
indoor AQ and more modern infrastructure.<br />
Communities of color shoulder greater<br />
energy burdens than do white households and<br />
are more likely to suffer from poor indoor AQ<br />
due to gas-powered appliances. The NREL<br />
estimates that across Adams County Low- and<br />
Middle-Income households could save almost<br />
$300 annually in electricity bills annually by<br />
upgrading to energy efficient appliances * (i.e.,<br />
Energy Star-rated appliances).<br />
Similarly, integrating more energy efficient<br />
processes in manufacturing and industrial<br />
facilities will save businesses money,<br />
improving their competitiveness and<br />
* https://maps.nrel.gov/slope/data-viewer?layer=eej.lmi-ami-energy-efficiency-bill-savings&res=county&year=2020&geoI<br />
d=G0800010&filters=%5B%5D<br />
56<br />
long-term profitability, and reducing their<br />
environmental impact, including AQ impacts,<br />
on the surrounding community. Many<br />
communities that have set goals to reach<br />
net-zero emissions recognize that energy<br />
efficiency will reduce the amount of emissions<br />
that communities need to offset.<br />
Despite these multiple positive impacts of<br />
energy efficient technology, the most costburdened<br />
households – which would benefit<br />
most from energy bill assistance – are least<br />
able to af<strong>for</strong>d purchasing new appliances and<br />
other upgrades to their homes or businesses.<br />
Given this paradox, many energy efficiency<br />
programs have been developed to address<br />
this gap, through the utilities themselves,<br />
various government entities, and nonprofits.<br />
Programs accessible to C3 residents include:<br />
► Xcel Energy and United Power rebate<br />
programs;<br />
► Energy Outreach Colorado’s CARES<br />
program (<strong>for</strong> Xcel customers only);<br />
► Colorado Energy Office’s Weatherization<br />
Assistance Program;<br />
► Energy Smart Colorado; and<br />
► Colorado Commercial Property<br />
Assessed Clean Energy (C-PACE),<br />
which helps finance general commercial<br />
improvements, including energy efficiency,<br />
EV infrastructure, and water conservation.<br />
Please visit the <strong>City</strong>’s Environment and<br />
<strong>Sustainability</strong> Resource webpage <strong>for</strong><br />
additional programs.
Energy Efficiency<br />
Figure 15 Energy burden in <strong>Commerce</strong> <strong>City</strong>.<br />
57
Energy Efficiency<br />
Community Vision<br />
The community recognized the potential <strong>for</strong><br />
energy efficiency to reduce residents’ energy<br />
burden and promote AQ and expressed<br />
great interest in expanding energy efficiency<br />
technologies across the <strong>City</strong>. They sought a<br />
strong policy stance from the <strong>City</strong> to require<br />
sweeping energy efficiency improvements<br />
across C3, particularly in support of<br />
renters and low-income, energy burdened<br />
communities. Recommendations include<br />
increasing transparency from landlords;<br />
requiring energy efficient appliances and fuel<br />
switching in multi-family housing, rentals,<br />
and commercial buildings; and strengthening<br />
building codes.<br />
Strategies and <strong>Action</strong>s<br />
While energy efficiency technologies are a<br />
cost-effective strategy to reduce energy costs<br />
and carbon emissions, the <strong>City</strong> could face<br />
significant infrastructural and jurisdictional<br />
challenges in implementing the blanket<br />
requirements desired by the community. The<br />
<strong>City</strong> can begin to make progress towards its<br />
carbon pollution reduction and equity goals<br />
by adopting several more incremental policy<br />
and programmatic approaches within this<br />
<strong>Plan</strong>’s five-to-ten-year timeframe, detailed in<br />
the subsections below.<br />
58
Energy Efficiency<br />
Strategy<br />
Promote energy efficiency <strong>for</strong> residential and commercial buildings.<br />
Cost<br />
Staffing Requirements<br />
GHG Reduction Potential<br />
Level of <strong>City</strong> Control<br />
<strong>Action</strong>s<br />
Timeline<br />
EE 1. Expand residential energy efficiency and retrofit programs, particularly<br />
those targeted towards low-income communities and landlords to prevent<br />
displacement due to costs of beneficial electrification transition. Supplement<br />
these programs with additional outreach and education.<br />
EE 2. Adopt and en<strong>for</strong>ce the most recent International Energy Conservation<br />
Code (IECC) within one year of it being released with options <strong>for</strong><br />
strengthening amendments.<br />
EE 3. Develop and implement code language to require installation of solar<br />
panels and electrification in new large multi-family housing developments.<br />
EE 4. Develop and implement code language to require inclusion of energy<br />
efficient appliance packages in new homes and new multi-family housing<br />
developments. Supplement with programs that help low-income families and<br />
af<strong>for</strong>dable housing purchase packages and incentivize retrofits in rental and<br />
multi-family units to ensure core city residents can benefit.<br />
EE 5. Develop and implement code language that steps up the requirement<br />
<strong>for</strong> high efficiency lighting from 75% to 100%.<br />
59
Energy Efficiency<br />
Strategy<br />
CONTINUED: Promote energy efficiency <strong>for</strong> residential and<br />
commercial buildings.<br />
Cost<br />
Staffing Requirements<br />
GHG Reduction Potential<br />
Level of <strong>City</strong> Control<br />
<strong>Action</strong>s<br />
Timeline<br />
EE 6. Develop and implement code language that regulates exterior lighting<br />
power <strong>for</strong> residential buildings like dorms, boarding houses, care facilities<br />
and congregate living facilities.<br />
EE 7. Require or incentivize building energy benchmarking <strong>for</strong> large multifamily<br />
housing developments and commercial/industrial buildings. Develop<br />
programs to help make benchmarking available to af<strong>for</strong>dable housing and<br />
low-income communities.<br />
EE 8. Continue to provide energy efficiency outreach and incentives <strong>for</strong><br />
all energy users. Encourage energy efficiency through programs (such as<br />
current in<strong>for</strong>mation and rebate and incentive support from local energy<br />
utility companies, Department of Energy, and the EPA) that encourage and/<br />
or reward citizens to use energy-efficient appliances, insulation, windows, etc.<br />
Help citizens become aware of costs and cost-savings in electrification and<br />
efficiency.<br />
Implementation Notes<br />
► These actions will include significant outreach and education components.<br />
► The <strong>City</strong> could lead by example and begin with benchmarking <strong>for</strong> all municipal<br />
buildings and setting targets <strong>for</strong> specific municipal facilities.<br />
60
Energy Efficiency<br />
Strategy<br />
Promote fuel switching (i.e., building electrification) through<br />
incentive programs and public campaigns/initiatives.<br />
Cost<br />
Staffing Requirements<br />
GHG Reduction Potential<br />
Level of <strong>City</strong> Control<br />
<strong>Action</strong>s<br />
Timeline<br />
EE 9. Educate and offer incentives <strong>for</strong> residents to replace combustion fuel<br />
(i.e., fossil fuel gas) appliances with electric ones, with a focus on low-income<br />
communities.<br />
EE 10. Develop and implement code language to restrict natural gas use in<br />
new construction.<br />
EE 11. Educate and offer incentives <strong>for</strong> businesses to replace combustion fuel<br />
appliances with electric ones.<br />
61
Energy Efficiency<br />
Strategy<br />
Adopt policies, programs, and design guidelines <strong>for</strong> resilient,<br />
healthy, energy efficient buildings and community infrastructure to<br />
enhance quality of life, reduce costs, and complement the natural<br />
environment.<br />
Cost<br />
Staffing Requirements<br />
GHG Reduction Potential<br />
Level of <strong>City</strong> Control<br />
<strong>Action</strong>s<br />
Timeline<br />
EE 12. Require landlords to disclose energy efficiency, water efficiency and<br />
quality, and land issues (e.g., proximity to Suncor or major polluters) to<br />
potential tenants.<br />
EE 13. Work with landlords to encourage applying <strong>for</strong> energy efficiency<br />
programs to improve efficiency in their rental units. Develop a transition plan<br />
to ultimately require certain energy efficiency standards in all rental units.<br />
EE 14. Develop program to disburse air purifiers and filters to low-income,<br />
impacted households within a certain radius around Suncor refinery (or<br />
other metric to be determined) and communities where AQ metrics exceed<br />
federal NAAQS standards.<br />
EE 15. Require the EJ and Homes Energy Rating System (HERS) scores on<br />
every property <strong>for</strong> sale and rent.<br />
EE 16. Advocate <strong>for</strong> changes to federal weatherization programs to support/<br />
fund projects <strong>for</strong> cooling in <strong>Commerce</strong> <strong>City</strong>.<br />
62
Energy Efficiency<br />
Strategy<br />
CONTINUED: Adopt policies, programs, and design guidelines<br />
<strong>for</strong> resilient, healthy, energy efficient buildings and community<br />
infrastructure to enhance quality of life, reduce costs, and<br />
complement the natural environment.<br />
Cost<br />
Staffing Requirements<br />
GHG Reduction Potential<br />
Level of <strong>City</strong> Control<br />
<strong>Action</strong>s<br />
Timeline<br />
EE 17. Add prescriptive building envelope requirements to building codes,<br />
including a blower door test and visual inspection of the air barrier, air<br />
sealing, and insulation installation in a home. Develop programs that help<br />
low-income households and small contractors in meeting new requirements.<br />
EE 18. Adopt code language to require a to-be-determined improvement in<br />
whole home air tightness by 2025, including requirements <strong>for</strong> more airtight<br />
air ducts.<br />
EE 19. Implement Modified Energy Rating Index rating values based on the<br />
2018 IECC.<br />
EE 20. Develop and publicize a voluntary zero energy appendix that provides<br />
the design and construction industry with a code-based method of designing<br />
and constructing zero energy buildings.<br />
63
Energy Efficiency<br />
Strategy<br />
Lead by example through the operation and maintenance of <strong>City</strong><br />
facilities.<br />
Cost<br />
Staffing Requirements<br />
GHG Reduction Potential<br />
Level of <strong>City</strong> Control<br />
<strong>Action</strong>s<br />
Timeline<br />
EE 21. Incorporate Energy Star, Enterprise Green Communities,<br />
International Living Future, WELL Building, Passive House into building<br />
codes.<br />
EE 22. Publish International Green Construction Code checklist.<br />
EE 23. Develop energy intensity baseline per square feet <strong>for</strong> <strong>City</strong> building and<br />
facilities.<br />
EE 24. Benchmark <strong>City</strong> facility per<strong>for</strong>mance, publish the results, develop and<br />
implement improvement plans <strong>for</strong> the facilities, and share the results via case<br />
studies with the community.<br />
Implementation Notes<br />
► Families near the Suncor refinery spend thousands of dollars on air filters. The EJ and<br />
equity considerations <strong>for</strong> this significant cost burden should be factored into any actions<br />
undertaken by this strategy.<br />
64
Renewable Energy<br />
Renewable energy plays a crucial role in<br />
global ef<strong>for</strong>ts to reduce GHG emissions<br />
and develop energy independence and<br />
resilience against extreme weather events<br />
and climatic conditions. Ever-decreasing<br />
costs of renewable energy technology has<br />
accelerated the phasing out of coal, one of the<br />
dirtiest fossil fuels, while energy crises like the<br />
one triggered by the war in Ukraine clearly<br />
demonstrate the need to remove <strong>for</strong>eign fossil<br />
fuels from the nation’s energy mix.<br />
C3 is served by Xcel Energy and United<br />
Power as energy providers; United Power is<br />
an electric-only utility. 62% of electricity used<br />
in the community is provided by Xcel, while<br />
United Power provides the remaining 38%.<br />
However, this electricity is not created equal:<br />
Xcel derives more of its electricity from<br />
clean energy and has vowed to produce<br />
80% of its electricity from renewables by<br />
2030; United Power has yet to announce<br />
any specific carbon reduction goals. United<br />
Power is an electric cooperative that provides<br />
members with power purchased wholesale<br />
from Tri-State Generation and Transmission;<br />
as of 2021, figures indicate that Tri-State’s<br />
power supply mix is fossil fuel heavy, with<br />
approximately 50% of the power supply being<br />
generated by coal resources and 19% from<br />
natural gas. * United Power filed a notice of<br />
intent to leave its contract with Tri-State in<br />
December of 2021, in part due to concerns<br />
about rising energy costs and the lack of<br />
integration of renewables and clean power<br />
resources into Tri-State’s resource mix. **<br />
Furthermore, current production methods<br />
cannot provide gas in a renewable <strong>for</strong>m<br />
on an economically feasible scale. Fossil<br />
gas, typically methane, produces a greater<br />
greenhouse effect than carbon dioxide.<br />
There<strong>for</strong>e, beneficial electrification, or<br />
the conversion of traditionally fossil fuelpowered<br />
equipment to newer models that use<br />
electricity, ultimately reduces overall carbon<br />
pollution and energy costs, and is critical to<br />
C3’s resilience. In C3, as the electricity grid<br />
continues to become ‘cleaner’ with more<br />
renewable resources, transitioning away from<br />
fossil fuel use in equipment, including space<br />
heating and water heating equipment, is a<br />
clear way to reduce carbon pollution.<br />
As discussed in the energy efficiency<br />
* Based on in<strong>for</strong>mation obtained by the Denver Post: https://www.denverpost.com/2021/02/12/tri-state-generationmicrocosm-of-changing-energy-landscape/<br />
** See https://www.unitedpower.com/files-to-leave-tri-state.<br />
65
Renewable Energy<br />
chapter, many low-income communities<br />
and communities of color cannot af<strong>for</strong>d to<br />
adopt clean energy technologies, including<br />
renewable energy infrastructure. These<br />
technologies continue to be out of reach<br />
<strong>for</strong> many market-rate households as well.<br />
Utility and State-level programs have been<br />
developed in response to this need <strong>for</strong><br />
resources to support renewable deployment.<br />
To that end, C3 received an NREL Technical<br />
Assistance grant to increase the <strong>City</strong>’s capacity<br />
to build up its clean energy infrastructure.<br />
The Colorado Residential Energy Upgrade<br />
(RENU), run through the Colorado Clean<br />
Energy Fund, provides low or no-interest<br />
loans to residential homeowners <strong>for</strong><br />
renewable energy and energy efficiency<br />
projects. Xcel Energy operates a Solar<br />
Rewards Program that pays homeowners or<br />
businesses <strong>for</strong> the renewable energy credits<br />
generated by their customer-sited systems.<br />
This program helps Xcel meet their RPS<br />
requirements while allowing individuals<br />
to benefit from their investment in solar<br />
installations. Xcel also offers customers<br />
options to subscribe to wind power <strong>for</strong> an<br />
additional cost or receive credits on electric<br />
bills <strong>for</strong> subscriptions to nearby community<br />
solar gardens. C3 staff are currently in talks<br />
with Xcel to apply <strong>for</strong> their Partners in<br />
Energy program to develop an energy plan.<br />
United Power provides an option to purchase<br />
renewable power in kilowatt-hour blocks<br />
through their Green Power Partners program.<br />
66<br />
Community Vision<br />
Perhaps one of the C3 community’s clearest<br />
visions centers on a strong break from fossil<br />
fuels and rapid transition to renewable<br />
energy. The community well understands<br />
that the <strong>City</strong> cannot ultimately achieve its<br />
goals of mitigating its significant industrial<br />
pollution issues without leading by example<br />
and limiting oil and gas production. While<br />
some existing programs support renewable<br />
energy in the community, the community<br />
recognizes that renewable energy installation<br />
represents an equity issue and that not all in<br />
the community can af<strong>for</strong>d it, including those<br />
who would benefit most from the indoor AQ<br />
benefits of electrification. Again and again,<br />
the community expressed their desire to build<br />
quickly on this work and ensure renewable<br />
energy is accessible to all.<br />
Strategies and <strong>Action</strong><br />
The <strong>City</strong> recognizes both the importance<br />
of rapid scaling up of renewable energy<br />
as well as the significant engineering and<br />
infrastructural challenges that this energy<br />
transition presents. The expansion of<br />
renewables will require a simultaneous<br />
increase in battery storage, upgrade of<br />
distribution and transmission systems, and<br />
a focus on equity to ensure a just transition.<br />
C3 cannot push this work <strong>for</strong>ward without<br />
partnerships with its utilities, Xcel Energy and<br />
United Power. As such, the policies presented<br />
below break down the community’s<br />
vision into a few core approaches<br />
that are actionable and achievable<br />
in this plan’s five-to-ten-year<br />
timeframe.
Renewable Energy<br />
Strategy<br />
Implement policies that support comprehensive renewable energy<br />
growth <strong>for</strong> the community.<br />
Cost<br />
Staffing Requirements<br />
GHG Reduction Potential<br />
Level of <strong>City</strong> Control<br />
<strong>Action</strong>s<br />
Timeline<br />
RE 1. Develop municipally-supported renewable energy projects and<br />
programs that benefit the whole community, including working with Xcel<br />
and United Power to explore programmatic options <strong>for</strong> rooftop community<br />
solar gardens, brownfield redevelopment into solar gardens, and rooftop solar<br />
on warehouses.<br />
RE 2. Increase on-site renewable energy installations at municipal buildings<br />
and the use of renewable energy <strong>for</strong> municipal operations. Supplement with<br />
investment in hiring and/or training Public Works staff to maintain PV<br />
installations.<br />
RE 3. Develop programs to market and incentivize solar (e.g., bulk purchase<br />
programs, rebates <strong>for</strong> residents and businesses, etc.), including partnership<br />
opportunities <strong>for</strong> solar installations and renewable subscriptions. Work<br />
with utilities to improve incentive programs and opportunities that make<br />
electrification af<strong>for</strong>dable and accessible.<br />
RE 4. Develop an energy transition plan with Xcel Energy and United Power<br />
to increase the share of renewablesin the energy mix used across the C3<br />
communityevery year by 10%.<br />
67
Renewable Energy<br />
Strategy<br />
Implement policies that support comprehensive renewable energy<br />
growth <strong>for</strong> the community.<br />
Cost<br />
Staffing Requirements<br />
GHG Reduction Potential<br />
Level of <strong>City</strong> Control<br />
<strong>Action</strong>s<br />
Timeline<br />
RE 5. Advocate <strong>for</strong> aggressive renewable energy standards, a clean energy<br />
agenda, and improved incentives <strong>for</strong> energy efficient appliance purchases at<br />
the State level.<br />
Implementation Notes<br />
► The <strong>City</strong>’s advocacy work should extend to utility goals, RPS requirements, and other<br />
State policies.<br />
► The State’s HB 19-1261 will require utilities to achieve 80% reduction in GHG emissions<br />
by 2030, based on 2005 levels.<br />
68
Renewable Energy<br />
Strategy<br />
Establish a resilient, equitable, and reliable energy future powered<br />
by low-carbon and renewable energy.<br />
Cost<br />
Staffing Requirements<br />
GHG Reduction Potential<br />
Level of <strong>City</strong> Control<br />
<strong>Action</strong>s<br />
Timeline<br />
RE 6. Explore opportunities <strong>for</strong> resilient energy systems, including the<br />
development of a city-wide microgrid.<br />
RE 7. Build regional renewable energy partnerships, particularly in<br />
collaboration with communities that are further along on microgrids and<br />
renewables.<br />
RE 8. Continue collaboration with Energy Outreach Colorado and Diversity,<br />
Equity, and Inclusion Board to prioritize reducing energy burden and expand<br />
energy services <strong>for</strong> low-income households.<br />
69
Renewable Energy<br />
Strategy<br />
Reduce impacts from oil and gas drilling throughout the<br />
community.<br />
Cost<br />
Staffing Requirements<br />
GHG Reduction Potential<br />
Level of <strong>City</strong> Control<br />
<strong>Action</strong>s<br />
Timeline<br />
RE 9. Develop regulations that require any new oil and gas development be<br />
emissions neutral and implement reverse setbacks <strong>for</strong> active, abandoned, and<br />
plugged wells. Work with state partners to incorporate requirements <strong>for</strong> more<br />
stringent AQ standards and monitoring programs into oil and gas permits<br />
to alleviate associated health burdens along with compensation <strong>for</strong> impacted<br />
communities.<br />
AQ Technical Recommendation 4<br />
► Update oil and gas regulatory requirements on a continuous basis to keep up with<br />
evolving industry technologies and practices.<br />
70
Adaptation & Mitigation<br />
As climatic conditions continue to shift,<br />
communities are responding to the dangerous<br />
increase in extreme weather through two<br />
main approaches: adaptation and mitigation.<br />
As C3 builds its capacity to respond to climate<br />
change and other EJ issues, both these lenses<br />
will shape how the <strong>City</strong> assesses its priorities<br />
and evaluates the anticipated impacts of these<br />
recommended strategies and actions. A mix<br />
of adaptation and mitigation strategies will<br />
ensure the community thrives against the<br />
inevitable impacts of extreme weather and<br />
climate conditions, while working to prevent<br />
additional harm.<br />
Adaptation refers to the ways we adjust to<br />
anticipated future climatic shifts. Adaptation<br />
strategies and actions aim to improve our<br />
ability – as individuals and communities – to<br />
respond to negative effects of climate change<br />
either through reducing risks or taking<br />
advantage of new conditions.<br />
Mitigation, on the other hand, involves<br />
reducing our GHG emissions to prevent<br />
worsening climate change and begin reversing<br />
the anthropogenic greenhouse effect in our<br />
atmosphere. This can be done through cutting<br />
sources of GHGs or building our capacity<br />
to absorb carbon in what we call “carbon<br />
sinks.” Carbon sinks remove carbon from the<br />
atmosphere and include trees and plants.<br />
Community Vision<br />
Using this framework <strong>for</strong> environmental and<br />
resilience work, the C3 community currently<br />
focuses on mitigation of pollution due to the<br />
long, damaging history of industrial activity.<br />
The community has consistently singled<br />
71<br />
out AQ as the <strong>City</strong>’s central environmental<br />
issue and is actively involved in mitigation<br />
of pollution issues, particularly as it pertains<br />
to the Suncor refinery. As a result, climate<br />
action, both adaptation and mitigation,<br />
remains in earlier stages than in neighboring<br />
communities. However, because of the<br />
prominence of air pollution issues in C3, the<br />
community recognizes the interconnection<br />
between environmental pollution and climate<br />
issues and has voiced a desire <strong>for</strong> strong <strong>City</strong><br />
action and investment into climate action.<br />
Strategies and <strong>Action</strong>s<br />
While the <strong>City</strong> acknowledges the impact of<br />
changing climatic conditions on its residents,<br />
adaptation and mitigation work has been<br />
slow to follow. This presents both challenges<br />
in meeting time-sensitive environmental and<br />
public health goals and opportunities to build<br />
a community-validated approach to action.<br />
There<strong>for</strong>e, the strategies and actions below<br />
focus on opportunities <strong>for</strong> the <strong>City</strong> to build<br />
internal capacity and trust in the community<br />
within the five-to-ten-year timeframe of this<br />
<strong>Plan</strong> to encourage continued participation in<br />
EJ and resilience issues.
Adaptation & Mitigation<br />
Strategy<br />
Encourage public engagement with climate and sustainability work<br />
at the State level.<br />
Cost<br />
Staffing Requirements<br />
GHG Reduction Potential<br />
Level of <strong>City</strong> Control<br />
<strong>Action</strong>s<br />
Timeline<br />
AM 1: Publicize in<strong>for</strong>mation on recent sustainability-related State legislature<br />
bills and ways to advocate <strong>for</strong> change.<br />
AM 2: Participate in the regulatory and legislative process at the State level on<br />
sustainability initiatives and bills.<br />
AM 3: Encourage and support school district applications <strong>for</strong> State grants<br />
to submit to State agency evaluations and implement sustainability and<br />
community health measures in public schools, such as electric school buses.<br />
72
Adaptation & Mitigation<br />
Strategy<br />
Foster a culture of public participation in an equitable, just climate<br />
transition.<br />
Cost<br />
Staffing Requirements<br />
GHG Reduction Potential<br />
Level of <strong>City</strong> Control<br />
<strong>Action</strong>s<br />
Timeline<br />
AM 4. Establish a permanent EPAC.<br />
AM 5. Encourage <strong>City</strong> staff and leadership attendance at EJ seminars hosted<br />
by <strong>City</strong> staff and partners and make these trainings publicly accessible to the<br />
local community.<br />
AM 6: Work with <strong>City</strong> leadership to declare a climate crisis and create<br />
momentum behind sustainability actions, raise awareness to issues around<br />
resilience and environment, and potentially open up emergency funds to<br />
support programs that protect residents from environmental pollution and<br />
other harms.<br />
AM 7. Collaborate with CDPHE, community residents, and local industry<br />
in order to build resilient spaces in the <strong>City</strong> that reduce the health impacts<br />
associated with air pollution and mitigate the negative impacts caused by<br />
extreme weather events and shifting climate conditions. Resilient design can<br />
limit risks associated with these changes, so incorporating resilient solutions<br />
into future planning and policy could help to address present AQ issues and<br />
mitigate against future potential harms associated with the rise in extreme<br />
weather.<br />
Implementation Notes<br />
► Collaboration is key: the <strong>City</strong> should reach out to partners at locally-based organizations<br />
such as NREL and Cultivando <strong>for</strong> help getting data, in<strong>for</strong>mation, and letters of support<br />
<strong>for</strong> a permanent EPAC and related just transition work. Provide community education<br />
and workshops regarding GHGs, EJ, AQ, and other community health issues.<br />
73
Recycling & Waste Diversion<br />
Between 2018 and 2021, <strong>Commerce</strong> <strong>City</strong>’s<br />
trash costs tripled from approximately<br />
$1M to $3M. Waste and wastewater<br />
operations comprise approximately 10% of<br />
community-wide core emissions and generate<br />
a significant amount of HAPs - Allied Waste<br />
Industries, LLC produced more HAPs than<br />
Suncor did in 2021, at about 30.1 tons and<br />
19.7 tons, respectively. Although not the most<br />
significant contributor to the <strong>City</strong>’s overall<br />
GHG emissions, waste management impacts<br />
the <strong>City</strong>’s sustainability in many ways, from<br />
economic to environmental and community<br />
health.<br />
<strong>Sustainability</strong> principles work to develop<br />
a circular economy, which is a systems<br />
framework that involves eliminating<br />
waste, reusing and recycling materials,<br />
and regenerating nature. Many extractive<br />
industries and single-use products operate<br />
in linear processes; however, by diverting<br />
certain kinds of waste from their endpoints<br />
in landfills, the <strong>City</strong> can reframe waste as<br />
“new” materials <strong>for</strong> reuse. These “new”<br />
materials can also create new business and<br />
job opportunities; increasing compost rates<br />
and applications throughout the <strong>City</strong> will<br />
also contribute to soil health and reduce PM<br />
concentrations. Use of composting in public<br />
spaces can help to absorb PM, an important<br />
feature given the fact that Adams County<br />
measured PM concentrations approximately<br />
three times higher than in Denver County.<br />
In C3, many <strong>for</strong>mer landfills and<br />
one active municipal solid waste<br />
(MSW) landfill dot the landscape.<br />
CDPHE and the EPA work together<br />
to seal and monitor the closed<br />
74
Recycling & Waste Diversion<br />
landfills. The Tower Landfill (Tower) serves<br />
most residents of C3 and, given the immense<br />
growth in waste and population, it has<br />
recently applied <strong>for</strong> a permit to expand the<br />
facility. Currently, Tower does not accept any<br />
hazardous, radioactive, or explosive wastes,<br />
carcinogenic polychlorinated biphenyls<br />
(PCBs), or tires, but still emits more HAPs<br />
than any other single entity in <strong>Commerce</strong><br />
<strong>City</strong>, including the Suncor refinery. Waste<br />
data shows that acetaldehyde, benzene,<br />
toluene, and xylenes are emitted at an order of<br />
magnitude higher than in Denver.<br />
Community Vision<br />
Throughout the engagement process the C3<br />
community reiterated their broad approach<br />
to environmental and sustainability policy,<br />
including a focus on waste diversion. The<br />
community recognizes the importance of<br />
recycling and composting in reducing the<br />
amount of solid waste entering the landfill<br />
but is frustrated at the inaccessibility of<br />
this diversion infrastructure in many C3<br />
neighborhoods. The community wants<br />
to see a stronger, more comprehensive<br />
approach from the <strong>City</strong> to curbing landfilling,<br />
including increasing access to waste diversion<br />
opportunities, leading educational campaigns,<br />
and attracting new recycling and composting<br />
industries. A decentralized composting<br />
program and collaboration with A1-Organics<br />
could improve soil health and reduce PM, a<br />
pollutant that measures almost 30% higher in<br />
Adams County than surrounding counties.<br />
Strategies and <strong>Action</strong>s<br />
Given the <strong>City</strong>’s ballooning trash bill, the<br />
<strong>City</strong> must improve the waste diversion<br />
infrastructure in the community, in<br />
collaboration with its waste management<br />
partners. The <strong>City</strong> relies on these partners<br />
to support an environment favorable to<br />
recycling, composting, and innovations in<br />
waste diversion. The strategies below lay the<br />
groundwork to cultivate the cultural, policy,<br />
and regulatory environment to realize the<br />
community’s vision in an actionable and<br />
achievable approach within this plan’s five-toten-year<br />
timeframe.<br />
75
Recycling & Waste Diversion<br />
Strategy<br />
Implement policies and ordinances to purchase sustainable<br />
products, reduce solid waste, and increase waste diversion<br />
community-wide.<br />
Cost<br />
Staffing Requirements<br />
GHG Reduction Potential<br />
Level of <strong>City</strong> Control<br />
<strong>Action</strong>s<br />
Timeline<br />
WD 1. Update the <strong>City</strong>’s waste management contract to implement policies<br />
aligned with Save-As-You-Recycle, which is aimed at increasing waste<br />
diversion and reducing consumption by ensuring all households have free<br />
access to recycling and waste disposal costs increase in proportion to the<br />
amount of waste disposed.<br />
WD 2. Develop an ordinance requiring large multi-family and commercial<br />
property owners to provide recycling and compost collection services.<br />
WD 3. Develop and implement an extra fee associated with purchases and<br />
use of Styrofoam products that avoids increasing costs to end consumers.<br />
WD 4. Develop policies to limit the use of single-use plastic bags<br />
community-wide.<br />
76
Recycling & Waste Diversion<br />
Strategy<br />
CONTINUED: Implement policies and ordinances to purchase<br />
sustainable products, reduce solid waste, and increase waste<br />
diversion community-wide.<br />
Cost<br />
Staffing Requirements<br />
GHG Reduction Potential<br />
Level of <strong>City</strong> Control<br />
<strong>Action</strong>s<br />
Timeline<br />
WD 5. Develop ordinances to mandate recycling in businesses such as<br />
restaurants and grocery stores.<br />
WD 6. Develop waste reduction targets and collect data on key diversion<br />
and reduction metrics to measure success of waste generation and diversion<br />
programs and policies.<br />
Implementation Notes<br />
► With regard to Construction & Demolition (C&D) recycling, Allied Recycled<br />
Aggregates’ central location drastically cuts truck drive times <strong>for</strong> disposal of concrete<br />
and asphalt as well as any associated GHG emissions. The <strong>City</strong> could support a C&D<br />
ordinance with a penalty <strong>for</strong> companies that stockpile concrete and asphalt without<br />
recycling in a timely fashion.<br />
► Pay-As-You-Throw (or Save-As-You-Recycle) programs can lead to an increase in<br />
recycling or compost contamination, so the <strong>City</strong> must support a program like this with a<br />
significant public education ef<strong>for</strong>t and ensure the community is well-prepared.<br />
► Waste Connections submitted a materials recycling facility permit, which could provide<br />
an outlet <strong>for</strong> any collected recyclables.<br />
► A Styrofoam tax would be more successful and simpler <strong>for</strong> the <strong>City</strong> if regulated through<br />
the State. Moreover, the <strong>City</strong> can develop a more equitable Styrofoam tax by targeting the<br />
business side, avoiding another tax on residents.<br />
► The <strong>City</strong> can support State initiatives and regulations around plastic bag use, recycling in<br />
restaurants and grocery stores, and the setting of waste reduction and diversion targets.<br />
► Work with Allied Recycled Aggregates to ensure their capacity can accept the demand<br />
<strong>for</strong> C&D recycling.<br />
77
Recycling & Waste Diversion<br />
Strategy<br />
Foster a zero-waste culture at C3 through zero-waste events and<br />
operations, education, and programs that reduce trash-related<br />
pollution and expand access to recycling and composting.<br />
Cost<br />
Staffing Requirements<br />
GHG Reduction Potential<br />
Level of <strong>City</strong> Control<br />
<strong>Action</strong>s<br />
Timeline<br />
WD 7. Work with community partners to ensure curbside composting and<br />
recycling services are publicly available within the community and support<br />
free community-led compost facilities, particularly in low-income, highlyimpacted<br />
communities. This may come in the <strong>for</strong>m of providing free at-home<br />
recycling and composting kits and self-contained composting containers.<br />
WD 8. Work with school districts to implement waste diversion and<br />
reduction strategies, such as eliminating disposable food trays. Develop<br />
curriculum to educate students on recycling and composting.<br />
WD 9. Develop and publicize recycling and composting education<br />
campaigns aimed at residents to reduce contamination of recycling and<br />
compost streams, i.e., reducing lithium batteries in recycling and promoting<br />
rechargeable batteries.<br />
WD 10. Develop and implement a plan to eliminate air pollution at the<br />
landfill.<br />
WD 11. Develop a waste diversion plan with metrics to measure composting<br />
rates and implement a plan to reach a 20% citywide increase in composting.<br />
WD 12. Provide small local businesses, community groups, and residents<br />
with grants or incentives to develop waste reduction or diversion strategies<br />
and expand community recycling and composting infrastructure.<br />
78
Recycling & Waste Diversion<br />
Strategy<br />
Improve waste diversion infrastructure in C3 to support low carbon<br />
transition and pollution reduction goals.<br />
Cost<br />
Staffing Requirements<br />
GHG Reduction Potential<br />
Level of <strong>City</strong> Control<br />
<strong>Action</strong>s<br />
Timeline<br />
WD 13. Adopt and en<strong>for</strong>ce a C&D waste recycling ordinance. Consider<br />
requirements <strong>for</strong> using recycled concrete in all new projects.<br />
WD 14. Invest in solar Big Bellies and Slim Jims.<br />
WD 15. Set a cardboard recycling ordinance (See Appendix C).<br />
WD 16. Work with waste management partners to develop infrastructure <strong>for</strong><br />
organics disposal and implement the <strong>City</strong>’s waste diversion plan to reduce<br />
organics from landfill.<br />
79
Recycling & Waste Diversion<br />
Strategy<br />
CONTINUED: Improve waste diversion infrastructure in C3 to<br />
support low carbon transition and pollution reduction goals.<br />
Cost<br />
Staffing Requirements<br />
GHG Reduction Potential<br />
Level of <strong>City</strong> Control<br />
<strong>Action</strong>s<br />
Timeline<br />
WD 17. Work with waste management partners to develop infrastructure <strong>for</strong><br />
recycling of concrete and appliances, to support transition to high efficiency<br />
and electric appliances.<br />
Implementation Notes<br />
► The <strong>City</strong> can improve composting and recycling rates by providing at-home product kits<br />
<strong>for</strong> curbside composting and recycling.<br />
► Working with the school districts to promote lessons on recycling and composting in<br />
middle and elementary schools will both educate children and help disseminate this<br />
in<strong>for</strong>mation to their parents and guardians.<br />
► Education is crucial to reduce contamination in composting and recycling.<br />
► To support these initiatives the <strong>City</strong> needs to develop metrics and methods <strong>for</strong> tracking<br />
composting rates.<br />
► Currently, the <strong>City</strong>’s recycling suffers from a high contamination rate (around 7%). Some<br />
contamination stems from the amount of lithium batteries, which are not recyclable.<br />
The <strong>City</strong> needs to support its recycling initiatives with education and promotion of<br />
rechargeable batteries.<br />
► Finally, the <strong>City</strong> should work with Public Works and industry partners such as A1-<br />
Organics to ensure any targets set to increase composting rates accounts <strong>for</strong> the existing<br />
infrastructure <strong>for</strong> organics disposal.<br />
80
Water<br />
Most Coloradans understand that water<br />
in this arid desert State has always<br />
been scarce. However, the National Oceanic<br />
and Atmospheric Administration’s (NOAA)<br />
analysis of climatic and environmental data<br />
reveals concerning trends: the drought<br />
plaguing the Southwest United States will<br />
likely continue to scorch the region with little<br />
respite in sight. The drying of the region’s<br />
water resources raises the importance of<br />
managing all water resources proactively,<br />
including stormwater, through sustainable<br />
approaches like LID.<br />
70% of C3’s water sources come from alluvial<br />
groundwater (which is stream-fed through<br />
loose sand, gravel, and silt); the <strong>City</strong> obtains<br />
the rest of its water from Denver and a mix<br />
of other local sources. SACWSD services the<br />
<strong>City</strong>’s water and wastewater needs. Although<br />
the <strong>City</strong> estimates that current water supplies<br />
will meet projected increases in demand,<br />
water conservation will still play an important<br />
role in ensuring the community’s long-term<br />
sustainability while also lowering water bills<br />
<strong>for</strong> residents and businesses.<br />
On the WQ side, the <strong>City</strong> has faced recent<br />
challenges with several chemicals of<br />
concern, notably PFAS. Of the many WQ<br />
exceedances, PFAS pollution, largely the<br />
result of actions taken by the past owners<br />
of the Suncor refinery and fire-suppression<br />
chemicals used at local fire training facilities,<br />
has attracted public attention. A study<br />
per<strong>for</strong>med by WestWater Hydrology, LLC<br />
and commissioned by the national nonprofit<br />
EarthJustice produced local samples that<br />
registered above the EPA’s PFAS guidance.<br />
Estimates from the study reveal that Suncor’s<br />
discharges may account <strong>for</strong> between 16 and<br />
47% of Sand Creek’s total PFAS levels. Of<br />
particular concern is Suncor’s water outfalls<br />
to Sand Creek during precipitation and<br />
snowmelt events, which overwhelm<br />
its systems and discharge larger<br />
quantities of PFAS. *<br />
* https://earthjustice.org/sites/default/files/files/final_suncor_surface_water_pfas_evaluation_1.pdf<br />
81
Water<br />
The EPA issued new guidelines <strong>for</strong> PFAS in<br />
June 2022, drastically reducing the exposure<br />
limit by over a thousandfold. This update<br />
has spurred rounds of new testing across<br />
the country. SACWSD is competing <strong>for</strong><br />
the limited grant money disbursed from<br />
the federal Bipartisan Infrastructure Act to<br />
build a new water treatment plant capable<br />
of removing PFAS. Meanwhile, additional<br />
purchases of Denver Water’s supply dilute<br />
<strong>Commerce</strong> <strong>City</strong>’s water to put their WQ<br />
below the guidelines.<br />
These recent issues with PFAS add to the<br />
long history of industrial pollution that<br />
contributes to the community’s distrust<br />
in C3 institutions. Furthermore, although<br />
groundwater has proved a more stable source<br />
of water <strong>for</strong> C3, these resources recharge at<br />
much slower rates than surface water supplies.<br />
Water challenges will undoubtedly continue<br />
to plague the <strong>City</strong> and the State more broadly<br />
as the current ongoing drought places further<br />
pressure on State waters. There<strong>for</strong>e, policies<br />
that encourage conservation and invest in<br />
infrastructure upgrades will be crucial to<br />
guaranteeing the continuation of C3’s water<br />
supplies and WQ.<br />
Community Vision<br />
Throughout the <strong>City</strong>’s engagement process,<br />
the community responded with great clarity<br />
to their vision <strong>for</strong> a sustainable future with<br />
C3’s water resources and infrastructure. A<br />
concrete understanding of the two major<br />
issues facing the <strong>City</strong>’s water systems<br />
underpins these recommendations: water<br />
quantity, with the threat of increasing<br />
drought conditions; and water quality,<br />
as new technologies introduce emerging<br />
pollutants into local waterways and extreme<br />
weather events contaminate stormwater.<br />
The community recognizes the immense<br />
value of clean water, choosing again and<br />
again to prioritize WQ in their homes and<br />
water conservation in their landscapes. They<br />
envisioned rigorous testing <strong>for</strong> PFAS, given<br />
recent concerns; robust reverse osmosis<br />
water filtration systems in every C3 home;<br />
and native plant and other water-efficient<br />
landscaping practices in yards across the<br />
<strong>City</strong>. <strong>City</strong> staff is aware of several additional<br />
chemicals of concern that may be able to be<br />
mitigated through specific action.<br />
Strategies and <strong>Action</strong>s<br />
Water does not heed political boundaries;<br />
there<strong>for</strong>e, the <strong>City</strong> cannot easily act alone<br />
on many initiatives deemed important<br />
to the community. Additionally, the WQ<br />
analyses completed through this planning<br />
process provided the <strong>City</strong> with a more<br />
accurate picture of the threats to C3’s water<br />
resources, current state of monitoring,<br />
and the importance of integrating a LID<br />
approach to future growth. To focus the<br />
<strong>City</strong> on making progress, the community’s<br />
vision was broken down into several key<br />
policy recommendations that are actionable<br />
and achievable in this plan’s five-to-ten-year<br />
timeframe.<br />
82
Water<br />
Strategy<br />
Develop policies and programs that will help residents and<br />
businesses conserve water.<br />
Cost<br />
Staffing Requirements<br />
GHG Reduction Potential<br />
Level of <strong>City</strong> Control<br />
<strong>Action</strong>s<br />
Timeline<br />
W 1. Work with SACWSD to develop a program to help convert “street<br />
yards” into native plant gardens and sprinklers <strong>for</strong> “street yards” into drip<br />
lines <strong>for</strong> street trees.<br />
W 2. Mandate that cool weather turf be restricted to 40% of backyards, or 500<br />
square feet, whichever is smaller <strong>for</strong> new residential and commercial sites.<br />
W 3. Work with SACWSD to provide incentives to existing residential and<br />
commercial sites to remove front yard lawns, then to xeriscape and/or replant<br />
with native species.<br />
W 4. Develop programs to incentivize the use of greywater systems.<br />
83
Water<br />
Strategy<br />
CONTINUED: Develop policies and programs that will help<br />
residents and businesses conserve water.<br />
Cost<br />
Staffing Requirements<br />
GHG Reduction Potential<br />
Level of <strong>City</strong> Control<br />
<strong>Action</strong>s<br />
Timeline<br />
W 5. Work with SACWSD to develop stricter regulations on golf course<br />
siting and water consumption, including requirements <strong>for</strong> no-mow areas,<br />
water reuse, and low-water use landscape standards.<br />
W 6. Work with HOAs and SACWSD to reduce residential lawn area,<br />
encourage rock and water-efficient landscaping, and install water<br />
conservation projects. This may include development of a rebate program on<br />
stormwater fees, new landscape standards, etc.<br />
Implementation Notes<br />
► These programs offer the <strong>City</strong> opportunities to work with Adams County and SACWSD<br />
to collaborate and combine resources on filtration systems.<br />
► <strong>City</strong> of Thornton has a good example of an educational resource <strong>for</strong> residential water<br />
conservation.<br />
► The <strong>City</strong> should consider changing landscaping standards <strong>for</strong> commercial landscaping<br />
as well. Oftentimes, the <strong>City</strong> requires some amount of landscaping on commercial<br />
properties, so a commercial landscape standard can help define the choices of product<br />
and technique that businesses can employ.<br />
► Some of these actions may be addressed in the existing <strong>City</strong> landscape code.<br />
► Require municipal landscape contracts to utilize compost generated by local food and<br />
yard waste recycling programs.<br />
84
Water<br />
Strategy<br />
Promote WQ and community trust in WQ.<br />
Cost<br />
Staffing Requirements<br />
GHG Reduction Potential<br />
Level of <strong>City</strong> Control<br />
<strong>Action</strong>s<br />
Timeline<br />
W 7. Provide opportunities to learn more about local water systems (i.e., tour<br />
at SACWSD).<br />
W 8. Work with SACWSD to develop an educational campaign on PFAS<br />
risks, regulations, and current and evolving state of PFAS in the local water<br />
system. Identify partnerships to support the distribution of PFAS tests in the<br />
community.<br />
W 9. Work with SACWSD to identify key threats to WQ in C3 and<br />
exceedances of any federal WQ standards and provide home water filtration<br />
systems to all households that exceed standards.<br />
W 10. Encourage use of nature-based filtration systems in new developments<br />
and infill/redevelopments.<br />
W 11. Pilot at least one greywater system installation in a publicly accessible<br />
<strong>City</strong> facility to ensure visibility.<br />
85
Water<br />
Strategy<br />
CONTINUED: Promote WQ and community trust in WQ.<br />
Cost<br />
Staffing Requirements<br />
GHG Reduction Potential<br />
Level of <strong>City</strong> Control<br />
WQ Technical Recommendations<br />
1. Track WQ monitoring activities and discharge permit violations. Tracking WQ and<br />
violations real-time will allow the <strong>City</strong> to flag issues of concern and facilitate discussions<br />
with CDPHE to address these spill hotspots.<br />
2. Develop a high-level Stream Corridor Management Reference Document with a limited<br />
menu of easily implementable tools and approaches designed specifically <strong>for</strong> C3. See<br />
Water Quality Recommendations section <strong>for</strong> additional in<strong>for</strong>mation.<br />
Implementation Notes<br />
► Regarding the PFAS contamination issues, the <strong>City</strong> should focus on the generator side<br />
and improve remediation at the source. Moreover, a more effective legislative approach<br />
to PFAS pollution may be to remove these substances from firefighting foam, waterproof<br />
items, and non-stick cookware as opposed to treatment.<br />
► Residents should not face the additional cost burden <strong>for</strong> contaminated water. The<br />
multiple entities responsible <strong>for</strong> providing safe drinking water to residents must<br />
collaborate to reduce the financial and health burden of water pollution.<br />
► These initiatives must consider the state of existing PFAS testing, which cannot currently<br />
detect PFAS at the levels set in the new EPA guidelines. Furthermore, expanding blood<br />
tests to residents <strong>for</strong> PFAS would impose a significant cost to the <strong>City</strong> or residents.<br />
► The <strong>City</strong> can support residents’ WQ by offering discounted permit costs <strong>for</strong> new homes<br />
that install reverse osmosis treatment.<br />
► While PFAS/PFOA contamination is a critical public health concern, the <strong>City</strong> must work<br />
with trusted partners to help residents differentiate between legal requirements and<br />
health advisory limits regarding PFAS/PFOA.<br />
► Pilot the greywater installation on a <strong>City</strong> building or public space to demonstrate its<br />
benefits in a publicly visible location.<br />
86
Transportation<br />
Transportation accounts <strong>for</strong> the third<br />
largest sector of emissions in the <strong>City</strong><br />
and approximately one-third of the <strong>City</strong>’s<br />
core emissions. As the <strong>City</strong> reassesses its<br />
plans <strong>for</strong> sustainable growth into the future,<br />
it must consider the critical ways in which<br />
transportation infrastructure contributes to<br />
GHG emissions and, importantly, shapes what<br />
communities look like, how people behave,<br />
and the overall quality of life in the <strong>City</strong>.<br />
One of the most publicly recognizable ways<br />
to reduce GHG emissions and air pollution<br />
is transitioning from gas-powered vehicles<br />
to hybrids and all-electric. Because EVs do<br />
not create tailpipe emissions, the transition<br />
to a low-carbon transportation system<br />
will also benefit public health through<br />
AQ improvements as well as encouraging<br />
physical activity. This is especially important<br />
around schools because of the health impacts<br />
of air pollution on young children. Other<br />
87<br />
policy options can reduce this harm, such as<br />
purchasing electric school buses, which EPA<br />
grants can support.<br />
“I have asthma and the air<br />
quality is bad. When I get away<br />
from the neighborhood I can<br />
breathe better.”<br />
- Survey Respondent<br />
The <strong>City</strong> of Denver has 463 public charging<br />
station ports (Level 2 and Level 3), over half<br />
of which offer free charging. The neighboring<br />
Denver-Aurora-Lakewood region maintains<br />
1,582 public charging stations, 182 of which<br />
are free, and 336 DC Fast Chargers.<br />
However, in C3, the EV charging<br />
infrastructure, at only three<br />
available stations, cannot currently<br />
support widespread adoption of
Transportation<br />
Figure 16 Regional and local EV<br />
charging stations.<br />
88
Transportation<br />
EVs (see Figure 16). Previously, the State’s<br />
Division of Oil and Public Safety prioritized<br />
the redevelopment of old gas stations into EV<br />
charging stations, offering the <strong>City</strong> a good<br />
starting point to begin bolstering local EV<br />
infrastructure. Currently, the <strong>City</strong> itself does<br />
not own or operate any all-electric vehicles.<br />
The purchase of a new vehicle poses a<br />
significant burden on many households.<br />
However, there are many policy options<br />
aimed at increasing equitable access to<br />
EVs and e-bikes. Other communities are<br />
experimenting with creative solutions to the<br />
dearth of EVs currently on the road: Denver,<br />
<strong>for</strong> example, offers rebates <strong>for</strong> e-bikes; others,<br />
like Denver and Minneapolis, operate EV car<br />
share programs. These programs recognize<br />
that not all residents can af<strong>for</strong>d or want to<br />
purchase new or used personal vehicles.<br />
Another pillar of a low-carbon transportation<br />
network is public transit. Connected by six<br />
major highways, transportation in C3 revolves<br />
heavily around private vehicles. The Regional<br />
Transportation District (RTD) services five<br />
local bus routes, three regional bus routes,<br />
and one direct route to Denver International<br />
Airport, as well as access to two regional<br />
commuter rail lines. In August of 2022,<br />
RTD offered free access to all its services to<br />
promote ridership. Expanding access to public<br />
transportation will enable the C3 community<br />
to not only reduce GHG emissions but also<br />
increase community connectivity and support<br />
low-income households who are less likely to<br />
be able to af<strong>for</strong>d a personal vehicle and may<br />
travel longer distances to work.<br />
Finally, the <strong>City</strong> may find partnerships<br />
with some of the many transportation and<br />
distribution companies with significant<br />
operations in C3; these entities would<br />
similarly benefit from a transition to lowcarbon<br />
fleets through cost (i.e., operations<br />
and maintenance) savings, improvements in<br />
local AQ, and public relations.<br />
Community Vision<br />
The community understands the huge<br />
opportunity within a commitment to climate<br />
action to change the <strong>City</strong>’s transportation<br />
infrastructure, reduce GHG emissions and<br />
air pollution, and maintain <strong>Commerce</strong> <strong>City</strong>’s<br />
prized small-town community atmosphere<br />
all at once. Community engagement revealed<br />
a strong desire to see a rapid, comprehensive<br />
expansion of EV infrastructure, public transit,<br />
Safe Routes to School, and multimodal<br />
transportation networks.<br />
The community’s desired approach<br />
toward this expansion is a multimodal<br />
focus on upgrading C3’s transportation<br />
networks to fully and equitably connect all<br />
neighborhoods, reduce GHG emissions, and<br />
encourage active transportation. RTD’s model<br />
of fixed route public transit alone will not<br />
create a fully connected community, leaving<br />
issues with first and last mile connections.<br />
A major emphasis in this vision involves<br />
the extension of urban pedestrian networks,<br />
protected bike lanes, and bike trails<br />
in conjunction with transit to create<br />
stronger community connections<br />
even as the <strong>City</strong> continues to grow.<br />
89
Transportation<br />
AQ once again drives a significant part of<br />
this vision: increasing public transit options,<br />
expanding active transportation routes, and<br />
converting the current gas-powered internal<br />
combustion engine (ICE) fleet to EVs will<br />
also reduce key airborne pollutants of great<br />
concern. Three major highways, Interstate<br />
270, State Highway 265, and Interstate<br />
76, run through C3; the traffic from this<br />
infrastructure contributes significantly to air<br />
pollution and adds up to an estimated average<br />
daily 1.16 million vehicle miles traveled.<br />
Strong partnerships with State and federal<br />
agencies can improve highway maintenance<br />
and address the poor AQ associated with<br />
highway traffic. The EPAC identified antiidling<br />
near schools as a high priority<br />
policy. Ultimately, the community seeks a<br />
comprehensive, safety-first transportation<br />
network that opens access to all the places<br />
that community members live, work, and<br />
recreate while removing air pollution.<br />
Five-Year Strategies and<br />
<strong>Action</strong>s<br />
C3’s transportation systems integrate into<br />
larger regional networks, including state and<br />
interstate highways, RTD, and the Denver<br />
airport. As such, the <strong>City</strong> must work with<br />
several other entities to complete an overhaul<br />
of its road and transit infrastructure in line<br />
with the community’s vision. To prime the<br />
<strong>City</strong> <strong>for</strong> a low-carbon pollution transportation<br />
network, several key actionable and<br />
achievable steps outline a broad approach to<br />
implementation, including planning ef<strong>for</strong>ts,<br />
opportunities to educate the community,<br />
and targeted purchases of alternatives to ICE<br />
vehicles.<br />
90
Transportation<br />
Strategy<br />
Increase the proportion of EVs in the <strong>City</strong>’s fleet and in the<br />
community. Increase the number of light duty and medium duty<br />
EVs in the city fleet.<br />
Cost<br />
Staffing Requirements<br />
GHG Reduction Potential<br />
Level of <strong>City</strong> Control<br />
<strong>Action</strong>s<br />
Timeline<br />
T 1. Develop a roadmap <strong>for</strong> transportation electrification in the community<br />
that includes <strong>City</strong> fleet electrification, connecting renewable energy<br />
supplies to charging infrastructure where feasible, education and awareness<br />
campaigns around EV adoption, and equity considerations <strong>for</strong> EV costs. This<br />
could also include converting old gas stations into EV charging stations.<br />
91
Transportation<br />
Strategy<br />
Promote and educate residents on EVs and their related support<br />
network such as charging infrastructure.<br />
Cost<br />
Staffing Requirements<br />
GHG Reduction Potential<br />
Level of <strong>City</strong> Control<br />
<strong>Action</strong>s<br />
Timeline<br />
T 2. Host a public <strong>for</strong>um on EVs, covering education on vehicle per<strong>for</strong>mance,<br />
financing, network charging, tax credits, models, group buy programs, test<br />
drive events, etc.<br />
T 3. Improve public EV charging signage and options, e.g., larger signs, and<br />
initiate campaigns <strong>for</strong> education and awareness.<br />
T 4. Create and implement educational and awareness campaigns that<br />
promote EV adoption.<br />
92
Transportation<br />
Strategy<br />
Prioritize multi-modal transportation options in ef<strong>for</strong>t to broaden<br />
access to the places where people recreate, work, and live. Expand<br />
safe and convenient public transit, walking, and bicycling routes,<br />
including last-minute and last-leg transportation connections.<br />
Focus on improving and investing in transportation infrastructure,<br />
especially repairs and access to public transit and local and regional<br />
activity centers (such as shopping, jobs, and recreation).<br />
Cost<br />
Staffing Requirements<br />
GHG Reduction Potential<br />
Level of <strong>City</strong> Control<br />
<strong>Action</strong>s<br />
Timeline<br />
T 5. Explore options to reduce costs of public transportation <strong>for</strong> underresourced<br />
populations and establish dedicated funding sources <strong>for</strong> expanding<br />
public transit and park-and-rides.<br />
T 6. Promote existing, and explore additional, alternative transportation<br />
options, including the N Line, shuttle service, bicycling, shared micromobility,<br />
carshare, and rideshare options.<br />
T 7. Develop and implement a <strong>City</strong>-wide multi-modal transportation plan<br />
that promotes transit-oriented development and multimodal connectivity<br />
and focuses on moving people efficiently and equitably. Focus infrastructure<br />
improvements and investments on reaching under-resourced communities.<br />
Engage public transit users where they are in order to solicit input in the<br />
plan.<br />
T 8. Improve road and traffic safety by repairing residential streets, filling<br />
in cracks and potholes, adding signage to slow drivers down, and piloting<br />
traffic-calming measures.<br />
93
Transportation<br />
Strategy<br />
CONTINUED: Prioritize multi-modal transportation options in<br />
ef<strong>for</strong>t to broaden access to the places where people recreate, work,<br />
and live. Expand safe and convenient public transit, walking, and<br />
bicycling routes, including last-minute and last-leg transportation<br />
connections. Focus on improving and investing in transportation<br />
infrastructure, especially repairs and access to public transit and<br />
local and regional activity centers (such as shopping, jobs, and<br />
recreation).<br />
Cost<br />
Staffing Requirements<br />
GHG Reduction Potential<br />
Level of <strong>City</strong> Control<br />
<strong>Action</strong>s<br />
Timeline<br />
T 9. Expand protected bicycle lane networks and add bicycle racks, and lane<br />
barriers and restripe lane lines to increase visibility and protect bicyclists<br />
from motor vehicle traffic, particularly the large quantity of freight trucks.<br />
T 10. Work with Colorado Department of Transportation (CDOT) and<br />
property owners near schools and in key commercial districts to widen<br />
sidewalks, improve street lighting, and add crossing paths at key intersections<br />
to improve pedestrian safety and encourage students to walk to schools and<br />
residents to walk and socialize. Develop code amendments to require wider<br />
sidewalks in new construction projects.<br />
T 11. Apply <strong>for</strong> Safe Routes to School Grant from CDOT (open Aug. 9-Nov.<br />
4).<br />
T 12. Improve bus and light rail stop infrastructure, including by adding<br />
covers to bicycle racks and shelters to bus stops.<br />
94
Transportation<br />
Strategy<br />
CONTINUED: Prioritize multi-modal transportation options in<br />
ef<strong>for</strong>t to broaden access to the places where people recreate, work,<br />
and live. Expand safe and convenient public transit, walking, and<br />
bicycling routes, including last-minute and last-leg transportation<br />
connections. Focus on improving and investing in transportation<br />
infrastructure, especially repairs and access to public transit and<br />
local and regional activity centers (such as shopping, jobs, and<br />
recreation).<br />
Cost<br />
Staffing Requirements<br />
GHG Reduction Potential<br />
Level of <strong>City</strong> Control<br />
<strong>Action</strong>s<br />
Timeline<br />
T 13. Meet with RTD and CDOT to analyze and develop improvement plans<br />
<strong>for</strong> public routes and accessibility in C3.<br />
T 14. Sponsor limited, longer range bus routes as an alternative to driving<br />
through and around C3.<br />
T 15. Develop strategy and action plan to increase <strong>City</strong> walk score.<br />
Implementation Notes<br />
► Many of these transportation strategies will also support the ongoing ef<strong>for</strong>ts and goals to<br />
expand af<strong>for</strong>dable housing. The <strong>City</strong> can include a cohesive, comprehensive wayfinding<br />
system between neighborhoods, services, employment opportunities, and transit stations.<br />
► The <strong>City</strong> can supplement these ef<strong>for</strong>ts by exploring bicycle-, scooter- and EV-share<br />
options.<br />
95
Transportation<br />
Strategy<br />
Support and promote equitable EV adoption.<br />
Cost<br />
Staffing Requirements<br />
GHG Reduction Potential<br />
Level of <strong>City</strong> Control<br />
<strong>Action</strong>s<br />
Timeline<br />
T 16. Work with utilities to develop incentive programs to encourage private<br />
citizens to charge EVs during energy off-peak hours (i.e., early mornings or<br />
late evenings).<br />
T 17. Develop a rebate program <strong>for</strong> e-bicycles.<br />
T 18. Develop and implement EV charging infrastructure installation<br />
community-wide, including introducing requirements <strong>for</strong> new gas station<br />
developments to incorporate EV charging.<br />
T 19. Pilot bike and scooter share programs.<br />
96
Transportation<br />
Strategy<br />
Reduce idling and air pollution from vehicles by promoting antiidling<br />
policies and educating the public on behavior changes that<br />
will support air pollution reduction goals.<br />
Cost<br />
Staffing Requirements<br />
GHG Reduction Potential<br />
Level of <strong>City</strong> Control<br />
<strong>Action</strong>s<br />
Timeline<br />
T 20. Lead public campaigns, particularly around schools and with fleet<br />
companies, to discourage idling and convert fleet to EV, highlighting public<br />
health benefits of no-idle zones.<br />
T 21. Develop an anti-idling resolution and work with the Adams 12 School<br />
District and private schools to establish and en<strong>for</strong>ce no-idle zones around<br />
schools.<br />
T 22. Install intelligent traffic signals to reduce wait times <strong>for</strong> vehicles during<br />
off-peak hours.<br />
T 23. Explore train schedules to reduce wait times at crossings.<br />
Implementation Notes<br />
► The <strong>City</strong> can support its anti-idling resolution by posting in<strong>for</strong>mation about anti-idling at<br />
local schools and using signs throughout the community.<br />
97
Community Health<br />
Throughout the process of developing<br />
sustainability recommendations, the C3<br />
community and the EPAC expressed major<br />
concerns over public health and health<br />
equity, particularly in the context of an<br />
ongoing history of industrial pollution. These<br />
pollution issues impact all <strong>Commerce</strong> <strong>City</strong><br />
residents, crossing racial and socioeconomic<br />
lines. Consequently, robust community<br />
activism has sprung up around industryrelated<br />
AQ issues and health justice.<br />
Furthermore, ample data from multiple<br />
sources support these community concerns,<br />
including the AQ analyses completed through<br />
this planning process. AQ data from the<br />
federal EPA and CDPHE reveals high levels<br />
of criteria air pollutants (NAAQS) in C3,<br />
including some of the highest fine particle<br />
pollution in the State. At the county level,<br />
Adams County exceeds Denver County by<br />
three to five times <strong>for</strong> carbon monoxide,<br />
PM10, PM2.5, NOx, SOx, and VOCs. The<br />
EPA’s EJScreen tool ranks <strong>Commerce</strong> <strong>City</strong><br />
in the upper 75th percentile in the State<br />
<strong>for</strong> every key metric except ozone and in<br />
the country <strong>for</strong> all metrics except traffic<br />
proximity.<br />
Furthermore, rising temperatures and<br />
frequency of extreme weather events stresses<br />
already overburdened communities, creating<br />
additional mental health burdens.<br />
Community Vision<br />
A long history and depth of community<br />
organizing and activism in<strong>for</strong>ms the<br />
community’s vision <strong>for</strong> a healthy <strong>Commerce</strong><br />
<strong>City</strong>. The EPAC stressed the need <strong>for</strong> health<br />
justice as well as a stronger connection<br />
between and prioritization of a healthy<br />
environment and healthy community<br />
throughout the community engagement<br />
process. They sought greater transparency and<br />
monitoring of AQ and other pollution metrics<br />
from the <strong>City</strong> and more action to alleviate<br />
heat issues <strong>for</strong> vulnerable populations.<br />
Finally, the community has expressed over<br />
and over again their frustration over the<br />
Suncor refinery’s pollution and desire <strong>for</strong><br />
the <strong>City</strong> to regulate industrial activity more<br />
stringently; moves to partner with local, State,<br />
and federal agencies to do so would signal to<br />
the community a shift in <strong>City</strong> priority from<br />
industry and towards residents.<br />
The escalation in extreme weather events and<br />
climatic conditions is predicted to exacerbate<br />
existing health disparities and threats to<br />
public health like poor AQ and extreme<br />
heat. C3 already experiences more serious<br />
respiratory problems than other communities<br />
locally and across the State (see Figures 17 and<br />
18); these climatic shifts will aggravate such<br />
preexisting conditions through increases in<br />
allergens, ozone, PM, and other pollutants.<br />
98
Community Health<br />
Figure 17 EPA EJ Screen results showing air toxics respiratory risk in <strong>Commerce</strong> <strong>City</strong>.<br />
Figure 18 EPA EJ Screen results showing air toxics cancer risk in <strong>Commerce</strong> <strong>City</strong>.<br />
99
Community Health<br />
Strategies and <strong>Action</strong>s<br />
A number of infrastructural, political, and<br />
economic obstacles prevent a rapid transition<br />
in the industrial economic engines, including<br />
oil and gas, in the <strong>City</strong>. Furthermore, the<br />
<strong>City</strong> does not hold the regulatory authority<br />
over industry that the community desires<br />
to see. However, to achieve its community<br />
sustainability goals, the <strong>City</strong> can begin by<br />
addressing its public health challenges and<br />
AQ issues mapped out in Pinyon’s analyses.<br />
Hiring staff to support monitoring and<br />
restoration ef<strong>for</strong>ts will play a critical role in<br />
boosting C3’s capacity to address these issues.<br />
Because of the dangerous rise in extreme<br />
weather conditions, strategies and policy<br />
actions that reduce urban heat island effect<br />
and air pollution will play an increasingly<br />
important role in closing health gaps.<br />
The policy recommendations below identify<br />
key starting points based on the AQ analyses<br />
discussed in previous sections and the<br />
community’s vision. These strategies also offer<br />
opportunities <strong>for</strong> the <strong>City</strong> to begin acting as a<br />
trusted public health partner.<br />
100
Community Health<br />
Strategy<br />
Research characteristics of healthy communities and three most<br />
important healthcare concerns in <strong>Commerce</strong> <strong>City</strong>.<br />
Cost<br />
Staffing Requirements<br />
GHG Reduction Potential<br />
Level of <strong>City</strong> Control<br />
<strong>Action</strong>s<br />
Timeline<br />
CH 1. Work with community health partners to identify key metrics <strong>for</strong><br />
monitoring that capture social, safety, and access barriers to obtaining mental<br />
and physical healthcare.<br />
CH 2. Work with community health partners to develop programs that<br />
increase access to mental and physical healthcare <strong>for</strong> people struggling with<br />
mental health and substance addictions.<br />
101
Community Health<br />
Strategy<br />
Track the increase in extreme heat days <strong>for</strong>ecasted by NOAA and<br />
prepare by ensuring community members know about city cooling<br />
centers.<br />
Cost<br />
Staffing Requirements<br />
GHG Reduction Potential<br />
Level of <strong>City</strong> Control<br />
<strong>Action</strong>s<br />
Timeline<br />
CH 3. On extreme heat days, waive fees at Eagle Pointe and Bison Ridge<br />
Recreation Centers, or other relevant community facilities, <strong>for</strong> all community<br />
members to provide a cooling space.<br />
CH 4. Publicize to residents that they should seek shelter at cooling centers<br />
such as recreation centers, libraries, and bowling alleys.<br />
Implementation Notes<br />
► The residents in need of cooling centers may be the same as those who may not have<br />
access to or be able to af<strong>for</strong>d air conditioning.<br />
► Furthermore, recreational centers may not be easily accessible to those that may need this<br />
most. Additional locations or alternative solutions should be explored to best meet people<br />
where they are. The <strong>City</strong> should develop partnerships with community institutions, such<br />
as libraries and educational institutions.<br />
102
Community Health<br />
Strategy<br />
Support health clinics that provide basic, necessary preventive care.<br />
Cost<br />
Staffing Requirements<br />
GHG Reduction Potential<br />
Level of <strong>City</strong> Control<br />
<strong>Action</strong>s<br />
Timeline<br />
CH 5. Increase permits <strong>for</strong> physicians’ offices to reduce burden on health<br />
clinics and hospitals.<br />
103
Community Health<br />
Strategy<br />
Proactively manage air pollution concerns that harm public health<br />
and increase transparency around local AQ data.<br />
Cost<br />
Staffing Requirements<br />
GHG Reduction Potential<br />
Level of <strong>City</strong> Control<br />
<strong>Action</strong>s<br />
Timeline<br />
CH 6. On severe AQ days <strong>for</strong> ozone, request that Suncor does not undertake<br />
maintenance.<br />
CH 7. Develop a prohibition that phases out the use of new gas-powered<br />
lawn equipment by 2025 to reduce emissions of VOCs and NOx. Work with<br />
big box retailers to develop incentives or discounts <strong>for</strong> e-mowers.<br />
According to recent research * , electric lawn equipment can offer significant pollution<br />
reductions over traditional gas equipment: a commercial gas-powered lawn mower<br />
produces the pollution equivalent of driving a car 300 miles in one hour, while a<br />
commercial leaf blower produces the equivalent of an 1,100-mile car trip in one hour.<br />
* See: https://pirg.org/media-center/new-report-gas-powered-lawn-equipment-plays-outsized-role-incolorados-unhealthy-ozone-pollution/<br />
CH 8. Ensure air monitoring and alert systems put greater emphasis on<br />
chronic, rather than acute, health impacts from air pollution. Current<br />
refinery notifications from Suncor focus on day-to-day impacts, while<br />
residents show great concern <strong>for</strong> chronic impacts that accumulate over time.<br />
104
Community Health<br />
Strategy<br />
CONTINUED: Proactively manage air pollution concerns that harm<br />
public health and increase transparency around local AQ data.<br />
Cost<br />
Staffing Requirements<br />
GHG Reduction Potential<br />
Level of <strong>City</strong> Control<br />
<strong>Action</strong>s<br />
CH 9. Make accessible and publicize local AQ in<strong>for</strong>mation and data and<br />
work with community partners to disseminate actionable in<strong>for</strong>mation.<br />
Timeline<br />
CH 10. Conduct an epidemiological study in partnership with CO School of<br />
Public Health to look at biomarkers and the impacts of pollution in C3.<br />
AQ Technical Recommendations<br />
1. Continue updating the impacts inventory to keep residents in<strong>for</strong>med of details on new<br />
pollutant sources and existing source modifications.<br />
2. Implement a monitoring network that supplements existing and planned monitoring to<br />
help the community better understand how existing pollutant sources impact residents<br />
and other specific locations such as schools and parks.<br />
3. Incorporate AQ threshold levels into <strong>City</strong> ordinances that would require additional<br />
analysis, reporting, and potentially mitigation <strong>for</strong> planned emission sources.<br />
4. Reduce current and future emissions by implementing practices such as BACT analysis<br />
requirements and targeted emissions control requirements as needed.<br />
Implementation Notes<br />
► Ensure the AQ in<strong>for</strong>mation shared includes an analysis of immediate AQ impacts (i.e.,<br />
day-to-day) and easily digestible results as well as cumulative impacts related to exposure.<br />
► Allied Recycled Aggregates expressed willingness to provide space <strong>for</strong> AQ sensors.<br />
► The community needs a lead agency that will spearhead an ef<strong>for</strong>t to unify all the many<br />
existing datasets on AQ in C3. Moreover, the ability <strong>for</strong> the <strong>City</strong> to communicate this<br />
data and analyses is critical to building trust and legitimacy in the <strong>City</strong> as well as increase<br />
accessibility and develop an inclusive understanding of the AQ data. The <strong>City</strong> can<br />
cultivate a more open conversation around public health and bring in the community.<br />
105
Community Health<br />
Strategy<br />
Develop a program <strong>for</strong> travel offsets.<br />
Cost<br />
Staffing Requirements<br />
GHG Reduction Potential<br />
Not modeled<br />
Level of <strong>City</strong> Control<br />
<strong>Action</strong>s<br />
Timeline<br />
CH 11. Work with regional partners, including Denver International Airport,<br />
on a carbon offset program that could be used <strong>for</strong> community projects such<br />
as tree plantings or protected bike lanes to improve local AQ.<br />
Implementation Notes<br />
► Republic Services is looking into providing two-mile bike paths along Second Creek.<br />
106
Funding & Economy<br />
The onslaught of extreme weather<br />
events and shifting climate conditions<br />
threaten to create new systems of exclusion<br />
and hierarchy that privilege the same<br />
communities who already control most of<br />
the available resources. Many community<br />
members, including those likely to face the<br />
most severe impacts of this new normal,<br />
cannot af<strong>for</strong>d to participate in the “green”<br />
economy. Communities across the State are<br />
spending significant financial resources on<br />
planning <strong>for</strong> and implementing key policies of<br />
a resiliency-focused future, including working<br />
to attract emerging industries to build a<br />
resilient, green economy. Crafting a vision<br />
<strong>for</strong> <strong>Commerce</strong> <strong>City</strong>’s future economy will<br />
be important to ensuring all can participate<br />
moving <strong>for</strong>ward and providing the tax base<br />
that can pay <strong>for</strong> the other aspects of this plan.<br />
Five-Year Strategies and<br />
<strong>Action</strong>s<br />
<strong>Commerce</strong> <strong>City</strong>’s legacy as an industrial<br />
economic engine can be leveraged to<br />
transition seamlessly into the new green<br />
economy. Critical to economic vitality and<br />
to the success of any <strong>City</strong> policy is the <strong>City</strong>’s<br />
ability and commitment to invest resources<br />
towards implementing and sustaining<br />
key strategies and tactics. The policy<br />
recommendations listed below outline the<br />
starting points, based on the community’s<br />
vision, <strong>for</strong> the <strong>City</strong> to begin positioning itself<br />
<strong>for</strong> a new green economy.<br />
Community Vision<br />
The community identified as a top priority<br />
the end of historic cycles of disinvestment and<br />
inequities, especially around environmental<br />
pollution issues. The community will<br />
recognize the allocation of <strong>City</strong> resources<br />
and funds as a demonstration of genuine<br />
commitment to climate action. They seek<br />
funding and purchasing assistance programs<br />
that specifically target under-resourced<br />
communities and support their transition<br />
to clean energy and remediate existing<br />
harm. Fully funding and committing scarce<br />
staff resources towards implementing the<br />
recommended programs and policies and<br />
applying <strong>for</strong> state and federal funding will<br />
work to build trust with the community while<br />
building up the future green economy.<br />
107
Funding & Economy<br />
Strategy<br />
Explore and develop strategies <strong>for</strong> bulk purchasing in residential<br />
and <strong>City</strong> buildings.<br />
Cost<br />
Staffing Requirements<br />
GHG Reduction Potential<br />
Level of <strong>City</strong> Control<br />
<strong>Action</strong>s<br />
Timeline<br />
FE 1. Explore bulk programs <strong>for</strong> solar installations with organizations like<br />
Solar United Neighbors or others.<br />
FE 2. Explore bulk purchase of e-bikes, regular bikes, or other similar<br />
alternative transportation methods.<br />
FE 3. Explore bulk purchase of heat pumps or other electrification appliances<br />
<strong>for</strong> residents.<br />
FE 4. Explore providing incentives or rebates that fill gaps in need, such as<br />
point-of-sale rebates <strong>for</strong> efficient appliances, or incentives <strong>for</strong> electric panel<br />
upgrades (which are generally required when installing solar or electrified<br />
equipment).<br />
108
Funding & Economy<br />
Strategy<br />
Develop and promote a diverse, sustainable economy within the<br />
<strong>City</strong>. Bring clean energy industries to C3, and make C3 a leader in<br />
clean energy product development.<br />
Cost<br />
Staffing Requirements<br />
GHG Reduction Potential<br />
Level of <strong>City</strong> Control<br />
<strong>Action</strong>s<br />
Timeline<br />
FE 5. Develop a roadmap to removing and preventing pollution created by<br />
industrial facilities, including the Suncor facility, and work with State and<br />
federal agencies to reassess pollution standards against AQ monitoring data<br />
collected to ensure permit rules achieve community health protection goals.<br />
FE 6. Work with warehouse owners and green industry partners to identify<br />
opportunities and barriers such as zoning and occupancy rules to converting<br />
empty storage space into usable industrial space <strong>for</strong> clean energy industries<br />
and products.<br />
FE 7. Explore options <strong>for</strong> <strong>City</strong> incentive programs aimed at attracting new<br />
clean and efficiency industries, including building retrofits, etc.<br />
FE 8. Support letter from Councilmember Kristi Douglas to the Climate<br />
<strong>Action</strong> Network asking <strong>for</strong> resources and assistance; explore other funding<br />
opportunities such as the Long-Duration Energy Storage Demonstrations<br />
and Manufacturing Opportunities grant (DE-FOA-0002867).<br />
109
Biodiversity, Tree Canopy,<br />
& Food<br />
<strong>Commerce</strong> <strong>City</strong>, like many communities<br />
in the Denver metropolitan area, is<br />
endowed with multiple parks, open spaces,<br />
and outdoor recreational spaces. The <strong>City</strong><br />
has also been recognized <strong>for</strong> over 30 years<br />
as a “Tree <strong>City</strong> USA” by the National Arbor<br />
Day Foundation and often hosts tree seedling<br />
giveaways <strong>for</strong> Arbor Day. Access to green<br />
spaces and trees plays a critical mitigating<br />
role in environmental and public health,<br />
particularly <strong>for</strong> vulnerable communities.<br />
Moreover, select populations, such as the<br />
elderly, will be disproportionately impacted<br />
by a shifting climate; adequate green space<br />
and tree canopy coverage can significantly<br />
reduce these harmful impacts.<br />
110<br />
Urban heat island effect, the phenomenon<br />
by which impervious surfaces trap heat,<br />
exacerbates existing vulnerabilities in highly<br />
urban areas and impacts neighborhoods with<br />
fewer trees and hotter green spaces. These<br />
hotter temperatures will also decrease AQ by<br />
creating conditions favorable to pollutants:<br />
scientists predict longer pollen and allergen<br />
seasons, an increase in harmful air pollutants<br />
like ozone and PM, and a greater frequency of<br />
wildfires. Especially important <strong>for</strong> C3, green<br />
spaces and urban trees can improve<br />
AQ and trap these airborne<br />
pollutants.
Biodiversity, Tree Canopy,<br />
& Food<br />
However, overall tree canopy coverage in<br />
the <strong>City</strong> stands at about 6%, with some<br />
neighborhoods in northern C3 at 3%;<br />
these numbers stand in contrast to the<br />
recommended 20% canopy coverage <strong>for</strong><br />
prairie and grassland ecosystems. Similarly,<br />
the <strong>City</strong> maintains no community gardens in<br />
<strong>City</strong> parks or public housing. Urban trees and<br />
gardens provide a multitude of benefits to a<br />
community, including cooling, AQ, and traffic<br />
calming. According to the American Forests<br />
Tree Equity Scores report, the <strong>City</strong>’s overall<br />
tree equity score is 63 out of 100 (Figure 19).<br />
This metric combines tree canopy coverage<br />
and land surface temperature and measures<br />
this against demographic characteristics,<br />
including income, employment, race, age,<br />
and health, to gauge whether a community<br />
contains enough trees to ensure its residents<br />
experience the benefits trees provide. In line<br />
with national trends, the neighborhoods<br />
with the lowest percentage of people of color<br />
contain above-average tree canopy coverage<br />
while the neighborhoods with the highest<br />
percentage of people in poverty suffer from<br />
the lowest tree canopy coverage.<br />
Community Vision<br />
Throughout the period of engagement, C3<br />
residents drew connections between the<br />
sustainability of the community, public health,<br />
and their access to gardens, trees, and green<br />
spaces. A major concern expressed by many<br />
in the C3 community was equitable access<br />
to fresh produce and urban gardens. For<br />
many in urban neighborhoods, particularly<br />
low-income and communities of color, the<br />
most conveniently available foods are fast<br />
and heavily processed foods; to combat this,<br />
residents envisioned a publicly accessible<br />
network of farmers markets and community<br />
gardens in vacant lots and public spaces.<br />
The community also linked the expansion of<br />
green space to a need to implement waterconscious<br />
landscaping and reduce pollution.<br />
A mass conversion of grass, including golf<br />
courses, and street yards to native landscaping<br />
would promote responsible management of<br />
water and potentially capture water and air<br />
pollution.<br />
“Trees are planted poorly and seem to have a 50/50 success<br />
ratio. It is really disappointing driving around seeing all the<br />
dead trees and nothing being done to support the ones that<br />
are still alive or clinging to life.” - Survey Respondent<br />
111
Biodiversity, Tree Canopy, & Food<br />
Figure 19 <strong>Commerce</strong> <strong>City</strong>’s tree equity score.<br />
112
Biodiversity, Tree Canopy,<br />
& Food<br />
Strategies and <strong>Action</strong>s<br />
This focus area offers many opportunities to foster relationships between the <strong>City</strong>, schools,<br />
and community members. However, to achieve the community’s vision, the <strong>City</strong> should begin<br />
by assessing various standards, regulations, and policies to ensure a permissive policy and<br />
regulatory environment <strong>for</strong> urban agriculture and gardens. The strategies and actions below<br />
break down the community’s vision into actionable, policy and planning-oriented steps intended<br />
to focus the <strong>City</strong>’s ef<strong>for</strong>ts over the plan’s five-year timeframe.<br />
“As the cost of living rises, food, especially healthy food,<br />
is becoming inaccessible to a growing percentage of the<br />
population. It is putting large amounts of the population at risk<br />
that they can’t protect themselves.” - Survey Respondent<br />
113
Biodiversity, Tree Canopy,<br />
& Food<br />
Strategy<br />
Protect and expand <strong>City</strong> green space and increase tree canopy<br />
coverage to 20%.<br />
Cost<br />
Staffing Requirements<br />
GHG Reduction Potential<br />
Level of <strong>City</strong> Control<br />
<strong>Action</strong>s<br />
Timeline<br />
B 1. Expand and maintain publicly managed street trees, tree planting, and<br />
tree-scale programs. Explore development of an incentive program to plant<br />
two trees <strong>for</strong> every removed tree. Develop <strong>City</strong> goals and policies to drive<br />
strategic purchases of land that add to existing green spaces and do not<br />
increase maintenance burdens on Parks Department staff.<br />
B 2. Develop and implement a plan to increase urban <strong>for</strong>est canopy to at least<br />
20% across the entire <strong>City</strong>, particularly in low-income neighborhoods.<br />
B 3. Work with Denver International Airport to implement a program <strong>for</strong><br />
planting a new tree <strong>for</strong> every new flight added.<br />
Implementation Notes<br />
► The nonprofit organization American Forest produces a report and “Tree Equity Score”<br />
map <strong>for</strong> municipalities across the country. Within each <strong>Commerce</strong> <strong>City</strong> neighborhood,<br />
they estimate a goal of 20% <strong>for</strong>est canopy density to achieve tree equity.<br />
114
Biodiversity, Tree Canopy,<br />
& Food<br />
Strategy<br />
Increase biodiversity, local food production, and community<br />
gardens.<br />
Cost<br />
Staffing Requirements<br />
GHG Reduction Potential<br />
Level of <strong>City</strong> Control<br />
<strong>Action</strong>s<br />
Timeline<br />
B 4. Work with community partners to explore and develop programs and<br />
campaigns that expand access to locally grown produce and community<br />
gardens <strong>for</strong> low-income, highly impacted communities. These may include<br />
encouraging urban agriculture to new developments and infill projects.<br />
B 5. Develop programs and campaigns to encourage pollinator habitats and<br />
foster ladybug habitats.<br />
B 6. Develop a program and/or campaign to help residents donate trees to<br />
one another.<br />
B 7. Adopt and encourage the “No Lawn” movement and remove grass on<br />
<strong>City</strong> properties to lead by example.<br />
B 8. Develop programs and incentives to encourage conversion of vacant<br />
lots and community spaces to community gardens and of “street yards” to<br />
native wildflower and plant gardens. Work with HOAs, more specifically<br />
the Reunion Metro District, nonprofits, and landowners to implement and<br />
publicize programs.<br />
115
Biodiversity, Tree Canopy,<br />
& Food<br />
Strategy<br />
CONTINUED: Increase biodiversity, local food production, and<br />
community gardens.<br />
Cost<br />
Staffing Requirements<br />
GHG Reduction Potential<br />
Level of <strong>City</strong> Control<br />
<strong>Action</strong>s<br />
Timeline<br />
B 9. Keep agricultural zoning to ensure green spaces are maintained.<br />
B 10. Work with <strong>City</strong> facilities and Parks Department to identify feasible<br />
locations around the <strong>City</strong>, particularly <strong>City</strong> lands, <strong>for</strong> planting self-sustaining<br />
fruit trees and bushes to produce food, increase aesthetics, reduce PM,<br />
help with erosion and biodiversity, etc. Work with the Parks Department to<br />
develop maintenance plans <strong>for</strong> fruit trees and recruit volunteers to support.<br />
Map fruit trees around the community.<br />
B 11. Work with <strong>City</strong> Parks Department staff to identify target <strong>City</strong> trees <strong>for</strong><br />
replacement with native species and develop a tree planting grant program<br />
<strong>for</strong> replacing aging or diseased non-native trees with <strong>City</strong>-approved native<br />
species on residential properties and planting native drought-tolerant, fireresistant<br />
trees. Explore business and industry partnerships to sponsor grants<br />
or donate trees.<br />
116
Biodiversity, Tree Canopy,<br />
& Food<br />
Strategy<br />
CONTINUED: Increase biodiversity, local food production, and<br />
community gardens.<br />
Cost<br />
Staffing Requirements<br />
GHG Reduction Potential<br />
Level of <strong>City</strong> Control<br />
<strong>Action</strong>s<br />
Timeline<br />
B 12. Develop an incentive program <strong>for</strong> and work with residential<br />
neighborhoods and neighborhood associations to install permaculture<br />
landscaping within communities.<br />
B 13. Develop incentive programs to encourage the use of natural weed<br />
killers and pesticides on residential properties.<br />
Implementation Notes<br />
► These actions offer the <strong>City</strong> opportunities to collaborate across focus areas, particularly<br />
with water conservation and agriculture work.<br />
► Supplement programs with a work<strong>for</strong>ce training program <strong>for</strong> permaculture landscapers.<br />
Leverage the potential opportunity to develop a local industry around native gardening<br />
and landscaping, including natural weed killers and pesticides.<br />
► A ban of sales and applications of glyphosates and neonicotinoids within <strong>City</strong> limits<br />
would promote the use of natural treatments and reduce pollution.<br />
117
Biodiversity, Tree Canopy,<br />
& Food<br />
Strategy<br />
Implement activities to improve and enhance land and water<br />
restoration.<br />
Cost<br />
Staffing Requirements<br />
GHG Reduction Potential<br />
Level of <strong>City</strong> Control<br />
<strong>Action</strong>s<br />
Timeline<br />
B 14. Conduct an infill inventory to identify optimal opportunities <strong>for</strong> both<br />
development and green space.<br />
B 15. Implement <strong>City</strong> buy-back program to purchase and restore polluted<br />
Superfund and brownfield sites and repurpose them <strong>for</strong> appropriate and safe<br />
uses, including community gardens.<br />
B 16. Fund research to analyze the impact of fungal species that can<br />
remediate pollution.<br />
B 17. Encourage xeriscape projects on <strong>City</strong>-owned properties and promote<br />
xeriscaping with developers.<br />
B 18. Work with business and industry partners to develop landscaping<br />
standards that modify landscaping on municipal and commercial property<br />
near areas with AQ pollutant levels that exceed to-be-determined thresholds<br />
in an ef<strong>for</strong>t to capture those pollutants through nature-based solutions and<br />
increase resilient green spaces.<br />
118
Biodiversity, Tree Canopy,<br />
& Food<br />
Strategy<br />
CONTINUED: Implement activities to improve and enhance land<br />
and water restoration.<br />
Cost<br />
Staffing Requirements<br />
GHG Reduction Potential<br />
Level of <strong>City</strong> Control<br />
<strong>Action</strong>s<br />
Timeline<br />
B 19. Launch a community campaign to remove invasive species.<br />
B 20. Amend ordinance to require mulching/composting to enrich soil.<br />
B 21. Applying the precautionary principle, pass an ordinance banning the<br />
use of glyphosates and neonicotinoids, which are harmful to bees, near any<br />
sole source drinking water aquifers.<br />
B 22. Promote the use of less toxic chemicals throughout the community,<br />
such as the EPA’s Section 3 Reregistration Eligibility Decision pesticides list.<br />
B 23. Work with Facilities and Parks departments to develop a soil health<br />
monitoring program to regularly sample soils around the <strong>City</strong>.<br />
Implementation Notes<br />
► Many actions in this strategy connect to actions in the water conservation focus area and<br />
offer collaborative opportunities with local business and industry to implement resilient<br />
green spaces.<br />
119
Leading By Example<br />
The <strong>City</strong> can spur broader community adoption of sustainability initiatives and actions by<br />
first modeling and piloting projects publicly to demonstrate feasibility. Many strategies and<br />
actions identified throughout this <strong>Plan</strong> offer the <strong>City</strong> opportunities to lead by setting an example<br />
and build on existing internal sustainability work such as the installation of solar PV arrays on<br />
the Civic Center. These include, but are not limited to the following:<br />
► Conducting energy benchmarking and audits of “[The city should] be more<br />
municipal facilities and publicizing results.<br />
collaborative across the<br />
► Developing energy intensity baseline <strong>for</strong> <strong>City</strong><br />
buildings and facilities.<br />
region. These pollutants<br />
► Increasing onsite renewable energy installations don’t know the boundaries<br />
on municipal buildings and using renewable<br />
energy <strong>for</strong> municipal operations.<br />
created by humans and<br />
► Training Public Works and Parks staff to<br />
we need more regional<br />
maintain PV installations.<br />
cooperation.”<br />
► Requiring <strong>City</strong> staff and leadership attendance at<br />
EJ and environmental sustainability seminars. - Community Organizer<br />
► Implementing zero-waste policies <strong>for</strong> <strong>City</strong> events<br />
and operations.<br />
► Converting landscapes and grass on <strong>City</strong> properties to native, water-conscious landscaping.<br />
► <strong>Plan</strong>ting trees on <strong>City</strong> property.<br />
► Piloting at least one greywater system in a <strong>City</strong> facility.<br />
► Converting the municipal fleet to EV and right-sizing vehicles.<br />
Commitment of <strong>City</strong> staff and resources to incorporating these sustainability principles into<br />
municipal facilities and properties will demonstrate the <strong>City</strong>’s willingness to collaborate with<br />
the larger community on scaling up initiatives. Kicking off implementation of the policy<br />
recommendations in this <strong>Plan</strong> with <strong>City</strong> actions may begin to build both trust and capacity in<br />
the community to continue engaging with this work.<br />
120
Next Steps & Implementation<br />
As <strong>Commerce</strong> <strong>City</strong> embarks on operationalizing and implementing the recommendations<br />
within this <strong>Plan</strong>, six key components will be integral to this work:<br />
1<br />
2<br />
3<br />
4<br />
5<br />
6<br />
Working closely with the community, including the EPAC, to engage all of<br />
<strong>Commerce</strong> <strong>City</strong> in this work.<br />
Engaging institutional, organizational, and business partners throughout<br />
<strong>Commerce</strong> <strong>City</strong> to implement recommendations and leverage existing work to<br />
advance sustainability.<br />
Applying <strong>for</strong> relevant funding opportunities, including grants and <strong>for</strong>thcoming<br />
federal funds from the American Rescue <strong>Plan</strong>, the Inflation Reduction Act, the<br />
Infrastructure Investment and Jobs Act, and Justice 40 to ensure this work is fully<br />
funded and fiscally sustainable in the long run.<br />
Developing a process <strong>for</strong> integrating economic, environmental, and social<br />
considerations – known as a triple bottom line analysis – into <strong>City</strong>-funded<br />
projects, policies, and programs.<br />
Evaluating and implementing proposed amendments and ordinances necessary<br />
to address community health concerns and build a more diverse economic base.<br />
Coordinating policies with neighboring municipalities to infuse sustainability<br />
principles into regional-scale short- and long-term planning.<br />
121
Next Steps & Implementation<br />
Importantly, the EPAC developed a resolution<br />
<strong>for</strong> the <strong>City</strong> Council to make the committee a<br />
permanent advisory committee. It should be<br />
noted that the community overwhelmingly<br />
supports the EPAC and its permanence:<br />
the survey showed that around 85% of<br />
respondents agreed with passage of the<br />
resolution.<br />
As this is a five-to-ten-year action plan, the<br />
<strong>City</strong> will track progress towards its aspirations<br />
and goals through biannual GHG inventory<br />
updates. The internal municipal <strong>Sustainability</strong><br />
Committee will kick off several projects<br />
beginning in 2023, based on an internal<br />
ranking and the surveys conducted by Lotus.<br />
Results of this work will be shared with<br />
the community via a broad education and<br />
outreach campaign following the guidance<br />
provided in Appendix D. Finally, the <strong>City</strong><br />
will reassess its ongoing sustainability work<br />
and determine the next steps necessary to<br />
achieving the community’s vision of a healthy<br />
and sustainable <strong>Commerce</strong> <strong>City</strong> in ten years<br />
by developing an update to this <strong>Plan</strong>.<br />
122
Appendix A. <strong>Action</strong>s Matrix Timeline Order<br />
Education & Outreach Strategies<br />
► Promote and publicize the <strong>City</strong>’s climate and sustainability work through ongoing educational campaigns targeted towards various audiences, with<br />
a focus on connecting residents to the <strong>City</strong>’s participatory opportunities. (EO 1-3)<br />
► Develop a culture of sustainability in local businesses and community organizations. (EO 4-11)<br />
► Create a <strong>City</strong>-wide brand and campaign <strong>for</strong> sustainability and partner with community entities to engage, educate, and empower the community<br />
to support a sustainable future. (EO 12-18)<br />
<strong>Action</strong>s Timeline* Cost**<br />
EO 1. Develop accessible, multi-lingual educational campaigns through a dedicated public outreach program targeted<br />
towards the community to disseminate in<strong>for</strong>mation on <strong>City</strong> sustainability actions and goals and ways <strong>for</strong> community to<br />
participate and provide feedback. Publicize in<strong>for</strong>mation and public feedback opportunities through multi-media channels,<br />
Short $<br />
including the <strong>City</strong> newspaper.<br />
EO 2. Create and publicize new web pages on the <strong>City</strong> website to publicize sustainability goals and other in<strong>for</strong>mation,<br />
including important opportunities <strong>for</strong> residents to help the <strong>City</strong> achieve sustainability goals.<br />
Short $<br />
EO 3. Develop a stronger feedback mechanism to improve the flow of in<strong>for</strong>mation on <strong>City</strong> sustainability actions and goals<br />
and community experiences and knowledge on the ground between <strong>City</strong> leadership, staff, and council and their districts.<br />
Supplement with sustainability-focused workshops and other community engagement activities <strong>for</strong> residents and <strong>City</strong> staff<br />
Short $<br />
and leadership to increase collaboration and in<strong>for</strong>mation-sharing.<br />
EO 4. Develop and promote a sustainability business program. Short $<br />
EO 5. Support local work<strong>for</strong>ce development programs <strong>for</strong> the green transition (e.g., mechanics <strong>for</strong> EVs, HVAC, etc.).<br />
Partner with Adams 12 school district, community colleges, and businesses.<br />
Short $<br />
EO 16. Implement programs and hiring practices aimed at diversifying <strong>City</strong> staff and leadership. Short $<br />
*Implementation timeline is defined as: Short (next 1-2 years); Medium (next 3-5 years); and long (next 6-10 years).<br />
**Estimated costs are defined as: $ ($100,000 annually).<br />
123
Appendix A. <strong>Action</strong>s Matrix Timeline Order<br />
Education & Outreach Continued<br />
<strong>Action</strong>s Timeline* Cost**<br />
EO 6. Develop a public education and awareness campaign to encourage small businesses, community organizations,<br />
and institutions such as schools to purchase green products, i.e., restaurant takeout containers, and transition away from<br />
purchases of single-use plastic products. Work with community members to advocate <strong>for</strong> strong State-level regulation of<br />
Medium $<br />
single-use plastics and incentives <strong>for</strong> green products.<br />
EO 7. Create programs to support local businesses in their emissions reduction and sustainability work. Medium $<br />
EO 13. Create a <strong>City</strong>-sponsored public education campaign on recycling, composting, and the energy transition, including<br />
the differences between electric and traditional combustion engine vehicles, <strong>for</strong> residents.<br />
Medium $<br />
EO 14. Develop educational programs that recognize the history of <strong>Commerce</strong> <strong>City</strong>. Medium $<br />
EO 8. Promote green networking programs. Long $<br />
EO 9. Explore options <strong>for</strong> <strong>City</strong> incentive programs aimed at attracting new clean and efficiency industries, including<br />
building retrofits, etc.<br />
Long $<br />
EO 10. Host sustainability brown bags <strong>for</strong> residents and businesses. Long $<br />
EO 11. Participate in and disseminate results from NREL programs. Long $<br />
EO 12. Publicize on <strong>City</strong> websites and outreach materials the benefits and importance of native species, urban <strong>for</strong>est<br />
canopy, and biodiversity and develop workshops to promote native landscaping and tree planting.<br />
Long $<br />
EO 15. Collaborate with HOAs and community organizations to encourage residents to participate in sustainable home<br />
practices such as employing clotheslines instead of energy-intensive dryers.<br />
Long $<br />
EO 17. Develop a roadmap to removing and preventing pollution created by industrial facilities such as the Suncor facility,<br />
including options to revoke the permits to operate.<br />
Long $<br />
EO 18. Partner with other local cities and communities on their sustainability programs. Long $<br />
*Implementation timeline is defined as: Short (next 1-2 years); Medium (next 3-5 years); and long (next 6-10 years).<br />
**Estimated costs are defined as: $ ($100,000 annually).<br />
124
Appendix A. <strong>Action</strong>s Matrix Timeline Order<br />
Energy Efficiency Strategies<br />
► Promote energy efficiency <strong>for</strong> residential and commercial buildings. (EE 1-8)<br />
► Promote fuel switching (i.e. electrification) through incentive programs and public campaigns/initiatives. (EE 9-11)<br />
► Adopt policies, programs, and design guidelines <strong>for</strong> resilient, healthy, energy efficient buildings and community infrastructure to enhance quality<br />
of life, reduce costs, and complement the natural environment. (EE 12-20)<br />
► Lead by example through the operation and maintenance of <strong>City</strong> facilities. (EE 21-24)<br />
<strong>Action</strong>s Timeline* Cost**<br />
EE 2. Adopt and en<strong>for</strong>ce the most recent International Energy Conservation Code (IECC) within one year of it being<br />
released with options <strong>for</strong> strengthening amendments.<br />
Short $ - $$<br />
EE 4. Develop and implement code language to require inclusion of energy efficient appliance packages in new homes<br />
and new multi-family housing developments. Supplement with programs that help low-income families and af<strong>for</strong>dable<br />
housing purchase packages and incentivize retrofits in rental and multi-family units to ensure core city residents can<br />
Short $ - $$<br />
benefitC<br />
EE 11. Educate and offer incentives <strong>for</strong> businesses to replace combustion fuel appliances with electric ones. Short $ - $$<br />
EE 14. Develop program to disburse air purifiers and filters to low-income, impacted households within a certain radius<br />
around Suncor refinery (or other metric to be determined) and communities where AQ metrics exceed federal NAAQS Short $$<br />
standards.<br />
EE 22. Publish International Green Construction Code checklist. Short $$$<br />
EE 3. Develop and implement code language to require installation of solar panels and electrification in new large multifamily<br />
housing developments.<br />
Medium $ - $$<br />
EE 9. Educate and offer incentives <strong>for</strong> residences to replace combustion fuel appliances with electric ones, with a focus on<br />
low-income communities.<br />
EE 12. Require landlords to disclose energy efficiency, water efficiency and quality, and land issues (e.g., proximity to<br />
Suncor or major polluters) to potential tenants.<br />
*Implementation timeline is defined as: Short (next 1-2 years); Medium (next 3-5 years); and long (next 6-10 years).<br />
**Estimated costs are defined as: $ ($100,000 annually).<br />
125<br />
Medium $ - $$<br />
Medium $$
Appendix A. <strong>Action</strong>s Matrix Timeline Order<br />
Energy Efficiency Continued<br />
<strong>Action</strong>s Timeline* Cost**<br />
EE 13. Work with landlords to encourage applying <strong>for</strong> energy efficiency programs to improve efficiency in their rental<br />
units. Develop transition plan to ultimately require certain energy efficiency standards in all rental units.<br />
Medium $$<br />
EE 18. Adopt code language to require a to-be-determined improvement in whole home air tightness by 2025, including<br />
requirements <strong>for</strong> more airtight air ducts.<br />
Medium $$<br />
EE 1. Expand residential energy efficiency and retrofit programs, particularly those targeted towards low-income<br />
communities and landlords to prevent displacement due to costs of beneficial electrification transition. Supplement these Long $ - $$<br />
programs with additional outreach and education.<br />
EE 5. Develop and implement code language that steps up the requirement <strong>for</strong> high efficiency lighting from 75% to 100%. Long $ - $$<br />
EE 6. Develop and implement code language that regulates exterior lighting power <strong>for</strong> residential buildings like dorms,<br />
boarding houses, care facilities, and congregate living facilities.<br />
Long $ - $$<br />
EE 7. Require or incentivize building energy benchmarking <strong>for</strong> large multi-family housing developments and commercial/<br />
industrial buildings. Develop programs to help make benchmarking available to af<strong>for</strong>dable housing and low-income<br />
Long $ - $$<br />
communities. Could begin with the municipal benchmarking and setting targets <strong>for</strong> specific <strong>City</strong> facilities.<br />
EE 8. Continue to provide energy efficiency outreach and incentives <strong>for</strong> all energy users. Encourage energy efficiency<br />
through programs (such as current in<strong>for</strong>mation and rebate and incentive support from local energy utility companies,<br />
Department of Energy, and the EPA) that encourage and/or reward citizens to use energy-efficient appliances, insulation,<br />
Long $ - $$<br />
windows, etc. Help citizens become aware of costs and cost-savings in electrification and efficiency.<br />
EE 10. Develop and implement code language to restrict natural gas use in new construction. Long $ - $$<br />
EE 15. Require the EJ and HERS scores on every property <strong>for</strong> sale and rent. Long $ - $$<br />
*Implementation timeline is defined as: Short (next 1-2 years); Medium (next 3-5 years); and long (next 6-10 years).<br />
**Estimated costs are defined as: $ ($100,000 annually).<br />
126
Appendix A. <strong>Action</strong>s Matrix Timeline Order<br />
Energy Efficiency Continued<br />
<strong>Action</strong>s Timeline* Cost**<br />
EE 16. Advocate <strong>for</strong> changes to federal weatherization programs to support/fund projects <strong>for</strong> cooling in <strong>Commerce</strong> <strong>City</strong>. Long $$<br />
EE 17. Add prescriptive building envelope requirements to building codes, including a blower door test and visual<br />
inspection of the air barrier, air sealing, and insulation installation in a home. Develop programs that help low-income Long $$<br />
households and small contractors in meeting new requirements.<br />
EE 19. Implement Modified Energy Rating Index rating values based on the 2018 IECC. Long $$<br />
EE 20. Develop and publicize a voluntary zero energy appendix that provides the design and construction industry with a<br />
code-based method of designing and constructing zero energy buildings.<br />
Long $$<br />
EE 21. Incorporate Energy Star, Enterprise Green Communications, International Living Future, Well Building, Passive<br />
House into building codes.<br />
Long $$$<br />
EE 23. Develop energy intensity baseline in Kbtu per square feet <strong>for</strong> <strong>City</strong> building and facilities. Long $$$<br />
EE 24. Benchmark <strong>City</strong> facility per<strong>for</strong>mance, publish the results, develop and implement improvement plans <strong>for</strong> the<br />
facilities, and share the results via case studies with the community.<br />
Long $$$<br />
*Implementation timeline is defined as: Short (next 1-2 years); Medium (next 3-5 years); and long (next 6-10 years).<br />
**Estimated costs are defined as: $ ($100,000 annually).<br />
127
Appendix A. <strong>Action</strong>s Matrix Timeline Order<br />
Renewable Energy Strategies<br />
► Implement policies that support comprehensive renewable energy growth <strong>for</strong> the community. (RE 1-4)<br />
► Support State-level policies to advance a clean energy agenda. (RE 5)<br />
► Establish a resilient, equitable, and reliable energy future powered by low-carbon and renewable energy. (RE 6-8)<br />
► Reduce impacts from oil and gas drilling throughout the community. (RE 9)<br />
<strong>Action</strong>s Timeline* Cost**<br />
RE 1. Develop municipally-supported renewable energy projects and programs that benefit the whole community,<br />
including working with Xcel and UP to explore programmatic options <strong>for</strong> rooftop community solar gardens, brownfield Short $$ - $$$<br />
redevelopment into solar gardens, and rooftop solar on warehouses.<br />
RE 5. Advocate at the State-level <strong>for</strong> aggressive renewable energy standards, a Clean Energy Agenda, and improved<br />
incentives <strong>for</strong> energy efficient appliance purchases.<br />
Short $<br />
RE 9. Develop regulations that require any new oil and gas development be emissions neutral and implement reverse<br />
setbacks <strong>for</strong> active, abandoned, and plugged wells. Work with State partners to incorporate requirements <strong>for</strong> more<br />
stringent AQ standards and monitoring programs into oil and gas permits to alleviate associated health burdens along<br />
Short $<br />
with compensation <strong>for</strong> impacted communities.<br />
RE 2. Increase on-site renewable energy installations at municipal buildings and use of renewable energy <strong>for</strong> municipal<br />
operations. Supplement with investment in hiring and/or training Public Works staff to maintain PV installations.<br />
Medium $$ - $$$<br />
RE 3. Develop programs to market and incentivize solar (e.g., bulk purchase programs, rebates <strong>for</strong> residents and<br />
businesses etc.), including partnership opportunities <strong>for</strong> solar installations and renewable subscriptions. Work with Medium $$ - $$$<br />
utilities to improve incentive programs and opportunities that make electrification af<strong>for</strong>dable and accessible.<br />
RE 4. Develop an energy transition plan with Xcel Energy and UP to increase share of renewables in the C3 energy mix<br />
every year by 10%.<br />
Medium $$ - $$$<br />
*Implementation timeline is defined as: Short (next 1-2 years); Medium (next 3-5 years); and long (next 6-10 years).<br />
**Estimated costs are defined as: $ ($100,000 annually).<br />
128
Appendix A. <strong>Action</strong>s Matrix Timeline Order<br />
Renewable Energy Continued<br />
<strong>Action</strong>s Timeline* Cost**<br />
RE 6. Explore opportunities <strong>for</strong> resilient energy systems including the development of a city-wide microgrid. Long $$$<br />
RE 7. Build regional renewable energy partnerships, particularly in collaboration with communities that are further along<br />
on microgrids and renewables.<br />
Long $$$<br />
RE 8. Continue collaboration with Energy Outreach Colorado and the Diversity, Equity, and Inclusion Board to prioritize<br />
reducing energy burden and expand energy services <strong>for</strong> low-income households.<br />
Long $$$<br />
*Implementation timeline is defined as: Short (next 1-2 years); Medium (next 3-5 years); and long (next 6-10 years).<br />
**Estimated costs are defined as: $ ($100,000 annually).<br />
129
Appendix A. <strong>Action</strong>s Matrix Timeline Order<br />
Adaptation and Mitigation Strategies<br />
► Encourage public engagement with climate and sustainability work at the State level. (AM 1-3)<br />
► Foster a culture of public participation in an equitable, just climate transition. (AM 4-7)<br />
<strong>Action</strong>s Timeline* Cost**<br />
AM 2. Participate in the regulatory and legislative process at the State level on sustainability initiatives and bills. Short $<br />
AM 4. Establish a permanent EPAC. Reach out to employees at NREL <strong>for</strong> help getting stats and in<strong>for</strong>mation, and a<br />
possible letter of support <strong>for</strong> a permanent EPAC. Provide community education and workshops regarding GHGs, EJ, AQ, Short $<br />
and other community health issues.<br />
AM 6. Work with <strong>City</strong> leadership to declare a climate crisis to create momentum behind sustainability actions, raise<br />
awareness to the climate problem, and potentially open up emergency funds to support programs that protect residents<br />
from environmental pollution and other harms. Partner with other local cities and communities on their sustainability<br />
Short $<br />
programs.<br />
AM 1. Publicize in<strong>for</strong>mation on recent sustainability-related bills (e.g. 1244, 180, 1189, 1265) & ways to advocate <strong>for</strong><br />
change.<br />
Medium $<br />
AM 5. Encourage <strong>City</strong> staff and leadership attendance at EJ seminars hosted by <strong>City</strong> staff and partners and make these<br />
trainings publicly accessible to the local community.<br />
Medium $<br />
AM 3. Encourage and support school district applications <strong>for</strong> State grants to submit to State agency evaluations and<br />
implement sustainability measures in public schools.<br />
Long $<br />
AM 7. Collaborate with CDPHE, community residents, and local industry in order to build resilient spaces in the <strong>City</strong><br />
that reduce the health impacts associated with air pollution and mitigate the negative impacts caused by climate change.<br />
Resilient design can limit risks associated with a shifting climate, so incorporating resilient solutions into future planning<br />
and policy could help to address present AQ issues and mitigate against future potential harms.<br />
Long $<br />
*Implementation timeline is defined as: Short (next 1-2 years); Medium (next 3-5 years); and long (next 6-10 years).<br />
**Estimated costs are defined as: $ ($100,000 annually).<br />
130
Appendix A. <strong>Action</strong>s Matrix Timeline Order<br />
Recycling and Waste Diversion Strategies<br />
► Implement policies and ordinances to purchase sustainable products, reduce solid waste, and increase waste diversion community-wide. (WD 1-6)<br />
► Foster a zero-waste culture at C3 through zero-waste events and operations, education, and programs that reduce trash-related pollution and<br />
expand access to recycling and composting. (WD 7-12)<br />
► Improve waste diversion infrastructure in C3 to support low carbon transition and pollution reduction goals. (WD 13-17)<br />
<strong>Action</strong>s Timeline* Cost**<br />
WD 1. Update the <strong>City</strong>’s waste management contract to implement policies aligned with Save-As-You-Recycle, which is<br />
aimed at increasing waste diversion and reducing consumption by ensuring all households have free access to recycling Short $ - $$<br />
and waste disposal costs increase in proportion to the amount of waste disposed.<br />
WD 2. Develop an ordinance requiring large multi-family and commercial property owners to provide recycling and<br />
compost collection services.<br />
Short $ - $$<br />
WD 7. Work with community partners to ensure curbside composting and recycling services are publicly available<br />
within the community and support free community-led compost facilities, particularly in low-income, highly impacted Short $$<br />
communities. This may come in the <strong>for</strong>m of providing at-home recycling and composting kits.<br />
WD 9. Develop and publicize recycling and composting education campaigns aimed at residents to reduce contamination<br />
of recycle and compost streams, i.e. reducing lithium batteries in recycle and promoting rechargeable batteries.<br />
Short $$<br />
WD 8. Work with school districts to implement waste diversion and reduction strategies such as eliminating disposable<br />
food trays. Develop curriculum to educate elementary and middle school students on recycling and composting.<br />
Medium $$<br />
WD 10. Develop and implement a plan to eliminate air pollution from the landfill. Medium $$<br />
WD 11. Develop a waste diversion plan with metrics to measure composting rates and implement plan to reach a 20%<br />
citywide increase in composting. Work with the community to promote and provide free self-contained composting Medium $$<br />
containers.<br />
WD 12. Provide small local businesses and community groups/members grants or incentives to develop waste reduction<br />
or diversion strategies and expand community recycling and composting infrastructure.<br />
Medium $$<br />
*Implementation timeline is defined as: Short (next 1-2 years); Medium (next 3-5 years); and long (next 6-10 years).<br />
**Estimated costs are defined as: $ ($100,000 annually).<br />
131
Appendix A. <strong>Action</strong>s Matrix Timeline Order<br />
Recycling and Waste Diversion Continued<br />
<strong>Action</strong>s Timeline* Cost**<br />
WD 3. Develop and implement an extra fee associated with purchases and use of Styrofoam products that avoids<br />
increasing costs to end consumers. Work with State partners and advocate <strong>for</strong> State policies that regulate plastic bags, Long $ - $$<br />
Styrofoam, commercial recycling, etc.<br />
WD 4. Develop policies to limit the use of plastic bags community-wide. Long $ - $$<br />
WD 5. Develop ordinances to mandate recycling in businesses such as restaurants and grocery stores. Long $ - $$<br />
WD 6. Develop waste reduction targets and collect data on key diversion and reduction metrics to measure success of<br />
waste generation and diversion programs and policies.<br />
Long $ - $$<br />
WD 13. Adopt and en<strong>for</strong>ce a C&D waste recycling ordinance. Consider requirements <strong>for</strong> using recycled concrete in all<br />
new projects.<br />
Long $$<br />
WD 14. Invest in solar-powered Big Bellies and Slim Jim’s. Long $$<br />
WD 15. Set cardboard recycling ordinances. Long $$<br />
WD 16. Work with waste management partners to develop infrastructure <strong>for</strong> organics disposal and implement waste<br />
diversion plan to reduce organics from landfill.<br />
Long $$<br />
WD 17. Work with waste management partners to develop infrastructure <strong>for</strong> recycling of concrete and appliances, to<br />
support transition to high efficiency and electric appliances.<br />
Long $$<br />
*Implementation timeline is defined as: Short (next 1-2 years); Medium (next 3-5 years); and long (next 6-10 years).<br />
**Estimated costs are defined as: $ ($100,000 annually).<br />
132
Appendix A. <strong>Action</strong>s Matrix Timeline Order<br />
Water Strategies<br />
► Develop policies and programs that will help residents and businesses conserve water. (W 1-6)<br />
► Promote water quality and community trust in water quality. (W 7-11)<br />
<strong>Action</strong>s Timeline* Cost**<br />
W 1. Work with SACWSD to develop program to help convert “street yards” into native plant gardens and sprinklers <strong>for</strong><br />
“street yards” into drip lines <strong>for</strong> street trees.<br />
Short $<br />
W 6. Work with HOAs and SACWSD to reduce residential lawn area, encourage rock and water-efficient landscaping, and<br />
install water conservation projects. This may include development of a rebate program on stormwater fees, new landscape Short $<br />
standards, etc.<br />
W 8. Work with SACWSD to develop an educational campaign on PFAS risks, regulations, and current/evolving state of<br />
PFAS in the local water system. Identify partnerships to support the distribution of PFAS tests in the community.<br />
Short $$<br />
W 9. Work with SACWSD to identify key threats to WQ in C3 and exceedances of any federal WQ standards, and provide<br />
home water filtration systems to all households that exceed standards.<br />
Short $$<br />
W 2. Mandate that cool weather turf be restricted to 40% of backyards, or 500 square feet, whichever is smaller <strong>for</strong> new<br />
residential and commercial sites.<br />
Medium $<br />
W 4. Develop programs to incentivize the use of greywater systems. Medium $<br />
W 5. Work with SACWSD to develop stricter regulations on golf course siting and water consumption, including<br />
requirements <strong>for</strong> no-mow areas and water reuse and low-water use landscape standards.<br />
Medium $<br />
W 7. Provide opportunities to learn more about local water systems (i.e. tours at SACWSD). Medium $$<br />
W 3. Work with SACWSD to provide incentives to existing residential and commercial sites to remove front yard lawns,<br />
then to xeriscape and/or replant with native species.<br />
Long $<br />
W 10. Encourage use of nature-based stormwater filtration systems in new developments and infill/redevelopments. Long $$<br />
W 11. Pilot at least one greywater system installation in a publicly accessible <strong>City</strong> facility to ensure visibility. Long $$<br />
*Implementation timeline is defined as: Short (next 1-2 years); Medium (next 3-5 years); and long (next 6-10 years).<br />
**Estimated costs are defined as: $ ($100,000 annually).<br />
133
Appendix A. <strong>Action</strong>s Matrix Timeline Order<br />
Transportation Strategies<br />
► Increase the proportion of EVs in the city’s fleet and in the community. Increase the number of light duty and medium duty EVs in the city fleet.<br />
(T 1)<br />
► Promote and educate residents on EVs and their related support network such as charging infrastructure. (T 2-4)<br />
► Prioritize multi-modal transportation options in an ef<strong>for</strong>t to broaden access to the places where people recreate, work, and live. Expand safe and<br />
convenient public transit, walking, and bicycling routes, including last-minute and last-leg transportation connections. Focus on improving and<br />
investing in transportation infrastructure, especially repairs and access to public transit and local and regional activity centers (such as shopping,<br />
jobs, and recreation). (T 5-15)<br />
► Support and promote equitable EV adoption. (T 16-19)<br />
► Reduce idling and air pollution from traffic by promoting anti-idling policies and educating the public on behavior changes that will support air<br />
pollution reduction goals. (T 20-23)<br />
<strong>Action</strong>s Timeline* Cost**<br />
T 8. Improve road and traffic safety by repairing residential streets, filling in cracks and potholes, adding signage to slow<br />
drivers down, and piloting traffic-calming measures.<br />
Short $$$<br />
T 10. Work with CDOT and property owners near schools and in key commercial districts to widen sidewalks, improve<br />
street lighting, and add crossing paths at key intersections to improve pedestrian safety and encourage students to walk<br />
to schools and residents to walk and socialize. Develop code amendments to require wider sidewalks in new construction<br />
Short $$$<br />
projects.<br />
T 11. Apply <strong>for</strong> Safe Routes to School Grant from CDOT (open Aug. 9-Nov. 4). Short $$$<br />
T 21. Develop an anti-idling resolution and work with the Adams 12 School District and private schools to establish and<br />
en<strong>for</strong>ce no-idle zones around schools.<br />
Short $<br />
*Implementation timeline is defined as: Short (next 1-2 years); Medium (next 3-5 years); and long (next 6-10 years).<br />
**Estimated costs are defined as: $ ($100,000 annually).<br />
134
Appendix A. <strong>Action</strong>s Matrix Timeline Order<br />
Transportation Continued<br />
<strong>Action</strong>s Timeline* Cost**<br />
T 2. Host a public <strong>for</strong>um on EVs, covering education on vehicle per<strong>for</strong>mance, financing, network charging, tax credits,<br />
models, test drives, etc.<br />
Medium $<br />
T 4. Create and implement educational and awareness campaigns that promote EV adoption. Medium $<br />
T 7. Develop and implement a city-wide multi-modal transportation plan that promotes transit oriented development and<br />
multimodal connectivity and focuses on moving people efficiently and equitably. Focus infrastructure improvements and<br />
investments on reaching under-resourced communities. Engage public transit users where they are in order to solicit input<br />
Medium $$$<br />
in the plan.<br />
T 12. Improve bus and light rail stop infrastructure, including by adding shelters to bus stops. Medium $$$<br />
T 18. Develop and implement electric vehicle charging infrastructure installation community-wide, including introducing<br />
requirements <strong>for</strong> new gas station developments to incorporate EV charging.<br />
Medium $<br />
T 1. Develop a roadmap <strong>for</strong> transportation electrification in the community that includes <strong>City</strong> fleet electrification,<br />
connecting renewable energy supplies to charging infrastructure where feasible, education and awareness campaigns Long $$<br />
around EV adoption, and equity considerations <strong>for</strong> EV costs.<br />
T 3. Improve public EV charging signage and options, larger signs, campaigns <strong>for</strong> education and awareness. Long $<br />
T 5. Explore options to reduce costs of public transportation <strong>for</strong> under-resourced populations and establish dedicated<br />
funding sources <strong>for</strong> expanding public transit and park-and-rides.<br />
Long $$$<br />
T 6. Promote existing, and explore additional, alternative transportation options, including the N Line, shuttle service,<br />
bicycling, shared micro-mobility, and rideshare options.<br />
Long $$$<br />
T 9. Expand bicycle lane networks and add bicycle racks, lane barriers and restripe lane lines to increase visibility and<br />
protect bicyclists from motor vehicle traffic, including the large quantity of freight trucks.<br />
135<br />
Long $$$<br />
T 13. Meet with RTD and CDOT to analyze and develop improvement plans <strong>for</strong> public routes and accessibility in C3. Long $$$<br />
T 14. Sponsor limited, longer range bus routes as an alternative to driving through and around C3. Long $$$<br />
*Implementation timeline is defined as: Short (next 1-2 years); Medium (next 3-5 years); and long (next 6-10 years).<br />
**Estimated costs are defined as: $ ($100,000 annually).
Appendix A. <strong>Action</strong>s Matrix Timeline Order<br />
Transportation Continued<br />
<strong>Action</strong>s Timeline* Cost**<br />
T 15. Develop strategy and action plan to increase <strong>City</strong> walk score. Long $$$<br />
T 16. Work with utilities to develop and communicate incentive programs to encourage private citizens to charge electric<br />
vehicles during energy off-peak hours (i.e. early mornings or late evenings).<br />
Long $<br />
T 17. Develop a rebate program <strong>for</strong> e-bicycles and pilot a bike and scooter share program. Long $<br />
T 19. Pilot bike and scooter share programs. Long $<br />
T 20. Lead public campaigns, particularly around schools and with fleet companies, to discourage idling and convert fleet<br />
to EV, highlighting public health benefits of no-idle zones. Post in<strong>for</strong>mation about anti-idling at local schools and signs<br />
throughout the community.<br />
Long $<br />
T 22. Install intelligent traffic signals to reduce wait times <strong>for</strong> vehicles during off-peak hours. Long $<br />
T 23. Explore train schedules to reduce wait times at crossings. Long $<br />
*Implementation timeline is defined as: Short (next 1-2 years); Medium (next 3-5 years); and long (next 6-10 years).<br />
**Estimated costs are defined as: $ ($100,000 annually).<br />
136
Appendix A. <strong>Action</strong>s Matrix Timeline Order<br />
Community Health Strategies<br />
► Research characteristics of healthy communities and three most important healthcare concerns in <strong>Commerce</strong> <strong>City</strong>. (CH 1-2)<br />
► Track the increase in extreme heat days <strong>for</strong>ecasted by NOAA and prepare by ensuring community members know about <strong>City</strong> cooling<br />
centers. (CH 3-4)<br />
► Support health clinics that provide basic, necessary preventive care. (CH 5)<br />
► Proactively manage air pollution concerns that harm public health and increase transparency around local air quality data. (CH 6-10)<br />
► Develop a program <strong>for</strong> travel offsets. (CH 11)<br />
<strong>Action</strong>s Timeline* Cost**<br />
CH 1. Identify key metrics <strong>for</strong> monitoring that capture social, safety, and access barriers to obtaining mental and physical<br />
healthcare.<br />
Short $<br />
CH 3. On extreme heat days, waive fees at Eagle Pointe and Bison Ridge <strong>for</strong> all community members to provide a cooling<br />
space.<br />
Short $<br />
CH 9. Make accessible and publicize local air quality in<strong>for</strong>mation and data and work with community partners to<br />
disseminate actionable in<strong>for</strong>mation.<br />
Short $<br />
CH 10. Conduct an epidemiological study in partnership with CO School of Public Health to look at biomarkers and the<br />
impacts of pollution in C3.<br />
Short $<br />
CH 11. Work with regional partners, including Denver Airport, on a carbon offset program that could be used <strong>for</strong><br />
community projects such as tree plantings or protected bike lanes to improve local air quality.<br />
*Implementation timeline is defined as: Short (next 1-2 years); Medium (next 3-5 years); and long (next 6-10 years).<br />
**Estimated costs are defined as: $ ($100,000 annually).<br />
Short $$<br />
137
Appendix A. <strong>Action</strong>s Matrix Timeline Order<br />
Community Health Continued<br />
<strong>Action</strong>s Timeline* Cost**<br />
CH 2. Work with community health partners to develop programs that increase access to mental and physical healthcare<br />
<strong>for</strong> people struggling with mental health and substance addictions.<br />
Medium $<br />
CH 4. Publicize to residents that they should seek shelter at cooling centers such as recreation centers and bowling alleys. Medium $<br />
CH 5. Increase permits <strong>for</strong> physicians offices to reduce burden on health clinics and hospitals. Medium $<br />
CH 6. On severe air quality days <strong>for</strong> ozone, request that Suncor does not undertake maintenance. Medium $<br />
CH 7. Develop a prohibition that phases out the use of new gas-powered lawn equipment by 2025 to reduce emissions<br />
of volatile organic compounds and nitrous oxides. Work with big box retailers to develop incentives or discounts <strong>for</strong><br />
e-mowers.<br />
Long $<br />
CH 8. Ensure air monitoring and alert systems put greater emphasis on chronic, rather than acute, health impacts from air<br />
pollution. Current refinery notifications from Suncor focus on day-to-day impacts, while residents show great concern <strong>for</strong><br />
chronic impacts that accumulate over time.<br />
*Implementation timeline is defined as: Short (next 1-2 years); Medium (next 3-5 years); and long (next 6-10 years).<br />
**Estimated costs are defined as: $ ($100,000 annually).<br />
Long $<br />
138
Appendix A. <strong>Action</strong>s Matrix Timeline Order<br />
Funding and Economy Strategies<br />
► Explore and develop strategies <strong>for</strong> bulk purchasing in residential and <strong>City</strong> buildings. (FE 1-4)<br />
► Develop and promote a diverse, sustainable economy within the <strong>City</strong>. Bring clean energy industries to C3, and make C3 a leader in<br />
clean energy product development. (FE 5-8)<br />
<strong>Action</strong>s Timeline* Cost**<br />
FE 1. Explore bulk programs <strong>for</strong> solar installations with organizations like Solar United Neighbors or others. Short $$<br />
FE 4. Explore providing incentives or rebates that fill gaps in need, such as point-of-sale rebates <strong>for</strong> efficient appliances, or<br />
incentives <strong>for</strong> electric panel upgrades (which are generally required when installing solar or electrified equipment).<br />
Short $$<br />
FE 5. Develop a roadmap to removing and preventing pollution created by industrial facilities, including the Suncor<br />
facility, and work with State and federal agencies to reassess pollution standards against AQ monitoring data collected to Short $<br />
ensure permit rules achieve community health protection goals.<br />
FE 8. Support letter from Councilmember Kristi Douglas to the Climate <strong>Action</strong> Network asking <strong>for</strong> resources and<br />
assistance; explore other funding opportunities such as the Long-Duration Energy Storage Demonstrations and<br />
Short $<br />
Manufacturing Opportunities grant (DE-FOA-0002867).<br />
FE 2. Explore bulk purchase of e-bikes, regular bikes, or other similar alternative transportation methods. Medium $$<br />
FE 6. Work with warehouse owners and green industry partners to identify opportunities and barriers such as zoning and<br />
occupancy rules to converting empty storage space into usable industrial space <strong>for</strong> clean energy industries and products.<br />
Medium $<br />
FE 7. Explore options <strong>for</strong> <strong>City</strong> incentive programs aimed at attracting new clean and efficiency industries, including<br />
building retrofits, etc.<br />
Medium $<br />
FE 3. Explore bulk purchase of heat pumps or other electrification appliances <strong>for</strong> residents. Long $$<br />
*Implementation timeline is defined as: Short (next 1-2 years); Medium (next 3-5 years); and long (next 6-10 years).<br />
**Estimated costs are defined as: $ ($100,000 annually).<br />
139
Appendix A. <strong>Action</strong>s Matrix Timeline Order<br />
Biodiversity, Tree Canopy, and Food Strategies<br />
► Protect and expand <strong>City</strong> green space and increase tree canopy coverage to 20%. (B 1-3)<br />
► Increase biodiversity, local food production, and community gardens. (B 4-13)<br />
► Implement activities to improve and enhance land and water restoration. (B 14-23)<br />
<strong>Action</strong>s Timeline* Cost**<br />
B 4. Work with community partners to explore and develop programs and campaigns that expand access to locally grown<br />
produce and community gardens <strong>for</strong> low-income, highly impacted communities. These may include encouraging urban Short $$ - $$$<br />
agriculture to new developments and infill projects.<br />
B 9. Keep agricultural zoning to ensure green spaces are maintained. Short $$ - $$$<br />
B 10. Work with <strong>City</strong> facilities and parks departments to identify feasible locations around the <strong>City</strong>, particularly <strong>City</strong><br />
lands, <strong>for</strong> planting self-sustaining fruit trees and bushes to produce food, increase aesthetics, reduce PM, help with erosion<br />
and biodiversity, etc. Work with Parks department to develop maintenance plans <strong>for</strong> fruit trees and recruit volunteers to<br />
Short $$ - $$$<br />
support. Map fruit trees around the community.<br />
B 11. Work with <strong>City</strong> Parks staff to identify target <strong>City</strong> trees <strong>for</strong> replacement with native species and develop a tree<br />
planting grant program <strong>for</strong> replacing aging or diseased non-native trees with <strong>City</strong>-approved native species on residential<br />
properties and planting native drought-tolerant, fire-resistant trees. Explore business and industry partnerships to sponsor<br />
Short $$ - $$$<br />
grants or donate trees.<br />
B 18. Work with business and industry partners to develop landscaping standards that modify landscaping on municipal<br />
and commercial property near areas with air quality pollutant levels that exceed to-be-determined thresholds in an ef<strong>for</strong>t Short $$<br />
to capture those pollutants through nature-based solutions and increase resilient green spaces.<br />
B 2. Develop and implement a plan to increase urban <strong>for</strong>est canopy to at least 20% across the entire <strong>City</strong>, particularly in<br />
low-income neighborhoods.<br />
Medium $$ - $$$<br />
B 5. Develop programs and campaigns to encourage pollinator habitats and foster ladybug habitats. Medium $$ - $$$<br />
*Implementation timeline is defined as: Short (next 1-2 years); Medium (next 3-5 years); and long (next 6-10 years).<br />
**Estimated costs are defined as: $ ($100,000 annually).<br />
140
Appendix A. <strong>Action</strong>s Matrix Timeline Order<br />
Biodiversity, Tree Canopy, and Food Continued<br />
<strong>Action</strong>s Timeline* Cost**<br />
B 8. Develop programs and incentives to encourage conversion of vacant lots and community spaces to community<br />
gardens and of “street yards” to native wildflower and plant gardens. Work with HOAs, more specifically the Reunion Medium $$ - $$$<br />
Metro District, nonprofits, and landowners to implement and publicize programs.<br />
B 12. Develop an incentive program <strong>for</strong> and work with residential neighborhoods and neighborhood associations to install<br />
permaculture landscaping within communities.<br />
Medium $$ - $$$<br />
B 16. Fund research to analyze impact of fungal species that can remediate pollution. Medium $$<br />
B 1. Expand and maintain publicly managed street trees, and tree planting and tree scale programs. Explore development<br />
of an incentive program to plant two trees <strong>for</strong> every removed tree. Develop <strong>City</strong> goals and policies to drive strategic<br />
Long $$ - $$$<br />
purchases of land that add to existing green spaces and do not increase maintenance burdens on parks staff.<br />
B 3. Work with Denver International Airport to implement a program planting a new tree <strong>for</strong> every new flight added. Long $$ - $$$<br />
B 6. Develop a program and/or campaign to help residents donate trees to one another. Long $$ - $$$<br />
B 7. Adopt and encourage the “No Lawn” movement and remove grass on <strong>City</strong> properties to lead by example. Long $$ - $$$<br />
B 13. Develop incentive & edu. programs to encourage use of natural weed killers & pesticides on residential properties. Long $$ - $$$<br />
B 14. Conduct an infill inventory to identify optimal opportunities <strong>for</strong> both development and green space. Long $$<br />
B 15. Implement <strong>City</strong> buy back program to purchase and restore polluted Superfund and brownfield sites and repurpose<br />
them <strong>for</strong> appropriate and safe uses, including community gardens.<br />
Long $$<br />
B 17. Encourage xeriscape projects on <strong>City</strong> owned properties and promote xeriscaping with developers. Long $$<br />
B 19. Launch community campaign to remove invasive species. Long $$<br />
B 20. Amend ordinance to require mulching/composting to enrich soil. Long $$<br />
B 21. Using the precautionary principle, pass ordinance banning glyphosates (and neonicotinoids) near any sole source<br />
drinking water aquifers.<br />
Long $$<br />
B 22. Promote the use of less toxic chemicals throughout the community. Long $$<br />
B 23. Work with Facilities & Parks depts. to develop a soil health monitoring prgm. to sample soils around the <strong>City</strong>. Long $$<br />
*Implementation timeline is defined as: Short (next 1-2 years); Medium (next 3-5 years); and long (next 6-10 years).<br />
**Estimated costs are defined as: $ ($100,000 annually).<br />
141
Appendix B. AQ and WQ<br />
Technical Documents<br />
October 1, 2021<br />
<strong>Commerce</strong> <strong>City</strong> Community-Wide Impacts Report<br />
<strong>City</strong> of <strong>Commerce</strong> <strong>City</strong><br />
7887 East 60th Avenue<br />
<strong>Commerce</strong> <strong>City</strong>, Colorado<br />
Prepared <strong>for</strong>:<br />
<strong>City</strong> of <strong>Commerce</strong> <strong>City</strong><br />
7887 East 60th Avenue<br />
<strong>Commerce</strong> <strong>City</strong>, CO 80022<br />
Pinyon Project No.:<br />
1/21-1435-01<br />
142
October 1, 2021<br />
<strong>Commerce</strong> <strong>City</strong> Community-Wide Impacts Report<br />
<strong>City</strong> of <strong>Commerce</strong> <strong>City</strong><br />
7887 East 60th Avenue<br />
<strong>Commerce</strong> <strong>City</strong>, Colorado<br />
Prepared <strong>for</strong>:<br />
<strong>City</strong> of <strong>Commerce</strong> <strong>City</strong><br />
7887 East 60th Avenue<br />
<strong>Commerce</strong> <strong>City</strong>, CO 80022<br />
Pinyon Project No.:<br />
1/21-1435-01<br />
Prepared by:<br />
_________________________<br />
Anthony Der Tatevasion<br />
Air Quality Specialist<br />
Reviewed by:<br />
_________________________<br />
Kaitlin Meszaros<br />
Air Quality Specialist<br />
143<br />
_________________________<br />
Dustin Collins<br />
Technical Group Manager Air Quality and Noise
Table of Contents<br />
Executive Summary ..................................................................................................................................................................... 1<br />
1. Introduction ......................................................................................................................................................................... 2<br />
1.1 Study Area ................................................................................................................................................................ 2<br />
1.2 Source Types ........................................................................................................................................................... 3<br />
1.3 Air Permit Thresholds .......................................................................................................................................... 3<br />
2. Summarizing and Interpreting Data ............................................................................................................................... 7<br />
2.1 Source Emissions Data from Air Permits ......................................................................................................... 7<br />
2.2 Source Emissions Data from Well Records .................................................................................................... 7<br />
3. Mobile Sources .................................................................................................................................................................... 8<br />
3.1 Interstate 270 .......................................................................................................................................................... 8<br />
3.2 State Highway 265 ................................................................................................................................................. 8<br />
3.3 Interstate 76 ............................................................................................................................................................ 8<br />
4. National Ambient Air Quality Standards (NAAQS) .................................................................................................. 9<br />
5. Nitrogen Oxides (NO x ) ..................................................................................................................................................10<br />
5.1 NO x Health Concerns ........................................................................................................................................10<br />
5.2 Summary of NO x Emissions ...............................................................................................................................10<br />
5.3 Sources of NO x Emissions..................................................................................................................................11<br />
5.4 Locations of NO x Emissions ..............................................................................................................................11<br />
5.5 Breakdown of NO x Emissions ...........................................................................................................................12<br />
6. Carbon Monoxide (CO) .................................................................................................................................................14<br />
6.1 CO Health Concerns ..........................................................................................................................................14<br />
6.2 Summary of CO Emissions ................................................................................................................................14<br />
6.3 Sources of CO Emissions ...................................................................................................................................15<br />
6.4 Locations of CO Emissions ................................................................................................................................15<br />
6.5 Breakdown of CO Emissions ............................................................................................................................16<br />
7. Volatile Organic Compounds (VOCs) ........................................................................................................................18<br />
7.1 VOC Health Concerns .......................................................................................................................................18<br />
7.2 Summary of VOC Emissions .............................................................................................................................18<br />
7.3 Sources of VOC Emissions ................................................................................................................................19<br />
7.4 Locations of VOC Emissions .............................................................................................................................19<br />
7.5 Breakdown of VOC Emissions..........................................................................................................................20<br />
8. Sulfur Dioxide (SO 2 ) ........................................................................................................................................................22<br />
8.1 SO 2 Health Concerns ..........................................................................................................................................22<br />
<strong>City</strong> of <strong>Commerce</strong> <strong>City</strong><br />
Community-Wide Impacts Report<br />
7887 East 60 th Ave, <strong>Commerce</strong> <strong>City</strong>, CO 80022 Page i<br />
144
8.2 Summary of SO 2 Emissions ................................................................................................................................22<br />
8.3 Sources of SO 2 Emissions...................................................................................................................................23<br />
8.4 Locations of SO 2 Emissions ...............................................................................................................................23<br />
8.5 Breakdown of SO 2 Emissions ............................................................................................................................24<br />
9. Particulate Matter less than 10 micrometers in diameter (PM 10 ) ........................................................................26<br />
9.1 PM 10 Health Concerns ........................................................................................................................................26<br />
9.2 Summary of PM 10 Emissions...............................................................................................................................26<br />
9.3 Sources of PM 10 Emissions .................................................................................................................................27<br />
9.4 Locations of PM 10 Emissions ..............................................................................................................................27<br />
9.5 Breakdown of PM 10 Emissions ...........................................................................................................................28<br />
10. Particulate Matter less than 2.5 micrometers in diameter (PM 2.5 ).......................................................................30<br />
10.1 PM 2.5 Health Concerns ........................................................................................................................................30<br />
10.2 Summary of PM 2.5 Emissions ..............................................................................................................................30<br />
10.3 Sources of PM 2.5 Emissions ................................................................................................................................31<br />
10.4 Locations of PM 2.5 Emissions .............................................................................................................................31<br />
10.5 Breakdown of PM 2.5 Emissions ..........................................................................................................................32<br />
11. Total Hazardous Air Pollutants (HAPs)......................................................................................................................34<br />
11.1 Total HAPs Health Concerns ...........................................................................................................................34<br />
11.2 Summary of Total HAPs Emissions ..................................................................................................................34<br />
11.3 Sources of Total HAPs Emissions ....................................................................................................................35<br />
11.4 Locations of Total HAPs Emissions .................................................................................................................35<br />
11.5 Breakdown of Total HAPs Emissions ..............................................................................................................36<br />
12. Methane (CH 4 )..................................................................................................................................................................38<br />
13. Interactive Story Map ......................................................................................................................................................39<br />
14. Data Gaps ...........................................................................................................................................................................40<br />
15. References ..........................................................................................................................................................................41<br />
Tables<br />
Table 1-1 CDPHE Air Permit Thresholds ........................................................................................................................ 4<br />
Table 5-1 Ten (10) Highest Sources of NO x Emissions ..............................................................................................10<br />
Table 5-2 NO x Emissions Percentage of <strong>Commerce</strong> <strong>City</strong> in County and State Regions ....................................12<br />
Table 6-1 Ten (10) Highest Sources of CO Emissions ................................................................................................14<br />
Table 6-2 CO Emissions Percentage of <strong>Commerce</strong> <strong>City</strong> in County and State Regions .....................................16<br />
<strong>City</strong> of <strong>Commerce</strong> <strong>City</strong><br />
Community-Wide Impacts Report<br />
7887 East 60 th Ave, <strong>Commerce</strong> <strong>City</strong>, CO 80022 Page ii<br />
145
Table 7-1 Ten (10) Highest Sources of VOC Emissions .............................................................................................18<br />
Table 7-2<br />
VOC Emissions Percentage of <strong>Commerce</strong> <strong>City</strong> in County and State Regions...................................20<br />
Table 8-1 Ten (10) Highest Sources of SO 2 Emissions ................................................................................................22<br />
Table 8-2 SO 2 Emissions Percentage of <strong>Commerce</strong> <strong>City</strong> in County and State Regions .....................................24<br />
Table 9-1 Ten (10) Highest Sources of PM 10 Emissions ..............................................................................................26<br />
Table 9-2 PM 10 Emissions Percentage of <strong>Commerce</strong> <strong>City</strong> in County and State Regions ....................................28<br />
Table 10-1 Ten (10) Highest Sources of PM 2.5 Emissions ..............................................................................................30<br />
Table 10-2 PM 2.5 Emissions Percentage of <strong>Commerce</strong> <strong>City</strong> in County and State Regions ...................................32<br />
Table 11-1 Ten (10) Highest Sources of Total HAPs Emissions .................................................................................34<br />
Table 11-2 Total HAPs Emissions Percentage of <strong>Commerce</strong> <strong>City</strong> in County and State Regions .......................36<br />
Figures<br />
Figure 1<br />
Figure 2<br />
Figure 3<br />
Figure 4<br />
Figure 5<br />
Figure 6<br />
Figure 7<br />
Figure 8<br />
Study Area<br />
Facility NO x Emissions<br />
Facility CO Emissions<br />
Facility VOC Emissions<br />
Facility SO 2 Emissions<br />
Facility PM 10 Emissions<br />
Facility PM 2.5 Emissions<br />
Facility Total HAPs Emissions<br />
Appendices<br />
Appendix A.<br />
Appendix B.<br />
Appendix C.<br />
Appendix D.<br />
Appendix E.<br />
Appendix F.<br />
Appendix G.<br />
Nitrogen Oxides (NOx) Emissions Summary<br />
Carbon Monoxide (CO) Emissions Summary<br />
Volatile Organic Compounds (VOCs) Emissions Summary<br />
Sulfur Dioxide (SO 2 ) Emissions Summary<br />
Particulate Matter less than 10 micrometers in diameter (PM 10 ) Emissions Summary<br />
Particulate Matter less than 2.5 micrometers in diameter (PM 2.5 ) Emissions Summary<br />
Total Hazardous Air Pollutants (HAPs) Emissions Summary<br />
<strong>City</strong> of <strong>Commerce</strong> <strong>City</strong><br />
Community-Wide Impacts Report<br />
7887 East 60 th Ave, <strong>Commerce</strong> <strong>City</strong>, CO 80022 Page iii<br />
146
Revision History<br />
Version Editor Date Discussion<br />
0<br />
1<br />
Pinyon<br />
Environmental, Inc.<br />
Pinyon<br />
Environmental, Inc.<br />
July 9, 2021<br />
October 1, 2021<br />
First Version<br />
Updated report to incorporate review<br />
comments made by Domenic Martinelli of<br />
<strong>Commerce</strong> <strong>City</strong>.<br />
<strong>City</strong> of <strong>Commerce</strong> <strong>City</strong><br />
Community-Wide Impacts Report<br />
7887 East 60 th Ave, <strong>Commerce</strong> <strong>City</strong>, CO 80022 Page iv<br />
147
Revision History<br />
Version Editor Date Discussion<br />
0<br />
1<br />
Pinyon<br />
Environmental, Inc.<br />
Pinyon<br />
Environmental, Inc.<br />
July 9, 2021<br />
October 1, 2021<br />
First Version<br />
Updated report to incorporate review<br />
comments made by Domenic Martinelli of<br />
<strong>Commerce</strong> <strong>City</strong>.<br />
<strong>City</strong> of <strong>Commerce</strong> <strong>City</strong><br />
Community-Wide Impacts Report<br />
7887 East 60 th Ave, <strong>Commerce</strong> <strong>City</strong>, CO 80022 Page iv<br />
148
Executive Summary<br />
Pinyon Environmental, Inc. (Pinyon) prepared this community-wide impacts report <strong>for</strong> the <strong>City</strong> of <strong>Commerce</strong><br />
<strong>City</strong> (<strong>Commerce</strong> <strong>City</strong>). This report provides a comprehensive summary involving air pollutant data collected<br />
in and within a ½ mile radius of <strong>Commerce</strong> <strong>City</strong>. Data were acquired from active air permits issued by the<br />
Colorado Department of Public Health (CDPHE) Air Pollution Control Division (APCD), in addition to oil and<br />
gas wells in operation reported by the Colorado Oil and Gas Conservation Commission (COGCC). The<br />
purpose of this report, including associated tables, figures, and online Story Map (see Section 12), is to provide<br />
air pollutant source data to <strong>Commerce</strong> <strong>City</strong> personnel and to in<strong>for</strong>m the public on types, amounts, and<br />
locations of air pollutant sources.<br />
Pinyon acquired air pollutant source data, including but not limited to the following CDPHE-classified source<br />
types:<br />
<br />
<br />
<br />
<br />
<br />
petroleum refining and related industries,<br />
food and kindred products,<br />
electric gas and sanitary services (e.g., landfills and sewage systems),<br />
oil and gas extraction and related services (e.g., terminals and storage facilities), and<br />
other industrial services (e.g., manufacturing plants, gas stations, auto repair shops, emergency power<br />
generation, etc.).<br />
Pinyon created tables, figures, and an online story map organizing the data from active air permits on file with<br />
APCD. Facility locations where there is the potential to emit a specific pollutant can be found in Figures 2<br />
through 8. Appendices A through G provide the same emissions data in a tabulated <strong>for</strong>mat <strong>for</strong> the following<br />
air pollutants:<br />
<br />
<br />
<br />
<br />
<br />
<br />
<br />
Nitrogen Oxides (NO x ) – criteria pollutant<br />
Carbon Monoxide (CO) – criteria pollutant<br />
Volatile Organic Compounds (VOCs) – regulated pollutant<br />
Sulfur Dioxide (SO 2 ) – criteria pollutant<br />
Particulate Matter less than 10 micrometers in diameter (PM 10 ) – criteria pollutant<br />
Particulate Matter less than 2.5 micrometers in diameter (PM 2.5 ) – criteria pollutant<br />
Total Hazardous Air Pollutants (HAPs) – toxic air pollutants<br />
<strong>City</strong> of <strong>Commerce</strong> <strong>City</strong><br />
<strong>Commerce</strong> <strong>City</strong> Community-Wide Impacts Report<br />
7887 East 60 th Ave, <strong>Commerce</strong> <strong>City</strong>, Colorado Page 1<br />
149
1. Introduction<br />
Pinyon prepared this community-wide impacts report <strong>for</strong> <strong>Commerce</strong> <strong>City</strong>. The report includes a summary of<br />
sources emitting pollutants in and within a ½ mile radius around <strong>Commerce</strong> <strong>City</strong> (Figure 1) to in<strong>for</strong>m the<br />
public of pollutants recognized by the U.S. Environmental Protection Agency (U.S. EPA). The eight (8) air<br />
pollutants discussed and analyzed in this report include Nitrogen Oxides (NO x ), Carbon Monoxide (CO),<br />
Volatile Organic Compounds (VOCs), Sulfur Dioxide (SO 2 ), Particulate Matter less than 10 micrometers in<br />
diameter (PM 10 ), Particulate Matter less than 2.5 micrometers in diameter (PM 2.5 ), and Total Hazardous Air<br />
Pollutants (HAPs).<br />
Pinyon compiled emission source data in and within a ½ mile radius around <strong>Commerce</strong> <strong>City</strong> from current air<br />
permit in<strong>for</strong>mation maintained by APCD and existing oil and gas wells in operation reported by COGCC.<br />
Pinyon did not evaluate mobile and non-road, and on-road sources of pollution such as vehicle exhaust, tractortrailers,<br />
lawnmowers, wood-burning fires, etc., as these are not stationary sources that require any sort of<br />
documentation of emissions. For additional in<strong>for</strong>mation on mobile source pollution and related health effects,<br />
you can visit the following link: https://www.epa.gov/mobile-source-pollution. In<strong>for</strong>mation on CDPHE APCD<br />
air permit requirements can be found in Section 1.3 of this report.<br />
A complete list of the specific facilities <strong>for</strong> which there are estimated actual annual emissions from the listed<br />
air pollutants discussed in this report is further analyzed in Section 2, and the pollutant-specific tables are<br />
included as appendices. Pinyon's approach to gathering data presented in this report involved the following:<br />
1. Extracting numerical data, in<strong>for</strong>mation, and air pollutant emissions by source type from sources of<br />
emissions reported and issued air permits by APCD.<br />
2. Verification of the operational status of oil and gas wells per current well in<strong>for</strong>mation reported by<br />
COGCC.<br />
3. Transcription of data into a master table <strong>for</strong> each pollutant type; recording source names, source<br />
descriptions, source locations, and total estimated actual annual emissions in tons per year (tons/yr)<br />
by the facility.<br />
4. Facility locations of collected emissions data were georeferenced, and maps were created <strong>for</strong> the<br />
graphic presentation of emissions data.<br />
1.1 Study Area<br />
<strong>Commerce</strong> <strong>City</strong> is a municipality located north of Denver within Adams County and comprises, amongst other<br />
things, houses, parks, industrial businesses, and highways. Industries of note in the area include petroleum<br />
refineries, oil and gas well production facilities, landfills, and electricity-generating plants, among others. As of<br />
2021, <strong>Commerce</strong> <strong>City</strong> has an estimated population of 64,612 people (<strong>Commerce</strong> <strong>City</strong> Community<br />
Development Department, 2021).<br />
Notable emitters of air pollution in and within a ½ mile radius around <strong>Commerce</strong> <strong>City</strong> include but are not<br />
limited to:<br />
<br />
<br />
Suncor Energy – Denver Petroleum Refinery<br />
Public Service Co. – Cherokee Electrical Generation <strong>Plan</strong>t<br />
<strong>City</strong> of <strong>Commerce</strong> <strong>City</strong><br />
<strong>Commerce</strong> <strong>City</strong> Community-Wide Impacts Report<br />
7887 East 60 th Ave, <strong>Commerce</strong> <strong>City</strong>, Colorado Page 2<br />
150
Allied Waste Systems – Tower Landfill<br />
Ardent Mills – <strong>Commerce</strong> <strong>City</strong> Flour Mill<br />
Oil and Gas – Well Production Facilities<br />
1.2 Source Types<br />
One hundred fifty-four (154) unique sources of air pollution have been collected and analyzed within the study<br />
area. This community-wide impacts report is divided into the following source categories: petroleum refining<br />
and related industries, electric and sanitary services, oil and gas extraction, food and kindred products, and<br />
other industrial manufacturing services. Source classification <strong>for</strong> each source of emissions represented in this<br />
report was chosen by the owner/operator using the North American Industry Classification System (NAICS)<br />
and confirmed by APCD be<strong>for</strong>e permitting issuance. Pinyon chose the following source classification<br />
breakdown to highlight the variety of industries present within the study area and does not necessarily indicate<br />
that emissions originating from one source or industry have a more significant impact on public health than<br />
another.<br />
Sources of air pollution in and within a ½ mile radius around <strong>Commerce</strong> <strong>City</strong> were separated into the following<br />
overarching source types and included but is not limited to:<br />
<br />
<br />
<br />
<br />
<br />
Petroleum Refining and Related Industries: refining, blending of lubricants and glycol, recycle plants, asphalt<br />
batch plants, asphalt paving, liquid asphalt blending, storage, and distribution, and hot mix asphalt plants<br />
Electric Gas and Sanitary Services: power generation plants, sewage systems, landfills, and water supply<br />
Oil and Gas Extraction and Related Services: well production facilities, petroleum products storage,<br />
distribution pipelines, and operation of vapor control equipment<br />
Food and Kindred Products: animal feed manufacturing facilities, flour mills, bread and bun bakeries, milk<br />
plants, and the operation of grain elevators<br />
Other Industrial Sources: bakeries, concrete manufacturing plants, retail gas stations, convenience stores,<br />
industrial laundry facilities, cremation facilities, millwork operations, corrugated paper products<br />
manufacturing, waste management facilities, government facilities, auto body repair shops, etc.<br />
1.3 Air Permit Thresholds<br />
CDPHE Regulation 3 outlines the applicability and requirements <strong>for</strong> stationary source permits and Air Pollution<br />
Emission Notice (APEN). Certain facilities and emissions sources are exempt from APEN and permit<br />
requirements based on their purpose, agency-determined emissions impact, and size. Should an emissions<br />
source not fall into one of the 84 listed exempted sources, APEN and permit applicability to depend on<br />
emissions from criteria and non-criteria reportable pollutants such as those addressed in this report.<br />
Regulation 3 Section II.B.3 states that APENs are required if any of the following conditions are met (CDPHE,<br />
2021):<br />
<br />
For nonattainment areas, each emissions point with actual uncontrolled emissions of one ton per year or<br />
more of any individual regulated pollutant <strong>for</strong> which the area is nonattainment<br />
<strong>City</strong> of <strong>Commerce</strong> <strong>City</strong><br />
<strong>Commerce</strong> <strong>City</strong> Community-Wide Impacts Report<br />
7887 East 60 th Ave, <strong>Commerce</strong> <strong>City</strong>, Colorado Page 3<br />
151
For attainment areas, each emissions point in an attainment or attainment/maintenance area with actual<br />
uncontrolled emissions of two tons per year or more of any individual criteria pollutant<br />
Each emissions point with actual uncontrolled emissions of lead greater than 100 pounds per year<br />
Each emissions point with actual uncontrolled emissions of 250 pounds or more per year of any noncriteria<br />
reportable pollutant (regulated pollutant with emission limits but no National Ambient Air Quality<br />
Standards, NAAQS)<br />
Regulation 3 Section II.D.2 and Section II.D.3 states that construction permits are required if total facility<br />
uncontrolled actual emissions equal or exceed the following thresholds depending on if the facility is located in<br />
a nonattainment or attainment/maintenance area (Table 1-1):<br />
Table 1-1. CDPHE Air Permit Thresholds<br />
Pollutant<br />
Nonattainment Area<br />
Permit Threshold 1<br />
Attainment Area<br />
Permit Threshold<br />
Number of Facilities<br />
(Per Pollutant)<br />
Subject to Permit<br />
Requirements<br />
NO x 5 tons per year 10 tons per year 11<br />
CO 5 tons per year 10 tons per year 15<br />
VOC 2 tons per year 5 tons per year 64<br />
PM 10 1 ton per year 5 tons per year 34<br />
PM 2.5 1 ton per year 5 tons per year 24<br />
TSP 5 tons per year 10 tons per year Not Applicable<br />
SO 2 5 tons per year 10 tons per year 5<br />
Lead 200 pounds per year 200 pounds per year Not Applicable<br />
1.<br />
Nonattainment is a geographic area that does not meet NAAQS established by the Clean Air Act and<br />
en<strong>for</strong>ced by U.S. EPA.<br />
Regulation 3 Section I.B.25 states that sources that meet the definition of Major Source are subject to the<br />
operating permit program. The following stationary sources are major sources (CDPHE, 2021):<br />
<br />
<br />
<br />
<br />
Sources that directly emit, or have the potential to emit, 10 tons per year or more any single hazardous<br />
air pollutant or 25 tons per year or more of any combination of hazardous air pollutants.<br />
Sources that directly emit, or have the potential to emit, 100 tons per year or more of any pollutant subject<br />
to regulation.<br />
Sources subject to the Acid Rain Program.<br />
Sources that are subject to specific New Source Per<strong>for</strong>mance Standards or National Emission Standards<br />
<strong>for</strong> Hazardous Air Pollutants (e.g., landfills that are affected facilities under NSPS Subpart WWW).<br />
<strong>City</strong> of <strong>Commerce</strong> <strong>City</strong><br />
<strong>Commerce</strong> <strong>City</strong> Community-Wide Impacts Report<br />
7887 East 60 th Ave, <strong>Commerce</strong> <strong>City</strong>, Colorado Page 4<br />
152
Sources that meet the definition of Major Stationary Source in Colorado Regulation No. 3, Part D, Section<br />
II.A.25.<br />
<strong>Commerce</strong> <strong>City</strong> is located in the Denver Metro/North Front Range ozone nonattainment area, which was<br />
classified as a serious nonattainment area effective January 27, 2020 (U.S. EPA, 2021a). Ozone is a secondary<br />
pollutant that is <strong>for</strong>med by NOx and VOC emissions in the atmosphere. As a result, the major stationary<br />
source thresholds <strong>for</strong> NOx and VOC are lower than those in other areas. Specifically, a source that emits or<br />
has the potential to emit 50 tons per year or more of NOx or 50 tons per year or more of VOC is a major<br />
stationary source and is there<strong>for</strong>e subject to the operating permit program.<br />
Please note not all sources of pollution are required to obtain an air permit. For example, sources that emit<br />
pollution at rates less than the above thresholds are not required to obtain a permit. Additionally, permit<br />
requirements can change, affecting the eligibility of sources presented in this report from reporting emissions<br />
in the future or requiring new emissions sources to obtain a permit. Because of those limitations, it's possible<br />
minimal emission sources were not identified in our searches and thus are not included in this report.<br />
<strong>City</strong> of <strong>Commerce</strong> <strong>City</strong><br />
<strong>Commerce</strong> <strong>City</strong> Community-Wide Impacts Report<br />
7887 East 60 th Ave, <strong>Commerce</strong> <strong>City</strong>, Colorado Page 5<br />
153
Figure 1.<br />
Study Area<br />
<strong>City</strong> of <strong>Commerce</strong> <strong>City</strong><br />
<strong>Commerce</strong> <strong>City</strong> Community-Wide Impacts Report<br />
7887 East 60 th Ave, <strong>Commerce</strong> <strong>City</strong>, Colorado Page 6<br />
154
2. Summarizing and Interpreting Data<br />
Pinyon utilized data from several regulatory agencies in Colorado to prepare this community-wide impacts<br />
report <strong>for</strong> <strong>Commerce</strong> <strong>City</strong>. First, Pinyon extrapolated source data from active air permits on file with APCD<br />
and per<strong>for</strong>med a data check <strong>for</strong> red flags and inconsistencies. Second, Pinyon identified oil and gas wells from<br />
well completion records on file with COGCC, including confirmation of their current operating status and<br />
discussions with <strong>Commerce</strong> <strong>City</strong> personnel. Finally, emissions source data in the study area were compared to<br />
nearby county total emissions estimates and state-wide total emissions estimates to provide insight into how<br />
air quality emissions within the study area compared to the remainder of Colorado.<br />
Pinyon has extracted and consolidated NO x , CO, VOC, SO 2 , PM 10 , PM 2.5 , and Total HAPs data from active air<br />
permits. These data have been summarized into the following <strong>for</strong>mats: tables, raw data transcribed into a<br />
master spreadsheet in Microsoft Excel; report figures; and an Arc GIS story map with interactive features.<br />
2.1 Source Emissions Data from Air Permits<br />
Numerous air pollutant source data have been collected in the study area released by APCD. Source emissions<br />
locations have been separated by pollutant type listed in Appendix A through G and illustrated in Figures 2<br />
through 8. Source emissions rates extracted from each permit are represented as the estimated total actual<br />
emissions of each source. Please note air permits on file with APCD must complete a routine five (5) year<br />
renewal <strong>for</strong> an existing permitted source or report minor changes in emissions, production, or equipment by<br />
the following April after the change. There<strong>for</strong>e, it is possible emissions estimates represented in this report<br />
have changed and are currently applying <strong>for</strong> an updated, modified, or renewal air permit.<br />
Pinyon received data of source emissions rates from all active air permits on file with the APCD <strong>for</strong> the air<br />
pollutants specified in this report. Air permits present emissions data as an annual rate, generally in tons/yr<br />
units. Data was reviewed and compiled into tables based on pollutant type, source type, source description,<br />
and source total emissions rates in tons/yr. Emissions rates are represented from highest to lowest annual<br />
emissions in tons/yr. The top ten highest sources of emissions are represented in tables within each pollutantspecific<br />
section of this report.<br />
It is possible that a facility exceeded the construction and/or APEN threshold <strong>for</strong> one pollutant and not another.<br />
There<strong>for</strong>e, only the estimated actual emissions totals presented in this report and filed with APCD are <strong>for</strong><br />
sources and pollutants that require an APEN and/or permit. For example, several industrial facilities presented<br />
in this report did not exceed nonattainment permit thresholds <strong>for</strong> NO x or CO. Still, they did <strong>for</strong> PM 10 and<br />
PM 2.5 , and thus those facilities were required to obtain a permit, and all pollutant emissions were then reported.<br />
2.2 Source Emissions Data from Well Records<br />
Sources originating from oil and gas wells located within the study area were individually found in COGCC<br />
well site records to verify operational status. The oil and gas wells analyzed in this report are all currently<br />
"shut-in." The COGCC defines a shut-in well as "a well which is capable of producing but is not presently<br />
producing" (COGCC, n.d.). These wells are not actively producing product due to various factors, including a<br />
lack of a sustainable market, a lack of facilities to produce the product, or other cases defined within the shutin<br />
provisions contained in the oil and gas lease. Although there are no actively producing wells located in the<br />
study area, Pinyon has chosen to include associated emissions in the pollutant totals due to these wells ability<br />
to begin producing oil and gas products again at any time.<br />
<strong>City</strong> of <strong>Commerce</strong> <strong>City</strong><br />
<strong>Commerce</strong> <strong>City</strong> Community-Wide Impacts Report<br />
7887 East 60 th Ave, <strong>Commerce</strong> <strong>City</strong>, Colorado Page 7<br />
155
3. Mobile Sources<br />
The U.S. EPA has classified mobile sources of air pollution to include vehicles, engines, and equipment, that can<br />
be categorized as either on-road mobile sources (e.g., heavy-duty trucks, buses, passenger cars, and<br />
motorcycles) or non-road mobile sources (e.g., locomotives, marine vessels, construction equipment, lawn,<br />
garden, and snow equipment, personal recreation equipment, etc.) (U.S. EPA, 2020). Emissions associated with<br />
mobile sources include combustion pollutants such as CO and NO X which can contribute to ozone <strong>for</strong>mation.<br />
Additionally, vehicle exhaust emissions can be a source of particulate matter. A list of major roadways within<br />
the study area has been identified below, and an overview of vehicle miles traveled (VMT) and proximity to<br />
concentrated areas of pollutants.<br />
3.1 Interstate 270<br />
Interstate 270 (I-270) is a 7-mile-long highway in the northeastern portion of the Denver Metropolitan Area.<br />
I-270 enters <strong>Commerce</strong> <strong>City</strong>, where the highway crosses over the South Platte River and exits <strong>Commerce</strong><br />
<strong>City</strong> shortly be<strong>for</strong>e intersecting with Quebec St <strong>for</strong> a total expanse of 3.5-miles within the city limits. I-270 is<br />
within the immediate vicinity of clusters of emission sources indicated by a green box within the individual<br />
figures <strong>for</strong> the pollutants identified in Sections 5-11. Based on the proximity of I-270 and the cluster of emissions<br />
sources, emissions from on-road vehicles traveling on I-270 may result in heightened impacts with the southern<br />
area of <strong>Commerce</strong> <strong>City</strong>. According to the Colorado Department of Transportation, the annual average daily<br />
VMT on I-270 is 521,309 (CDOT 2021).<br />
3.2 State Highway 265<br />
Colorado State Highway 265 (SH 265) is a 3.6-mile-long highway in the northeastern portion of the Denver<br />
Metropolitan Area. SH 265 enters <strong>Commerce</strong> <strong>City</strong>, where the highway meets York Street and ends at the<br />
intersection of U.S. Route 6 (US 6) and US 85 in <strong>Commerce</strong> <strong>City</strong> <strong>for</strong> a total expanse of approximately 2.4-<br />
miles within the city limits. SH 265 is within the immediate vicinity of clusters of emission sources indicated by<br />
a green and a blue box within the individual figures <strong>for</strong> the pollutants identified in Sections 5-11. Based on the<br />
proximity of SH 265 and the cluster of emissions sources, emissions from on-road vehicles traveling on SH 265<br />
may result in heightened impacts along the southern and western areas of <strong>Commerce</strong> <strong>City</strong>. According to the<br />
Colorado Department of Transportation, the annual average daily VMT on SH-265 is 15,363 (CDOT 2021).<br />
3.3 Interstate 76<br />
Interstate 76 (I-76) is a 187-mile highway spanning from Arvada, Colorado, to Big Springs, Nebraska. From the<br />
intersection of I-76 and I-270 in the Denver Metropolitan Area, I-76 travels parallel and at specific points<br />
through the western boundary of <strong>Commerce</strong> <strong>City</strong>, ending at the junction with Colorado State Highway 470<br />
<strong>for</strong> a total expanse of approximately 12.1-miles. I-76 is within the immediate vicinity of clusters of emission<br />
sources indicated by a green and a blue box within the individual figures <strong>for</strong> the pollutants identified in Sections<br />
5-11. Based on the proximity of I-76 and the emissions sources, emissions from on-road vehicles traveling on<br />
I-76 may result in heightened impacts along the western boundary of <strong>Commerce</strong> <strong>City</strong>. According to the<br />
Colorado Department of Transportation, the annual average daily VMT on I-76 from the intersection with I-<br />
270 and ending at the junction with SH 470 is 621,462 (CDOT 2021).<br />
<strong>City</strong> of <strong>Commerce</strong> <strong>City</strong><br />
<strong>Commerce</strong> <strong>City</strong> Community-Wide Impacts Report<br />
7887 East 60 th Ave, <strong>Commerce</strong> <strong>City</strong>, Colorado Page 8<br />
156
4. National Ambient Air Quality Standards (NAAQS)<br />
The U.S. EPA, through the CAA, regulates air pollution in an ef<strong>for</strong>t to protect public health. CAA regulations<br />
require stationary and mobile sources to determine their potential to emit as part of the state and federal<br />
permitting process, applicability to federal regulations, and evaluation of control technologies. As part of the<br />
CAA, U.S. EPA was required to set NAAQS <strong>for</strong> six (6) criteria pollutants that can be harmful to public health<br />
and the environment:<br />
<br />
<br />
Carbon Monoxide (CO),<br />
Lead (Pb),<br />
Nitrogen Dioxide (NO 2 ) (a subset of NO x ),<br />
Ozone (O 3 ),<br />
<br />
Particle Pollution (PM), and<br />
Sulfur Dioxide (SO 2 ).<br />
The CAA identifies two types of national ambient air quality standards. Primary standards provide “public health<br />
protection, including protecting the health of “sensitive” populations such as asthmatics, children, and the<br />
elderly” (U.S. EPA, 2021b). Secondary standards proved “public welfare protection, including protection against<br />
decreased visibility and damage to animals, crops, vegetation, and buildings” (U.S. EPA, 2021b). The primary<br />
and secondary NAAQS are concentrations where exceedances of the NAAQS values are a signal that public<br />
and environmental health is at risk. The NAAQS values that are generally in the units of parts per million (ppm),<br />
parts per billion (ppb), or micrograms per cubic meter (µg/m 3 ) Periodically, the standards are reviewed and<br />
may undergo revision, establishing new standards.<br />
Monitoring data provide ambient air concentrations that can be directly correlated to the NAAQS to determine<br />
attainment status <strong>for</strong> a specific area. Colorado has a number of ambient air monitors in the eight (8) monitoring<br />
regions defined by CDPHE APCD in its air monitoring network (CDPHE, 2020). All criteria pollutants are<br />
monitored except <strong>for</strong> lead due to the cessation of the La Casa monitor after numerous years of low<br />
concentrations. The emissions data presented in this community-wide impacts report are an integral part of<br />
the translation to ambient air concentrations; however, emissions are not a direct indication of ambient air<br />
concentration levels. Meteorological data, emission source dispersion parameters, and terrain characteristics<br />
are also in<strong>for</strong>mative and essential factors to determine potential public health impacts and compliance with<br />
primary and secondary NAAQS.<br />
<strong>City</strong> of <strong>Commerce</strong> <strong>City</strong><br />
<strong>Commerce</strong> <strong>City</strong> Community-Wide Impacts Report<br />
7887 East 60 th Ave, <strong>Commerce</strong> <strong>City</strong>, Colorado Page 9<br />
157
5. Nitrogen Oxides (NO x )<br />
Nitrogen Oxides (NO x ) are a chemical compound of oxygen and nitrogen <strong>for</strong>med during their reaction with<br />
each other when burned at high temperatures, primarily from burning fuels such as oil, diesel, and natural gas<br />
(U.S. EPA, 2016b). NO x is a common designation of nitrogen oxides NO and NO 2 . NO 2, in combination with<br />
other NO x , can react with other chemicals in the air to <strong>for</strong>m both particulate matter and ozone (U.S. EPA,<br />
2016b).<br />
5.1 NO x Health Concerns<br />
Breathing air with elevated NO x may affect individuals with respiratory conditions causing inflammation of the<br />
airways. Periods of short-term exposure to NO 2 , a subset of NOx, can "aggravate respiratory diseases,<br />
particularly asthma, leading to respiratory symptoms (such as coughing, wheezing, or difficulty breathing),<br />
hospital admissions, and visits to emergency rooms " (U.S. EPA, 2016b). Periods of long-term exposure to NO 2<br />
may contribute to the "development of asthma and potentially increase susceptibility to respiratory infections "<br />
(U.S. EPA, 2016b). The atmospheric chemistry determining how much NO x is NO 2 will be discussed in future<br />
analyses by <strong>Commerce</strong> <strong>City</strong> related to monitoring and modeling.<br />
5.2 Summary of NO x Emissions<br />
Using readily available data acquired from active APCD permits, 38 facilities have the potential to emit NO x .<br />
These 38 facilities in and within a ½ mile of <strong>Commerce</strong> <strong>City</strong> limits total 1,215 tons/yr NO x . In Table 5-1 below,<br />
the ten (10) highest emitters of estimated actual annual NO x emissions have been identified.<br />
Table 5-1. Ten (10) Highest Sources of NO x Emissions<br />
Source Name Source Description Source Location<br />
Suncor Energy – Denver<br />
Refinery<br />
Public Service Co –<br />
Cherokee Generating<br />
Station<br />
Metro Wastewater<br />
Reclamation District<br />
Allied Waste Systems –<br />
Tower Landfill<br />
Phillips 66 Pipeline – Denver<br />
Terminal<br />
Adams County Government<br />
Center<br />
Darling Ingredients Inc.<br />
Facility Estimated<br />
Actual Annual NO x<br />
(tons/yr)<br />
Petroleum Refinery 5801 Brighton Blvd 618.7<br />
Electric Power<br />
Generation<br />
Sewage Treatment<br />
Facility<br />
6198 Franklin St 383.0<br />
6450 York St 70.33<br />
Solid Waste Landfill 8480 Tower Rd 28.72<br />
Petroleum Products<br />
Storage/Distribution<br />
Emergency Power<br />
Generation<br />
Rendering <strong>Plan</strong>t (animal<br />
products)<br />
3960 E 56 th Ave 26.15<br />
4430 S Adams<br />
County Pkwy<br />
13.25<br />
5701 York St 9.08<br />
<strong>City</strong> of <strong>Commerce</strong> <strong>City</strong><br />
<strong>Commerce</strong> <strong>City</strong> Community-Wide Impacts Report<br />
7887 East 60 th Ave, <strong>Commerce</strong> <strong>City</strong>, Colorado Page 10<br />
158
Source Name Source Description Source Location<br />
Crystal Packaging<br />
Aggregate Industries –<br />
Dahlia <strong>Plan</strong>t<br />
Petroleum Lubricating<br />
Oil and Grease<br />
Manufacturing<br />
Facility Estimated<br />
Actual Annual NO x<br />
(tons/yr)<br />
9155 Boston St 8.75<br />
Hot Mix Asphalt <strong>Plan</strong>t 4801 E 78 th Ave 7.05<br />
Trustile Doors, LLC Millwork 1780 E 66 th Ave 5.70<br />
Source: CDPHE APCD 2021<br />
5.3 Sources of NO x Emissions<br />
Sources of NO x analyzed from data recorded in this report involve the following breakdown of industries,<br />
services, and products, including percent of total NO x emissions estimates:<br />
<br />
<br />
<br />
<br />
<br />
Seven (7) petroleum refining and related industries (53% of total source emissions)<br />
Four (4) electric gas and sanitary services (40% of total source emissions)<br />
Six (6) oil and gas extraction and related services (3% of total source emissions)<br />
Five (5) food and kindred products (1% of total source emissions)<br />
Sixteen (16) other industrial services (3% of total source emissions)<br />
5.4 Locations of NO x Emissions<br />
Locations of the 38 sources of NO x analyzed from data recorded in this report are represented in Figure 2.<br />
NO x sources located in the southern portion of the study area south of E 80 th Avenue include:<br />
<br />
<br />
<br />
<br />
<br />
Twenty-one (21) sources greater than or equal to 0.1 tons/yr and less than or equal to 5.0 tons/yr<br />
Five (5) sources greater than 5.0 tons/yr and less than or equal to 50.0 tons/yr<br />
One (1) source greater than 50.0 tons/yr and less than or equal to 100.0 tons/yr<br />
No sources greater than 100.0 tons/yr and less than or equal to 250.0 tons/yr<br />
Two (2) sources greater than 250.0 tons/yr and less than or equal to 618.7 tons/yr<br />
NO x sources along the western portion of the study area, west of Colorado State Highway 2 and north of E<br />
80 th Avenue include:<br />
<br />
Five (5) sources greater than or equal to 0.1 tons/yr and less than or equal to 5.0 tons/yr<br />
<strong>City</strong> of <strong>Commerce</strong> <strong>City</strong><br />
<strong>Commerce</strong> <strong>City</strong> Community-Wide Impacts Report<br />
7887 East 60 th Ave, <strong>Commerce</strong> <strong>City</strong>, Colorado Page 11<br />
159
One (1) source greater than 5.0 tons/yr and less than or equal to 50.0 tons/yr<br />
No sources greater than 50.0 tons/yr and less than or equal to 100.0 tons/yr<br />
No sources greater than 100.0 tons/yr and less than or equal to 250.0 tons/yr<br />
No sources greater than 250.0 tons/yr and less than or equal to 618.7 tons/yr<br />
NO x sources located along the northern and eastern portion of <strong>Commerce</strong> <strong>City</strong>, east of Colorado State<br />
Highway 2, include:<br />
<br />
<br />
<br />
<br />
<br />
One (1) source greater than or equal to 0.1 tons/yr and less than or equal to 5.0 tons/yr<br />
Two (2) sources greater than 5.0 tons/yr and less than or equal to 50.0 tons/yr<br />
No sources greater than 50.0 tons/yr and less than or equal to 100.0 tons/yr<br />
No sources greater than 100.0 tons/yr and less than or equal to 250.0 tons/yr<br />
No sources greater than 250.0 tons/yr and less than or equal to 618.7 tons/yr<br />
5.5 Breakdown of NO x Emissions<br />
Total NO x emissions estimates extrapolated from the data provided by APCD <strong>for</strong> Adams, Arapahoe, Denver,<br />
and Weld Counties, in addition to estimated actual state-wide Colorado emissions totals, are as follows:<br />
<br />
<br />
<br />
<br />
<br />
Adams County – 3,367 tons/yr<br />
Arapahoe County – 895 tons/yr<br />
Denver County – 750 tons/yr<br />
Weld County – 13,246 tons/yr<br />
State-wide estimated actual emissions totals – 61,187 tons/yr<br />
Table 5-2. NO x Emissions Percentage of <strong>Commerce</strong> <strong>City</strong> in County and State Regions<br />
NO x Emissions<br />
within Study Area<br />
Percent of Adams County<br />
Actual Emissions Totals<br />
Percent of State-Wide<br />
Actual Emissions Totals<br />
1,215 tons/yr 39% 2%<br />
Source: CDPHE APCD 2021<br />
<strong>City</strong> of <strong>Commerce</strong> <strong>City</strong><br />
<strong>Commerce</strong> <strong>City</strong> Community-Wide Impacts Report<br />
7887 East 60 th Ave, <strong>Commerce</strong> <strong>City</strong>, Colorado Page 12<br />
160
Figure 2.<br />
Facility NO x Emissions<br />
<strong>City</strong> of <strong>Commerce</strong> <strong>City</strong><br />
<strong>Commerce</strong> <strong>City</strong> Community-Wide Impacts Report<br />
7887 East 60 th Ave, <strong>Commerce</strong> <strong>City</strong>, Colorado Page 13<br />
161
6. Carbon Monoxide (CO)<br />
Carbon Monoxide (CO) is a colorless, odorless, toxic gas produced when fossil fuels (oil, coal, natural gas) are<br />
burned. The primary sources of CO released into the atmosphere occur from motor vehicles, trucks, and<br />
other vehicles or machinery that burn fossil fuels (U.S. EPA, 2016b).<br />
6.1 CO Health Concerns<br />
Breathing air with elevated CO "reduces the amount of oxygen that can be transported in the bloodstream to<br />
critical organs such as the heart and brain" (U.S. EPA, 2016b). Elevated levels of CO outdoors can be of concern<br />
<strong>for</strong> people with certain types of heart disease due to reduced ability <strong>for</strong> getting oxygenated blood to their<br />
hearts during situations such as exercising or under increased stress where the heart needs more oxygen than<br />
usual. During these situations, short-term exposure to elevated CO may "result in reduced oxygen to the heart<br />
accompanied by chest pain, also known as angina" (U.S. EPA, 2016b).<br />
6.2 Summary of CO Emissions<br />
Using readily available data acquired from active APCD permits, 41 facilities have the potential to emit CO.<br />
These 41 facilities in and within a ½ mile of <strong>Commerce</strong> <strong>City</strong> limits total 1,158 tons/yr CO. In Table 6-1 below,<br />
the ten (10) highest emitters of estimated actual annual CO emissions have been identified.<br />
Table 6-1. Ten (10) Highest Sources of CO Emissions<br />
Source Name Source Description Source Location<br />
Suncor Energy – Denver<br />
Refinery<br />
Public Service Co –<br />
Cherokee Generating Station<br />
Allied Waste Systems –<br />
Tower Landfill<br />
Phillips 66 Pipeline – Denver<br />
Terminal<br />
Metro Wastewater<br />
Reclamation District<br />
Brannan Sand & Gravel<br />
<strong>City</strong> and County of Denver -<br />
Roslyn<br />
Aggregate Industries – Dahlia<br />
<strong>Plan</strong>t<br />
Sinclair – Denver Terminal<br />
Facility Estimated<br />
Actual Annual CO<br />
(ton/year)<br />
Petroleum Refinery 5801 Brighton Blvd 494.3<br />
Electric Power<br />
Generation<br />
6198 Franklin St 315.8<br />
Solid Waste Landfill 8480 Tower Rd 102.1<br />
Petroleum Products<br />
Storage/Distribution<br />
3960 E 56 th Ave 69.86<br />
Sewage Treatment Facility 6450 York St 41.76<br />
Hot Mix Asphalt <strong>Plan</strong>t<br />
7271 Colorado<br />
Blvd<br />
27.87<br />
Government Support 5440 Roslyn St 14.20<br />
Hot Mix Asphalt <strong>Plan</strong>t 4801 E 78 th Ave 11.12<br />
Petroleum Products<br />
Storage/Distribution<br />
8581 E 96 th Ave 10.80<br />
Colorado Asphalt Services Asphalt Paving 3700 E 56 th Ave 8.87<br />
<strong>City</strong> of <strong>Commerce</strong> <strong>City</strong><br />
<strong>Commerce</strong> <strong>City</strong> Community-Wide Impacts Report<br />
7887 East 60 th Ave, <strong>Commerce</strong> <strong>City</strong>, Colorado Page 14<br />
162
Source: CDPHE APCD 2021<br />
6.3 Sources of CO Emissions<br />
Sources of CO analyzed from data recorded in this report involve the following breakdown of industries,<br />
services, and products, including percent of total CO emissions estimates:<br />
<br />
<br />
<br />
<br />
<br />
Eight (8) petroleum refining and related industries (48% of total source emissions)<br />
Four (4) electric gas and sanitary services (40% of total source emissions)<br />
Six (6) oil and gas extraction and related services (8% of total source emissions)<br />
Six (6) food and kindred products (1% of total source emissions)<br />
Seventeen (17) other industrial services (3% of total source emissions)<br />
6.4 Locations of CO Emissions<br />
Locations of the 41 sources of CO analyzed from data recorded in this report are represented in Figure 3.<br />
CO sources located in the southern portion of the study area south of E 80 th Avenue include:<br />
<br />
<br />
<br />
<br />
Twenty-five (25) sources greater than or equal to 0.004 tons/yr and less than or equal to 10.0 tons/yr<br />
Five (5) sources greater than 10.0 tons/yr and less than or equal to 100.0 tons/yr<br />
No sources greater than 100.0 tons/yr and less than or equal to 250.0 tons/yr<br />
Two (2) sources greater than 250.0 tons/yr and less than or equal to 500.0 tons/yr<br />
CO sources located along the western portion of the study area, west of Colorado State Highway 2 and north<br />
of E 80 th Avenue, include:<br />
<br />
<br />
<br />
<br />
Five (5) sources greater than or equal to 0.004 tons/yr and less than or equal to 10.0 tons/yr<br />
One (1) source greater than 10.0 tons/yr and less than or equal to 100.0 tons/yr<br />
No sources greater than 100.0 tons/yr and less than or equal to 250.0 tons/yr<br />
No sources greater than 250.0 tons/yr and less than or equal to 500.0 tons/yr<br />
CO sources located along the northern and eastern portion of <strong>Commerce</strong> <strong>City</strong>, east of Colorado State<br />
Highway 2, include:<br />
<br />
<br />
Two (2) sources greater than or equal to 0.004 tons/yr and less than or equal to 10.0 tons/yr<br />
No sources greater than 10.0 tons/yr and less than or equal to 100.0 tons/yr<br />
<strong>City</strong> of <strong>Commerce</strong> <strong>City</strong><br />
<strong>Commerce</strong> <strong>City</strong> Community-Wide Impacts Report<br />
7887 East 60 th Ave, <strong>Commerce</strong> <strong>City</strong>, Colorado Page 15<br />
163
One (1) source greater than 100.0 tons/yr and less than or equal to 250.0 tons/yr<br />
No sources greater than 250.0 tons/yr and less than or equal to 500.0 tons/yr<br />
6.5 Breakdown of CO Emissions<br />
Total CO emissions estimates extrapolated from the data provided by APCD <strong>for</strong> Adams, Arapahoe, Denver,<br />
and Weld Counties, in addition to estimated actual state-wide Colorado emissions totals, are as follows:<br />
<br />
<br />
<br />
<br />
<br />
Adams County – 2,763 tons/yr<br />
Arapahoe County – 938 tons/yr<br />
Denver County – 528 tons/yr<br />
Weld County – 23,013 tons/yr<br />
State-wide estimated actual emissions totals – 58,795 tons/yr<br />
Table 6-2. CO Emissions Percentage of <strong>Commerce</strong> <strong>City</strong> in County and State Regions<br />
CO Emissions<br />
within Study Area<br />
Percent of Adams County<br />
Actual Emissions Totals<br />
Percent of State-Wide<br />
Actual Emissions Totals<br />
1,158 tons/yr 42% 2%<br />
Source: CDPHE APCD 2021<br />
<strong>City</strong> of <strong>Commerce</strong> <strong>City</strong><br />
<strong>Commerce</strong> <strong>City</strong> Community-Wide Impacts Report<br />
7887 East 60 th Ave, <strong>Commerce</strong> <strong>City</strong>, Colorado Page 16<br />
164
Figure 3.<br />
Facility CO Emissions<br />
<strong>City</strong> of <strong>Commerce</strong> <strong>City</strong><br />
<strong>Commerce</strong> <strong>City</strong> Community-Wide Impacts Report<br />
7887 East 60 th Ave, <strong>Commerce</strong> <strong>City</strong>, Colorado Page 17<br />
165
7. Volatile Organic Compounds (VOCs)<br />
Volatile Organic Compounds (VOCs) are any "carbon compounds, excluding carbon monoxide, carbon<br />
dioxide, carbonic acid, metallic carbides or carbonates, and ammonium carbonate, which participate in<br />
atmospheric photochemical reactions" (U.S. EPA, 2017a). In short, VOCs are chemicals that both vaporize into<br />
the air and dissolve in water. During hot summer days, VOCs react with NO x to <strong>for</strong>m ozone (smog). VOCs<br />
are pervasive in daily life due to their use in industry, agriculture, transportation, and day-to-day activities<br />
around the home. VOCs are emitted from various outdoor sources, including motor vehicles, chemical<br />
manufacturing facilities, refineries, and factories.<br />
7.1 VOC Health Concerns<br />
In addition to contributing to the <strong>for</strong>mation of ground-level ozone, VOCs are of concern as indoor and outdoor<br />
air pollutants. However, the emphasis of that concern outdoors is different from indoors. The main concern<br />
indoors is the potential <strong>for</strong> VOCs to adversely impact people's health that is exposed from products such as<br />
paint, varnishes, cleaning products, etc. (U.S. EPA, 2017a). While VOCs can be a health concern outdoors, U.S.<br />
EPA regulates VOCs outdoors primarily due to their ability to create photochemical smog under certain<br />
conditions, which can be harmful.<br />
7.2 Summary of VOC Emissions<br />
Using readily available data acquired from active APCD permits, 121 facilities have the potential to emit VOCs.<br />
These 121 facilities in and within a ½ mile of <strong>Commerce</strong> <strong>City</strong> limits total 1,353 tons/yr. In Table 7-1 below, the<br />
ten (10) highest emitters of estimated actual annual VOC emissions have been identified.<br />
Table 7-1. Ten (10) Highest Sources of VOC Emissions<br />
Source Name Source Description Source Location<br />
Suncor Energy – Denver<br />
Refinery<br />
Sinclair – Denver Terminal<br />
Phillips 66 Pipeline – Denver<br />
Terminal<br />
Master Builders Solutions –<br />
Brighton Facility<br />
Public Service Co – Cherokee<br />
Generating Station<br />
<strong>City</strong> of <strong>Commerce</strong> <strong>City</strong><br />
<strong>Commerce</strong> <strong>City</strong> Community-Wide Impacts Report<br />
7887 East 60 th Ave, <strong>Commerce</strong> <strong>City</strong>, Colorado Page 18<br />
166<br />
Facility Estimated<br />
Actual Annual VOCs<br />
(ton/year)<br />
Petroleum Refinery 5801 Brighton Blvd 469.0<br />
Petroleum Products<br />
Storage/Distribution<br />
Petroleum Products<br />
Storage/Distribution<br />
Adhesive<br />
Manufacturing<br />
Electric Power<br />
Generation<br />
8581 E 96 th Ave 128.8<br />
3960 E 56 th Ave 128.0<br />
10601 Fulton St 65.18<br />
6198 Franklin St 64.87<br />
Bimbo Bakeries, Inc. Commercial Bakery 7300 Brighton Blvd 61.83<br />
Magellan Pipeline Co – Dupont<br />
Terminal<br />
Allied Waste Systems – Tower<br />
Landfill<br />
Petroleum Products<br />
Storage/Distribution<br />
8160 Krameria St 54.48<br />
Solid Waste Landfill 8480 Tower Rd 27.83<br />
Cintas Corporation No. 2 Industrial Laundry 5100 Race Ct 25.27
Source Name Source Description Source Location<br />
Metro Wastewater<br />
Reclamation District<br />
Source: CDPHE APCD 2021<br />
7.3 Sources of VOC Emissions<br />
Sewage Treatment<br />
Facility<br />
Facility Estimated<br />
Actual Annual VOCs<br />
(ton/year)<br />
6450 York St 17.46<br />
Sources of VOCs analyzed from data recorded in this report involve the following breakdown of industries,<br />
services, and products, including percent of total VOC emissions estimates:<br />
<br />
<br />
<br />
<br />
<br />
Eight (8) petroleum refining and related industries (36% of total source emissions)<br />
Four (4) electric gas and sanitary services (8% of total source emissions)<br />
Fourteen (14) oil and gas extraction and related services (26% of total source emissions)<br />
Seven (7) food and kindred products (6% of total source emissions)<br />
Eighty-eight (88) other industrial services (24% of total source emissions)<br />
7.4 Locations of VOC Emissions<br />
Locations of the 121 sources of VOCs analyzed from data recorded in this report are represented in Figure 5.<br />
VOC sources located in the southern portion of the study area south of E 80 th Avenue include:<br />
<br />
<br />
<br />
<br />
<br />
Forty-three (43) sources greater than or equal to 0.005 tons/yr and less than or equal to 2.0 tons/yr<br />
Thirty-three (33) sources greater than 2.0 tons/yr and less than or equal to 50.0 tons/yr<br />
Two (2) sources greater than 50.0 tons/yr and less than or equal to 100.0 tons/yr<br />
One (1) source greater than 100.0 tons/yr and less than or equal to 250.0 tons/yr<br />
One (1) source greater than 250.0 tons/yr and less than or equal to 469.0 tons/yr<br />
VOC sources along the western portion of the study area, west of Colorado State Highway 2 and north of E<br />
80 th Avenue include:<br />
<br />
<br />
<br />
<br />
Eleven (11) sources greater than or equal to 0.005 tons/yr and less than or equal to 2.0 tons/yr<br />
Eleven (11) sources greater than 2.0 tons/yr and less than or equal to 50.0 tons/yr<br />
Two (2) sources greater than 50.0 tons/yr and less than or equal to 100.0 tons/yr<br />
One (1) source greater than 100.0 tons/yr and less than or equal to 250.0 tons/yr<br />
<strong>City</strong> of <strong>Commerce</strong> <strong>City</strong><br />
<strong>Commerce</strong> <strong>City</strong> Community-Wide Impacts Report<br />
7887 East 60 th Ave, <strong>Commerce</strong> <strong>City</strong>, Colorado Page 19<br />
167
No sources greater than 250.0 tons/yr and less than or equal to 469.0 tons/yr<br />
VOC sources along the northern and eastern portion of <strong>Commerce</strong> <strong>City</strong>, east of Colorado State Highway 2,<br />
include:<br />
<br />
<br />
<br />
<br />
<br />
Three (3) sources greater than or equal to 0.005 tons/yr and less than or equal to 2.0 tons/yr<br />
Twelve (12) sources greater than 2.0 tons/yr and less than or equal to 50.0 tons/yr<br />
One (1) source greater than 50.0 tons/yr and less than or equal to 100.0 tons/yr<br />
No sources greater than 100.0 tons/yr and less than or equal to 250.0 tons/yr<br />
No sources greater than 250.0 tons/yr and less than or equal to 469.0 tons/yr<br />
7.5 Breakdown of VOC Emissions<br />
Total VOC emissions estimates extrapolated from the data provided by APCD <strong>for</strong> Adams, Arapahoe, Denver,<br />
and Weld Counties, in addition to estimated state-wide Colorado emissions totals, are as follows:<br />
<br />
<br />
<br />
<br />
<br />
Adams County – 3,719 tons/yr<br />
Arapahoe County – 2,059 tons/yr<br />
Denver County – 897 tons/yr<br />
Weld County – 26,870 tons/yr<br />
State-wide estimated actual emissions totals – 54,697 tons/yr<br />
Table 7-2. VOC Emissions Percentage of <strong>Commerce</strong> <strong>City</strong> in County and State Regions<br />
VOC Emissions<br />
within Study Area<br />
Percent of Adams County<br />
Actual Emissions Totals<br />
Percent of State-Wide<br />
Actual Emissions Totals<br />
1,353 tons/yr 36% 2%<br />
Source: CDPHE APCD 2021<br />
<strong>City</strong> of <strong>Commerce</strong> <strong>City</strong><br />
<strong>Commerce</strong> <strong>City</strong> Community-Wide Impacts Report<br />
7887 East 60 th Ave, <strong>Commerce</strong> <strong>City</strong>, Colorado Page 20<br />
168
Figure 4.<br />
Facility VOC Emissions<br />
<strong>City</strong> of <strong>Commerce</strong> <strong>City</strong><br />
<strong>Commerce</strong> <strong>City</strong> Community-Wide Impacts Report<br />
7887 East 60 th Ave, <strong>Commerce</strong> <strong>City</strong>, Colorado Page 21<br />
169
8. Sulfur Dioxide (SO 2 )<br />
Sulfur Dioxide (SO 2 ) is a colorless, foul-smelling, toxic gas part of a larger group of chemicals referred to as<br />
sulfur oxides (SO x ) (U.S. EPA, 2019). SO 2 is emitted by burning fossil fuels (coal, oil, natural gas) or other sulfurcontaining<br />
materials. The largest source of SO 2 emitted into the atmosphere is the burning of fossil fuels by<br />
power plants and other industrial facilities (U.S. EPA, 2019). Other sources include industrial processes such as<br />
extracting metal from ore and vehicles and heavy equipment that burns fuel with high sulfur content.<br />
8.1 SO 2 Health Concerns<br />
Short-term exposures to SO 2 can harm the respiratory system and make breathing difficult. People with asthma,<br />
particularly children, are sensitive to the effects of SO 2 . SO 2 can also lead to the <strong>for</strong>mation of other SO x . SO x<br />
can react with other compounds in the atmosphere to <strong>for</strong>m small particles, contributing to particulate matter<br />
pollution (U.S. EPA, 2019).<br />
8.2 Summary of SO 2 Emissions<br />
Using available data acquired from active APCD permits, 28 facilities have the potential to emit SO 2 . These 28<br />
facilities in and within a ½ mile of <strong>Commerce</strong> <strong>City</strong> limits total 376 tons/yr. In Table 8-1 below, the ten (10)<br />
highest emitters of estimated actual annual SO 2 emissions have been identified.<br />
Table 8-1. Ten (10) Highest Sources of SO 2 Emissions<br />
Source Name Source Description Source Location<br />
Suncor Energy – Denver<br />
Refinery<br />
Metro Wastewater<br />
Reclamation District<br />
Allied Waste Systems –<br />
Tower Landfill<br />
Public Service Co –<br />
Cherokee Generating<br />
Station<br />
Aggregate Industries –<br />
Dahlia <strong>Plan</strong>t<br />
Adams County Government<br />
Center<br />
4283929 Delaware, LLC -<br />
Henderson<br />
<strong>City</strong> & County of Denver -<br />
Roslyn<br />
Facility Estimated<br />
Actual Annual SO 2<br />
(ton/year)<br />
Petroleum Refinery 5801 Brighton Blvd 223.2<br />
Sewage Treatment<br />
Facility<br />
6450 York St 90.84<br />
Solid Waste Landfill 8480 Tower Rd 34.34<br />
Electric Power<br />
Generation<br />
6198 Franklin St 9.84<br />
Hot Mix Asphalt <strong>Plan</strong>t 4801 E 78 th Ave 7.43<br />
Emergency Power<br />
Generation<br />
4430 S Adams<br />
County Pkwy<br />
4.47<br />
Pet Crematory 9731 Hanover Ct E 1.60<br />
Maintenance Complex 5440 Roslyn St 0.78<br />
Brannan Sand & Gravel Hot Mix Asphalt <strong>Plan</strong>t 7271 Colorado Blvd 0.73<br />
<strong>City</strong> of <strong>Commerce</strong> <strong>City</strong><br />
<strong>Commerce</strong> <strong>City</strong> Community-Wide Impacts Report<br />
7887 East 60 th Ave, <strong>Commerce</strong> <strong>City</strong>, Colorado Page 22<br />
170
Source Name Source Description Source Location<br />
Chemtrade Holdco U.S. -<br />
Chemtrade Solutions<br />
Source: CDPHE APCD 2021<br />
8.3 Sources of SO 2 Emissions<br />
Aluminum Sulfate<br />
Solution Production<br />
Facility<br />
Facility Estimated<br />
Actual Annual SO 2<br />
(ton/year)<br />
5075 E. 50th Ave 0.65<br />
Sources of SO 2 analyzed from data recorded in this report involve the following breakdown of industries,<br />
services, and products, including percent of total SO 2 emissions estimates:<br />
<br />
<br />
<br />
<br />
<br />
Six (6) petroleum refining and related industries (62% of total source emissions)<br />
Three (3) electric gas and sanitary services (36% of total source emissions)<br />
Zero (0) oil and gas extraction and related services (0% of total source emissions)<br />
Six (6) food and kindred products (0.03% of total source emissions)<br />
Thirteen (13) other industrial services (2% of total source emissions)<br />
8.4 Locations of SO 2 Emissions<br />
Locations of the 28 sources of SO 2 analyzed from data recorded in this report are represented in Figure 5.<br />
SO 2 sources located in the southern portion of the study area south of E 80 th Avenue include:<br />
<br />
<br />
<br />
<br />
Eighteen (18) sources greater than or equal to 0.0001 tons/yr and less than or equal to 5.0 tons/yr<br />
Two (2) sources greater than 5.0 tons/yr and less than or equal to 50.0 tons/yr<br />
One (1) source greater than 50.0 and less than or equal to 100.0 tons/yr<br />
One (1) source greater than 100.0 and less than or equal to 223.2 tons/yr<br />
SO 2 sources located along the western portion of the study area, west of Colorado State Highway 2 and north<br />
of E 80 th Avenue, include:<br />
<br />
<br />
<br />
<br />
Four (4) sources greater than or equal to 0.0001 tons/yr and less than or equal to 5.0 tons/yr<br />
No sources greater than 5.0 tons/yr and less than or equal to 50.0 tons/yr<br />
No sources greater than 50.0 and less than or equal to 100.0 tons/yr<br />
No sources greater than 100.0 and less than or equal to 223.2 tons/yr<br />
<strong>City</strong> of <strong>Commerce</strong> <strong>City</strong><br />
<strong>Commerce</strong> <strong>City</strong> Community-Wide Impacts Report<br />
7887 East 60 th Ave, <strong>Commerce</strong> <strong>City</strong>, Colorado Page 23<br />
171
SO 2 sources located along the northern and eastern portion of <strong>Commerce</strong> <strong>City</strong>, east of Colorado State<br />
Highway 2, include:<br />
<br />
<br />
<br />
<br />
One (1) source greater than or equal to 0.0001 tons/yr and less than or equal to 5.0 tons/yr<br />
One (1) source greater than 5.0 tons/yr and less than or equal to 50.0 tons/yr<br />
No sources greater than 50.0 and less than or equal to 100.0 tons/yr<br />
No sources greater than 100.0 and less than or equal to 223.2 tons/yr<br />
8.5 Breakdown of SO 2 Emissions<br />
Total SO 2 emissions estimates extrapolated from the data provided by APCD <strong>for</strong> Adams, Arapahoe, Denver,<br />
and Weld Counties, in addition to estimated actual state-wide Colorado emissions totals, are as follows:<br />
<br />
<br />
<br />
<br />
<br />
Adams County – 462 tons/yr<br />
Arapahoe County – 32 tons/yr<br />
Denver County – 99 tons/yr<br />
Weld County – 428 tons/yr<br />
State-wide estimated actual emissions totals – 13,705 tons/yr<br />
Table 8-2. SO 2 Emissions Percentage of <strong>Commerce</strong> <strong>City</strong> in County and State Regions<br />
SO 2 Emissions<br />
within Study Area<br />
Percent of Adams County<br />
Actual Emissions Totals<br />
Percent of State-Wide<br />
Actual Emissions Totals<br />
376 tons/yr 81% 3%<br />
Source: CDPHE APCD 2021<br />
<strong>City</strong> of <strong>Commerce</strong> <strong>City</strong><br />
<strong>Commerce</strong> <strong>City</strong> Community-Wide Impacts Report<br />
7887 East 60 th Ave, <strong>Commerce</strong> <strong>City</strong>, Colorado Page 24<br />
172
Figure 5.<br />
Facility SO 2 Emissions<br />
<strong>City</strong> of <strong>Commerce</strong> <strong>City</strong><br />
<strong>Commerce</strong> <strong>City</strong> Community-Wide Impacts Report<br />
7887 East 60 th Ave, <strong>Commerce</strong> <strong>City</strong>, Colorado Page 25<br />
173
9. Particulate Matter less than 10 micrometers in diameter (PM 10 )<br />
Atmospheric particulate matter with diameters generally 10 micrometers and smaller (PM 10 ) consists of<br />
microscopic solid or liquid particles suspended in the air. PM 10 can be made up of several different components,<br />
including "acidic aerosols (e.g., nitrates and sulfates), organic carbon, metals, soil or dust particles, and allergens<br />
(such as fragments of pollen or mold spores)" (U.S. EPA, 2021c).<br />
PM 10 is typically <strong>for</strong>med in the atmosphere via various sources, primarily from fugitive dust sources rather than<br />
stack emissions or combustion sources. Fugitive emissions cannot be captured and often originate from<br />
equipment leaks, earth disturbing equipment vehicles, and windblown disturbances (U.S. EPA, 2021c).<br />
9.1 PM 10 Health Concerns<br />
PM 10 is inhalable and thus poses a health threat, such as irritation to the eyes, nose, and throat. In addition, it<br />
causes serious harm due to inflammation in the airways of people with respiratory diseases such as asthma,<br />
chronic obstructive pulmonary disease, and pneumonia.<br />
9.2 Summary of PM 10 Emissions<br />
Using readily available data acquired from active APCD permits, 79 facilities have the potential to emit PM 10 .<br />
These 79 facilities in and within a ½ mile of <strong>Commerce</strong> <strong>City</strong> limits total 490 tons/yr PM 10 . In Table 9-1 below,<br />
the ten (10) highest emitters of estimated actual annual PM 10 emissions have been identified.<br />
Table 9-1. Ten (10) Highest Sources of PM 10 Emissions<br />
Source Name Source Description Source Location<br />
Suncor Energy – Denver<br />
Refinery<br />
Allied Waste Systems – Tower<br />
Landfill<br />
Public Service Co – Cherokee<br />
Generating Station<br />
Ardent Mills – <strong>Commerce</strong> <strong>City</strong><br />
Mill<br />
<strong>City</strong> of <strong>Commerce</strong> <strong>City</strong><br />
<strong>Commerce</strong> <strong>City</strong> Community-Wide Impacts Report<br />
7887 East 60 th Ave, <strong>Commerce</strong> <strong>City</strong>, Colorado Page 26<br />
174<br />
Facility Estimated<br />
Actual Annual PM 10<br />
(ton/year)<br />
Petroleum Refinery 5801 Brighton Blvd 130.0<br />
Solid Waste Landfill 8480 Tower Rd 91.16<br />
Electric Power<br />
Generation<br />
Animal Feed and Flour<br />
Mill<br />
6198 Franklin St 60.84<br />
4545 E 64 th Ave 58.86<br />
<strong>Commerce</strong> <strong>City</strong> Grain Grain Elevator 4600 E 64 th Ave 18.25<br />
Albert Frei & Sons – Fernald Pit<br />
Basalite Concrete Products<br />
Construction Sand<br />
and Gravel Mining<br />
Concrete Block and<br />
Brick Manufacturing<br />
7281 Colorado<br />
Blvd<br />
17.65<br />
4900 Race St 11.94<br />
General Scrap Inc. Scrap Metal Recycling 5601 York St 7.58<br />
JK Concepts<br />
Brannan Ready Mix Company<br />
Woodwork<br />
Manufacturing<br />
Concrete Batching<br />
<strong>Plan</strong>t<br />
3333 E 52 nd Ave 7.00<br />
7291 Colorado<br />
Blvd<br />
5.80
Source: CDPHE APCD 2021<br />
9.3 Sources of PM 10 Emissions<br />
Sources of PM 10 analyzed from data recorded in this report involve the following breakdown of industries,<br />
services, and products, including percent of total PM 10 emissions estimates:<br />
<br />
<br />
<br />
<br />
<br />
Eight (8) petroleum refining and related industries (29% of total source emissions)<br />
Four (4) electric gas and sanitary services (32% of total source emissions)<br />
Zero (0) oil and gas extraction and related services (0% of total source emissions)<br />
Seven (7) food and kindred products (17% of total source emissions)<br />
Sixty (60) other industrial services (22% of total source emissions)<br />
9.4 Locations of PM 10 Emissions<br />
Locations of the 79 sources of PM 10 analyzed from data recorded in this report are represented in Figure 6.<br />
PM 10 sources located in the southern portion of the study area south of E 80 th Avenue include:<br />
<br />
<br />
<br />
<br />
Thirty-four (34) sources greater than or equal to 0.1 tons/yr and less than or equal to 1.0 tons/yr<br />
Twenty-two (22) sources greater than 1.0 tons/yr and less than or equal to 50.0 tons/yr<br />
Two (2) sources greater than 50.0 tons/yr and less than or equal to 100.0 tons/yr<br />
One (1) source greater than 100.0 tons/yr and less than or equal to 130.1 tons/yr<br />
PM 10 sources located along the western portion of the study area, west of Colorado State Highway 2 and north<br />
of E 80 th Avenue, include:<br />
<br />
<br />
<br />
<br />
Ten (10) sources greater than or equal to 0.1 tons/yr and less than or equal to 1.0 tons/yr<br />
Eight (8) sources greater than 1.0 tons/yr and less than or equal to 50.0 tons/yr<br />
No sources greater than 50.0 tons/yr and less than or equal to 100.0 tons/yr<br />
No sources greater than 100.0 tons/yr and less than or equal to 130.1 tons/yr<br />
PM 10 sources located along the northern and eastern portion of <strong>Commerce</strong> <strong>City</strong>, east of Colorado State<br />
Highway 2, include:<br />
<br />
<br />
One (1) source greater than or equal to 0.1 tons/yr and less than or equal to 1.0 tons/yr<br />
No sources greater than 1.0 tons/yr and less than or equal to 50.0 tons/yr<br />
<strong>City</strong> of <strong>Commerce</strong> <strong>City</strong><br />
<strong>Commerce</strong> <strong>City</strong> Community-Wide Impacts Report<br />
7887 East 60 th Ave, <strong>Commerce</strong> <strong>City</strong>, Colorado Page 27<br />
175
One (1) source greater than 50.0 tons/yr and less than or equal to 100.0 tons/yr<br />
No sources greater than 100.0 tons/yr and less than or equal to 130.1 tons/yr<br />
9.5 Breakdown of PM 10 Emissions<br />
Total PM 10 emissions estimates extrapolated from the data provided by APCD <strong>for</strong> Adams, Arapahoe, Denver,<br />
and Weld Counties, in addition to estimated actual state-wide Colorado emissions totals, are as follows:<br />
<br />
<br />
<br />
<br />
<br />
Adams County – 773 tons/yr<br />
Arapahoe County – 557 tons/yr<br />
Denver County – 209 tons/yr<br />
Weld County – 1,841 tons/yr<br />
State-wide estimated actual emissions totals – 13,084 tons/yr<br />
Table 9-2. PM 10 Emissions Percentage of <strong>Commerce</strong> <strong>City</strong> in County and State Regions<br />
PM 10 Emissions<br />
within Study Area<br />
Percent of Adams County<br />
Actual Emissions Totals<br />
Percent of State-Wide<br />
Actual Emissions Totals<br />
490 tons/yr 63% 4%<br />
Source: CDPHE APCD 2021<br />
<strong>City</strong> of <strong>Commerce</strong> <strong>City</strong><br />
<strong>Commerce</strong> <strong>City</strong> Community-Wide Impacts Report<br />
7887 East 60 th Ave, <strong>Commerce</strong> <strong>City</strong>, Colorado Page 28<br />
176
Figure 6.<br />
Facility PM 10 Emissions<br />
<strong>City</strong> of <strong>Commerce</strong> <strong>City</strong><br />
<strong>Commerce</strong> <strong>City</strong> Community-Wide Impacts Report<br />
7887 East 60 th Ave, <strong>Commerce</strong> <strong>City</strong>, Colorado Page 29<br />
177
10. Particulate Matter less than 2.5 micrometers in diameter (PM 2.5 )<br />
Atmospheric particulate matter with diameters generally 2.5 micrometers and smaller (PM 2.5 ) consists of<br />
microscopic solid or liquid particles suspended in the air. PM 2.5 can be made up of several different components,<br />
including "acidic aerosols (e.g., nitrates and sulfates), organic carbon, metals, soil or dust particles, and allergens<br />
(such as fragments of pollen or mold spores)" (U.S. EPA, 2021c).<br />
PM 2.5 is typically <strong>for</strong>med in the atmosphere via gas to particle conversion. It consists primarily of nitrates,<br />
sulfates, and organic carbon (black carbon from combustion can be an important primary source of particles in<br />
PM 2.5 size fraction) (U.S. EPA, 2021c). PM 2.5 is emitted directly from sources, such as construction sites, unpaved<br />
roads, fields, smokestacks, or fires.<br />
10.1 PM 2.5 Health Concerns<br />
PM 2.5 can penetrate the lungs, with particles less than 0.1 um (ultrafine particles) able to penetrate the<br />
bloodstream. The result of which can affect the lungs, the heart, and the cardiovascular system. For reference,<br />
the average human hair is about 70 micrometers in diameter – making it 30 times larger than the largest fine<br />
particle (U.S. EPA, 2021c).<br />
10.2 Summary of PM 2.5 Emissions<br />
Using readily available data acquired from active APCD permits, 79 facilities have the potential to emit PM 2.5 .<br />
These 79 facilities in and within a ½ mile of <strong>Commerce</strong> <strong>City</strong> limits total 292 tons/yr PM 2.5 . In Table 10-1 below,<br />
the ten (10) highest emitters of estimated actual annual PM 2.5 emissions have been identified.<br />
Table 10-1. Ten (10) Highest Sources of PM 2.5 Emissions<br />
Source Name Source Description Source Location<br />
Suncor Energy – Denver<br />
Refinery<br />
Public Service Co – Cherokee<br />
Generating Station<br />
Allied Waste Systems – Tower<br />
Landfill<br />
Ardent Mills – <strong>Commerce</strong> <strong>City</strong><br />
Mill<br />
JK Concepts<br />
Facility Estimated<br />
Actual Annual PM 2.5<br />
(ton/year)<br />
Petroleum Refinery 5801 Brighton Blvd 119.5<br />
Electric Power<br />
Generation<br />
6198 Franklin St 60.84<br />
Solid Waste Landfill 8480 Tower Rd 20.24<br />
Animal Feed and Flour<br />
Mill<br />
Woodwork<br />
Manufacturing<br />
4545 E 64 th Ave 16.84<br />
3333 E 52 nd Ave 7.00<br />
<strong>Commerce</strong> <strong>City</strong> Grain Grain Elevator 4600 E 64 th Ave 6.29<br />
United Asphalts Inc. Asphalt Manufacturing 43606 E 60 th Ave 5.63<br />
Albert Frei & Sons – Fernald Pit<br />
Construction Sand<br />
and Gravel Mining<br />
7281 Colorado<br />
Blvd<br />
5.19<br />
<strong>City</strong> of <strong>Commerce</strong> <strong>City</strong><br />
<strong>Commerce</strong> <strong>City</strong> Community-Wide Impacts Report<br />
7887 East 60 th Ave, <strong>Commerce</strong> <strong>City</strong>, Colorado Page 30<br />
178
Source Name Source Description Source Location<br />
Facility Estimated<br />
Actual Annual PM 2.5<br />
(ton/year)<br />
Trustile Doors, LLC Millwork 1780 E 66 th Ave 4.00<br />
Metro Wastewater Reclamation<br />
District<br />
Source: CDPHE APCD 2021<br />
Sewage Treatment<br />
Facility<br />
6450 York St 3.57<br />
10.3 Sources of PM 2.5 Emissions<br />
Sources of PM 2.5 analyzed from data recorded in this report involve the following breakdown of industries,<br />
services, and products, including percent of total PM 2.5 emissions estimates:<br />
<br />
<br />
<br />
<br />
<br />
Eight (8) petroleum refining and related industries (44% of total source emissions)<br />
Four (4) electric gas and sanitary services (30% of total source emissions)<br />
Zero (0) oil and gas extraction and related services (0% of total source emissions)<br />
Seven (7) food and kindred products (9% of total source emissions)<br />
Sixty (60) other industrial services (18% of total source emissions)<br />
10.4 Locations of PM 2.5 Emissions<br />
Locations of the 79 sources of PM 2.5 analyzed from data recorded in this report are represented in Figure 7.<br />
PM 2.5 sources located in the southern portion of the study area south of E 80 th Avenue include:<br />
<br />
<br />
<br />
<br />
Thirty-five (35) sources greater than or equal to 0.003 tons/yr and less than or equal to 1.0 tons/yr<br />
Seventeen (17) sources greater than 1.0 tons/yr and less than or equal to 50.0 tons/yr<br />
One (1) source greater than 50.0 tons/yr and less than or equal to 100.0 tons/yr<br />
One (1) source greater than 100.0 tons/yr and less than or equal to 119.5 tons/yr<br />
PM 2.5 sources located along the western portion of the study area, west of Colorado State Highway 2 and<br />
north of E 80 th Avenue, include:<br />
<br />
<br />
<br />
<br />
Nineteen (19) sources greater than or equal to 0.003 tons/yr and less than or equal to 1.0 tons/yr<br />
Four (4) sources greater than 1.0 tons/yr and less than or equal to 50.0 tons/yr<br />
No sources greater than 50.0 tons/yr and less than or equal to 100.0 tons/yr<br />
No sources greater than 100.0 tons/yr and less than or equal to 119.5 tons/yr<br />
<strong>City</strong> of <strong>Commerce</strong> <strong>City</strong><br />
<strong>Commerce</strong> <strong>City</strong> Community-Wide Impacts Report<br />
7887 East 60 th Ave, <strong>Commerce</strong> <strong>City</strong>, Colorado Page 31<br />
179
PM 2.5 sources located along the northern and eastern portion of <strong>Commerce</strong> <strong>City</strong>, east of Colorado State<br />
Highway 2, include:<br />
<br />
<br />
<br />
<br />
One (1) source greater than or equal to 0.003 tons/yr and less than or equal to 1.0 tons/yr<br />
One (1) source greater than 1.0 tons/yr and less than or equal to 50.0 tons/yr<br />
No sources greater than 50.0 tons/yr and less than or equal to 100.0 tons/yr<br />
No sources greater than 100.0 tons/yr and less than or equal to 119.5 tons/yr<br />
10.5 Breakdown of PM 2.5 Emissions<br />
Total PM 2.5 emissions estimates extrapolated from the data provided by APCD <strong>for</strong> Adams, Arapahoe, Denver,<br />
and Weld Counties, in addition to estimated actual state-wide Colorado emissions totals, are as follows:<br />
<br />
<br />
<br />
<br />
<br />
Adams County – 453 tons/yr<br />
Arapahoe County – 506 tons/yr<br />
Denver County – 125 tons/yr<br />
Weld County – 1,316 tons/yr<br />
State-wide estimated actual emissions totals – 5,912 tons/yr<br />
Table 10-2. PM 2.5 Emissions Percentage of <strong>Commerce</strong> <strong>City</strong> in County and State Regions<br />
PM 2.5 Emissions<br />
within Study Area<br />
Percent of Adams County<br />
Actual Emissions Totals<br />
Percent of State-Wide<br />
Actual Emissions Totals<br />
292 tons/yr 64% 5%<br />
Source: CDPHE APCD 2021<br />
<strong>City</strong> of <strong>Commerce</strong> <strong>City</strong><br />
<strong>Commerce</strong> <strong>City</strong> Community-Wide Impacts Report<br />
7887 East 60 th Ave, <strong>Commerce</strong> <strong>City</strong>, Colorado Page 32<br />
180
Figure 7.<br />
Facility PM 2.5 Emissions<br />
<strong>City</strong> of <strong>Commerce</strong> <strong>City</strong><br />
<strong>Commerce</strong> <strong>City</strong> Community-Wide Impacts Report<br />
7887 East 60 th Ave, <strong>Commerce</strong> <strong>City</strong>, Colorado Page 33<br />
181
11. Total Hazardous Air Pollutants (HAPs)<br />
Hazardous air pollutants, also known as toxic air pollutants or air toxics, are a series of "known or suspected<br />
pollutants to cause cancer or other serious health effects, such as reproductive effects or congenital disabilities,<br />
or adverse environmental effects" (U.S. EPA, 2017b). The U.S. EPA currently classifies 187 toxic air pollutants<br />
such as benzene, found in gasoline; perchloroethylene, which is emitted from some dry cleaning facilities; and<br />
methylene chloride solvent and paint stripper by several industries (U.S. EPA, 2017b). The Total HAPs<br />
categorized in the emissions data include acetaldehyde, benzene, ethylbenzene, <strong>for</strong>maldehyde, n-hexane,<br />
toluene, and xylenes.<br />
11.1 Total HAPs Health Concerns<br />
Exposure to toxic air pollutants <strong>for</strong> prolonged durations may increase the risk of cancer or experiencing other<br />
serious health effects. Health effects can damage the immune system and neurological, reproductive (e.g.,<br />
reduced fertility), developmental, respiratory, and other health problems (U.S. EPA, 2017b).<br />
11.2 Summary of Total HAPs Emissions<br />
Using readily available data acquired from active APCD permits, 43 facilities have the potential to emit Total<br />
HAPs. These 43 facilities in and within a ½ mile of <strong>Commerce</strong> <strong>City</strong> limits total 124 tons/yr. In Table 11-1 below,<br />
the ten (10) highest emitters of estimated actual annual Total HAPs emissions have been identified.<br />
Table 11-1. Ten (10) Highest Sources of Total HAPs Emissions<br />
Source Name Source Description Source Location<br />
Allied Waste Systems –<br />
Tower Landfill<br />
Suncor Energy – Denver<br />
Refinery<br />
Public Service Co –<br />
Cherokee Generating<br />
Station<br />
U.E Compression –<br />
Henderson Facility<br />
Painting & Fiberglass Inc.<br />
Phillips 66 Pipeline –<br />
Denver Terminal<br />
Nustar Logistics – Denver<br />
Terminal<br />
Good Paint, LLC<br />
Birko Corp – Chemical<br />
Blending <strong>Plan</strong>t<br />
<strong>City</strong> of <strong>Commerce</strong> <strong>City</strong><br />
<strong>Commerce</strong> <strong>City</strong> Community-Wide Impacts Report<br />
7887 East 60 th Ave, <strong>Commerce</strong> <strong>City</strong>, Colorado Page 34<br />
182<br />
Facility Estimated Actual<br />
Annual Total HAPs<br />
(ton/year)<br />
Solid Waste Landfill 8480 Tower Rd 30.12<br />
Petroleum Refinery 5801 Brighton Blvd 19.74<br />
Electric Power<br />
Generation<br />
Coating & Blasting –<br />
Structural Steel<br />
Fiber Glass Parts<br />
Manufacturing<br />
Petroleum Products<br />
Storage/Distribution<br />
Petroleum Products<br />
Storage/Distribution<br />
Heavy Equipment<br />
Surface Coating<br />
6198 Franklin St 19.38<br />
9461 Willow Ct 9.20<br />
10201 E 107 th Pl 6.58<br />
3960 E 56 th Ave 5.72<br />
3601 E 56 th Ave 3.94<br />
4404 E 60 th Ave 3.21<br />
Chemical Mixtures 9152 Yosemite St 2.43
Source Name Source Description Source Location<br />
Master Builders Solutions –<br />
Brighton Facility<br />
Source: CDPHE APCD 2021<br />
Adhesive<br />
Manufacturing<br />
11.3 Sources of Total HAPs Emissions<br />
Facility Estimated Actual<br />
Annual Total HAPs<br />
(ton/year)<br />
10601 Fulton St 2.40<br />
Sources of Total HAPs analyzed from data recorded in this report involve the following industries, services,<br />
and products, including percent of total HAPs emissions estimates:<br />
<br />
<br />
<br />
<br />
<br />
Five (5) petroleum refining and related industries (20% of total source emissions)<br />
Three (3) electric gas and sanitary services (41% of total source emissions)<br />
Six (6) oil and gas extraction and related services (11% of total source emissions)<br />
One (1) food and kindred products (0.3% of total source emissions)<br />
Twenty-eight (28) other industrial services (28% of total source emissions)<br />
11.4 Locations of Total HAPs Emissions<br />
Locations of the 43 sources of Total HAPs analyzed from data recorded in this report are represented in Figure<br />
8.<br />
Total HAPs sources located in the southern portion of the study area south of E 80 th Avenue include:<br />
<br />
<br />
<br />
Twenty-six (26) sources greater than or equal to 0.0006 tons/yr and less than or equal to 10.0 tons/yr<br />
Two (2) sources greater than 10.0 tons/yr and less than or equal to 25.0 tons/yr<br />
No sources greater than 25.0 tons/yr and less than or equal to 30.1 tons/yr<br />
Total HAPs sources located along the western portion of the study area, west of Colorado State Highway 2<br />
and north of E 80 th Avenue, include:<br />
<br />
<br />
<br />
Ten (10) sources greater than or equal to 0.0006 tons/yr and less than or equal to 10.0 tons/yr<br />
No sources greater than 10.0 tons/yr and less than or equal to 25.0 tons/yr<br />
No sources greater than 25.0 tons/yr and less than or equal to 30.1 tons/yr<br />
Total HAPs sources located along the northern and eastern portion of <strong>Commerce</strong> <strong>City</strong>, east of Colorado State<br />
Highway 2, include:<br />
<br />
Four (4) sources greater than or equal to 0.0006 tons/yr and less than or equal to 10.0 tons/yr<br />
<strong>City</strong> of <strong>Commerce</strong> <strong>City</strong><br />
<strong>Commerce</strong> <strong>City</strong> Community-Wide Impacts Report<br />
7887 East 60 th Ave, <strong>Commerce</strong> <strong>City</strong>, Colorado Page 35<br />
183
No sources greater than 10.0 tons/yr and less than or equal to 25.0 tons/yr<br />
One (1) source greater than 25.0 tons/yr and less than or equal to 30.1 tons/yr<br />
11.5 Breakdown of Total HAPs Emissions<br />
Total HAPs emissions estimates extrapolated from the data provided by APCD <strong>for</strong> Adams, Arapahoe, Denver,<br />
and Weld Counties, in addition to estimated state-wide Colorado emissions totals, are as follows:<br />
<br />
<br />
<br />
<br />
<br />
Adams County – 406 tons/yr<br />
Arapahoe County – 113 tons/yr<br />
Denver County – 40 tons/yr<br />
Weld County – 2,116 tons/yr<br />
State-wide estimated actual emissions totals – 5,112 tons/yr<br />
Table 11-2. Total HAPs Emissions Percentage of <strong>Commerce</strong> <strong>City</strong> in County and State Regions<br />
Total HAPs Emissions<br />
within Study Area<br />
Percent of Adams County<br />
Actual Emissions Totals<br />
Percent of State-Wide<br />
Actual Emissions Totals<br />
124 tons/yr 31% 2%<br />
Source: CDPHE APCD 2021<br />
<strong>City</strong> of <strong>Commerce</strong> <strong>City</strong><br />
<strong>Commerce</strong> <strong>City</strong> Community-Wide Impacts Report<br />
7887 East 60 th Ave, <strong>Commerce</strong> <strong>City</strong>, Colorado Page 36<br />
184
Figure 8.<br />
Facility Total HAPs Emissions<br />
<strong>City</strong> of <strong>Commerce</strong> <strong>City</strong><br />
<strong>Commerce</strong> <strong>City</strong> Community-Wide Impacts Report<br />
7887 East 60 th Ave, <strong>Commerce</strong> <strong>City</strong>, Colorado Page 37<br />
185
12. Methane (CH 4 )<br />
For in<strong>for</strong>mation on CH 4 emissions within <strong>Commerce</strong> <strong>City</strong>, please refer to the 2021 GHG emissions report<br />
prepared by Lotus Engineering and <strong>Sustainability</strong> <strong>for</strong> <strong>Commerce</strong> <strong>City</strong>.<br />
<strong>City</strong> of <strong>Commerce</strong> <strong>City</strong><br />
<strong>Commerce</strong> <strong>City</strong> Community-Wide Impacts Report<br />
7887 East 60 th Ave, <strong>Commerce</strong> <strong>City</strong>, Colorado Page 38<br />
186
13. Interactive Story Map<br />
Pinyon has organized the air pollutant data within this report into an online, interactive ArcGIS story map. The<br />
story map is intended to supplement this community-wide impacts report, providing a narrative and easy access<br />
to visualize the associated data. <strong>Commerce</strong> <strong>City</strong> can use this as a tool to quickly scope air quality emissions<br />
that may be located near communities and businesses to make more in<strong>for</strong>med decisions. In addition, the story<br />
map can be viewed and shared with the public or whomever <strong>Commerce</strong> <strong>City</strong> provides the ArcGIS login<br />
credentials. The story map can be accessed via most web browsers and devices.<br />
To access the Story Map, visit the following hyperlink: _________<br />
<strong>City</strong> of <strong>Commerce</strong> <strong>City</strong><br />
<strong>Commerce</strong> <strong>City</strong> Community-Wide Impacts Report<br />
7887 East 60 th Ave, <strong>Commerce</strong> <strong>City</strong>, Colorado Page 39<br />
187
14. Data Gaps<br />
Pinyon collected data from 154 emissions sources. Due to the high volume of data and variety of sources from<br />
which these data were collected, some data gaps in the community-wide impacts report may exist. In addition,<br />
there are thresholds in which sources of air pollution are not required to obtain a permit or file an APEN.<br />
There<strong>for</strong>e, if a facility does not have a public record of emissions, this does not mean there are no potential<br />
emissions from the facility.<br />
Below is a list of data gaps observed by Pinyon during the preparation of the community-wide impacts report:<br />
<br />
<br />
<br />
<br />
The air permits where emissions data were collected are active as of the date of this report. Future use of<br />
this report may not reflect estimated actual source emissions as equipment or production at these facilities<br />
may change. Pinyon compiled data from the most recent permit submittals filed with APCD. Additional<br />
emissions estimates of air pollutants may exist within the study area, such as those currently under APCD<br />
review that have not been issued air permits.<br />
Evaluation of mobile and non-road and on-road sources of pollution such as vehicle exhaust, tractortrailers,<br />
lawnmowers, wood-burning fires, etc., did not occur, as these are not stationary sources that<br />
require any sort of documentation of emissions.<br />
The "shut-in” status of each oil and gas well recorded is current as of the date of this report. There<strong>for</strong>e,<br />
future use of this report may not reflect future well status.<br />
Both the area attainment statuses and NAAQS screening levels presented in this report are current as of<br />
the date of this report. There<strong>for</strong>e, future use of this report may not reflect then-current regulatory<br />
conditions.<br />
<strong>City</strong> of <strong>Commerce</strong> <strong>City</strong><br />
<strong>Commerce</strong> <strong>City</strong> Community-Wide Impacts Report<br />
7887 East 60 th Ave, <strong>Commerce</strong> <strong>City</strong>, Colorado Page 40<br />
188
15. References<br />
Colorado Department of Public Health and Environment (CDPHE), 2020. 2019 Air Quality Data Report.<br />
September 2020.<br />
CDPHE, 2021a. About Title V operating permits. Accessed from: https://cdphe.colorado.gov/apens-and-airpermits/about-title-v-operating-permits<br />
CDPHE, 2021b. Do you need an APEN or air permit? Accessed from: https://cdphe.colorado.gov/apens-and-airpermits/do-you-need-an-apen-or-air-permit<br />
Colorado Department of Transportation (CDOT), 2021. Highway Data Explorer. Accessed from:<br />
https://dtdapps.coloradodot.info/otis/HighwayData<br />
Colorado Oil and Gas Conservation Commission (COGCC). n.d. Glossary of Oil and Gas Terms. Accessed from:<br />
https://cogcc.state.co.us/COGIS_Help/glossary.htm<br />
United States Environmental Protection Agency (U.S. EPA), 2016a. Carbon Monoxide Pollution in Outdoor Air.<br />
Accessed from: https://www.epa.gov/co-pollution/basic-in<strong>for</strong>mation-about-carbon-monoxide-cooutdoor-air-pollution#What%20is%20CO.<br />
September 2016.<br />
U.S. EPA, 2016b. Nitrogen Dioxide (NO 2 ) Pollution. Accessed from: https://www.epa.gov/no2-pollution/basicin<strong>for</strong>mation-about-no2#Effects.<br />
September 2016.<br />
U.S. EPA, 2017a. Technical Overview of Volatile Organic Compounds. Accessed from: https://www.epa.gov/indoorair-quality-iaq/technical-overview-volatile-organic-compounds.<br />
April 2017.<br />
U.S. EPA, 2017b. What are Hazardous Air Pollutants? Accessed from: https://www.epa.gov/haps/what-arehazardous-air-pollutants.<br />
February 2017.<br />
U.S. EPA, 2019. Sulfur Dioxide (SO 2 ) Pollution. Accessed from: https://www.epa.gov/so2-pollution/sulfur-dioxidebasics#what%20is%20so2.<br />
April 2019.<br />
U.S. EPA, 2020. How Mobile Source Pollution Affects Your Health. Accessed from: https://www.epa.gov/mobilesource-pollution/how-mobile-source-pollution-affects-your-health.<br />
September 2020.<br />
U.S. EPA, 2021a. Colorado Nonattainment/Maintenance Status <strong>for</strong> Each County by Year <strong>for</strong> All Criteria Pollutants.<br />
Accessed from: https://www3.epa.gov/airquality/greenbook/anayo_co.html. June 2021.<br />
U.S. EPA, 2021b. NAAQS Table. Accessed from: https://www.epa.gov/criteria-air-pollutants/naaqs-table.<br />
February 2021.<br />
U.S. EPA, 2021c. (2021, May). Particulate Matter (PM) Pollution. Accessed from: https://www.epa.gov/pmpollution/particulate-matter-pm-basics.<br />
May 2021<br />
<strong>City</strong> of <strong>Commerce</strong> <strong>City</strong><br />
<strong>Commerce</strong> <strong>City</strong> Community-Wide Impacts Report<br />
7887 East 60 th Ave, <strong>Commerce</strong> <strong>City</strong>, Colorado Page 41<br />
189
Appendix B. AQ and WQ<br />
Technical Documents<br />
Memorandum<br />
Date: December 22, 2021<br />
To:<br />
From:<br />
Subject:<br />
Anita Riley, Principal <strong>Plan</strong>ner, <strong>Commerce</strong> <strong>City</strong><br />
Dustin Collins, Pinyon Environmental, Inc.<br />
Existing and Potential Ambient Air Monitoring in <strong>Commerce</strong> <strong>City</strong><br />
Introduction<br />
Pinyon Environmental, Inc. (Pinyon) is pleased to present this memorandum detailing existing and upcoming<br />
ambient air monitoring within and near <strong>Commerce</strong> <strong>City</strong>, along with in<strong>for</strong>mation <strong>for</strong> reference to support the<br />
development of a potential <strong>Commerce</strong> <strong>City</strong> operated monitoring network that would fill the gaps in areas not<br />
currently receiving air quality data. The existing and upcoming monitoring includes an evaluation of the<br />
Colorado Department of Public Health and Environment (CDPHE) Air Pollution Control Division's (APCD)<br />
network of air pollution monitoring stations within the vicinity of <strong>Commerce</strong> <strong>City</strong>. Additionally, this memo<br />
discusses air quality monitoring networks under development by third parties: Cultivando and Suncor Energy<br />
(Suncor). The purpose of this memo is to discuss air pollution monitoring occurring within the vicinity of<br />
<strong>Commerce</strong> <strong>City</strong> by both public and private entities and to identify areas where additional monitoring technology<br />
may be beneficial to bolster air quality public health transparency and awareness to the <strong>Commerce</strong> <strong>City</strong><br />
community.<br />
APCD Colorado Air Monitoring Network Overview<br />
As of 2021, APCD conducts air quality and meteorological monitoring at 44 locations statewide. Of those 44<br />
locations, two (2) air quality monitors are located within the vicinity of <strong>Commerce</strong> <strong>City</strong>. Ozone (O 3 ) and<br />
particulate matter (PM) monitors, including those <strong>for</strong> particulate matter less than 10 micrometers (μm) in<br />
diameter (PM 10 ) and particulate matter less than 2.5 μm in diameter (PM 2.5 ), are the most abundant and<br />
widespread monitors in the network. In addition, APCD operates 18 meteorological sites statewide,<br />
continuously measuring wind speed, wind direction, resultant speed, resultant direction, standard deviation of<br />
horizontal wind direction, and temperature. Both active and inactive APCD monitors located within the vicinity<br />
of <strong>Commerce</strong> <strong>City</strong> discussed in this memo can be found in Tables 1 and 2, respectively. Additionally, all active<br />
air quality monitors situated in the vicinity of <strong>Commerce</strong> <strong>City</strong> can be found in Figure 1.<br />
Please note the pollutant concentrations outlined in this memo were retrieved from the Colorado APCD 2021<br />
Ambient Air Monitoring Network <strong>Plan</strong> (CDPHE 2021), summarizing pollutant values recorded at monitoring<br />
stations in the Denver Metro/Northern Front Range region during the reporting year (RY) 2020.<br />
Table 1.<br />
Active APCD Monitor Sites Located Within the Vicinity of <strong>Commerce</strong> <strong>City</strong><br />
Site Name Monitor Location Pollutants Monitored<br />
Birch Street 7275 Birch St PM 10 & PM 2.5<br />
Welby 3174 E 78 th Ave O 3 , CO, NO 2 , SO 2 & PM 10<br />
Source: CDPHE 2021<br />
Technical Memorandum<br />
Existing and Potential Ambient Air Monitoring Network in <strong>Commerce</strong> <strong>City</strong> Page 1<br />
190
Table 2.<br />
Inactive APCD Monitor Sites Located Within the Vicinity of <strong>Commerce</strong> <strong>City</strong><br />
Site Name Monitor Location Pollutants Monitored<br />
Tri-County 4201 E 72 nd Ave D PM 10 & PM 2.5<br />
Source: CDPHE 2021<br />
Active Monitor Sites Located Within the Vicinity of <strong>Commerce</strong> <strong>City</strong><br />
Adams County Birch Street<br />
The Adams County Birch Street (Birch Street) monitor site began operation on March 1, 2021, and is located<br />
in a predominantly residential area with a large commercial and industrial district. It is located north of the<br />
Denver Central Business District (CBD) near the Platte River Valley, downstream from the Denver urban air<br />
mass. There are three (3) schools in the vicinity of the monitor, Alsup Elementary School to the south, Adams<br />
County Middle School to the east, and Lester Arnold High School to the east. In addition, there is a large<br />
industrial area to the south and east and gravel pits roughly a half mile to the west and northwest. The Birch<br />
Street monitor is part of the State or Local Air Monitoring Stations (SLAMS) Network and is populationoriented<br />
<strong>for</strong> a neighborhood scale.<br />
Welby<br />
The Welby monitor site began operation in 1973 and is located eight (8) miles north-northeast of the Denver<br />
CBD on the bank of the South Platte River. This site is ideally located to measure nighttime drainage of the air<br />
mass from the Denver metropolitan area and the thermally driven daytime upriver flows (CDPHE 2021). In<br />
addition, according to APCD, monitoring at this location shows that high carbon monoxide (CO) levels are<br />
associated with winds from the south-southwest (CDPHE 2021). The Welby monitor is also part of the SLAMS<br />
Network and is population-oriented <strong>for</strong> a neighborhood scale.<br />
Inactive Monitor Sites Located Within the Vicinity of <strong>Commerce</strong> <strong>City</strong><br />
Tri-County Health Department – <strong>Commerce</strong> <strong>City</strong><br />
The Tri-County Health Department - <strong>Commerce</strong> <strong>City</strong> site was relocated to the Adams County Birch Street<br />
site on November 2, 2020, due to a roofing project and accessibility issues at the property during 2020.<br />
As previously discussed, the pollutant concentrations recorded in this memo were retrieved from the Colorado<br />
APCD 2021 Ambient Air Monitoring Network <strong>Plan</strong> <strong>for</strong> RY 2020. There<strong>for</strong>e, the pollutant concentrations<br />
presented in this memo are <strong>for</strong> the Tri-County Health Department – <strong>Commerce</strong> <strong>City</strong> and Welby monitor<br />
locations, respectively. In addition, the Birch Street monitor pollutant concentrations <strong>for</strong> 2021 will be recorded<br />
in Colorado APCD 2022 Ambient Air Monitoring Network <strong>Plan</strong>.<br />
Pollutants Monitored at Sites Within the Vicinity of <strong>Commerce</strong> <strong>City</strong><br />
Carbon Monoxide (CO)<br />
As of 2020, the APCD operated one (1) CO monitor within the vicinity of <strong>Commerce</strong> <strong>City</strong> located in Welby.<br />
The current National Ambient Air Quality Standards (NAAQS) <strong>for</strong> CO, primary standard only, has a<br />
concentration level of nine (9) parts per million (ppm) in an eight-hour period or 35 ppm in a one-hour period.<br />
CO does not currently have a secondary standard. Since 1973, CO levels have declined from a statewide<br />
Technical Memorandum<br />
Existing and Potential Ambient Air Monitoring Network in <strong>Commerce</strong> <strong>City</strong> Page 2<br />
191
maximum eight-hour value of 48.1 ppm to 2.0 ppm in 2020 (CDPHE 2021). The Welby monitor site has not<br />
recorded an exceedance of either the one-hour or eight-hour CO standard since January 1988 (CDPHE, 2021).<br />
Mobile sources (primarily vehicles) are the main contributor to elevated CO levels in <strong>Commerce</strong> <strong>City</strong> (CDPHE<br />
2021). Additional sources include controlled burns, wildfires, and biogenic influences, including oil and gas<br />
development (CDPHE 2021). CO National Ambient Air Quality Standards (NAAQS) standards and maximum<br />
one-hour and eight-hour CO concentrations recorded in 2020 at the Welby monitor site can be found in<br />
Tables 3 and 4, respectively.<br />
Table 3.<br />
CO NAAQS Standards<br />
Pollutant<br />
Source: U.S. EPA 2021<br />
CO 1-Hour<br />
Primary Standard (ppm) 1<br />
CO 8-Hour<br />
Primary Standard (ppm) 1<br />
CO 35 9<br />
1. Not to be exceeded more than once per year.<br />
Table 4.<br />
CO Values Recorded at the Welby Monitor Site<br />
Site Name<br />
Source: CDPHE 2021<br />
Ozone (O 3)<br />
CO 1-Hour<br />
Average (ppm)<br />
CO 8-Hour<br />
Average (ppm)<br />
1 st Max 2 nd Max 1 st Max 2 nd Max<br />
Welby 1.9 1.9 1.2 1.2<br />
As of 2020, the APCD operated one (1) O 3 monitor within the vicinity of <strong>Commerce</strong> <strong>City</strong> located in Welby.<br />
The current NAAQS <strong>for</strong> O 3 , both primary and secondary standards, has a concentration level not to exceed<br />
70 parts per billion (ppb) in an eight-hour time period. The United States Environmental Protection Agency<br />
(US EPA) state monitoring requirements <strong>for</strong> O 3 include placing a certain number of monitors in areas with high<br />
populations. For example, in Metropolitan Statistical Areas (MSAs) with a population of 350,000 – 4,000,000<br />
people, the US EPA recommends the placement of at least two (2) monitors in areas with design value<br />
concentrations that are greater than or equal to 85% of the O 3 standard and one (1) monitor in areas with<br />
design value concentrations that are less than or equal to 85% of the O 3 standard (CDPHE 2021).<br />
<strong>Commerce</strong> <strong>City</strong> is part of the Denver-Aurora-Lakewood Primary Metropolitan Statistical Area (PMSA), with a<br />
population of 2,963,821 as of the 2020 United States census (US Census 2021). Welby has not recorded an<br />
exceedance of either the one-hour or eight-hour O 3 standard since 1998 (CDPHE 2021). However, the trend<br />
in the 3-year average of the 4 th maximum eight-hour average has been increasing since 2002 (CDPHE 2021).<br />
Major sources of Nitrous Oxides (NO x ) and Volatile Organic Compounds (VOCs) in the atmosphere originate<br />
from emissions from industrial facilities and electric utilities, oil and gas development, vehicle exhaust, gasoline<br />
vapors, and chemical solvents (CDPHE, 2021). In the presence of sunlight, NO x and VOCs chemically react to<br />
<strong>for</strong>m ground-level ozone. O 3 NAAQS standards and first and fourth maximum eight-hour O 3 concentrations<br />
recorded in 2020 at the Welby monitor site can be found in Tables 5 and 6, respectively. Additionally, the<br />
current three-year design value <strong>for</strong> the Welby monitor site is listed.<br />
Technical Memorandum<br />
Existing and Potential Ambient Air Monitoring Network in <strong>Commerce</strong> <strong>City</strong> Page 3<br />
192
Table 5.<br />
O 3 NAAQS Standards<br />
Pollutant<br />
Source: U.S. EPA 2021<br />
O 3 8-Hour<br />
Primary & Secondary Standard (ppb) 1<br />
O 3 70<br />
1.<br />
Annual fourth-highest daily maximum 8-hour concentration, averaged over three (3) years.<br />
Table 6.<br />
O 3 Values Recorded at the Welby Monitor Site<br />
Site Name<br />
O 3 8-Hour<br />
Average (ppb)<br />
1 st Max 4 th Max 3-Year Ave. of 4 th Max. 8-Hr<br />
Welby 86 78 69<br />
Source: CDPHE APCD 2021<br />
Nitrogen Dioxide (NO 2)<br />
As of 2020, APCD operated one (1) NO 2 monitor within the vicinity of <strong>Commerce</strong> <strong>City</strong> located in Welby. The<br />
current NAAQS <strong>for</strong> NO 2 , both primary and secondary, is a 1-hour standard at a level of 100 ppb based on the<br />
3-year average of 98th percentile of the yearly distribution of 1-hour maximum daily concentrations and an<br />
annual standard at a level of 53 ppb. As of 2020, the Welby monitor has never exceeded the NO 2 annual<br />
average NAAQS of 53 ppb or the one-hour NAAQS of 100 ppb.<br />
The <strong>for</strong>mation of NO 2 in the atmosphere occurs primarily from fuel-burning, such as combustion from cars,<br />
trucks and buses, power plants, and off-road equipment. NO 2 NAAQS standards and the annual mean and 98 th<br />
percentile one-hour NO 2 concentrations recorded in 2020 at the Welby monitor site can be found in Tables<br />
7 and 8, respectively.<br />
Table 7.<br />
NO 2 NAAQS Standards<br />
Pollutant<br />
Source: U.S. EPA 2021<br />
NO 2 1-Hour<br />
Primary Standard (ppb) 1<br />
NO 2 1-Year<br />
Primary & Secondary Standard<br />
(ppb) 2<br />
NO 2 100 53<br />
1.<br />
98 th percentile of 1-hour maximum daily concentrations, averaged over three (3) years.<br />
2.<br />
Annual mean<br />
Table 8.<br />
NO 2 Values Recorded at the Welby Monitor Site<br />
Site Name<br />
NO 2 (ppb)<br />
Annual Mean 98 th Percentile 3-Year Ave. of 98 th Percentile<br />
Welby 15.5 57.3 60<br />
Source: CDPHE APCD 2021<br />
Technical Memorandum<br />
Existing and Potential Ambient Air Monitoring Network in <strong>Commerce</strong> <strong>City</strong> Page 4<br />
193
Sulfur Dioxide (SO 2)<br />
As of 2020, the APCD operated one (1) SO 2 monitor within the vicinity of <strong>Commerce</strong> <strong>City</strong> located in Welby.<br />
The current primary NAAQS <strong>for</strong> SO 2 , established in 2010, is 75 ppb based on the 3-year average of the 99 th<br />
percentile of the yearly distribution of 1-hour maximum daily concentrations. The current secondary NAAQS<br />
<strong>for</strong> SO 2 , retained in 2012, is 500 ppb average over three hours, not to be exceeded more than once per year.<br />
US EPA NAAQS <strong>for</strong> SO 2 are designed to protect against exposure to the entire group of sulfur oxides (SO X )<br />
(CDPHE, 2021). The <strong>for</strong>mation of SO 2 present in the atmosphere occurs primarily from the burning of fossil<br />
fuels by power plants and other industrial facilities (CDPHE, 2021). SO 2 NAAQS standards and the annual<br />
mean and 99 th percentile one-hour daily maximum concentrations recorded in 2020 at the Welby monitor site<br />
can be found in Tables 9 and 10, respectively.<br />
Table 9.<br />
SO 2 NAAQS Standards<br />
Pollutant<br />
Source: U.S. EPA 2021<br />
SO 2 1-Hour<br />
Primary Standard (ppb) 1<br />
SO 2 3-Hours<br />
Secondary Standard (ppm) 2<br />
SO 2 75 0.5<br />
1.<br />
99 th percentile of 1-hour maximum daily concentrations, averaged over three (3) years<br />
2.<br />
Not to be exceeded more than once per year<br />
Table 10.<br />
SO 2 Values Recorded at the Welby Monitor Site<br />
Site Name<br />
Source: CDPHE 2021<br />
SO 2 (ppb)<br />
Annual Mean 99 th Percentile 3-Year Ave. of 99 th Percentile<br />
Welby 0.69 6 9<br />
Particulate Matter (PM)<br />
As of 2020, the APCD operated two (2) PM 10 monitors and one (1) PM 2.5 monitor within the vicinity of<br />
<strong>Commerce</strong> <strong>City</strong>, located at Tri-County and Welby. The current primary NAAQS <strong>for</strong> PM 10 , retained in 2020,<br />
is 150 micrograms per cubic meter (μg/m 3 ) based on 24-hour standards with one allowed exceedance. The<br />
current primary and secondary NAAQS <strong>for</strong> PM 2.5 , retained in 2020, are annual average standards with levels of<br />
12.0 μg/m 3 and 15.0 μg/m 3 , respectively, and 35 μg/m 3 24-hour standard with 98 th percentile <strong>for</strong>ms and levels.<br />
The <strong>for</strong>mation of PM in the atmosphere results from complex reactions of chemicals such as SO 2 and NO 2<br />
<strong>for</strong>med from power plants, industries, and automobiles (CDPHE, 2021). Additionally, some PM is emitted<br />
directly from a fugitive dust source, such as construction sites, unpaved roads, fields, smokestacks, or fires.<br />
PM 10/2.5 NAAQS standards and the annual mean and 99 th percentile one-hour maximum daily concentrations<br />
recorded in 2020 at the Tri-County and Welby monitor sites can be found in Tables 11, 12, and 13, respectively.<br />
Technical Memorandum<br />
Existing and Potential Ambient Air Monitoring Network in <strong>Commerce</strong> <strong>City</strong> Page 5<br />
194
Table 11.<br />
PM 10/2.5 NAAQS Standards<br />
Pollutant<br />
PM 10 24-Hours<br />
Primary &<br />
Secondary<br />
Standard (μg/m 3 ) 1<br />
PM 2.5 24-Hours<br />
Primary &<br />
Secondary<br />
Standard (μg/m 3 ) 2<br />
PM 2.5 1-Year<br />
Primary Standard<br />
(μg/m 3 ) 3<br />
PM 2.5 1-Year<br />
Secondary<br />
Standard (μg/m 3 ) 4<br />
PM 10 150 - - -<br />
PM 2.5 - 35 12.0 15.0<br />
Source: U.S. EPA 2021<br />
1.<br />
Not to be exceeded more than once per year on average over three (3) years<br />
2.<br />
98 th percentile, averaged over three (3) years<br />
3.<br />
Annual mean, averaged over three (3) years<br />
4.<br />
Annual mean, averaged over three (3) years<br />
Table 12.<br />
PM 10 Values Recorded at the Tri-County and Welby Monitor Sites<br />
Site Name<br />
PM 10 (μg/m 3 )<br />
Annual Average 24-Hr Max 3-Year Exceedances<br />
Tri-County 36.6 139 0<br />
Welby 34.8 111 0<br />
Source: CDPHE 2021<br />
Table 13.<br />
PM 2.5 Values Recorded at the Tri-County Monitor Site<br />
Site Name<br />
Annual Average<br />
PM 2.5 (μg/m 3 )<br />
Annual 98 th<br />
Percentile<br />
3-Year Ave. of 98 th<br />
Percentile<br />
Tri-County 9.8 27.8 26<br />
Source: CDPHE 2021<br />
Monitoring Per<strong>for</strong>med by Third Parties<br />
Cultivando<br />
Cultivando is currently implementing a continuous monitoring network surrounding the Suncor oil refinery to<br />
characterize air pollution and the resulting health and societal impacts. There<strong>for</strong>e, all in<strong>for</strong>mation listed within<br />
this section is preliminary and could be subject to change as the monitoring network has not been implemented<br />
yet. Two (2) air pollution monitoring and reporting plat<strong>for</strong>ms will be deployed: one (1) fixed monitor within<br />
one-fourth mile of the refinery to characterize source emissions and one (1) mobile van deployed in adjacent<br />
neighborhoods to evaluate the community's exposure to the refinery's emissions. The monitoring data gathered<br />
from both sites will be processed in real-time <strong>for</strong> posting within minutes to a public web portal. Cultivando is<br />
confident this monitoring ef<strong>for</strong>t, once developed, will represent the most comprehensive air monitoring<br />
program conducted of the Suncor oil refinery and one of the most comprehensive air monitoring programs in<br />
the state.<br />
Technical Memorandum<br />
Existing and Potential Ambient Air Monitoring Network in <strong>Commerce</strong> <strong>City</strong> Page 6<br />
195
Monitored pollutants will include Ozone, Methane, VOCs (including the classes of hazardous air pollutants<br />
(HAPs) and BTEX species (Benzene, Toluene, Ethylbenzene, and Xylenes), Hydrogen Cyanide, Carbon<br />
Monoxide, Carbon Dioxide, Sulfur Dioxide, Dimethylsulfide, Nitric Oxide, Nitrogen Dioxide, Particulate<br />
Matter, and airborne radioactivity.<br />
Suncor Energy<br />
Suncor has developed an air monitoring program, <strong>Commerce</strong> <strong>City</strong> North Denver (CCND) Air Monitoring, in<br />
a coordinated and collaborative manner with existing air monitoring networks in the <strong>Commerce</strong> <strong>City</strong> and<br />
North Denver communities. Suncor has contracted Montrose Air Quality Services, LLC (Montrose) to deploy,<br />
maintain, and operate CCND Air Monitoring around their operations facilities and local communities to<br />
provide real-time air quality data. Deployment of the network was completed on August 3, 2021, and includes<br />
a network of air pollution sensor technology redeveloped with solar power capabilities, battery storage, and<br />
data connectivity. The network currently consists of eight (8) separate monitoring locations with measurement<br />
data transmitted to a plat<strong>for</strong>m dashboard—the dashboard displays near real-time data and recent alerts.<br />
In<strong>for</strong>mation on the equipment deployed and community monitor locations can be found in Tables 14 and 15,<br />
respectively.<br />
In addition to the CCND Air Monitoring, Montrose will periodically deploy a mobile lab to specific sensitive<br />
neighborhoods capable of detecting ethane, ethene, propane, benzene, toluene, ethylbenzene, xylene (BTEX),<br />
etc. and hydrogen cyanide.<br />
Table 14. Summary of Equipment<br />
Equipment Model<br />
Canary-S<br />
AQMesh Pod<br />
AQM65<br />
Summa Canisters<br />
Pollutant/Parameter<br />
Total VOC (TVOC), PM 2.5 , Ambient Temperature, Relative<br />
Humidity, Wind Speed, and Direction<br />
SO 2 , CO, NO, NO 2 & H 2 S<br />
TVOC, SO 2 , CO, NO, NO 2 , H 2 S, PM 2.5 , Ambient Temperature,<br />
and Relative Humidity<br />
Speciated VOC<br />
Source: Montrose 2021<br />
Table 25. Summary of Deployment<br />
Location Facility Address Equipment<br />
Community Monitoring<br />
Site 1<br />
Rose Hill Elementary<br />
6900 E 58 th Ave<br />
Canary-S<br />
AQMesh<br />
Community Monitoring<br />
Site 2<br />
Suncor – Refinery<br />
Business Center<br />
5801 Brighton Blvd<br />
Canary-S<br />
AQMesh<br />
AQM65<br />
Community Monitoring<br />
Site 3<br />
Adams <strong>City</strong> High School<br />
7200 Quebex Pkwy<br />
Canary-S<br />
AQMesh<br />
Technical Memorandum<br />
Existing and Potential Ambient Air Monitoring Network in <strong>Commerce</strong> <strong>City</strong> Page 7<br />
196
Location Facility Address Equipment<br />
Community Monitoring<br />
Site 4<br />
Adams <strong>City</strong> Middle<br />
School<br />
4451 E 72 nd Ave<br />
Canary-S<br />
AQMesh<br />
Community Monitoring<br />
Site 5<br />
Central Elementary<br />
School<br />
6450 Holly St<br />
Canary-S<br />
AQMesh<br />
Community Monitoring<br />
Site 6<br />
Focus Point Family<br />
Resource Center<br />
2501 E 48 th Ave<br />
Canary-S<br />
AQMesh<br />
AQM65<br />
Community Monitoring<br />
Site 7<br />
Kearney Middle School<br />
6160 Kearney St<br />
Canary-S<br />
AQMesh<br />
AQM65<br />
Community Monitoring<br />
Site 8<br />
Suncor – Monroe St<br />
Property<br />
6599-6401 Monroe St<br />
Canary-S<br />
AQMesh<br />
Source: Montrose 2021<br />
<strong>Commerce</strong> <strong>City</strong> Monitoring Potential Network Locations<br />
With consideration of the existing and upcoming monitoring detailed above, Pinyon recommends that<br />
<strong>Commerce</strong> <strong>City</strong> install 20 additional air monitors within city limits (see Figure 2). These locations are based on<br />
gaps identified in areas of <strong>Commerce</strong> <strong>City</strong> not currently capturing monitoring data. The monitors should collect<br />
measurement data as needed based on location but could include up to the following pollutants: Ozone,<br />
Methane, VOCs, HAPs BTEX, Hydrogen Cyanide, CO, Carbon Dioxide, SO 2 , Dimethylsulfide, Nitric Oxide,<br />
NO 2 , and Particulate Matter. Some pollutants may not be needed depending on the area, but <strong>Commerce</strong> <strong>City</strong><br />
should decide the breadth of the network and its contractor be<strong>for</strong>e deployment. Data from the network of<br />
monitors should be transmitted to the plat<strong>for</strong>m dashboard, which would display near real-time data and alerts,<br />
as applicable. In<strong>for</strong>mation on the equipment deployed and proposed monitor locations can be found in Table<br />
16. Following Table 16 is pertinent in<strong>for</strong>mation specific to the proposed location.<br />
Table 16. Proposed Air Monitor Sites Located Within the Vicinity of <strong>Commerce</strong> <strong>City</strong><br />
Location<br />
Proposed Monitoring Site 1<br />
Proposed Monitoring Site 2<br />
Proposed Monitoring Site 3<br />
Proposed Monitoring Site 4<br />
Proposed Monitoring Site 5<br />
Approximate Monitor Address<br />
8221 E. 96 th Avenue<br />
Intersection at Highway 2 and E. 96 th Avenue<br />
Intersection at E. 104 th Avenue and Potomac Street<br />
9650 Ouray Street<br />
Intersection at E. 96 th Ave and Tower Road<br />
Proposed Monitoring Site 6 9000 E-470<br />
Proposed Monitoring Site 7<br />
Proposed Monitoring Site 8<br />
Intersection at E-470 and E. 96 th Avenue<br />
Intersection at Himalaya Road and E. 110th Avenue<br />
Technical Memorandum<br />
Existing and Potential Ambient Air Monitoring Network in <strong>Commerce</strong> <strong>City</strong> Page 8<br />
197
Location<br />
Proposed Monitoring Site 1<br />
The proposed monitor at 8221 E. 96th Avenue is located in the heavy intensity industrial district (I-3), southeast<br />
of the RK Steel and RK Energy facility. There are three (3) schools in the vicinity, Dupont Elementary School,<br />
approximately two and a half (2.5) miles to the south, and Monterey Elementary and Clayton Partnership<br />
Schools, four (4) miles to the southwest.<br />
Proposed Monitoring Site 2<br />
The proposed monitor is located at Highway 2 and E. 96th Avenue intersection, just outside a large residential<br />
development. The monitor is located within the planned unit development (PUD) zoning district. There are<br />
two (2) schools in the vicinity, Second Creek Elementary School and Stuart Middle School, approximately three<br />
(3) miles to the east from the proposed monitor location.<br />
Proposed Monitoring Site 3<br />
The proposed monitor located at the E. 104th Avenue and Potomac Street intersection is situated just outside<br />
of large residential development. The monitor is located within the PUD zoning district. There are four (4)<br />
schools in the vicinity, Turnberry Elementary School, approximately one-half (0.5) mile northwest, Stuart<br />
Middle School one mile to the southeast, and Second Creek Elementary School one and a half (1.5) miles to<br />
the southeast.<br />
Proposed Monitoring Site 4<br />
The proposed monitor located at 9650 Ouray Street is positioned on the southeast corner of a large residential<br />
development within the PUD zoning district. There are two (2) schools in the vicinity, Second Creek<br />
Elementary School one-half (0.5) mile to the northwest and Stuart Middle School, just under a mile from the<br />
proposed monitor location.<br />
Proposed Monitoring Site 5<br />
Approximate Monitor Address<br />
Proposed Monitoring Site 9 Tower Road Bridge overpass, over E-470<br />
Proposed Monitoring Site 10 E. 120 th Avenue and E-470<br />
Proposed Monitoring Site 11<br />
Proposed Monitoring Site 12<br />
Proposed Monitoring Site 13<br />
Proposed Monitoring Site 14<br />
Proposed Monitoring Site 15<br />
Proposed Monitoring Site 16<br />
Proposed Monitoring Site 17<br />
Proposed Monitoring Site 18<br />
Proposed Monitoring Site 19<br />
Proposed Monitoring Site 20<br />
E .120th Avenue and Buckeye Road<br />
E-470 overpass at Cameron Drive<br />
E. 120 th Avenue and Chambers Road<br />
Highway 2 and Potomac Street<br />
E. 114 th Avenue and Trussville Street<br />
7740 Dahlia Street<br />
Brighton Road and E. 88th Ave<br />
9109 Monaco Street<br />
Brighton Road and E. 112 th Avenue<br />
Havana Street and E. 112 th Avenue<br />
Technical Memorandum<br />
Existing and Potential Ambient Air Monitoring Network in <strong>Commerce</strong> <strong>City</strong> Page 9<br />
198
The proposed monitor located at the E. 96th Ave and Tower Road intersection is situated southeast of several<br />
residential communities and west of the E-470 toll road. The monitor location is within the PUD zoning district<br />
and is approximately two (2) miles from Second Creek Elementary School and Stuart Middle School.<br />
Proposed Monitoring Site 6<br />
The proposed monitor is located south of the E. 96 th Avenue on-ramp to E-470, at 9000 E-470. This monitor<br />
is situated northeast of Tower Landfill and southeast of several residential communities. The monitor location<br />
is positioned within two (2) PUD zoning districts and is approximately three (3) miles southeast of Second<br />
Creek Elementary School and Stuart Middle School.<br />
Proposed Monitoring Site 7<br />
The proposed monitor is located within the PUD zoning district, at the E-470 and E. 96th Avenue intersection.<br />
This monitor is situated on the easternmost portion of the <strong>Commerce</strong> <strong>City</strong> boundary and is approximately<br />
three (3) miles southeast of Second Creek Elementary School and Stuart Middle School.<br />
Proposed Monitoring Site 8<br />
The proposed monitor is located at the Himalaya Road and E. 110th Avenue intersection, to the northeast of<br />
a small residential community. The monitor location is situated approximately two (2) miles to the east of<br />
Reunion Elementary School and three miles northeast of Stuart Middle School and Second Creek Elementary<br />
School.<br />
Proposed Monitoring Site 9<br />
The proposed monitor is located on the Tower Road Bridge overpass, along E-470. This monitor location is<br />
situated between several residential communities and is approximately one (1) mile northeast of Reunion<br />
Elementary School.<br />
Proposed Monitoring Site 10<br />
The proposed monitor is located within the PUD zoning district, at the E. 120th Avenue on-ramp to<br />
northbound E-470. The monitor is situated between several residential communities and one (1) mile to the<br />
north of Reunion Elementary School.<br />
Proposed Monitoring Site 11<br />
The proposed monitor is located at the E. 120th Avenue and Buckeye Road intersection, on the east side of a<br />
residential community. This monitor is approximately one (1) to two (2) miles northeast of the Reunion<br />
Elementary School, Landmark Academy, and the Buffalo Run Golf Course.<br />
Proposed Monitoring Site 12<br />
The proposed monitor is located at the E-470 overpass at Cameron Drive. This monitor is located to the<br />
north of several residential communities and recreational facilities.<br />
Proposed Monitoring Site 13<br />
The proposed monitor located at the E. 120th Avenue and Chambers Road intersection is approximately two<br />
(2) miles northwest of Reunion Elementary School and Landmark Academy. Recreational facilities like HOA<br />
Technical Memorandum<br />
Existing and Potential Ambient Air Monitoring Network in <strong>Commerce</strong> <strong>City</strong> Page 10<br />
199
Park to the north and the Stampede and Villages East Park to the south surround the suggested monitor<br />
location.<br />
Proposed Monitoring Site 14<br />
The proposed monitor located at Highway 2 and Potomac Street intersection is approximately one (1) mile<br />
north of Turnberry Elementary School and two (2) miles northwest of Reunion Elementary, Landmark<br />
Academy, and Rocky Mountain Lutheran High School. Additionally, the proposed monitor is northwest of the<br />
Bison Ridge Recreation Center and southwest of the Stampede and Villages East Parks.<br />
Proposed Monitoring Site 15<br />
The proposed monitor is located just south of <strong>Commerce</strong> <strong>City</strong> limits, at the E. 114th Avenue and Trussville<br />
Street intersection. This proposed monitor is within the PUD zoning district, north of the Denver Fire ARFF<br />
Fire Training Center.<br />
Proposed Monitoring Site 16<br />
The proposed monitor located at 7740 Dahlia Street is just north of <strong>Commerce</strong> <strong>City</strong> limits. It is situated<br />
between Interstate 76 and several industrial facilities. There are two (2) schools in the vicinity, Adams <strong>City</strong><br />
Middle School, approximately one-half (0.5) mile southwest, and Adams <strong>City</strong> High School, just over one and a<br />
half (1.5) miles to the southeast.<br />
Proposed Monitoring Site 17<br />
The proposed monitor located at the Brighton Road and E. 88th Avenue intersection is situated to the north<br />
of a large, manufactured home community.<br />
Proposed Monitoring Site 18<br />
The proposed monitor located at 9109 Monaco Street is located in the medium industrial district (I-2),<br />
southeast of the A1 Organics facility.<br />
Proposed Monitoring Site 19<br />
The proposed monitor located at the Brighton Road and E. 112th Avenue intersection is within the PUD zoning<br />
district, to the southwest of a large residential community. There are three (3) schools in the vicinity, Hazeltine<br />
School, approximately one quarter (0.25) mile southwest, Belle Creek Charter School, one-half (0.5) mile<br />
south, and Thimmig Elementary School, one and a half (1.5) miles northeast.<br />
Proposed Monitoring Site 20<br />
The proposed monitor located at the Havana Street and E. 112th Avenue intersection is within the PUD zoning<br />
district, northwest of several residential communities. There are four (4) schools in the vicinity, Prairie View<br />
High School one (1) mile to the east, Thimmig Elementary School one (1) mile to the southeast, Belle Creek<br />
Charter School two (2) miles to the southwest and Turnberry Elementary School two (2) miles to the<br />
southeast.<br />
Monitoring Hardware and Data<br />
Technical Memorandum<br />
Existing and Potential Ambient Air Monitoring Network in <strong>Commerce</strong> <strong>City</strong> Page 11<br />
200
As presented in the existing and planned air monitoring sections above, many monitors being operated at a<br />
local level (non-EPA monitors) utilize low-cost "fence-post" or "bird-box" monitors that have many advantages.<br />
This monitoring technology is rapidly advancing to approach accuracy levels that rival EPA reference method<br />
monitors. Additionally, these low-cost monitors are more portable. They can have pollutant sensors added and<br />
removed from them that provide flexibility that is advantageous to municipalities like <strong>Commerce</strong> <strong>City</strong>, allowing<br />
<strong>for</strong> quick response to public air quality concerns or industrial pollutant releases.<br />
This memo recommends that low-cost monitors be combined with a real-time data plat<strong>for</strong>m that provides<br />
user-friendly numeric and graphical displays <strong>for</strong> public access. These displays can better in<strong>for</strong>m the community<br />
when the general population or those with higher high-risk conditions (such as asthma) should limit or adjust<br />
outdoor activities.<br />
Pinyon will recommend specific monitors, data plat<strong>for</strong>ms, and associated costs after collaboration with<br />
<strong>Commerce</strong> <strong>City</strong> regarding specific needs and funding.<br />
Summary and Conclusions<br />
This Existing and Potential Ambient Air Monitoring Technical Memorandum has been developed to provide<br />
<strong>Commerce</strong> <strong>City</strong> with the in<strong>for</strong>mation they need to potentially install a monitoring network that would provide<br />
the <strong>City</strong> with ambient air data focused mainly in areas in the <strong>City</strong> that are not currently collecting data. The<br />
monitoring network's purpose would be to provide citizens with air quality data. This plan is meant to provide<br />
the <strong>City</strong> with a base of in<strong>for</strong>mation that can be tailored to specific pollutants or areas that the <strong>City</strong> underscores<br />
the need <strong>for</strong>.<br />
As described above, ambient air monitoring is currently taking place, with plans <strong>for</strong> additional monitoring<br />
upcoming. But there are areas of the <strong>City</strong>, as seen in Figure 1, that do not currently have monitors or plans <strong>for</strong><br />
monitors in the near future.<br />
Technical Memorandum<br />
Existing and Potential Ambient Air Monitoring Network in <strong>Commerce</strong> <strong>City</strong> Page 12<br />
201
References<br />
Colorado Air Quality Department of Public Health & Environment (CDPHE), 2021. 2021 Ambient Air Monitoring<br />
Network <strong>Plan</strong>. Accessed from: https://www.colorado.gov/airquality/tech_doc_repository.aspx.<br />
Montrose Air Quality Services (Montrose), 2021. Quality Assurance Project <strong>Plan</strong> Suncor Energy (USA) – <strong>Commerce</strong><br />
<strong>City</strong> Refinery Ambient Air Monitoring Program <strong>Commerce</strong> <strong>City</strong>, Colorado. Accessed from: https://www.ccndair.com/Documents/.<br />
United States Environmental Protection Agency (U.S. EPA), 2021. NAAQS Table. Accessed from:<br />
https://www.epa.gov/criteria-air-pollutants/naaqs-table.<br />
United States Census Bureau, 2019. Metropolitan and Micropolitan Statistical Areas Population Totals and<br />
Components of Change: 2010-2019. Accessed from: https://www.census.gov/data/tables/timeseries/demo/popest/2010s-total-metro-and-micro-statistical-areas.html<br />
Technical Memorandum<br />
Existing and Potential Ambient Air Monitoring Network in <strong>Commerce</strong> <strong>City</strong> Page 13<br />
202
Key Map<br />
Legend<br />
Study Area (Half Mile Buffer)<br />
<strong>Commerce</strong> <strong>City</strong> Boundary<br />
!(<br />
CDPHE Air Pollution Control<br />
Division<br />
!( Suncor Energy<br />
!(<br />
!( !(<br />
!(<br />
!(<br />
!(<br />
!(<br />
!(<br />
!(<br />
!(<br />
I<br />
0 1 2<br />
Miles<br />
AIR QUALITY MONITORS<br />
Air Quality<br />
<strong>Commerce</strong> <strong>City</strong> Environmental Services<br />
<strong>Commerce</strong> <strong>City</strong>, Colorado<br />
Site Location: Adams County, Colorado, USA<br />
Pinyon Project Number: 1/21-1435-01<br />
Document Path: Z:\PROJECTS\2021\121143501 <strong>Commerce</strong> <strong>City</strong> Environmental Consulting Services\Figures\ArcPro\<strong>Commerce</strong> <strong>City</strong> WQ_AQ.aprx<br />
Drawn By: JF<br />
Reviewed By: DC<br />
Figure: 1<br />
Date: 9/21/2021<br />
203
Key Map<br />
!(<br />
!(<br />
!(<br />
!(<br />
!(<br />
!(<br />
!(<br />
!(<br />
!(<br />
!(<br />
Legend<br />
Study Area (Half Mile Buffer)<br />
!(<br />
<strong>Commerce</strong> <strong>City</strong> Boundary<br />
!( Suggested Monitor Location<br />
!( !(<br />
!( !(<br />
!(<br />
!(<br />
!(<br />
!(<br />
!(<br />
I<br />
0 1 2<br />
Miles<br />
SUGGESTED MONITORS<br />
Air Quality<br />
<strong>Commerce</strong> <strong>City</strong> Environmental Services<br />
<strong>Commerce</strong> <strong>City</strong>, Colorado<br />
Site Location: Adams County, Colorado, USA<br />
Pinyon Project Number: 1/21-1435-01<br />
Document Path: Z:\PROJECTS\2021\121143501 <strong>Commerce</strong> <strong>City</strong> Environmental Consulting Services\Figures\ArcPro\<strong>Commerce</strong> <strong>City</strong> WQ_AQ.aprx<br />
Drawn By: JF<br />
Reviewed By: DC<br />
Figure: 2<br />
Date: 12/17/2021<br />
204
Attachment A – January 2022 Equipment In<strong>for</strong>mation and Costs Estimates<br />
Introduction<br />
The monitoring equipment recommendation and specifications, along with the current cost estimate, are meant<br />
to represent Pinyon’s recommendation as of January 2022. This recommendation takes into consideration<br />
currently available air monitoring technology, combined with <strong>Commerce</strong> <strong>City</strong>’s financial and technical needs<br />
<strong>for</strong> air monitoring.<br />
Monitoring Equipment<br />
As presented in more detail in the report above, there is a range from high-cost stationary monitors to lowcost<br />
portable “bird-box” or “fence-post” type monitoring sensors. We are recommending that due to<br />
technological advances in the low-cost monitors, including increases in accuracy and reliability, that <strong>Commerce</strong><br />
<strong>City</strong> take advantage of these monitors <strong>for</strong> multiple reasons including cost and location flexibility. EPA Reference<br />
Method monitors should be considered if monitoring data were going to be used to make regulatory decisions<br />
or determine an area’s attainment status.<br />
At this time, Pinyon is recommending the use of monitor sensors and associated equipment developed and<br />
manufactured by QuantAQ, Inc.; a company building these technologically advanced low-cost monitors that<br />
would serve the needs of <strong>Commerce</strong> <strong>City</strong>. QuantAQ builds sensor networks that have advanced machine<br />
learning capabilities allowing them to collect accurate data, while continuously acheiving remote calibrations<br />
and up-keep, limiting in-person maintenance needs and thus cost.<br />
The specific monitors QuantAQ produces (and are itemized in the costs in Table A.1. below) are their<br />
MODULAIR monitors that can be provided with PM 1 , PM 2.5 , and PM 10 size distribution capabilities, a long-term<br />
evolution (LTE) connection, a solar-power package, and 4 gaseous pollutant sensors per monitor. We would<br />
expect to pick and choose pollutant sensors based on nearby pollutant sources to individual locations in<br />
consultation with <strong>Commerce</strong> <strong>City</strong> personnel.<br />
The specifications sheet <strong>for</strong> the MODULAIR product is included with this Attachment.<br />
There are a number of other monitor options that can offer similar equipment capabilities that could be<br />
considered and utilized to meet <strong>Commerce</strong> <strong>City</strong>’s needs.<br />
Monitoring Costs<br />
As requested by <strong>Commerce</strong> <strong>City</strong>, this cost estimate is meant to provide in<strong>for</strong>mation <strong>for</strong> planning purposes,<br />
and is not meant to be taken as a specific quote at this time. It is possible costs could go increase or decrease<br />
depending on the timing when <strong>Commerce</strong> <strong>City</strong> is ready to purchase equipment and implement a monitoring<br />
network. This cost estimate is based on the 20 monitor network presented above, and could be scaled up or<br />
down, as needed.<br />
The costs itemized in Table A.1 below total an estimate of $184,050 <strong>for</strong> a single year of operating the<br />
monitoring network. It’s important to note that if monitors such as these are purchased by the <strong>City</strong>, it is likely<br />
they would be operated more than a single year, and the per monitor or per month costs will go down steadily<br />
after the first year with hardware costs being a one-time capital cost. The $184,050 first year cost breaks down<br />
to an estimated $9,202.50 per monitor, and could roughly be scaled linearly by number of monitors. It is<br />
expected the scaling would be somewhat less per monitor with labor costs of maintaining the monitors and<br />
network not being a full unit increase per monitor.<br />
Technical Memorandum<br />
Existing and Potential Ambient Air Monitoring Network in <strong>Commerce</strong> <strong>City</strong> Page 14<br />
205
Table A.1. Itemized Estimated Monitoring Network Cost<br />
Itemized Cost Description<br />
Cost per<br />
Monitor if<br />
Applicable<br />
Total Cost<br />
20 MODULAIR Monitors With Solar $5,745 $114,900<br />
Added Meteorological Sonic Anemometors $750 $9,900<br />
QuantAQ Cloud and Data Presentation $300 $6,000<br />
Monitor Setup, Startup, Troubleshoot - $12,750<br />
General Monitor Visits <strong>for</strong> Maintenance - $17,500<br />
Data Analysis and Monthly Report Development - $17,000<br />
Meetings and Administration - $6,000<br />
Total Cost <strong>for</strong> One Year $184,050<br />
Technical Memorandum<br />
Existing and Potential Ambient Air Monitoring Network in <strong>Commerce</strong> <strong>City</strong> Page 15<br />
206
PRODUCT SPECIFICATION SHEET (*pre-release, subject to change)<br />
TM<br />
MODULAIR TM provides real-time estimates of particulate matter concentrations (PM 1<br />
,<br />
PM 2.5<br />
, PM 10<br />
), particle size distribution, and up to five user-selected gas-phase pollutants<br />
(choose from CO, CO 2<br />
, NO, NO 2<br />
,O 3<br />
, SO 2<br />
). Each unit is internet connected and paired with<br />
the QuantAQ Cloud TM . MODULAIR TM is easily deployed as a standalone unit or as part of<br />
a distributed air quality sensor network. Available add-on accessories include<br />
meteorological measurements (wind speed and wind direction via a sonic anemometer)<br />
and a stand-alone solar and battery solution to allow off-grid use.<br />
AIR QUALITY MEASUREMENTS<br />
PARAMETER RANGE ACCURACY<br />
PM 1<br />
, PM 2.5<br />
, PM 10<br />
0 to 2,000 µgm -3 See page 2.<br />
Particle size<br />
distribution<br />
Not yet determined<br />
FEATURES<br />
Ozone 5 ppb or 20%<br />
Carbon Monoxide 40 ppb or 20%<br />
Carbon Dioxide<br />
Not yet determined<br />
Nitrogen Oxide 5 ppb or 20%<br />
Nitrogen Dioxide 6 ppb or 35%<br />
Sulfur Dioxide 5 ppb or 20%<br />
✓<br />
✓<br />
✓<br />
✓<br />
2+ years on-board data storage<br />
Full access to all raw sensor data<br />
No co-location or remote calibration required<br />
5min time resolution (cloud), 5s (on-board)<br />
Temperature<br />
±0.2ºC<br />
Relative Humidity ±2 %<br />
POWER & COMMUNICATION<br />
OPERATING SPECIFICATIONS<br />
PARAMETER<br />
DETAILS<br />
PARAMETER<br />
DETAILS<br />
Power<br />
Weatherproof rating<br />
Communication<br />
Operating temperature<br />
Operating humidity<br />
Data<br />
Dimensions<br />
Weight<br />
Contact sales@quant-aq.com <strong>for</strong> more in<strong>for</strong>mation.<br />
© 2021 QuantAQ Inc. All rights reserved. All trademarks are property<br />
of QuantAQ Inc unless otherwise specified.<br />
207
PRODUCT SPECIFICATION SHEET<br />
TM<br />
MEASUREMENT ERROR - Particulates¹<br />
Time Interval PM 1<br />
PM 2.5<br />
PM 10<br />
5min<br />
R2 = 0.875, CV MAE<br />
= 0.30<br />
MAE = 2.9 µgm -3<br />
N/A<br />
N/A<br />
1h<br />
R2 = 0.899, CV MAE<br />
= 0.29<br />
R2 = 0.936, CV MAE<br />
= 0.14<br />
R2 = 0.810, CV MAE<br />
= 0.32<br />
MAE = 2.8 µgm -3 MAE = 1.3 µgm -3 MAE = 7.6 µgm -3<br />
24h<br />
R2 = 0.919, CV MAE<br />
= 0.26<br />
R2 = 0.967, CV MAE<br />
= 0.12<br />
R2 = 0.874, CV MAE<br />
= 0.31<br />
MAE = 2.4 µgm -3 MAE = 1.2 µgm -3 MAE = 7.6 µgm -3<br />
¹All statistics were determined via co-location experiments with research and/or regulatory-grade instruments such as the TSI SMPS or Teledyne T640 in<br />
environments across the United States. 5min data was not available <strong>for</strong> PM 2.5<br />
and PM 10<br />
. The coefficient of determination (R2) describes how well the<br />
MODULAIR-PM predicts the desired outcome. The mean absolute error (MAE) describes the measure of error between the observed and predicted<br />
values. The coefficient of variation of the mean absolute error (CV MAE<br />
) can be thought of as a ‘percent error’ as a function of the MAE. This table was last<br />
updated in April of 2021.<br />
MEASUREMENT ERROR - Gases²<br />
Time Interval CO CO 2<br />
NO NO 2<br />
O 3<br />
SO 2<br />
5min<br />
CV MAE<br />
= 0.16<br />
MAE = 40 ppb<br />
MAE = 35 ppm<br />
CV MAE<br />
= 0.37<br />
MAE = 3.1 ppb<br />
CV MAE<br />
= 0.48<br />
MAE = 6.0 ppb<br />
CV MAE<br />
= 0.16<br />
MAE = 4.0 ppb<br />
MAE = 3.3 ppb*<br />
15min<br />
CV MAE<br />
= 0.15<br />
MAE = 37 ppb<br />
NA<br />
CV MAE<br />
= 0.34<br />
MAE = 2.8 ppb<br />
CV MAE<br />
= 0.48<br />
MAE = 5.9 ppb<br />
CV MAE<br />
= 0.15<br />
MAE = 3.9 ppb<br />
NA<br />
60min<br />
CV MAE<br />
= 0.14<br />
MAE = 36 ppb<br />
NA<br />
CV MAE<br />
= 0.32<br />
MAE = 2.6 ppb<br />
CV MAE<br />
= 0.47<br />
MAE = 5.8 ppb<br />
CV MAE<br />
= 0.15<br />
MAE = 3.7 ppb<br />
NA<br />
²All statistics were determined via co-location experiments with research and/or regulatory-grade instruments in realistic environments across the United<br />
States.The mean absolute error (MAE) describes the measure of error between the observed and predicted values. The coefficient of variation of the<br />
mean absolute error (CV MAE<br />
) can be thought of as a ‘percent error’ as a function of the MAE. This table was last updated in April of 2021. Gases marked<br />
as “NA” do not yet have enough data to be listed. Please check back <strong>for</strong> updates.<br />
*Results are from Hagan, et al (2018), Calibration and assessment of electrochemical air quality sensors by co-location with regulatory-grade instruments,<br />
Atmos. Meas. Tech.<br />
Contact sales@quant-aq.com <strong>for</strong> more in<strong>for</strong>mation.<br />
© 2021 QuantAQ Inc. All rights reserved. All trademarks are property<br />
of QuantAQ Inc unless otherwise specified.<br />
208
Appendix B. AQ and WQ<br />
Technical Documents<br />
July 31, 2022<br />
Modeling Thresholds Report<br />
<strong>Commerce</strong> <strong>City</strong> Environmental Consulting Services<br />
7887 East 60th Avenue<br />
<strong>Commerce</strong> <strong>City</strong>, Colorado<br />
Prepared <strong>for</strong>:<br />
<strong>City</strong> of <strong>Commerce</strong> <strong>City</strong><br />
7887 East 60th Avenue<br />
<strong>Commerce</strong> <strong>City</strong>, CO 80022<br />
Pinyon Project No.:<br />
1/21-1435-01<br />
209
July 31, 2022<br />
Modeling Thresholds Report<br />
<strong>Commerce</strong> <strong>City</strong> Environmental Consulting Services<br />
7887 East 60th Avenue<br />
<strong>Commerce</strong> <strong>City</strong>, Colorado<br />
Prepared <strong>for</strong>:<br />
<strong>City</strong> of <strong>Commerce</strong> <strong>City</strong><br />
7887 East 60th Avenue<br />
<strong>Commerce</strong> <strong>City</strong>, CO 80022<br />
Pinyon Project No.:<br />
1/21-1435-01<br />
Prepared by:<br />
___________________________<br />
Kaitlin Meszaros<br />
Reviewed by:<br />
___________________________<br />
Dustin Collins<br />
210
Table of Contents<br />
Executive Summary ..................................................................................................................................................................... 1<br />
1. Introduction and Purpose ................................................................................................................................................ 2<br />
2. Pollutants of Concern ....................................................................................................................................................... 3<br />
3. Guidelines <strong>for</strong> Air Quality Significance Analysis ......................................................................................................... 7<br />
3.1 Screening Modeling Methodology ...................................................................................................................... 7<br />
3.1.1 Emissions Thresholds ............................................................................................................................ 7<br />
3.1.2 Acceptable Screening Models .............................................................................................................. 8<br />
3.1.3 Impacts Thresholds ................................................................................................................................ 8<br />
3.1.4 Cumulative Analysis Requirements ..................................................................................................10<br />
3.2 Refined Modeling Methodology ........................................................................................................................10<br />
3.2.1 Emissions Thresholds ..........................................................................................................................10<br />
3.2.2 Acceptable Refined Models ................................................................................................................10<br />
3.2.3 Impacts Thresholds ..............................................................................................................................10<br />
3.2.4 Cumulative Analysis Requirements ..................................................................................................10<br />
3.3 Secondary Impacts Methodology .....................................................................................................................11<br />
3.3.1 Emissions Thresholds ..........................................................................................................................11<br />
3.3.2 Acceptable Secondary Impacts Tools ..............................................................................................11<br />
3.3.3 Impacts Thresholds ..............................................................................................................................12<br />
3.3.4 Cumulative Analysis Requirements ..................................................................................................12<br />
4. Mitigation Recommendations ........................................................................................................................................13<br />
Tables<br />
Table 2-1. National Ambient Air Quality Standards........................................................................................................ 4<br />
Table 2-2. Significant Impact Levels ..................................................................................................................................... 5<br />
Table 2-3. Toxic Air Pollutant Threshold Limit Values .................................................................................................. 6<br />
Table 3-1. Emissions Thresholds <strong>for</strong> Screening ................................................................................................................ 7<br />
Table 3-2. Significant Impact Levels <strong>for</strong> Primary Pollutants ........................................................................................... 8<br />
Table 3-3. Toxic Screening Levels ........................................................................................................................................ 9<br />
Table 3-4. Emissions Thresholds <strong>for</strong> Screening ..............................................................................................................11<br />
Table 3-5. Significant Impact Levels <strong>for</strong> Secondary Pollutants ....................................................................................12<br />
<strong>Commerce</strong> <strong>City</strong> Modeling Thresholds Report<br />
<strong>Commerce</strong> <strong>City</strong> Environmental Consulting Services<br />
7887 East 60 th Avenue, <strong>Commerce</strong> <strong>City</strong>, Colorado 80022 Page i<br />
211
Figures<br />
Figure 1<br />
Air Quality Significance Evaluation Flowchart<br />
<strong>Commerce</strong> <strong>City</strong> Modeling Thresholds Report<br />
<strong>Commerce</strong> <strong>City</strong> Environmental Consulting Services<br />
7887 East 60 th Avenue, <strong>Commerce</strong> <strong>City</strong>, Colorado 80022 Page ii<br />
212
Executive Summary<br />
Pinyon Environmental, Inc. (Pinyon) has completed a Modeling Thresholds Report <strong>for</strong> the <strong>City</strong> of <strong>Commerce</strong><br />
<strong>City</strong> (<strong>Commerce</strong> <strong>City</strong>) to establish levels of air quality significance that recommend further evaluation and<br />
analysis to determine the potential <strong>for</strong> human health and environmental impacts. The report details pollutants<br />
of concern including criteria pollutants, precursors <strong>for</strong> criteria pollutants, and toxic pollutants that may occur<br />
within the <strong>Commerce</strong> <strong>City</strong> boundary and where scientific literature has provided health impact levels. The<br />
document then provides steps <strong>for</strong> <strong>Commerce</strong> <strong>City</strong> to evaluate the potential air quality impacts of future<br />
projects and plans, which could determine the need <strong>for</strong> mitigation or emissions reduction. The steps can be<br />
described as a type of flow chart beginning with an emissions threshold <strong>for</strong> which screening would be<br />
recommended, to acceptable screening methods <strong>for</strong> a screening single-source analysis, to impacts thresholds<br />
<strong>for</strong> which a screening cumulative analysis would be recommended, and then impacts thresholds <strong>for</strong> which<br />
refined modeling would be recommended. Then similarly, the document details the same <strong>for</strong>mat <strong>for</strong> refined<br />
modeling as is done <strong>for</strong> screening modeling. Lastly, due to the nonattainment status <strong>for</strong> the area in and<br />
surrounding <strong>Commerce</strong> <strong>City</strong>, steps <strong>for</strong> evaluating secondary pollutants such as ozone (O 3 ) are included based<br />
on approved methodologies. Concluding the report are recommendations <strong>for</strong> <strong>Commerce</strong> <strong>City</strong> to consider as<br />
means to propose mitigation <strong>for</strong> those projects that demonstrate a potential to have air quality impacts near<br />
or above thresholds of health concern.<br />
This report and recommendations are meant to provide technical in<strong>for</strong>mation to support <strong>Commerce</strong> <strong>City</strong> with<br />
potential policy recommendations that are a future deliverable to be submitted to <strong>Commerce</strong> <strong>City</strong>.<br />
Additionally, future work will be conducted to create modeling guidance <strong>for</strong> <strong>Commerce</strong> <strong>City</strong> which will detail<br />
appropriate modeling methodologies, assumptions, and results analysis <strong>for</strong> the mentioned screening and refined<br />
models in this document.<br />
A revision to the document was made in July of 2022 following revised modeling guidance from the Colorado<br />
Department of Public Health and Environment (CDPHE) in May of 2022. The revisions include clarification on<br />
modeling thresholds, when cumulative analyses are triggered, and other editorial updates.<br />
<strong>Commerce</strong> <strong>City</strong> Modeling Thresholds Report<br />
<strong>Commerce</strong> <strong>City</strong> Environmental Consulting Services<br />
7887 East 60 th Avenue, <strong>Commerce</strong> <strong>City</strong>, Colorado 80022 Page 1<br />
213
1. Introduction and Purpose<br />
The <strong>City</strong> of <strong>Commerce</strong> <strong>City</strong> (<strong>Commerce</strong> <strong>City</strong>) tasked Pinyon Environmental, Inc. (Pinyon) to create a<br />
Thresholds Report. The Thresholds Report is to provide a <strong>Commerce</strong> <strong>City</strong>-specific document <strong>for</strong> evaluating<br />
new or modified facilities’ air quality significance as it relates to community residents and environment. With<br />
current reliance on the Colorado Department of Public Health (CDPHE) air quality significance screenings and<br />
determinations, <strong>Commerce</strong> <strong>City</strong> determined that additional attention and scrutiny may be required <strong>for</strong> future<br />
projects within the <strong>City</strong>’s boundaries due to community air quality concerns and the continued nonattainment<br />
status of the area <strong>for</strong> ozone.<br />
A review of state and federal requirements was conducted along with a review of best practices <strong>for</strong> determining<br />
air quality significance from other states and air districts within the United States. The scope of air quality<br />
significance evaluations extended beyond current state guidance to include specific toxic air pollutants currently<br />
emitted within the <strong>City</strong>’s boundaries and secondary air pollutants that are <strong>for</strong>med as a result of emissions<br />
within the <strong>City</strong>’s boundaries. From this review, emissions thresholds are proposed <strong>for</strong> any new or modified<br />
project within <strong>Commerce</strong> <strong>City</strong> to conduct impacts screening. This document suggests impacts thresholds to<br />
determine whether a more refined analysis, such as ones required by CDPHE <strong>for</strong> air permit applications, may<br />
be warranted. Lastly, mitigation recommendations are provided to assist <strong>Commerce</strong> <strong>City</strong> in framing potential<br />
options <strong>for</strong> new or modified facilities in the future to reduce emissions and/or pollutant impacts on its residents<br />
and environment.<br />
This document, in conjunction with a future document of air quality modeling guidelines, will better in<strong>for</strong>m and<br />
direct <strong>Commerce</strong> <strong>City</strong> in evaluating future projects within its boundaries to initiate practical discussion with<br />
residents and project proponents as well as potentially mitigating future negative air quality impacts.<br />
<strong>Commerce</strong> <strong>City</strong> Modeling Thresholds Report<br />
<strong>Commerce</strong> <strong>City</strong> Environmental Consulting Services<br />
7887 East 60 th Avenue, <strong>Commerce</strong> <strong>City</strong>, Colorado 80022 Page 2<br />
214
2. Pollutants of Concern<br />
The following list bullets the different pollutants whose emissions that can cause or contribute to ambient air<br />
concentrations that when compared to the standards above can demonstrate a potential harm to human health<br />
or public welfare. These pollutants and the sources and activities that may result in their emissions are detailed<br />
in the Community Impacts Report (Pinyon, 2021). Note, lead is not discussed in detail in this report even<br />
though it is a criteria pollutant. As mentioned in the Community Impacts Report, a lead monitor was taken<br />
offline due to many years of low or zero concentrations.<br />
• Carbon monoxide (CO)<br />
• Nitrogen oxides (NOx)<br />
• Particulate matter less than 10 micrometers in diameter (PM 10 )<br />
• Particulate matter less than 2.5 micrometers in diameter (PM 2.5 )<br />
• Sulfur Dioxide (SO 2 )<br />
• Volatile organic compounds (VOC)<br />
Toxic air pollutants of concern are discussed below based on public concern over the pollutants in and around<br />
the <strong>Commerce</strong> <strong>City</strong> area. This is not a comprehensive list of all pollutants but is meant to include released<br />
pollutants reported to the Colorado Department of Public Health (CDPHE) with public health concern.<br />
• Acetaldehyde<br />
• Benzene<br />
• Ethylbenzene<br />
• Formaldehyde<br />
• Hydrogen cyanide<br />
• Hydrogen sulfide<br />
• n-Hexane<br />
• Toluene<br />
• Xylenes<br />
There are also secondary pollutants that <strong>for</strong>m following chemical reactions in the atmosphere. There are no<br />
direct emissions of these pollutants, however health and environmental standards are developed <strong>for</strong> these<br />
pollutants.<br />
• Ozone (O 3 )<br />
<strong>Commerce</strong> <strong>City</strong> Modeling Thresholds Report<br />
<strong>Commerce</strong> <strong>City</strong> Environmental Consulting Services<br />
7887 East 60 th Avenue, <strong>Commerce</strong> <strong>City</strong>, Colorado 80022 Page 3<br />
215
• Secondary PM 2.5<br />
The Clean Air Act (CAA) provided the United States Environmental Protection Agency (EPA) the authority to<br />
establish National Ambient Air Quality Standards (NAAQS) <strong>for</strong> six criteria pollutants. The NAAQS are<br />
categorized as primary standards which are thresholds <strong>for</strong> public health protection and secondary standards<br />
are thresholds <strong>for</strong> public welfare protection. The NAAQS have been modified and added to since the initial<br />
promulgation of the CAA and the current NAAQS are in Table 2-1.<br />
Table 2-1. National Ambient Air Quality Standards<br />
Pollutant<br />
Carbon Monoxide<br />
(CO)<br />
Lead (Pb)<br />
Nitrogen Dioxide<br />
(NO 2 ) 1<br />
Averaging<br />
Time<br />
Primary<br />
NAAQS<br />
1 hour 35 ppm<br />
8 hours 9 ppm<br />
Rolling 3-<br />
month average<br />
Secondary<br />
NAAQS<br />
Not applicable<br />
Form of Standard<br />
Not to be exceeded<br />
more than once per year<br />
0.15 µg/m 3 0.15 µg/m 3 Not to be exceeded<br />
1 hour 100 ppb Not applicable<br />
98 th percentile of 1-hour<br />
daily maximum, averaged<br />
over 3 years<br />
Annual 53 ppb 53 ppb Annual mean<br />
Ozone (O 3 ) 2 8 hours 70 ppb 70 ppb<br />
Particulate Matter less<br />
than 2.5 microns<br />
(PM 2.5 )<br />
Particulate Matter less<br />
than 10 microns<br />
(PM 10 )<br />
Sulfur Dioxide (SO 2 )<br />
Source: EPA, 2021a<br />
ppm<br />
ppb<br />
µg/m 3<br />
parts per million<br />
parts per billion<br />
micrograms per cubic meter<br />
24 hours 35 µg/m 3 35 µg/m 3<br />
Annual 12 µg/m 3 15 µg/m 3<br />
24 hours 150 µg/m 3 150 µg/m 3<br />
1 hour 75 ppb Not applicable<br />
3 hours Not applicable 0.5 ppm<br />
Annual 4 th highest 8-hour<br />
daily maximum, averaged<br />
over 3 years<br />
98 th percentile, averaged<br />
over 3 years<br />
Annual mean, averaged<br />
over 3 years<br />
Not to be exceeded<br />
more than once per year<br />
on average over 3 years<br />
99 th percentile of 1-hour<br />
daily maximum, averaged<br />
over 3 years<br />
Not to be exceeded<br />
more than once per year<br />
1 The level of the annual NO2 standard is 0.053 ppm. It is shown here in terms of ppb <strong>for</strong> the purposes of clearer<br />
comparison to the 1-hour standard level.<br />
2 Final rule signed October 1, 2015, and effective December 28, 2015. The previous (2008) O3 standards additionally<br />
remain in effect in some areas. Revocation of the previous (2008) O3 standards and transitioning to the current (2015)<br />
<strong>Commerce</strong> <strong>City</strong> Modeling Thresholds Report<br />
<strong>Commerce</strong> <strong>City</strong> Environmental Consulting Services<br />
7887 East 60 th Avenue, <strong>Commerce</strong> <strong>City</strong>, Colorado 80022 Page 4<br />
216
standards will be addressed in the implementation rule <strong>for</strong> the current standards. The standard is presented as 0.070<br />
ppm but is shown in ppb <strong>for</strong> the purposes of clearer comparison to the SIL.<br />
Air quality monitoring data accounting <strong>for</strong> the averaging time and <strong>for</strong>m of the standard are compared against<br />
primary and secondary NAAQS to determine whether an area is in attainment (below the NAAQS) or<br />
nonattainment (at or above the NAAQS) <strong>for</strong> the standard. Areas can be classified as maintenance if they were<br />
previously nonattainment but are currently meeting the NAAQS. Maintenance areas may be redesignated as<br />
attainment after 20 years of no NAAQS exceedances. Currently, <strong>Commerce</strong> <strong>City</strong> is considered in marginal<br />
nonattainment <strong>for</strong> the 2015 O 3 standard and serious nonattainment <strong>for</strong> the 2008 O 3 standard and likely to go<br />
to severe nonattainment <strong>for</strong> the 2008 O 3 standard in 2022 (EPA, 2021b). Also, <strong>Commerce</strong> <strong>City</strong> is considered<br />
a maintenance area <strong>for</strong> CO and PM 10 NAAQS, and the 20-year maintenance periods end in 2022 (EPA, 2021b).<br />
Additionally, EPA has released significant impact levels (SIL) <strong>for</strong> some criteria pollutants. SIL is a threshold which<br />
can help predict when a project impact will be inconsequential. Based on these EPA guidelines, Colorado air<br />
quality regulations (Regulation 3) have identified Prevention of Significant Deterioration (PSD) increments and<br />
SIL levels <strong>for</strong> all minor and major sources. Table 2-2 below shows the Colorado SILs. A SIL is not listed <strong>for</strong> O 3<br />
and there<strong>for</strong>e the EPA recommended value is included (EPA, 2018). Where applicable, the values presented<br />
are <strong>for</strong> Class II areas since <strong>Commerce</strong> <strong>City</strong> is greater than 10 kilometers (approximately 6.2 miles) from a Class<br />
I area. The nearest Class I area is the Rocky Mountain National Park approximately 45 miles to the northeast.<br />
Table 2-2. Significant Impact Levels<br />
Pollutant Averaging Time SIL 1,2<br />
Carbon Monoxide (CO)<br />
Nitrogen Dioxide (NO 2 )<br />
1 hour 2,000 µg/m 3<br />
8 hours 500 µg/m 3<br />
1 hour 7.5 µg/m 3<br />
Annual 1 µg/m 3<br />
Ozone (O 3 ) 3 8 hours 1 ppb<br />
Particulate Matter less than 2.5 microns<br />
(PM 2.5 )<br />
Particulate Matter less than 10 microns (PM 10 )<br />
24 hours 1.2 µg/m 3<br />
Annual 0.2 µg/m 3<br />
24 hours 5 µg/m 3<br />
Annual 1 µg/m 3<br />
1 hour 4 µg/m 3<br />
Sulfur Dioxide (SO 2 )<br />
3 hours 25 µg/m 3<br />
24 hours 5 µg/m 3<br />
Annual 1 µg/m 3<br />
1 EPA, 1996<br />
2 AQCC, 2021<br />
3 EPA, 2018<br />
<strong>Commerce</strong> <strong>City</strong> Modeling Thresholds Report<br />
<strong>Commerce</strong> <strong>City</strong> Environmental Consulting Services<br />
7887 East 60 th Avenue, <strong>Commerce</strong> <strong>City</strong>, Colorado 80022 Page 5<br />
217
Hazardous air pollutants defined by the EPA along with other toxic pollutants identified by public health<br />
organizations such as the American Conference of Governmental Industrial Hygienists (ACGIH) also have the<br />
potential to cause human harm. Toxic pollutant impacts are generally categorized into acute which can occur<br />
from short-term inhalation exposure such as a 1-hour interval, chronic which can occur from long-term<br />
inhalation exposure such as over the course of a year, and cancerous which are reserved <strong>for</strong> long-term<br />
inhalation exposure to cancer-causing toxics. Table 2-3 below identifies specific toxic air pollutants of concern<br />
based on public concern over the pollutants in and around the <strong>Commerce</strong> <strong>City</strong> area and the acute, chronic,<br />
and cancerous threshold limit values (TLV). Acute exposure TLVs are also referred to as Reference Exposure<br />
Levels (RELs) and non-cancer chronic TLVs are also referred to as Reference Concentrations <strong>for</strong> Chronic<br />
Inhalation (RfC). Cancerous TLVs are determined based on an Inhalation Unit Risk (IUR) which is the increased<br />
cancer risk from 1 µg/m 3 inhalation exposure <strong>for</strong> a lifetime. The <strong>for</strong>m of the acute and chronic threshold limit<br />
values is not to be exceeded and, per EPA guidelines, the cancer risk threshold is less than 1 in 1 million (1 x<br />
10 -6 ). It is important to note that some, but not all of the pollutants in Table 2-3 are identified as hazardous air<br />
pollutants by the EPA.<br />
Table 2-3. Toxic Air Pollutant Threshold Limit Values<br />
Pollutant<br />
Acute REL/MRL<br />
(µg/m 3 ) 1<br />
Chronic RfC<br />
(µg/m 3 ) 2<br />
Cancer Inhalation Unit<br />
Risk (1/µg/m 3 ) 2<br />
Acetaldehyde 470 9 2.2 x 10 -6<br />
Benzene 27 30 7.8 x 10 -6<br />
Ethylbenzene 22,000 260 2.5 x 10 -6<br />
Formaldehyde 49 9.8 1.3 x 10 -5<br />
Hydrogen Cyanide (HCn) 340 0.8 Not applicable<br />
Hydrogen Sulfide (H 2 S) 42 2 Not applicable<br />
n-Hexane None identified 700 Not applicable<br />
Toluene 5,000 5,000 Not applicable<br />
Xylenes 8,700 100 Not applicable<br />
1 EPA, 2021c; when a REL and MRL both exist, the lower threshold of the two is used.<br />
2 EPA, 2021d<br />
<strong>Commerce</strong> <strong>City</strong> Modeling Thresholds Report<br />
<strong>Commerce</strong> <strong>City</strong> Environmental Consulting Services<br />
7887 East 60 th Avenue, <strong>Commerce</strong> <strong>City</strong>, Colorado 80022 Page 6<br />
218
3. Guidelines <strong>for</strong> Air Quality Significance Analysis<br />
The following three subsections detail a methodology <strong>for</strong> evaluating a new or modified facility’s impacts <strong>for</strong> any<br />
of the criteria, precursor, or toxic air pollutants discussed in Section 2. These steps are also visually represented<br />
in Figure 1 as a flow chart to guide <strong>Commerce</strong> <strong>City</strong> in the process of evaluating air quality significance.<br />
3.1 Screening Modeling Methodology<br />
3.1.1 Emissions Thresholds<br />
The need <strong>for</strong> impacts evaluations to provide in<strong>for</strong>mation to <strong>Commerce</strong> <strong>City</strong> and its residents is determined by<br />
new or modified facility’s potential to emit specified pollutants over certain thresholds. Table 3-1 shows the<br />
emissions thresholds of specified pollutants in this document. Should a new or modified facility have maximum<br />
potential emissions above these thresholds, screening modeling is recommended.<br />
Table 3-1. Emissions Thresholds <strong>for</strong> Screening<br />
Pollutant Averaging Time Emissions Threshold<br />
Criteria Pollutants<br />
Carbon Monoxide (CO) Hourly 23 pounds per hour<br />
Nitrogen Oxides (NOx) Hourly 0 pounds per hour<br />
Particulate Matter less than 2.5 microns<br />
(PM 2.5 )<br />
Particulate Matter less than 10 microns<br />
(PM 10 )<br />
Daily<br />
Daily<br />
11 pounds per day<br />
82 pounds per day<br />
Sulfur Dioxide (SO 2 ) Hourly 0.46 pounds per hour<br />
Volatile Organic Compounds (VOC) Hourly 0 pounds per hour<br />
Toxic Air Pollutants<br />
Acetaldehyde Hourly 1 pound per hour<br />
Benzene Hourly 0.06 pound per hour<br />
Ethylbenzene Annual 33 pounds per year<br />
Formaldehyde Hourly 0.12 pound per hour<br />
Hydrogen Cyanide (HCn) Hourly 0.75 pound per hour<br />
Hydrogen Sulfide (H 2 S) Hourly 0.093 pound per hour<br />
n-Hexane Hourly 4.43 pound per hour<br />
Toluene Hourly 82 pounds per hour<br />
Xylenes Hourly 49 pounds per hour<br />
For all pollutants listed above except <strong>for</strong> VOC, a direct threshold is proposed and discussed in Section 3.1.3.<br />
Only a secondary threshold exists and is proposed <strong>for</strong> VOCs and the methodology <strong>for</strong> screening is discussed<br />
in Section 3.3.<br />
<strong>Commerce</strong> <strong>City</strong> Modeling Thresholds Report<br />
<strong>Commerce</strong> <strong>City</strong> Environmental Consulting Services<br />
7887 East 60 th Avenue, <strong>Commerce</strong> <strong>City</strong>, Colorado 80022 Page 7<br />
219
Emissions thresholds <strong>for</strong> criteria pollutants were retrieved from Colorado Interim Guidance (CDPHE, 2022)<br />
<strong>for</strong> all pollutants except NOx and VOC. Due to the growing concern over these pollutants and the<br />
nonattainment status of <strong>Commerce</strong> <strong>City</strong> <strong>for</strong> O 3 whose precursors are NOx and VOC, all sources with the<br />
potential to emit NOx and VOC are recommended <strong>for</strong> screening. Emissions thresholds <strong>for</strong> toxic air pollutants<br />
were retrieved from available Cali<strong>for</strong>nia Guidance (BAAQMD, 2016) and Utah Guidance (UDAQ, 2018).<br />
Where emissions thresholds exist <strong>for</strong> both sources, the lower emissions threshold is used in Table 3-1.<br />
3.1.2 Acceptable Screening Models<br />
The EPA-approved screening model is AERSCREEN. The latest version is 21112 and is a free download through<br />
EPA’s Support Center <strong>for</strong> Regulatory Atmospheric Modeling (SCRAM). It is important to note that<br />
AERSCREEN is a single source evaluation of impacts and estimates worst-case 1-hour concentrations. Details<br />
on procedures to complete screening modeling will be detailed in a Modeling Guidance document <strong>for</strong><br />
<strong>Commerce</strong> <strong>City</strong> use.<br />
3.1.3 Impacts Thresholds<br />
Impacts thresholds used <strong>for</strong> screening evaluations will reference current CDPHE Air Pollution Control Division<br />
“Interim Colorado Modeling Guideline <strong>for</strong> Air Quality Permits” released in October of 2021 and updated in<br />
May of 2022 (CDPHE, 2022). Table 3-2 is included below <strong>for</strong> ease of reference. Where two averaging times<br />
exist <strong>for</strong> the same pollutant, both averaging times should be evaluated.<br />
Table 3-2. Significant Impact Levels <strong>for</strong> Primary Pollutants<br />
Pollutant Averaging Time SIL (µg/m 3 )<br />
Carbon Monoxide (CO)<br />
Nitrogen Dioxide (NO 2 )<br />
Particulate Matter less than 2.5 microns (PM 2.5 )<br />
1 hour 2,000<br />
8 hours 500<br />
1 hour 7.5<br />
Annual 1<br />
24 hours 1.2<br />
Annual 0.2<br />
Particulate Matter less than 10 microns (PM 10 )<br />
Sulfur Dioxide (SO 2 )<br />
24 hours 5<br />
Annual 1<br />
1 hour 4<br />
3 hours 25<br />
24 hours 5<br />
Annual 1<br />
1 CDPHE, 2022<br />
Since Colorado does not explicitly note thresholds <strong>for</strong> hazardous air pollutants or other toxic compounds, air<br />
data from Cali<strong>for</strong>nia state and air quality districts were evaluated. Published data was found from the Cali<strong>for</strong>nia<br />
<strong>Commerce</strong> <strong>City</strong> Modeling Thresholds Report<br />
<strong>Commerce</strong> <strong>City</strong> Environmental Consulting Services<br />
7887 East 60 th Avenue, <strong>Commerce</strong> <strong>City</strong>, Colorado 80022 Page 8<br />
220
Office of Environmental Health Hazard Assessment (OEHHA) and Bay Area Air Quality Management District<br />
(BAAQMD). Additionally, State of Utah has adopted Toxic Screening Levels (TSLs), which are used during the<br />
air permitting process (UDAQ, 2018). The TSLs are derived from TLVs published in the ACGIH – “Threshold<br />
Limit Values <strong>for</strong> Chemical Substances and Physical Agents”. These levels are not standards that must be met,<br />
but screening thresholds which if exceeded, would suggest that additional in<strong>for</strong>mation is needed to evaluate<br />
potential health and environmental impacts. For the majority of the acute pollutants the TSL is lower than the<br />
EPA acute risk threshold save xylenes. Where the EPA risk threshold, either acute or chronic, is lower than<br />
the published TSL by either BAAQMD, OEHHA, or UDAQ, the EPA risk threshold (EPA, 2021c; EPA, 2021d)<br />
is the TSL.<br />
Cancer inhalation risk is calculated by multiplying the annual model result by the IUR shown in Table 2-3 along<br />
with an exposure adjustment factor. Two exposure scenarios can be evaluated: the maximum exposed<br />
individual (MEI) and the most likely exposure (MLE). For the MEI risk, it is assumed that a person is exposed<br />
continuously (24 hours per day, 365 days per year) <strong>for</strong> the life of a project (e.g., 30 years). For the MLE risk,<br />
an adjustment should be made <strong>for</strong> the amount of time a person stays at a residence. No adjustment will be<br />
made <strong>for</strong> time away from home, to conservatively assume that people live and work in <strong>Commerce</strong> <strong>City</strong>. A<br />
typical residence time at the same location <strong>for</strong> a residential receptor can be from 6 to 30 years (EPA, 2009),<br />
so a midrange of 18 years was used <strong>for</strong> the average residential exposure. Exposure adjustment factors of 0.43<br />
<strong>for</strong> the MEI (30/70) and 0.26 <strong>for</strong> the MLE (18/70) were applied to the estimated cancer risk to account <strong>for</strong> the<br />
actual time that an individual could be exposed during a 70-year lifetime.<br />
Table 3-3. Toxic Screening Levels<br />
Pollutant<br />
Averaging Time<br />
Acute TSL<br />
(µg/m 3 )<br />
Averaging Time<br />
Chronic TSL<br />
(µg/m 3 )<br />
Acetaldehyde 1 hour 470 1 Annual 9 5<br />
Benzene 1 hour 27 1 Annual 3 1,3<br />
Ethylbenzene 24 hours 2,895 2 Annual 260 5<br />
Formaldehyde 1 hour 37 2 Annual 9 1,3<br />
Hydrogen Cyanide<br />
(HCn)<br />
Hydrogen Sulfide<br />
(H 2 S)<br />
1 hour 340 1 Annual 0.8 5<br />
1 hour 42 1 Annual 2 1,3<br />
n-Hexane 24 hours 5,875 2 Annual 7,00 5<br />
Toluene 1 hour 5,000 3 Annual 300 1<br />
Xylenes 1 hour 8,700 4 Annual 100 5<br />
1 BAAQMD, 2016<br />
2 UDAQ, 2018<br />
3 OEHHA, 2021<br />
4 EPA, 2021c; when a REL and MRL both exist, the lower threshold of the two is used.<br />
5 EPA, 2021d<br />
Procedures to determine the potential cancer risk of a new or modified facility will be discussed in the<br />
<strong>Commerce</strong> <strong>City</strong> Modeling Guidance document. As discussed in Section 2, the screening threshold <strong>for</strong> potential<br />
cancer risk is 1 in 1 million (1 x 10 -6 ).<br />
<strong>Commerce</strong> <strong>City</strong> Modeling Thresholds Report<br />
<strong>Commerce</strong> <strong>City</strong> Environmental Consulting Services<br />
7887 East 60 th Avenue, <strong>Commerce</strong> <strong>City</strong>, Colorado 80022 Page 9<br />
221
The new or modified facility should evaluate its impacts using approved screening models against the<br />
appropriate significant impact levels and toxic screening levels. If the modeled impact is below the appropriate<br />
significant impact levels and toxic screening levels, no further analysis is required. The conservative nature of<br />
the screening models and the low impacts thresholds provide confidence in the low impact on public health<br />
and environment.<br />
3.1.4 Cumulative Analysis Requirements<br />
If the screening modeling shows maximum receptor (i.e., highest first high receptor of the averaging period)<br />
results equal to or higher than any of the significant impact levels (Table 3-2), a cumulative analysis is<br />
recommended. A cumulative analysis is not appropriate <strong>for</strong> toxic air pollutants. For any screening modeling<br />
that shows results equal to or higher than toxic screening levels (Table 3-3), refined modeling or mitigation<br />
options should be considered. At a high level, a cumulative analysis will take into account surrounding emissions<br />
sources to the new or modified facility and instead of comparing to significant impact levels, will compare the<br />
combined result of the surrounding facilities and new or modified facility with the NAAQS (Table 2-1). Details<br />
on conducting a cumulative analysis will be discussed in the <strong>Commerce</strong> <strong>City</strong> Modeling Guidance document.<br />
3.2 Refined Modeling Methodology<br />
3.2.1 Emissions Thresholds<br />
For refined modeling evaluations, the emissions thresholds detailed in the modeling guidance document<br />
released by CDPHE should be used. CDPHE Air Pollution Control Division released their “Interim Colorado<br />
Modeling Guideline <strong>for</strong> Air Quality Permits” in October of 2021 and updated in May of 2022 (CDPHE, 2022).<br />
Table 1 in Section 2 of the interim modeling guideline details the emissions thresholds CDPHE requires impacts<br />
evaluations. Note that CDPHE currently doesn’t routinely require or per<strong>for</strong>m modeling to determine impacts<br />
from toxics and Table 1 only includes criteria pollutants.<br />
3.2.2 Acceptable Refined Models<br />
For refined modeling evaluations, the approved models detailed in the modeling guidance document released<br />
by CDPHE should be used. CDPHE Air Pollution Control Division released their “Interim Colorado Modeling<br />
Guideline <strong>for</strong> Air Quality Permits” in October of 2021 and updated in May of 2022 (CDPHE, 2022). More detail<br />
regarding modeling software will be included in the <strong>Commerce</strong> <strong>City</strong> Modeling Guidance document.<br />
3.2.3 Impacts Thresholds<br />
Per the CDPHE “Interim Colorado Modeling Guideline <strong>for</strong> Air Quality Permits” (CDPHE, 2022), modeling is<br />
first conducted <strong>for</strong> evaluation of the new or modified facility alone against the SIL levels detailed in Table 2 and<br />
Table 3, based on facility classification (e.g., minor, major, or PSD) of Section 3. Should initial modeling<br />
evaluation determine that the new or modified facility alone exceeds at least one of the SIL levels, then a<br />
cumulative analysis is required by CDPHE.<br />
3.2.4 Cumulative Analysis Requirements<br />
The CDPHE “Interim Colorado Modeling Guideline <strong>for</strong> Air Quality Permits” (CDPHE, 2022) should be<br />
followed to conduct a cumulative analysis of a new or modified facility’s impacts. The cumulative analysis results<br />
are compared to the appropriate Colorado Ambient Air Quality Standards (CAAQS) and NAAQS standards<br />
as shown in Table 6 and Table 7 of Section 3 of the interim modeling guideline.<br />
<strong>Commerce</strong> <strong>City</strong> Modeling Thresholds Report<br />
<strong>Commerce</strong> <strong>City</strong> Environmental Consulting Services<br />
7887 East 60 th Avenue, <strong>Commerce</strong> <strong>City</strong>, Colorado 80022 Page 10<br />
222
3.3 Secondary Impacts Methodology<br />
For secondary pollutants such as O 3 and PM 2.5, EPA has released guidance commonly referred to as MERPs<br />
(Modeled Emission Rates <strong>for</strong> Precursors) to estimate their impacts (EPA, 2019). MERPs are used <strong>for</strong> the 8-<br />
hour O 3 , 24-hour PM 2.5 , and annual PM 2.5 secondary standards only. There are also secondary NAAQS <strong>for</strong><br />
annual NO 2 , Pb, 24-hour PM 10 , and 3-hour SO 2 . In some cases, the primary NAAQS is equal to the secondary<br />
NAAQS (e.g., annual NO 2 and 24-hour PM 10 ). To evaluate impacts against the secondary NAAQS that are not<br />
covered under MERP guidance, it is conservatively proposed that these standards be treated as primary <strong>for</strong> the<br />
purposes of screening. Further discussion on these will be discussed in subsequent sections.<br />
3.3.1 Emissions Thresholds<br />
The need <strong>for</strong> secondary impacts evaluations to provide in<strong>for</strong>mation to <strong>Commerce</strong> <strong>City</strong> and its residents is<br />
determined by new or modified facility’s potential to emit specified pollutants over certain thresholds. There<br />
are no secondary impacts thresholds <strong>for</strong> toxic air pollutants. Table 3-4 shows the emissions thresholds of<br />
specified pollutants in this document. Should a new or modified facility have maximum potential emissions<br />
above these thresholds, screening modeling is recommended.<br />
Table 3-4. Emissions Thresholds <strong>for</strong> Screening<br />
Pollutant Averaging Time Emissions Threshold<br />
Criteria Pollutants<br />
Nitrogen Oxides (NOx) Hourly 0 pounds per hour<br />
Particulate Matter less than 2.5 microns<br />
(PM 2.5 )<br />
Particulate Matter less than 10 microns<br />
(PM 10 )<br />
Daily<br />
Daily<br />
11 pounds per day<br />
82 pounds per day<br />
Sulfur Dioxide (SO 2 ) Hourly 0.46 pounds per hour<br />
Volatile Organic Compounds (VOC) Hourly 0 pounds per hour<br />
Emissions thresholds <strong>for</strong> criteria pollutants were retrieved from Colorado Interim Guidance (CDPHE, 2022)<br />
<strong>for</strong> all pollutants except NOx and VOC. Due to the growing concern over these pollutants and the<br />
nonattainment status of <strong>Commerce</strong> <strong>City</strong> <strong>for</strong> O 3 whose precursors are NOx and VOC, all sources with the<br />
potential to emit NOx and VOC are recommended <strong>for</strong> screening.<br />
3.3.2 Acceptable Secondary Impacts Tools<br />
As previously mentioned, EPA has released MERP guidance that details methodologies and thresholds regarding<br />
estimating secondary impacts of O 3 and PM 2.5 (EPA, 2019). The guidance relies on previously completed<br />
sophisticated photochemical modeling where emissions rates of precursors such as NOx, SO 2 and VOCs were<br />
demonstrated to equal the SIL level <strong>for</strong> the appropriate secondary NAAQS (i.e., 8-hour O 3 , 24-hour PM 2.5 and<br />
annual PM 2.5 ). These emissions rates along with primary impacts modeling results such as those discussed in<br />
Section 3.2 are then used to estimate a new or modified facility’s secondary impacts <strong>for</strong> comparison against the<br />
SIL (Table 2-2) and/or NAAQS (Table 2-1). It is recommended that the MERP guidance along with other<br />
modeling guidance released by <strong>Commerce</strong> <strong>City</strong> be used to estimate secondary impacts from O 3 and PM 2.5 .<br />
<strong>Commerce</strong> <strong>City</strong> Modeling Thresholds Report<br />
<strong>Commerce</strong> <strong>City</strong> Environmental Consulting Services<br />
7887 East 60 th Avenue, <strong>Commerce</strong> <strong>City</strong>, Colorado 80022 Page 11<br />
223
To determine the appropriate MERPs <strong>for</strong> precursors, new or modified facilities should use the Lowest<br />
emissions rate <strong>for</strong> the Rockies/Plains climate zone in Table 4-1 of the MERP guidance (EPA, 2019).<br />
For secondary pollutants not covered under the EPA MERP guidance, tools outlined <strong>for</strong> primary impacts should<br />
be used (see Section 3.2). As noted in Table 2-1, the primary and secondary standard <strong>for</strong> annual NO 2 and 24-<br />
hour PM 10 are the same threshold. There<strong>for</strong>e, no evaluation <strong>for</strong> secondary impacts of NO 2 and PM 10 would be<br />
recommended so long as the primary impacts of these standards are modeled below the SIL or NAAQS per<br />
Section 3.2.<br />
3.3.3 Impacts Thresholds<br />
Table 3-5 includes the thresholds that should be used <strong>for</strong> secondary impacts evaluations. Where two averaging<br />
times exist <strong>for</strong> the same pollutant, both averaging times should be evaluated.<br />
Table 3-5. Significant Impact Levels <strong>for</strong> Secondary Pollutants<br />
Pollutant Averaging Time SIL 1,2<br />
Nitrogen Dioxide (NO 2 ) Annual 1 µg/m 3<br />
Ozone (O 3 ) 8 hours 1 ppb<br />
Particulate Matter less than 2.5 microns (PM 2.5 )<br />
24 hours 1.2 µg/m 3<br />
Annual 0.2 µg/m 3<br />
Particulate Matter less than 10 microns (PM 10 ) 24 hours 5 µg/m 3<br />
Sulfur Dioxide (SO 2 ) 3 hours 25 µg/m 3<br />
1 CDPHE, 2022<br />
2 EPA, 2018<br />
The new or modified facility should evaluate its impacts using approved screening models and tools against the<br />
appropriate significant impact levels. If the modeled impact is below the appropriate significant impact levels,<br />
no further analysis is required. The conservative nature of the screening models and the low impacts thresholds<br />
provide confidence in the low impact on public health and environment.<br />
3.3.4 Cumulative Analysis Requirements<br />
If the screening modeling shows results equal to or higher than any of the significant impact levels (Table 3-5),<br />
a cumulative analysis is recommended. At a high level, a cumulative analysis will take into account surrounding<br />
emissions sources to the new or modified facility and instead of comparing to significant impact levels, will<br />
compare the combined result of the surrounding facilities and new or modified facility with the NAAQS (Table<br />
2-1). Details on conducting a cumulative analysis <strong>for</strong> O 3 and PM 2.5 are detailed in the EPA MERP guidance (EPA,<br />
2019) and will be discussed in the <strong>Commerce</strong> <strong>City</strong> Modeling Guidance document.<br />
<strong>Commerce</strong> <strong>City</strong> Modeling Thresholds Report<br />
<strong>Commerce</strong> <strong>City</strong> Environmental Consulting Services<br />
7887 East 60 th Avenue, <strong>Commerce</strong> <strong>City</strong>, Colorado 80022 Page 12<br />
224
4. Mitigation Recommendations<br />
In the instance a new or modified facility models impacts, either through screening or refined modeling<br />
methodologies, mitigation recommendations can be provided to a project proponent to reduce the facility’s<br />
potential emissions, reduce the facility’s potential impacts, or both. Below is a bulleted list of potential mitigation<br />
recommendations that may achieve lower impacts <strong>for</strong> one or more criteria, toxic, or precursor pollutants.<br />
This is not meant to be a comprehensive list, as unique emission sources could require source specific<br />
consideration <strong>for</strong> best mitigation options.<br />
• Review the EPA Best Available Control Technology (BACT), Lowest Achievable Emissions Rate (LAER),<br />
and Reasonable Available Control Technology (RACT) Clearinghouse <strong>for</strong> potential control devices or<br />
equipment that can result in lower emissions to complete the same process or operation.<br />
• Modify exhaust parameters <strong>for</strong> a specific source especially those that have stacks to allow better dispersion.<br />
Higher release heights, faster exit velocities, and warmer gas temperatures generally result in better<br />
dispersion and less localized impacts.<br />
• Determine if high impact sources at a facility can be located farther from residential housing, gathering<br />
areas, and sensitive communities.<br />
• Limit a high impact source’s operation to periods of calmer meteorology such as low winds and/or the<br />
time of day to reduce the effects of unexpected, exceptional weather conditions.<br />
<strong>Commerce</strong> <strong>City</strong> Modeling Thresholds Report<br />
<strong>Commerce</strong> <strong>City</strong> Environmental Consulting Services<br />
7887 East 60 th Avenue, <strong>Commerce</strong> <strong>City</strong>, Colorado 80022 Page 13<br />
225
Figure 1<br />
Air Quality Significance Evaluation Flowchart<br />
<strong>Commerce</strong> <strong>City</strong> Modeling Thresholds Report<br />
<strong>Commerce</strong> <strong>City</strong> Environmental Consulting Services<br />
7887 East 60 th Avenue, <strong>Commerce</strong> <strong>City</strong>, Colorado 80022<br />
226
Is the project a new<br />
emissions source/<br />
facility or modification<br />
to an existing facility?<br />
No<br />
No further analysis<br />
required.<br />
Yes<br />
Calculate<br />
maximum<br />
potential<br />
hourly, daily,<br />
and annual<br />
emissions.<br />
Yes<br />
Are calculated emissions<br />
greater than the values<br />
in Table 3-1 or Table 3-<br />
4?<br />
No<br />
No further analysis<br />
required.<br />
Conduct screening<br />
modeling using<br />
acceptable models/<br />
MERP guidance.<br />
Implement<br />
mitigation<br />
recommendation.<br />
No<br />
Are modeled impacts less<br />
than values in Table 3-2,<br />
Table 3-3 and Table 3-5 ?<br />
Yes<br />
No further analysis<br />
required.<br />
No<br />
Conduct cumulative<br />
analysis using<br />
acceptable screening<br />
models/MERP<br />
guidance.<br />
Implement<br />
mitigation<br />
recommendation.<br />
No<br />
Are modeled impacts<br />
less than Table 2-1 and<br />
Table 2-3?<br />
Yes<br />
No further analysis<br />
required.<br />
No<br />
Conduct refined<br />
modeling following<br />
CDPHE guidance.<br />
227
References<br />
Air Quality Control Commission (AQCC), 2021. “Regulation Number 3 Stationary Source Permitting and<br />
Air Pollutant Emission Notice Requirements”. May 15, 2021. Available through:<br />
https://cdphe.colorado.gov/aqcc-regulations.<br />
Bay Area Air Quality Management District (BAAQMD), 2016. “Regulation 2 Permits Rule 5 New Source<br />
Review of Toxic Air Contaminants”. December 7, 2016. Available through:<br />
https://www.baaqmd.gov/rules-and-compliance/rules/reg-2-rule-5-new-source-review-oftoxic-air-contaminants.<br />
Colorado Department of Public Health and Environment (CDPHE), 2022. “Interim Colorado Modeling<br />
Guideline <strong>for</strong> Air Quality Permits”. May 2022. Available through:<br />
https://www.colorado.gov/airquality/permits.aspx.<br />
Environmental Protection Agency (EPA), 1996. “Federal Register Volume 61, Number 142, Proposed Rules”.<br />
Page 38249-38344. July 23, 1996.<br />
EPA, 2009. “Risk Assessment Guidance <strong>for</strong> Superfund Volume I: Human Health Evaluation Manual (Part F,<br />
Supplemental Guidance <strong>for</strong> Inhalation Risk Assessment)”. January 2009. EPA-540-R-070-002.<br />
EPA, 2018. “Guidance on Significant Impact Levels <strong>for</strong> Ozone and Fine Particles in the Prevention of<br />
Significant Deterioration Permitting Program”. April 17, 2018. EPA-454/S-18-001.<br />
EPA, 2019. “Guidance on the Development of Modeled Emission Rates <strong>for</strong> Precursors (MERPS) as a Tier 1<br />
Demonstration Tool <strong>for</strong> Ozone and PM 2.5 under the PSD Permitting Program”. April 30,<br />
2019. EPA-454/R-19-003.<br />
EPA, 2021a. “NAAQS Table”. February 10, 2021. Available through: https://www.epa.gov/criteria-airpollutants/naaqs-table.<br />
EPA, 2021b. “Colorado Nonattainment/Maintenance Status <strong>for</strong> Each County by Year <strong>for</strong> All Criteria<br />
Pollutants”. November 30, 2021. Available through:<br />
https://www3.epa.gov/airquality/greenbook/anayo_co.html.<br />
EPA, 2021c. “Table 2 Acute Dose-Response Values <strong>for</strong> Screening Risk Assessments”. August 31, 2021.<br />
Available through: https://www.epa.gov/fera/dose-response-assessment-assessing-healthrisks-associated-exposure-hazardous-air-pollutants.<br />
EPA, 2021d. “Table 1 Prioritized Chronic Dose-Response Values <strong>for</strong> Screening Risk Assessments”.<br />
September 29, 2021. Available through: https://www.epa.gov/fera/dose-response-assessmentassessing-health-risks-associated-exposure-hazardous-air-pollutants.<br />
Office of Environmental Health Hazard Assessment (OEHHA), 2021. “OEHHA chemical database meta data”.<br />
Available through: https://oehha.ca.gov/chemicals.<br />
Pinyon Environmental, Inc., 2021. “<strong>Commerce</strong> <strong>City</strong> Community-Wide Impacts Report”. October 1, 2021.<br />
Utah Division of Air Quality (UDAQ), 2018. “2011 ACGIH Threshold Limit Values (TLVS), Toxic Screening<br />
Levels (TSLs) and Emission Threshold Values (ETVs)”. February 28, 2018. DAQ 2018-<br />
002269.<br />
<strong>Commerce</strong> <strong>City</strong> Modeling Thresholds Report<br />
<strong>Commerce</strong> <strong>City</strong> Environmental Consulting Services<br />
7887 East 60 th Avenue, <strong>Commerce</strong> <strong>City</strong>, Colorado 80022<br />
228
Appendix B. AQ and WQ<br />
Technical Documents<br />
August 5, 2022<br />
Modeling Guidance Document<br />
<strong>Commerce</strong> <strong>City</strong> Environmental Consulting Services<br />
7887 East 60th Avenue<br />
<strong>Commerce</strong> <strong>City</strong>, Colorado<br />
Prepared <strong>for</strong>:<br />
<strong>City</strong> of <strong>Commerce</strong> <strong>City</strong><br />
7887 East 60th Avenue<br />
<strong>Commerce</strong> <strong>City</strong>, CO 80022<br />
Pinyon Project No.:<br />
1/21-1435-01<br />
229
August 5, 2022<br />
Modeling Guidance Document<br />
<strong>Commerce</strong> <strong>City</strong> Environmental Consulting Services<br />
7887 East 60th Avenue<br />
<strong>Commerce</strong> <strong>City</strong>, Colorado<br />
Prepared <strong>for</strong>:<br />
<strong>City</strong> of <strong>Commerce</strong> <strong>City</strong><br />
7887 East 60th Avenue<br />
<strong>Commerce</strong> <strong>City</strong>, CO 80022<br />
Pinyon Project No.:<br />
1/21-1435-01<br />
Prepared by:<br />
___________________________<br />
Kaitlin Meszaros<br />
Reviewed by:<br />
___________________________<br />
Dustin Collins<br />
230
Table of Contents<br />
Executive Summary ..................................................................................................................................................................... 1<br />
1. Introduction and Purpose ................................................................................................................................................ 2<br />
2. Pollutants of Concern ....................................................................................................................................................... 3<br />
3. Screening Modeling Methodology .................................................................................................................................. 6<br />
3.1 Emissions Thresholds ............................................................................................................................................ 6<br />
3.2 Acceptable Screening Models .............................................................................................................................. 6<br />
3.3 Source Parameters ................................................................................................................................................. 7<br />
3.4 Emissions Rates ....................................................................................................................................................... 8<br />
3.5 Source Location ...................................................................................................................................................... 8<br />
3.6 Receptors ................................................................................................................................................................. 8<br />
3.7 Background Concentrations ................................................................................................................................ 9<br />
3.8 Terrain Options ....................................................................................................................................................10<br />
3.9 Meteorology ..........................................................................................................................................................10<br />
3.10 Building Downwash and Fumigation ................................................................................................................10<br />
3.11 Impacts Thresholds ..............................................................................................................................................11<br />
3.12 Cumulative Analysis .............................................................................................................................................12<br />
4. Refined Modeling Methodology ....................................................................................................................................14<br />
4.1.1 Emissions Thresholds ..........................................................................................................................14<br />
4.1.2 Acceptable Refined Models ................................................................................................................14<br />
4.1.3 Impacts Thresholds ..............................................................................................................................14<br />
4.1.4 Cumulative Analysis Requirements ..................................................................................................14<br />
5. Secondary Impacts Methodology..................................................................................................................................15<br />
5.1 Emissions Thresholds ..........................................................................................................................................15<br />
5.2 Acceptable Secondary Impacts Tools .............................................................................................................15<br />
5.3 Cumulative Analysis Requirements ..................................................................................................................17<br />
Tables<br />
Table 2-1. National Ambient Air Quality Standards........................................................................................................ 4<br />
Table 2-2. Significant Impact Levels ..................................................................................................................................... 5<br />
Table 2-3. Toxic Air Pollutant Threshold Limit Values .................................................................................................. 5<br />
Table 3-1. Emissions Thresholds <strong>for</strong> Screening – Primary & Toxic Pollutants ......................................................... 6<br />
Table 3-2. Emissions Source Type Parameters ................................................................................................................. 7<br />
<strong>Commerce</strong> <strong>City</strong> Modeling Guidance Document<br />
<strong>Commerce</strong> <strong>City</strong> Environmental Consulting Services<br />
7887 East 60 th Avenue, <strong>Commerce</strong> <strong>City</strong>, Colorado 80022 Page i<br />
231
Table 3-3.<br />
Monitoring Stations <strong>for</strong> Cumulative Analysis………………………………………………………9<br />
Table 3-4. National Ambient Air Quality Standards with Form of Standard Interpretation of Model Result..12<br />
Table 5-1. Emissions Thresholds <strong>for</strong> Screening – Secondary Pollutants ..................................................................15<br />
Table 5-2. Lowest Illustrative MERP Values by Precursor <strong>for</strong> Rockies/Plains .........................................................16<br />
Table 5-3. Modeled Values at Emissions Rates by Precursor <strong>for</strong> Rockies/Plains ...................................................17<br />
Appendices<br />
Appendix A<br />
Appendix B<br />
Air Quality Modeling – Data Request<br />
Air Quality Modeling – Screening Analysis Model Results Summary<br />
<strong>Commerce</strong> <strong>City</strong> Modeling Guidance Document<br />
<strong>Commerce</strong> <strong>City</strong> Environmental Consulting Services<br />
7887 East 60 th Avenue, <strong>Commerce</strong> <strong>City</strong>, Colorado 80022 Page ii<br />
232
Executive Summary<br />
Pinyon Environmental, Inc. (Pinyon) has completed a Modeling Guidance Document <strong>for</strong> the <strong>City</strong> of <strong>Commerce</strong><br />
<strong>City</strong> (<strong>Commerce</strong> <strong>City</strong>) to detail procedures <strong>for</strong> conducting screening and refined dispersion modeling analyses<br />
as briefly outlined in the Modeling Thresholds Report (Pinyon, 2022). The report outlines acceptable screening<br />
and refined modeling tools, methodology steps, appropriate assumptions, and review of results <strong>for</strong> comparison<br />
against Significant Impact Levels (SIL), National Ambient Air Quality Standards (NAAQS), and Threshold Limit<br />
Values (TLV). Due to the nonattainment status <strong>for</strong> the area in and surrounding <strong>Commerce</strong> <strong>City</strong>, methodologies<br />
<strong>for</strong> evaluating secondary pollutants such as ozone (O 3 ) are included that follow Environmental Protection<br />
Agency (EPA) procedures though do not include direct modeling of secondary pollutants.<br />
The document goes through appropriate methodologies <strong>for</strong> screening using approved models <strong>for</strong> first<br />
comparison against SIL or TLVs and, if a cumulative analysis is required, then the NAAQS. This document also<br />
details circumstances when more refined modeling should be required such as when cumulative analyses may<br />
be overly conservative or if the facility details or nearby sources are more complex. Lastly, the document<br />
details the methodologies <strong>for</strong> evaluating secondary pollutant impacts following EPA guidance. This document<br />
should be utilized concurrently with the Modeling Thresholds Report (Pinyon, 2022) as it is referenced<br />
throughout.<br />
This report and recommendations are meant to provide technical in<strong>for</strong>mation to support <strong>Commerce</strong> <strong>City</strong> with<br />
emissions mitigation options and potential policy recommendations that are future deliverables to be submitted<br />
to <strong>Commerce</strong> <strong>City</strong>.<br />
<strong>Commerce</strong> <strong>City</strong> Modeling Guidance Document<br />
<strong>Commerce</strong> <strong>City</strong> Environmental Consulting Services<br />
7887 East 60 th Avenue, <strong>Commerce</strong> <strong>City</strong>, Colorado 80022 Page 1<br />
233
1. Introduction and Purpose<br />
The <strong>City</strong> of <strong>Commerce</strong> <strong>City</strong> (<strong>Commerce</strong> <strong>City</strong>) tasked Pinyon Environmental, Inc. (Pinyon) to create a Modeling<br />
Guidance Document. The Modeling Guidance Document provides <strong>Commerce</strong> <strong>City</strong> a step-by-step process <strong>for</strong><br />
conducting quantitative analyses including, but not limited to, screening and refined modeling to evaluate new<br />
and modified facilities’ air quality significance as it relates to community residents and the environment. This<br />
Modeling Guidance Document should be used with the Modeling Thresholds Report (Pinyon, 2022) and will<br />
be referenced throughout. With current reliance on the Colorado Department of Public Health (CDPHE) air<br />
quality significance screenings and determinations, <strong>Commerce</strong> <strong>City</strong> determined that additional attention and<br />
scrutiny may be required <strong>for</strong> future projects within the <strong>City</strong>’s boundaries due to community air quality concerns<br />
and the continued nonattainment status of the area <strong>for</strong> ozone.<br />
A review of state and federal modeling guidance was conducted along with a review of appropriate potential<br />
assumptions or default parameters <strong>for</strong> the topography, urban nature, and types of emissions sources in<br />
<strong>Commerce</strong> <strong>City</strong>. This document includes steps to complete air quality significance evaluations of specific toxic<br />
air pollutants currently emitted within the <strong>City</strong>’s boundaries and secondary air pollutants that are also <strong>for</strong>med<br />
as a result of emissions within the <strong>City</strong>’s boundaries. The document also includes a generic data request<br />
<strong>Commerce</strong> <strong>City</strong> can use to request in<strong>for</strong>mation to conduct their own screening and/or refined modeling <strong>for</strong><br />
emissions sources within the <strong>City</strong>’s boundaries. Multiple guidance documents, including those released by EPA<br />
and CDPHE, should be considered <strong>for</strong> unique circumstances possibly not covered in this document.<br />
This document, in conjunction with the Modeling Thresholds Report, provides <strong>Commerce</strong> <strong>City</strong> a step-by-step<br />
procedure to evaluate future projects within its boundaries to initiate practical discussion with residents and<br />
project proponents as well as potentially mitigating future negative air quality impacts.<br />
<strong>Commerce</strong> <strong>City</strong> Modeling Guidance Document<br />
<strong>Commerce</strong> <strong>City</strong> Environmental Consulting Services<br />
7887 East 60 th Avenue, <strong>Commerce</strong> <strong>City</strong>, Colorado 80022 Page 2<br />
234
2. Pollutants of Concern<br />
The following list bullets the different pollutants (criteria, toxic air, and secondary) that can cause or contribute<br />
to ambient air concentrations that when compared to standards can demonstrate a potential harm to human<br />
health or public welfare. These pollutants and the sources and activities that may result in their emissions are<br />
detailed in the Community Impacts Report (Pinyon, 2021).<br />
Criteria Air Pollutants<br />
• Carbon monoxide (CO)<br />
• Nitrogen oxides (NOx)<br />
• Particulate matter less than 10 micrometers in diameter (PM 10 )<br />
• Particulate matter less than 2.5 micrometers in diameter (PM 2.5 )<br />
• Sulfur Dioxide (SO 2 )<br />
• Volatile organic compounds (VOC)<br />
Toxic Air Pollutants<br />
• Acetaldehyde<br />
• Benzene<br />
• Ethylbenzene<br />
• Formaldehyde<br />
• Hydrogen cyanide (HCn)<br />
• Hydrogen sulfide (H 2 S)<br />
• n-Hexane<br />
• Toluene<br />
• Xylenes<br />
Secondary Air Pollutants<br />
• Ozone (O 3 )<br />
• Secondary PM 2.5<br />
The tables <strong>for</strong> National Ambient Air Quality Standards (NAAQS), Significant Impact Levels (SILs), and Toxics<br />
Threshold Limit Values (TLVs) are listed again <strong>for</strong> reference in Table 2-1, Table 2-2, and Table 2-3, respectively.<br />
<strong>Commerce</strong> <strong>City</strong> Modeling Guidance Document<br />
<strong>Commerce</strong> <strong>City</strong> Environmental Consulting Services<br />
7887 East 60 th Avenue, <strong>Commerce</strong> <strong>City</strong>, Colorado 80022 Page 3<br />
235
The details and reference <strong>for</strong> these values can be found in the Modeling Thresholds Document (Pinyon, 2022).<br />
Currently, <strong>Commerce</strong> <strong>City</strong> is considered in marginal nonattainment <strong>for</strong> the 2015 O 3 standard and serious<br />
nonattainment <strong>for</strong> the 2008 O 3 standard and likely to go to severe nonattainment <strong>for</strong> the 2008 O 3 standard in<br />
2022 (EPA, 2021b). Also, <strong>Commerce</strong> <strong>City</strong> is considered a maintenance area <strong>for</strong> CO and PM 10 NAAQS, and<br />
those 20-year maintenance periods end in 2022 (EPA, 2021b). The SILs <strong>for</strong> Class II areas are listed based on<br />
the distance from <strong>Commerce</strong> <strong>City</strong> to the nearest Class I area (Rocky Mountain National Park). The <strong>for</strong>m of<br />
the acute and chronic threshold limit values is not to be exceeded and, per EPA guidelines, the cancer risk<br />
threshold is less than 1 in 1 million (1 x 10 -6 ). It is important to note that some, but not all of the pollutants in<br />
Table 2-3 are identified as hazardous air pollutants by the EPA.<br />
Table 2-1. National Ambient Air Quality Standards<br />
Pollutant<br />
CO<br />
Lead (Pb)<br />
Nitrogen Dioxide<br />
(NO 2 ) 1<br />
Averaging<br />
Time<br />
Primary<br />
NAAQS<br />
<strong>Commerce</strong> <strong>City</strong> Modeling Guidance Document<br />
<strong>Commerce</strong> <strong>City</strong> Environmental Consulting Services<br />
7887 East 60 th Avenue, <strong>Commerce</strong> <strong>City</strong>, Colorado 80022 Page 4<br />
236<br />
Secondary<br />
NAAQS<br />
1 hour 35 ppm Not<br />
8 hours 9 ppm applicable<br />
Rolling 3-<br />
month average<br />
1 hour 100 ppb<br />
Form of Standard<br />
Not to be exceeded more than<br />
once per year<br />
0.15 µg/m 3 0.15 µg/m 3 Not to be exceeded<br />
Not<br />
applicable<br />
Annual 53 ppb 53 ppb Annual mean<br />
O 3<br />
2<br />
8 hours 70 ppb 70 ppb<br />
PM 2.5<br />
24 hours 35 µg/m 3 35 µg/m 3<br />
Annual 12 µg/m 3 15 µg/m 3<br />
PM 10 24 hours 150 µg/m 3 150 µg/m 3<br />
SO 2<br />
Source: EPA, 2021a<br />
ppm<br />
ppb<br />
µg/m 3<br />
parts per million<br />
parts per billion<br />
1 hour 75 ppb<br />
3 hours<br />
micrograms per cubic meter<br />
Not<br />
applicable<br />
Not<br />
applicable<br />
0.5 ppm<br />
98 th percentile of 1-hour daily<br />
maximum, averaged over 3 years<br />
Annual 4 th highest 8-hour daily<br />
maximum, averaged over 3 years<br />
98 th percentile, averaged over 3<br />
years<br />
Annual mean, averaged over 3<br />
years<br />
Not to be exceeded more than<br />
once per year on average over 3<br />
years<br />
99 th percentile of 1-hour daily<br />
maximum, averaged over 3 years<br />
Not to be exceeded more than<br />
once per year<br />
1 The level of the annual NO2 standard is 0.053 ppm. It is shown here in terms of ppb <strong>for</strong> the purposes of clearer<br />
comparison to the 1-hour standard level.<br />
2 Final rule signed October 1, 2015, and effective December 28, 2015. The previous (2008) O3 standards additionally<br />
remain in effect in some areas. Revocation of the previous (2008) O3 standards and transitioning to the current (2015)<br />
standards will be addressed in the implementation rule <strong>for</strong> the current standards. The standard is presented as 0.070<br />
ppm but is shown in ppb <strong>for</strong> the purposes of clearer comparison to the SIL.
Table 2-2. Significant Impact Levels<br />
Pollutant Averaging Time SIL 1,2<br />
CO<br />
1 hour 2,000 µg/m 3<br />
8 hours 500 µg/m 3<br />
1 hour 7.5 µg/m 3<br />
NO 2<br />
Annual 1 µg/m 3<br />
3<br />
O 3 8 hours 1 ppb<br />
PM 2.5<br />
PM 10<br />
24 hours 1.2 µg/m 3<br />
Annual 0.2 µg/m 3<br />
24 hours 5 µg/m 3<br />
Annual 1 µg/m 3<br />
1 hour 4 µg/m 3<br />
SO 2<br />
3 hours 25 µg/m 3<br />
24 hours 5 µg/m 3<br />
Annual 1 µg/m 3<br />
1 EPA, 1996<br />
2 AQCC, 2021<br />
3 EPA, 2018<br />
Table 2-3.<br />
Toxic Air Pollutant Threshold Limit Values<br />
Pollutant<br />
Acute REL/MRL<br />
(µg/m 3 ) 1<br />
Chronic RfC<br />
(µg/m 3 ) 2<br />
Cancer Inhalation<br />
Unit Risk (1/µg/m 3 ) 2<br />
Acetaldehyde 470 9 2.2 x 10 -6<br />
Benzene 27 30 7.8 x 10 -6<br />
Ethylbenzene 22,000 260 2.5 x 10 -6<br />
Formaldehyde 49 9.8 1.3 x 10 -5<br />
HCn 340 0.8 Not applicable<br />
H 2 S 42 2 Not applicable<br />
n-Hexane None identified 700 Not applicable<br />
Toluene 5,000 5,000 Not applicable<br />
Xylenes 8,700 100 Not applicable<br />
1 EPA, 2021c; when a REL and MRL both exist, the lower threshold of the two is used.<br />
2 EPA, 2021d<br />
<strong>Commerce</strong> <strong>City</strong> Modeling Guidance Document<br />
<strong>Commerce</strong> <strong>City</strong> Environmental Consulting Services<br />
7887 East 60 th Avenue, <strong>Commerce</strong> <strong>City</strong>, Colorado 80022 Page 5<br />
237
3. Screening Modeling Methodology<br />
3.1 Emissions Thresholds<br />
The need <strong>for</strong> impacts evaluations to provide in<strong>for</strong>mation to <strong>Commerce</strong> <strong>City</strong> and its residents is determined by<br />
a new or modified facility’s potential to emit individual pollutants over certain thresholds. Table 3-1 shows the<br />
emissions thresholds of specified pollutants in this document. Should a new or modified facility have maximum<br />
potential emissions above these thresholds, screening modeling is recommended.<br />
Table 3-1. Emissions Thresholds <strong>for</strong> Screening – Primary & Toxic Pollutants<br />
Pollutant Averaging Time Emissions Threshold<br />
Criteria Pollutants<br />
CO Hourly 23 pounds per hour<br />
NOx Hourly 0 pounds per hour<br />
PM 2.5 Daily 11 pounds per day<br />
PM 10 Daily 82 pounds per day<br />
SO 2 Hourly 0.46 pounds per hour<br />
VOC Hourly 0 pounds per hour<br />
Toxic Air Pollutants<br />
Acetaldehyde Hourly 1 pound per hour<br />
Benzene Hourly 0.06 pound per hour<br />
Ethylbenzene Annual 33 pounds per year<br />
Formaldehyde Hourly 0.12 pound per hour<br />
Hydrogen Cyanide (HCn) Hourly 0.75 pound per hour<br />
Hydrogen Sulfide (H 2 S) Hourly 0.093 pound per hour<br />
n-Hexane Hourly 4.43 pound per hour<br />
Toluene Hourly 82 pounds per hour<br />
Xylenes Hourly 49 pounds per hour<br />
For all pollutants listed above except <strong>for</strong> VOC, a direct threshold is proposed and discussed in Section 3. Only<br />
a secondary threshold exists and is proposed <strong>for</strong> VOCs as it is a precursor <strong>for</strong> O 3 . The reasoning and<br />
methodology <strong>for</strong> screening <strong>for</strong> O 3 is discussed in Section 5.<br />
3.2 Acceptable Screening Models<br />
The EPA-approved screening model is AERSCREEN. The latest version is 21112 and is a free download through<br />
EPA’s Support Center <strong>for</strong> Regulatory Atmospheric Modeling (SCRAM). AERSCREEN is the EPA approved<br />
screening tool that analyzes one source and is based on AERMOD that produces worst-case 1-hour<br />
concentrations. AERSCREEN does not utilize hourly meteorological data but uses default meteorological data<br />
sets based on land type and average weather through the use of MAKEMET (version no. 21112). AERSCREEN<br />
is a Disk Operating System (DOS) program so should be able to be downloaded and run on any computer.<br />
<strong>Commerce</strong> <strong>City</strong> Modeling Guidance Document<br />
<strong>Commerce</strong> <strong>City</strong> Environmental Consulting Services<br />
7887 East 60 th Avenue, <strong>Commerce</strong> <strong>City</strong>, Colorado 80022 Page 6<br />
238
The following sections detail the use of AERSCREEN <strong>for</strong> emissions sources in <strong>Commerce</strong> <strong>City</strong>, though the EPA<br />
user’s guide <strong>for</strong> AERSCREEN can also be referenced (EPA, 2021e).<br />
3.3 Source Parameters<br />
Once opened, AERSCREEN will request a title <strong>for</strong> your project. It is recommended to title your project as<br />
such “Company Emissions Unit Pollutant” or <strong>for</strong> an example “Company X Boiler NO 2 ”. To move to the next<br />
section, press “Enter”.<br />
AERSCREEN will then request to choose units: English (E) or Metric (M). There is no preference<br />
recommended, but a reminder to remain consistent with the units throughout the model run. To move to the<br />
next section, press “Enter”.<br />
AERSCREEN will then request to choose an emissions source type: Point or Vertical Stack (P), Volume (V),<br />
Rectangular Area (A), Circular Area (C), Flare (F), Capped Stack (S), or Horizontal Stack (H). Based on the<br />
type of emissions sources researched in the Community Impacts Report (Pinyon, 2021), there are the potential<br />
<strong>for</strong> each of these types of sources. There<strong>for</strong>e, tables below are included <strong>for</strong> necessary data to be collected <strong>for</strong><br />
each source type and then typed into the AERSCREEN model. Both English and Metric units are included<br />
depending on the earlier choice.<br />
Table 3-2. Emissions Source Type Parameters<br />
Parameter English Units Metric Units<br />
Vertical Stack (P), Capped Stack (S), Horizontal Stack (H)<br />
Emissions Rate pound per hour (lb/hr) gram per second (g/s)<br />
Stack Height feet (ft) meters (m)<br />
Stack Diameter inches (in) meters (m)<br />
Stack Temperature Fahrenheit (deg F) degrees Kelvin (K)<br />
Exhaust Flow<br />
Option 1 Exit Velocity (m/s)<br />
Option 2 Exit Velocity (ft/s)<br />
Option 3 Flow Rate (ACFM)<br />
Option 1 – Not applicable<br />
Option 2 – feet per second (ft/s)<br />
Option 3 – actual cubic feet per<br />
minute (ACFM)<br />
<strong>Commerce</strong> <strong>City</strong> Modeling Guidance Document<br />
<strong>Commerce</strong> <strong>City</strong> Environmental Consulting Services<br />
7887 East 60 th Avenue, <strong>Commerce</strong> <strong>City</strong>, Colorado 80022 Page 7<br />
239<br />
Flares (F)<br />
Option 1 – meters per second<br />
(m/s)<br />
Option 2 – Not applicable<br />
Option 3 – Not applicable<br />
Emissions Rate pound per hour (lb/hr) gram per second (g/s)<br />
Stack Height feet (ft) meters (m)<br />
Total Heat Release 1 calories per second (cal/s) Not applicable<br />
Radiative Heat Loss Fraction Use default value of 0.55<br />
Volume (V)<br />
Emissions Rate pound per hour (lb/hr) gram per second (g/s)<br />
Center of Volume Height feet (ft) meters (m)<br />
Initial Lateral Dimension feet (ft) meters (m)<br />
Initial Vertical Dimension feet (ft) meters (m)<br />
Rectangular Area (A)
Parameter English Units Metric Units<br />
Emissions Rate pound per hour (lb/hr) gram per second (g/s)<br />
Release Height Above Ground feet (ft) meters (m)<br />
Long Side Dimension feet (ft) meters (m)<br />
Short Side Dimension feet (ft) meters (m)<br />
Initial Vertical Dimension feet (ft) meters (m)<br />
Circular Area (C)<br />
Emissions Rate pound per hour (lb/hr) gram per second (g/s)<br />
Release Height Above Ground feet (ft) meters (m)<br />
Radius of Source feet (ft) meters (m)<br />
Initial Vertical Dimension feet (ft) meters (m)<br />
1<br />
Can be converted from permitted value of MMBtu/hr multiplied by 69,998.8225.<br />
3.4 Emissions Rates<br />
As discussed above, the emissions rate <strong>for</strong> the individual source is entered either in English or Metric units.<br />
The emissions input should be a maximum hourly rate. Details are provided in Section 3.11 in this document<br />
to convert the model output <strong>for</strong> pollutants with averaging periods longer than 1-hour.<br />
To estimate NO 2 concentrations, there are more refined options <strong>for</strong> modeling: ozone limiting method (OLM),<br />
and plume volume molar ratio method (PVMRM). With OLM and PVMRM, the background ozone<br />
concentration can be used in conjunction with in-stack ratios <strong>for</strong> each emission unit type (e.g., reciprocating<br />
engine, turbine, heater, flare, etc.). The in-stack ratios should be retrieved from the most recent version of the<br />
EPA NO 2 In-Stack Ratio (ISR) database released in October of 2020. Non-zero values should not be included<br />
when determining the average ISR used in the AERSCREEN model. The “No Chemistry” option should be<br />
used <strong>for</strong> CO, SO 2 , PM 10 , PM 2.5 and all toxic air pollutant model runs.<br />
3.5 Source Location<br />
The next screen following the stack parameters will ask if the area surrounding the emissions source is Rural<br />
or Urban. <strong>Commerce</strong> <strong>City</strong> is considered an urban area and should there<strong>for</strong>e enter “U”. Following that choice,<br />
the screen will ask to enter the population of the Urban area. The 2020 census data <strong>for</strong> <strong>Commerce</strong> <strong>City</strong> shows<br />
a population of 62,418 (US Census Bureau, 2022).<br />
Since AERSCREEN is a single-source model, the location of an individual source and its distance relation to<br />
other sources cannot be directly modeled. Two approaches to determining model results of more than one<br />
source against the SIL, NAAQS, or TLV can be taken. These are discussed further in Section 3.11.<br />
3.6 Receptors<br />
Since AERSCREEN models only one source at a time, a receptor grid is generated by AERSCREEN based on<br />
the minimum distance to ambient air, set receptor spacing, and radius length of a receptor grid from the single<br />
source. Receptors should be set with the below parameters to estimate worst-case impacts surrounding the<br />
source. Based on known data and default parameters within AERSCREEN, the following was used <strong>for</strong> each of<br />
the AERSCREEN runs.<br />
<strong>Commerce</strong> <strong>City</strong> Modeling Guidance Document<br />
<strong>Commerce</strong> <strong>City</strong> Environmental Consulting Services<br />
7887 East 60 th Avenue, <strong>Commerce</strong> <strong>City</strong>, Colorado 80022 Page 8<br />
240
• Distance to Ambient Air: 1 meter (default)<br />
• Maximum Distance to probe: 5,000 meters (default)<br />
• Receptor spacing: 25 meters (default)<br />
• Discrete receptors: none<br />
o<br />
Up to 10 discrete receptors may be used should individual public receptors require separate<br />
analysis such as public parks, hospitals, child-care facilities, etc. In such cases, choose yes (Y)<br />
and include the exact distance from the emitting source to the individual public receptors.<br />
• Flagpole receptors: none<br />
3.7 Background Concentrations<br />
Generally <strong>for</strong> screening modeling analyses, background concentrations are not utilized unless <strong>for</strong> a cumulative<br />
analysis (Section 3.12) and/or when using the OLM or PVMRM method discussed in Section 3.4. This is because<br />
modeling analyses when comparing to the SIL do not include nearby sources or ambient air concentrations.<br />
The next line following choosing NO 2 OLM or PVMRM option is to input an in-stack ratio and then the<br />
background ozone concentration. Table 3-3 below details the appropriate monitoring stations by pollutant <strong>for</strong><br />
<strong>Commerce</strong> <strong>City</strong> in lieu of onsite data. Should onsite monitoring data be available, the most recent year’s data<br />
should be used. If the representative monitoring stations in Table 3-3 are used, the average of the three previous<br />
years will be the background concentration. The CDPHE annual monitoring values can be found in annual<br />
reports on the CDPHE website (https://www.colorado.gov/airquality/tech_doc_repository.aspx). The values<br />
are also available on the EPA AirData where exceptional events data should be included, to be conservative<br />
(https://www.epa.gov/outdoor-air-quality-data/monitor-values-report). Annual data is usually finalized and<br />
reported in the summer of the following year and only finalized data should be used <strong>for</strong> background<br />
concentrations.<br />
As discussed in the Modeling Thresholds Report (Pinyon, 2022), there are no background values used in<br />
modeling analyses <strong>for</strong> toxic air pollutants. Moreover, Colorado doesn’t monitor background concentrations of<br />
toxic air pollutants. There<strong>for</strong>e, toxics are not included in the table below.<br />
Table 3-3 Monitoring Stations <strong>for</strong> Cumulative Analysis<br />
Pollutant<br />
CO<br />
NO 2<br />
Averaging Time<br />
1 hour<br />
8 hour<br />
1 hour<br />
Annual<br />
Monitoring Station<br />
(AQS Site Number)<br />
Welby (08-001-3001)<br />
Welby (08-001-3001)<br />
O 3 8 hours Welby (08-001-3001)<br />
PM 2.5<br />
24 hours<br />
Annual<br />
Birch Street (08-001-0010)<br />
PM 10 24 hours Birch Street (08-001-0010)<br />
Background<br />
Concentration<br />
Average of previous<br />
three years of final data<br />
<strong>Commerce</strong> <strong>City</strong> Modeling Guidance Document<br />
<strong>Commerce</strong> <strong>City</strong> Environmental Consulting Services<br />
7887 East 60 th Avenue, <strong>Commerce</strong> <strong>City</strong>, Colorado 80022 Page 9<br />
241
Pollutant<br />
Averaging Time<br />
Monitoring Station<br />
(AQS Site Number)<br />
SO 2 1 hour Welby (08-001-3001)<br />
Background<br />
Concentration<br />
3.8 Terrain Options<br />
AERSCREEN, as a screening tool, does not necessarily require location-specific or representative terrain data.<br />
Due to the relatively flat nature of the <strong>Commerce</strong> <strong>City</strong>, the terrain heights were not included with a source<br />
elevation of 0 meters in an urban setting. Because the majority of the land surrounding the Facility is developed<br />
with a high population density, urban dispersion was chosen. If it is decided to include terrain heights, the<br />
source coordinates type are either latitude/longitude (LATLON) or Universal Transverse Mercator (UTM)<br />
datum type. Otherwise default to 0 m source elevation<br />
3.9 Meteorology<br />
Generally, no onsite meteorological data are available <strong>for</strong> minor sources of air pollutants. AERSCREEN does<br />
not require any meteorological data and instead uses a program called MAKEMET to generate basic<br />
meteorological parameters based on surface characteristics, wind speed, and temperature. Based on the site<br />
location, known data, and default parameters within AERSCREEN, the following was used <strong>for</strong> each of the<br />
AERSCREEN runs. Note that the worst-case meteorology wind speed, wind direction, and temperature were<br />
used, making the modeling of emission sources conservative.<br />
• Minimum Temperature: - 10 degrees Fahrenheit (default)<br />
• Maximum Temperature: 100 degrees Fahrenheit (default)<br />
• Minimum Wind Speed: 0.5 meters per second (default)<br />
• Anemometer Height: 10 meters (default)<br />
• AERMET seasonal tables: option 2<br />
• Dominant Surface Profile: Urban (7)<br />
• Dominant Climate Profile: Average Moisture (1)<br />
• Non-adjusted (default)<br />
After this response, AERSCREEN will ask <strong>for</strong> your file name. The OUT file name must end in .out. It is<br />
recommended the OUT file name be Company_Source_Pollutant.out or <strong>for</strong> example<br />
“CompanyX_Boiler_NO2.out”.<br />
3.10 Building Downwash and Fumigation<br />
It is recommended building downwash and fumigation not be included in the AERSCREEN runs. There is little<br />
sensitivity in the use of downwash <strong>for</strong> AERSCREEN runs. Fumigation is also used <strong>for</strong> sources near shorelines<br />
which is not applicable <strong>for</strong> new or modified facilities in <strong>Commerce</strong> <strong>City</strong>.<br />
<strong>Commerce</strong> <strong>City</strong> Modeling Guidance Document<br />
<strong>Commerce</strong> <strong>City</strong> Environmental Consulting Services<br />
7887 East 60 th Avenue, <strong>Commerce</strong> <strong>City</strong>, Colorado 80022 Page 10<br />
242
3.11 Impacts Thresholds<br />
Impacts thresholds used <strong>for</strong> screening evaluations reference current CDPHE Air Pollution Control Division<br />
“Interim Colorado Modeling Guideline <strong>for</strong> Air Quality Permits” released in October of 2021 and revised in<br />
May 2022 (CDPHE, 2022) and in Table 2-2. Where two averaging times exist <strong>for</strong> the same pollutant, both<br />
averaging times should be evaluated.<br />
Based on how AERSCREEN operates, the <strong>for</strong>m of the standard is not considered in the model output. Instead,<br />
the maximum potential 1-hour concentration is modeled and, if applicable, persistence factors are applied to<br />
the maximum 1-hour result <strong>for</strong> longer averaging times. Based on AERSCREEN guidance, the maximum 1-hour<br />
result is multiplied by 1 <strong>for</strong> 3-hour standards, multiplied by 0.9 <strong>for</strong> 8-hour standards, multiplied by 0.6 <strong>for</strong> 24-<br />
hour standards, and multiplied by 0.1 <strong>for</strong> annual standards. The results summary in the AERSCREEN OUT file<br />
<strong>for</strong> AERSCREEN applies these persistence factors when presenting the scaled longer average time period<br />
results.<br />
There are two conservative approaches to estimate impacts from a new or modified facility with multiple<br />
emissions points. These approaches are conservative in that they do not account <strong>for</strong> realistic conditions such<br />
as the space between sources and gaps that would occur between individual source dispersion plumes.<br />
• Assume that all of the sources originate at the same central point where dispersion plumes overlap<br />
completely.<br />
• Evaluate the maximum 1 st high through 8 th high results of each individual source additively regardless of<br />
location (i.e., one sources’ maximum 1st high at 200 meters added to another sources’ maximum 1st high<br />
at 1 meter).<br />
As previously mentioned, the highest first high of either the 1-hour, 8-hour, 24-hour or annual impact should<br />
be compared to the SIL <strong>for</strong> criteria pollutants or TLV <strong>for</strong> toxic air pollutants.<br />
Cancer inhalation risk is calculated by multiplying the annual model result by the Cancerous TLV shown in<br />
Table 2-3 along with an exposure adjustment factor. Two exposure scenarios can be evaluated: the maximum<br />
exposed individual (MEI) and the most likely exposure (MLE). For the MEI risk, it is assumed that a person is<br />
exposed continuously (24 hours per day, 365 days per year) <strong>for</strong> the life of a project (e.g., 30 years). For the<br />
MLE risk, an adjustment should be made <strong>for</strong> the amount of time a person stays at a residence. No adjustment<br />
will be made <strong>for</strong> time away from home, to conservatively assume that people live and work in <strong>Commerce</strong> <strong>City</strong>.<br />
A typical residence time at the same location <strong>for</strong> a residential receptor can be from 6 to 30 years (EPA, 2009),<br />
so a midrange of 18 years was used <strong>for</strong> the average residential exposure. Exposure adjustment factors of 0.43<br />
<strong>for</strong> the MEI (30/70) and 0.26 <strong>for</strong> the MLE (18/70) were applied to the estimated cancer risk to account <strong>for</strong> the<br />
actual time that an individual could be exposed during a 70-year lifetime. There<strong>for</strong>e, the annual model result of<br />
a cancer-causing toxic air pollutant (either one source’s annual output or the sum of multiple source’s output<br />
as bulleted in the conservative approaches above) should be multiplied by 0.43 and then by the IUR <strong>for</strong> the<br />
specific pollutant. Note that EPA only has IUR <strong>for</strong> acetaldehyde, benzene, ethylbenzene, and <strong>for</strong>maldehyde. The<br />
result of the multiplication should be less than 1 in 1 million (1 x 10 -6 ).<br />
All emissions sources at a modified facility should be included in the screening analysis even if only one source<br />
is being modified. New facilities should model all emissions sources in the screening analysis, as well. Sources<br />
with the same pollutant emissions will be evaluated together; namely all the CO emissions sources will add<br />
modeled impacts in the two conservative approaches, all the SO 2 emissions sources will add their modeled<br />
impacts in the two conservative approaches, and so on.<br />
<strong>Commerce</strong> <strong>City</strong> Modeling Guidance Document<br />
<strong>Commerce</strong> <strong>City</strong> Environmental Consulting Services<br />
7887 East 60 th Avenue, <strong>Commerce</strong> <strong>City</strong>, Colorado 80022 Page 11<br />
243
The new or modified facility should evaluate its impacts using approved screening models against the<br />
appropriate SILs, TLVs, and cancer risk threshold (1 x 10 -6 ). Background values <strong>for</strong> specific pollutants should<br />
not be added to model results. If the modeled impact is below the appropriate SILs, TLVs, and cancer risk<br />
threshold, no further analysis is recommended to be necessary. The conservative nature of the screening<br />
models and the low impacts thresholds provide confidence in the low impact on public health and environment.<br />
3.12 Cumulative Analysis<br />
If the screening modeling shows results equal to or higher than any of the significant impact levels (Table 3-1),<br />
a cumulative analysis is recommended. A cumulative modeling analysis is conducted as outlined above <strong>for</strong> the<br />
new or modified facility sources but will also include modeling of nearby sources and background<br />
concentrations. If there are more than 5 nearby sources, it is recommended to skip additional screening and<br />
conduct a refined modeling analysis due to the overly conservative nature of the screening process.<br />
With a cumulative modeling analysis using screening, the same steps <strong>for</strong> running AERSCREEN should be used.<br />
Additionally, instead of just conducting modeling of the sources at the new or modified facility, inclusion of<br />
model results from nearby sources should also be completed. The combined model results (all at the new or<br />
modified facility plus the nearby sources) <strong>for</strong> both conservative approaches detailed in Section 3.11 should then<br />
be added to the appropriate pollutant background concentration (Section 3.7) and then compared against the<br />
appropriate NAAQS.<br />
For the criteria pollutants and averaging periods that are percentiles (i.e., 1-hour NO 2 , 1-hour SO 2 , 24-hour<br />
PM 2.5 ), AERSCREEN alone is unable to compare model results to the <strong>for</strong>m of the standard of NAAQS.<br />
There<strong>for</strong>e, further analysis of the results should be completed to determine if the combined model result of<br />
the second conservative approach (evaluate the maximum 1 st high through 8 th high results of each individual<br />
source additively regardless of location) is above the NAAQS. Table 3-4 notates how to further analyze each<br />
pollutants’ model results.<br />
Table 3-4. National Ambient Air Quality Standards with Form of Standard Interpretation of<br />
Model Result<br />
Pollutant<br />
CO<br />
NO 2<br />
1<br />
PM 2.5<br />
Averaging Time<br />
Primary<br />
NAAQS<br />
1 hour 35 ppm<br />
8 hours 9 ppm<br />
1 hour 100 ppb<br />
Annual<br />
53 ppb<br />
24 hours 35 µg/m 3<br />
Annual 12 µg/m 3<br />
PM 10 24 hours 150 µg/m 3<br />
Model Result to Compare to<br />
NAAQS<br />
2 nd highest 1-hour result of combined<br />
sources plus background<br />
2 nd highest 8-hour result of combined<br />
sources plus background<br />
8 th highest 1-hour result of combined<br />
sources plus background<br />
1 st highest annual result of combined<br />
sources plus background<br />
8 th highest 24-hour result of combined<br />
sources plus background<br />
1 st highest annual result of combined<br />
sources plus background<br />
6 th highest 24-hour result of combined<br />
sources plus background<br />
<strong>Commerce</strong> <strong>City</strong> Modeling Guidance Document<br />
<strong>Commerce</strong> <strong>City</strong> Environmental Consulting Services<br />
7887 East 60 th Avenue, <strong>Commerce</strong> <strong>City</strong>, Colorado 80022 Page 12<br />
244
Pollutant<br />
SO 2<br />
Averaging Time<br />
Primary<br />
NAAQS<br />
1 hour 75 ppb<br />
3 hours Not applicable<br />
Model Result to Compare to<br />
NAAQS<br />
4 th highest 1-hour result of combined<br />
sources plus background<br />
2 nd highest 3-hour result of combined<br />
sources plus background<br />
Note that the combined model results determined using the first conservative approach (assume that all of the<br />
sources originate at the same central point where dispersion plumes overlap completely) plus the background<br />
should be compared directly to the NAAQS without the further analysis tabulated above.<br />
A cumulative analysis is not appropriate <strong>for</strong> toxic air pollutants. For any screening modeling that shows results<br />
equal to or higher than TLVs (Table 2-3) or the cancer risk threshold, refined modeling or mitigation options<br />
should be considered.<br />
<strong>Commerce</strong> <strong>City</strong> Modeling Guidance Document<br />
<strong>Commerce</strong> <strong>City</strong> Environmental Consulting Services<br />
7887 East 60 th Avenue, <strong>Commerce</strong> <strong>City</strong>, Colorado 80022 Page 13<br />
245
4. Refined Modeling Methodology<br />
4.1.1 Emissions Thresholds<br />
For refined modeling evaluations, the emissions thresholds detailed in the modeling guidance document<br />
released by CDPHE should be used. CDPHE Air Pollution Control Division released their “Interim Colorado<br />
Modeling Guideline <strong>for</strong> Air Quality Permits” in October of 2021 and updated in May 2022 (CDPHE, 2022).<br />
Table 1 in Section 2 of the interim modeling guidelines detail the emissions thresholds in which CDPHE requires<br />
impacts evaluations. Note that CDPHE currently doesn’t routinely require or per<strong>for</strong>m modeling to determine<br />
impacts from toxics and Table 1 only includes criteria pollutants.<br />
4.1.2 Acceptable Refined Models<br />
For refined modeling evaluations, the approved models detailed in the modeling guidance document released<br />
by CDPHE should be used. The recommended model currently is AERMOD which is available through external<br />
graphic user interfaces (GUI). There is no preferred external GUI, but the most common are available <strong>for</strong><br />
purchase through software developers such as Lakes Software or Providence-Oris.<br />
4.1.3 Impacts Thresholds<br />
Per the CDPHE “Interim Colorado Modeling Guideline <strong>for</strong> Air Quality Permits” (CDPHE, 2022), modeling is<br />
first conducted <strong>for</strong> evaluation of the new or modified facility alone against the SIL levels detailed in Table 2 and<br />
Table 3, based on facility classification (e.g., minor, major, or PSD) of Section 3. Should initial modeling<br />
evaluation determine that the new or modified facility alone exceeds at least one of the SIL levels, then a<br />
cumulative analysis is required by CDPHE.<br />
4.1.4 Cumulative Analysis Requirements<br />
The CDPHE “Interim Colorado Modeling Guideline <strong>for</strong> Air Quality Permits” (CDPHE, 2022) should be<br />
followed to conduct a cumulative analysis of a new or modified facility’s impacts. The cumulative analysis results<br />
are compared to the appropriate Colorado Ambient Air Quality Standards (CAAQS) and NAAQS standards<br />
as shown in Table 6 and Table 7 of Section 3 of the interim modeling guideline.<br />
<strong>Commerce</strong> <strong>City</strong> Modeling Guidance Document<br />
<strong>Commerce</strong> <strong>City</strong> Environmental Consulting Services<br />
7887 East 60 th Avenue, <strong>Commerce</strong> <strong>City</strong>, Colorado 80022 Page 14<br />
246
5. Secondary Impacts Methodology<br />
For secondary pollutants such as O 3 and PM 2.5, EPA has released guidance commonly referred to as MERPs<br />
(Modeled Emission Rates <strong>for</strong> Precursors) to estimate their impacts (EPA, 2019). MERPs are used <strong>for</strong> the 8-<br />
hour O 3 , 24-hour PM 2.5 , and annual PM 2.5 secondary standards only. There are also secondary NAAQS <strong>for</strong><br />
annual NO 2 , Pb, 24-hour PM 10 , and 3-hour SO 2 . In some cases, the primary NAAQS is equal to the secondary<br />
NAAQS (e.g., annual NO 2 and 24-hour PM 10 ). To evaluate impacts against the secondary NAAQS that are not<br />
covered under MERP guidance, it is conservatively proposed that these standards be treated as primary <strong>for</strong> the<br />
purposes of screening. Further discussion on these will be discussed in subsequent sections.<br />
5.1 Emissions Thresholds<br />
The need <strong>for</strong> secondary impacts evaluations to provide in<strong>for</strong>mation to <strong>Commerce</strong> <strong>City</strong> and its residents is<br />
determined by a new or modified facility’s potential to emit specified pollutants over certain thresholds. There<br />
are no secondary impacts thresholds <strong>for</strong> toxic air pollutants. Table 3-4 shows the emissions thresholds of<br />
specified pollutants in this document. Should a new or modified facility have maximum potential emissions<br />
above these thresholds, screening modeling is recommended.<br />
Table 5-1. Emissions Thresholds <strong>for</strong> Screening – Secondary Pollutants<br />
Pollutant Averaging Time Emissions Threshold<br />
Criteria Pollutants<br />
Nitrogen Oxides (NOx) Hourly 0 pounds per hour<br />
Particulate Matter less than 2.5 microns<br />
(PM 2.5 )<br />
Particulate Matter less than 10 microns<br />
(PM 10 )<br />
Daily<br />
Daily<br />
11 pounds per day<br />
82 pounds per day<br />
Sulfur Dioxide (SO 2 ) Hourly 0.46 pounds per hour<br />
Volatile Organic Compounds (VOC) Hourly 0 pounds per hour<br />
Emissions thresholds <strong>for</strong> criteria pollutants were retrieved from Colorado Interim Guidance (CDPHE, 2022)<br />
<strong>for</strong> all pollutants except NOx and VOC. Due to the growing concern over these pollutants and the<br />
nonattainment status of <strong>Commerce</strong> <strong>City</strong> <strong>for</strong> O 3 whose precursors are NOx and VOC, all sources with the<br />
potential to emit NOx and VOC are recommended <strong>for</strong> screening.<br />
5.2 Acceptable Secondary Impacts Tools<br />
As previously mentioned, EPA has released MERP guidance that details methodologies and thresholds regarding<br />
estimating secondary impacts of O 3 and PM 2.5 (EPA, 2019). The guidance relies on previously completed<br />
sophisticated photochemical modeling where emissions rates of precursors such as NOx, SO 2 and VOCs were<br />
demonstrated to equal the SIL level <strong>for</strong> the appropriate secondary NAAQS (i.e., 8-hour O 3 , 24-hour PM 2.5 and<br />
annual PM 2.5 ). These emissions rates along with primary impacts modeling results such as those discussed in<br />
Section 3.2 are then used to estimate a new or modified facility’s secondary impacts <strong>for</strong> comparison against the<br />
SIL (Table 2-2) and/or NAAQS (Table 2-1). It is recommended that the MERP guidance along with other<br />
modeling guidance released by <strong>Commerce</strong> <strong>City</strong> be used to estimate secondary impacts from O 3 and PM 2.5 .<br />
<strong>Commerce</strong> <strong>City</strong> Modeling Guidance Document<br />
<strong>Commerce</strong> <strong>City</strong> Environmental Consulting Services<br />
7887 East 60 th Avenue, <strong>Commerce</strong> <strong>City</strong>, Colorado 80022 Page 15<br />
247
To determine the appropriate MERPs <strong>for</strong> precursors, new or modified facilities should use the Lowest<br />
emissions rate <strong>for</strong> the Rockies/Plains climate zone in Table 4-1 of the MERP guidance (EPA, 2019). These are<br />
tabulated below.<br />
Table 5-2. Lowest Illustrative MERP Values by Precursor <strong>for</strong> Rockies/Plains<br />
Averaging Time-<br />
Pollutant<br />
NOx Emissions<br />
(tons per year)<br />
VOC Emissions<br />
(tons per year)<br />
SOx Emissions<br />
(tons per year)<br />
8-hour O 3 184 1,067 Not applicable<br />
24-hour PM 2.5 1,740 Not applicable 251<br />
Annual PM 2.5 9,220 Not applicable 2,263<br />
The methodology to determine potential impacts against the 8-hour O 3 SIL is as follows:<br />
• Divide new or modified facility’s total NOx emissions in tons per year by 184 (tabulated above)<br />
• Divide new or modified facility’s total VOC emissions in tons per year by 1,067 (tabulated below)<br />
• Add the results of Step 1 and Step 2<br />
• If the result of Step 3 is less than 1, then the project is not expected to exceed the 8-hour O 3 SIL<br />
• If the result of Step 3 is greater than or equal to 1, then the new or modified facility will need to conduct<br />
a cumulative analysis described in Section 5.3.<br />
The methodology to determine potential impacts against the 24-hour PM 2.5 SIL is as follows:<br />
• Divide new or modified facility’s total NOx emissions in tons per year by 1,740 (tabulated above)<br />
• Divide new or modified facility’s total SO 2 emissions in tons per year by 251 (tabulated below)<br />
• Add the results of Step 1 and Step 2<br />
• If the result of Step 3 is less 1, then the project is not expected to exceed the 24-hour PM 2.5 SIL<br />
• If the result of Step 3 is greater than or equal to 1, then the new or modified facility will need to conduct<br />
a cumulative analysis described in Section 5.3.<br />
The methodology to determine potential impacts against the annual PM 2.5 SIL is as follows:<br />
• Divide new or modified facility’s total NOx emissions in tons per year by 9,220 (tabulated above)<br />
• Divide new or modified facility’s total SO 2 emissions in tons per year by 2,263 (tabulated below)<br />
• Add the results of Step 1 and Step 2<br />
• If the result of Step 3 is less 1, then the project is not expected to exceed the annual PM 2.5 SIL<br />
<strong>Commerce</strong> <strong>City</strong> Modeling Guidance Document<br />
<strong>Commerce</strong> <strong>City</strong> Environmental Consulting Services<br />
7887 East 60 th Avenue, <strong>Commerce</strong> <strong>City</strong>, Colorado 80022 Page 16<br />
248
• If the result of Step 3 is greater than or equal to 1, then the new or modified facility will need to conduct<br />
a cumulative analysis described in Section 5.3.<br />
For secondary pollutants not covered under the EPA MERP guidance, tools outlined <strong>for</strong> primary impacts should<br />
be used (see Section 3.2). As noted in Table 2-1, the primary and secondary standard <strong>for</strong> annual NO 2 and 24-<br />
hour PM 10 are the same threshold. There<strong>for</strong>e, no evaluation <strong>for</strong> secondary impacts of NO 2 and PM 10 would be<br />
recommended so long as the primary impacts of these standards are modeled below the SIL and/or NAAQS<br />
per Sections 3 and 4, respectively.<br />
5.3 Cumulative Analysis Requirements<br />
If the screening modeling shows results equal to or higher than 1, a cumulative analysis is recommended. At a<br />
high level, a cumulative analysis will take into account already modeled results as part of the MERP guidance<br />
and background values <strong>for</strong> comparison against the NAAQS (Table 2-1). Below are tabulated modeled results<br />
<strong>for</strong> the Rockies/Plains at specific emissions rates.<br />
Table 5-3. Modeled Values at Emissions Rates by Precursor <strong>for</strong> Rockies/Plains<br />
Averaging Time-<br />
Pollutant<br />
Modeled Impact at<br />
NOx Emissions Rate<br />
Modeled Impact at<br />
VOC Emissions Rate<br />
Modeled Impact at<br />
SOx Emissions Rate<br />
8-hour O 3 1.314 ppb at 184 ton/yr 0.0407 ppb at 1,067 ton/yr Not applicable<br />
24-hour PM 2.5<br />
Annual PM 2.5<br />
0.047 µg/m 3 at 1,740<br />
ton/yr<br />
0.047 µg/m 3 at 9,220<br />
ton/yr<br />
Not applicable<br />
Not applicable<br />
0.094 µg/m 3 at 251 ton/yr<br />
0.094 µg/m 3 at 2,263<br />
ton/yr<br />
The methodology to determine potential impacts against the 8-hour O 3 NAAQS is as follows:<br />
• Multiply new or modified facility’s total NOx emissions in tons per year by 1.314 ppb and divide by 184<br />
(tabulated above)<br />
• Multiply new or modified facility’s total VOC emissions in tons per year by 0.0407 ppb and divide by 1,067<br />
(tabulated below)<br />
• Add the results of Step 1 and Step 2 and the background 8-hour O 3 value determined in Table 3-3 (Section<br />
3.7)<br />
• If the result of Step 3 is less than the 8-hour O 3 NAAQS in Table 2-1, then the project is not expected to<br />
exceed the 8-hour O 3 NAAQS<br />
• If the result of Step 3 is greater than or equal to 8-hour O 3 NAAQS in Table 2-1, then the new or modified<br />
facility will need to conduct further, complex modeling or pursue mitigation options.<br />
The methodology to determine potential impacts against the 24-hour PM 2.5 NAAQS is as follows:<br />
• Multiply new or modified facility’s total NOx emissions in tons per year by 0.047 µg/m 3 and divide by 1,740<br />
(tabulated above)<br />
<strong>Commerce</strong> <strong>City</strong> Modeling Guidance Document<br />
<strong>Commerce</strong> <strong>City</strong> Environmental Consulting Services<br />
7887 East 60 th Avenue, <strong>Commerce</strong> <strong>City</strong>, Colorado 80022 Page 17<br />
249
• Multiply new or modified facility’s total SO 2 emissions in tons per year by 0.094 µg/m 3 and divide by 251<br />
(tabulated below)<br />
• Add the results of Step 1 and Step 2 to the 24-hour PM 2.5 result of the new or modified facility only and<br />
the background 24-hour PM 2.5 value determined in Table 3-3 (Section 3.7)<br />
• If the result of Step 3 is less than the 24-hour PM 2.5 secondary NAAQS in Table 2-1, then the project is<br />
not expected to exceed the 24-hour PM 2.5 secondary NAAQS<br />
• If the result of Step 3 is greater than or equal to 24-hour PM 2.5 NAAQS in Table 2-1, then the new or<br />
modified facility will need to conduct further, complex modeling or pursue mitigation options.<br />
The methodology to determine potential impacts against the annual PM 2.5 SIL is as follows:<br />
• Multiply new or modified facility’s total NOx emissions in tons per year by 0.047 µg/m 3 and divide by 9,220<br />
(tabulated above)<br />
• Multiply new or modified facility’s total SO 2 emissions in tons per year by 0.094 µg/m 3 and divide by 2,263<br />
(tabulated below)<br />
• Add the results of Step 1 and Step 2 to the annual PM 2.5 result of the new or modified facility only and the<br />
background annual PM 2.5 value determined in Table 3-3 (Section 3.7)<br />
• If the result of Step 3 is less than the annual PM 2.5 secondary NAAQS in Table 2-1, then the project is not<br />
expected to exceed the annual PM 2.5 secondary NAAQS<br />
• If the result of Step 3 is greater than or equal to annual PM 2.5 NAAQS in Table 2-1, then the new or<br />
modified facility will need to conduct further, complex modeling or pursue mitigation options.<br />
<strong>Commerce</strong> <strong>City</strong> Modeling Guidance Document<br />
<strong>Commerce</strong> <strong>City</strong> Environmental Consulting Services<br />
7887 East 60 th Avenue, <strong>Commerce</strong> <strong>City</strong>, Colorado 80022 Page 18<br />
250
References<br />
Air Quality Control Commission (AQCC), 2021. “Regulation Number 3 Stationary Source Permitting and<br />
Air Pollutant Emission Notice Requirements”. May 15, 2021. Available through:<br />
https://cdphe.colorado.gov/aqcc-regulations.<br />
Colorado Department of Public Health and Environment (CDPHE), 2022. “Interim Colorado Modeling<br />
Guideline <strong>for</strong> Air Quality Permits”. October 2021 revised May 2022. Available through:<br />
https://www.colorado.gov/airquality/permits.aspx.<br />
Environmental Protection Agency (EPA), 1996. “Federal Register Volume 61, Number 142, Proposed Rules”.<br />
Page 38249-38344. July 23, 1996.<br />
EPA, 2009. “Risk Assessment Guidance <strong>for</strong> Superfund Volume I: Human Health Evaluation Manual (Part F,<br />
Supplemental Guidance <strong>for</strong> Inhalation Risk Assessment)”. January 2009. EPA-540-R-070-002.<br />
EPA, 2018. “Guidance on Significant Impact Levels <strong>for</strong> Ozone and Fine Particles in the Prevention of<br />
Significant Deterioration Permitting Program”. April 17, 2018. EPA-454/S-18-001.<br />
EPA, 2019. “Guidance on the Development of Modeled Emission Rates <strong>for</strong> Precursors (MERPS) as a Tier 1<br />
Demonstration Tool <strong>for</strong> Ozone and PM 2.5 under the PSD Permitting Program”. April 30,<br />
2019. EPA-454/R-19-003.<br />
EPA, 2021a. “NAAQS Table”. February 10, 2021. Available through: https://www.epa.gov/criteria-airpollutants/naaqs-table.<br />
EPA, 2021b. “Colorado Nonattainment/Maintenance Status <strong>for</strong> Each County by Year <strong>for</strong> All Criteria<br />
Pollutants”. November 30, 2021. Available through:<br />
https://www3.epa.gov/airquality/greenbook/anayo_co.html.<br />
EPA, 2021c. “Table 2 Acute Dose-Response Values <strong>for</strong> Screening Risk Assessments”. August 31, 2021.<br />
Available through: https://www.epa.gov/fera/dose-response-assessment-assessing-healthrisks-associated-exposure-hazardous-air-pollutants.<br />
EPA, 2021d. “Table 1 Prioritized Chronic Dose-Response Values <strong>for</strong> Screening Risk Assessments”.<br />
September 29, 2021. Available through: https://www.epa.gov/fera/dose-response-assessmentassessing-health-risks-associated-exposure-hazardous-air-pollutants.<br />
EPA, 2021e. “AERSCREEN User’s Guide”. April 2021. EPA-454/B21-005. Available at:<br />
https://gaftp.epa.gov/Air/aqmg/SCRAM/models/screening/aerscreen/aerscreen_userguide.pdf.<br />
Pinyon Environmental, Inc., 2021. “<strong>Commerce</strong> <strong>City</strong> Community-Wide Impacts Report”. October 1, 2021.<br />
Pinyon Environmental Inc., 2022. “Modeling Thresholds Report”. July 31, 2022.<br />
United States Census Bureau (US Census Bureau), 2021. “QuickFacts <strong>Commerce</strong> <strong>City</strong> <strong>City</strong>, Colorado”.<br />
Available at: https://www.census.gov/quickfacts/fact/table/commercecitycitycolorado .<br />
<strong>Commerce</strong> <strong>City</strong> Modeling Guidance Document<br />
<strong>Commerce</strong> <strong>City</strong> Environmental Consulting Services<br />
7887 East 60 th Avenue, <strong>Commerce</strong> <strong>City</strong>, Colorado 80022<br />
251
Appendix B. AQ and WQ<br />
Technical Documents<br />
Memorandum<br />
Date: June 2, 2022<br />
To:<br />
From:<br />
Subject:<br />
Rosemarie Russo, Environmental <strong>Plan</strong>ner III, <strong>Commerce</strong> <strong>City</strong><br />
Dustin Collins, Pinyon Environmental, Inc.<br />
Oil & Gas <strong>Plan</strong> Submittal Guidance Overview<br />
Introduction<br />
Pinyon Environmental, Inc. (Pinyon) is pleased to present this memorandum outlining existing oil and gas<br />
regulations involving air quality within the <strong>Commerce</strong> <strong>City</strong> Land Development Code (LDC) Ordinance 2266:<br />
Revised Oil and Gas Regulations (Ordinance 2266) – adopted March 15, 2021. Additionally, this memo<br />
provides a comparison to existing oil and gas air quality regulations within nearby Boulder and Larimer<br />
Counties to determine if Ordinance 2266 is comprehensive in its list of requirements involving oil and gas<br />
activities within <strong>Commerce</strong> <strong>City</strong>.<br />
Ordinance 2266: Revised Oil and Gas Regulations<br />
Adoption Process<br />
<strong>Commerce</strong> <strong>City</strong> spent two years working to update its comprehensive oil and gas regulations to reflect<br />
current regulatory trends and industry best practices more accurately. Initially presented in 2019, the draft<br />
regulations adopted in Ordinance 2266 underwent several rounds of feedback from <strong>City</strong> Council and<br />
stakeholders, including regulatory and government agencies, industry representatives, advocacy groups, and<br />
the <strong>Commerce</strong> <strong>City</strong> oil and gas focus group. Additionally, <strong>Commerce</strong> <strong>City</strong> held two public open houses prior<br />
to the adoption of Ordinance 2266 on March 15, 2021.<br />
Regulatory Agencies<br />
Oil and gas development in Colorado is regulated by the Colorado Oil and Gas Conservation Commission<br />
(COGCC), a division of the Colorado Department of Natural Resources. COGCC manages all belowground<br />
aspects of oil and gas drilling and conducts the state permitting process. To obtain permits, operators<br />
must follow the permitting process from the COGCC, Colorado Department of Public Health and<br />
Environment (CDPHE), and <strong>Commerce</strong> <strong>City</strong> through separate processes be<strong>for</strong>e any new oil and gas activity<br />
can begin.<br />
Summary of Air Quality Regulations<br />
A series of Best Management Practices (BMPs), standards, protections, and specifications related to air quality<br />
have been developed by <strong>Commerce</strong> <strong>City</strong> to prevent or mitigate the degradation of <strong>Commerce</strong> <strong>City</strong>’s air and<br />
visibility resources; prevent odors and air pollution problems; and to improve the quality of life and general<br />
welfare in <strong>Commerce</strong> <strong>City</strong>. This was done through a series of BMPs adopted in Ordinance 2266, covering the<br />
following activities and processes related to air quality:<br />
Technical Memorandum<br />
Oil & Gas <strong>Plan</strong> Submittal Guidance Overview Page 1<br />
252
• Minimization of Emissions – minimization ef<strong>for</strong>ts include hydrocarbon destruction efficiency of 98% or<br />
better, use of no-bleed continuous and intermittent pneumatic devices, glycol dehydrators prohibited,<br />
operating all equipment in accordance with manufacturer recommendations, etc.<br />
• Ambient Air Monitoring – creation and submittal of a plan detailing how the operator will conduct<br />
baseline monitoring prior to construction of the well site. Additionally, the plan must also describe how<br />
the operator will conduct continuous monitoring and collect periodic canister samples (or equivalent<br />
method) during the drilling, completion, and production phases of development.<br />
• Leak Detection and Repair (LDAR) – development and maintenance of an acceptable LDAR program as<br />
required by CDPHE using modern leak detection technologies such as infrared (IR) cameras <strong>for</strong><br />
equipment used at a well site.<br />
• Ozone Air Quality <strong>Action</strong> Days – implementation of CDPHE suggested air emission reduction measures<br />
during air quality action day advisories including reductions in vehicle idling, traffic, refueling, etc.<br />
• Electric Equipment – requirement <strong>for</strong> all permanent production equipment, such as compressors,<br />
motors, and artificial lift equipment to utilize electric line power to mitigate noise and reduce emissions.<br />
• Exhaust – requirement <strong>for</strong> all exhaust from engines, motors, coolers, and other mechanized equipment<br />
vented up or in a direction away from the nearest occupied building.<br />
• Flares and Combustion Devices – designed and operated using manufacturer specifications, 98%<br />
hydrocarbon destruction efficiency, no visible emissions, etc.<br />
• Fugitive Dust – minimization of dust associated with onsite activities and traffic on access roads<br />
throughout construction, drilling, and operation activities to ensure no visible dust emissions from access<br />
roads or well sites.<br />
• Odor Containment – control and prevent odors from operations from affecting adjacent properties and<br />
proactively address and resolve complaints by impacted members of the community.<br />
• Reduced Emission Completions (Green Completions) – employment of reduced emission completions<br />
(“Green Completions”) in compliance with federal and state requirements.<br />
• Annual Report – annual report certifying compliance with air quality requirements contained within<br />
Ordinance 2266.<br />
For a detailed summary of air quality revisions included in Ordinance 2266, please refer to Exhibit I, Part C of<br />
Ordinance 2266 (<strong>Commerce</strong> <strong>City</strong>, 2021).<br />
Comparison to Nearby Oil and Gas Development Regulations<br />
The air quality oil and gas regulations adopted by <strong>Commerce</strong> <strong>City</strong> in Ordinance 2266 were compared to the<br />
Boulder County Land Use Code (LUC) Resolution 2020-95 Article 12: Regulations of Oil and Gas<br />
Development, Facilities and Operations adopted on December 15, 2020 (Boulder, 2020) and the Larimer<br />
County LUC Article 11: Oil & Gas Facilities adopted on July 29, 2021 (Larimer, 2021). Pinyon has determined<br />
the oil and gas regulations related to air quality in Ordinance 2266 as compared to Boulder County Article<br />
12 and Larimer County Article 11 is comprehensive in its list of requirements above and beyond state and<br />
federal air quality requirements. Examples include a minimum 98% hydrocarbon destruction efficiency from<br />
Technical Memorandum<br />
Oil & Gas <strong>Plan</strong> Submittal Guidance Overview Page 2<br />
253
flares and combustion devices, prohibiting the use of glycol dehydrators or desiccant gas processing<br />
dehydrators, and requiring all permanent production equipment (such as compressors, motors, and artificial<br />
lift equipment) to utilize electric power to mitigate noise and emissions reduction. Requirements within<br />
Ordinance 2266 that are also present within the Boulder or Larimer Counties regulations include but are not<br />
limited to the minimization of emissions through equipment limitations, air quality modeling, LDAR, fugitive<br />
dust control, use of electric equipment, odor containment, and prohibiting routine flaring.<br />
Environmental Justice Screening<br />
Based on Colorado’s environmental justice screening tool, the <strong>Commerce</strong> <strong>City</strong> community is subject to air<br />
quality impacts from industry that are above average. Specifically, criteria pollutants regulated by EPA and<br />
CDPHE are emitted from large industrial sources into the <strong>Commerce</strong> <strong>City</strong> area at levels higher than other<br />
communities. The en<strong>for</strong>cement of oil and gas regulations included in <strong>City</strong> Ordinance 2266 may not result in a<br />
reduction of these pollutants in the near term but may help to mitigate future increases in air pollutants if oil<br />
and gas activity were regulated to a lesser degree.<br />
Conclusion<br />
Based on the overview above, Pinyon has concluded the air quality oil and gas regulations included in<br />
<strong>Commerce</strong> <strong>City</strong> Ordinance 2266 adopted on March 15, 2021, is comprehensive in its list of requirements.<br />
Should any of the above regulatory requirements be modified or removed, further analysis may be beneficial<br />
to determine continued minimization of air quality impacts through BMPs with <strong>City</strong> Ordinance 2266, and<br />
COGCC and CDPHE air quality requirements.<br />
Technical Memorandum<br />
Oil & Gas <strong>Plan</strong> Submittal Guidance Overview Page 3<br />
254
References<br />
Boulder County (Boulder), 2020. “Resolution 2020-95 and final regulations.” Available at:<br />
https://www.bouldercounty.org/property-and-land/land-use/planning/oil-gas-development/<br />
<strong>City</strong> of <strong>Commerce</strong> <strong>City</strong> (<strong>Commerce</strong> <strong>City</strong>), 2021. “Ordinance 2266: Revised Oil and Gas Regulations.”<br />
Available at: https://www.c3gov.com/living-in/environment-sustainability/oil-gas-operations<br />
Larimer County (Larimer), 2021. “Land Use Code Article 11.0 Oil and Gas Facilities.” Available at:<br />
https://www.larimer.org/sites/default/files/uploads/2021/article_11.0_oil_and_gas_facilities_-<br />
_final_clean_1_2.pdf<br />
Technical Memorandum<br />
Oil & Gas <strong>Plan</strong> Submittal Guidance Overview Page 4<br />
255
Appendix B. AQ and WQ<br />
Technical Documents<br />
December 7, 2022<br />
Air Quality Emissions Reduction Guidance<br />
<strong>Commerce</strong> <strong>City</strong> Environmental Consulting Services<br />
7887 East 60th Avenue<br />
<strong>Commerce</strong> <strong>City</strong>, Colorado<br />
Prepared <strong>for</strong>:<br />
<strong>City</strong> of <strong>Commerce</strong> <strong>City</strong><br />
7887 East 60th Avenue<br />
<strong>Commerce</strong> <strong>City</strong>, CO 80022<br />
Pinyon Project No.:<br />
1/21-1435-01<br />
256
December 7, 2022<br />
Air Quality Emissions Reduction Guidance<br />
<strong>Commerce</strong> <strong>City</strong> Environmental Consulting Services<br />
7887 East 60th Avenue<br />
<strong>Commerce</strong> <strong>City</strong>, Colorado<br />
Prepared <strong>for</strong>:<br />
<strong>City</strong> of <strong>Commerce</strong> <strong>City</strong><br />
7887 East 60th Avenue<br />
<strong>Commerce</strong> <strong>City</strong>, CO 80022<br />
Pinyon Project No.:<br />
1/21-1435-01<br />
Prepared by:<br />
___________________________<br />
Anthony Der Tatevasion<br />
Reviewed by:<br />
___________________________<br />
Dustin Collins<br />
257
Table of Contents<br />
Executive Summary ..................................................................................................................................................................... 1<br />
1. Introduction and Purpose ................................................................................................................................................ 2<br />
2. Pollutants of Concern ....................................................................................................................................................... 3<br />
3. Emissions Reduction Ef<strong>for</strong>ts ............................................................................................................................................ 6<br />
3.1 Impacts Inventory ................................................................................................................................................... 6<br />
3.2 Enhanced Monitoring Network .......................................................................................................................... 6<br />
3.3 Air Quality Threshold Levels .............................................................................................................................. 7<br />
3.4 Oil and Gas Regulatory Requirements ............................................................................................................. 7<br />
3.5 BACT and Emissions Control ............................................................................................................................. 8<br />
4. Emissions Reduction Ef<strong>for</strong>ts – New or Modified Sources ....................................................................................... 9<br />
Tables<br />
Table 2-1. National Ambient Air Quality Standards........................................................................................................ 4<br />
<strong>Commerce</strong> <strong>City</strong> Emissions Reduction Guidance<br />
<strong>Commerce</strong> <strong>City</strong> Environmental Consulting Services<br />
7887 East 60 th Avenue, <strong>Commerce</strong> <strong>City</strong>, Colorado 80022 Page i<br />
258
Executive Summary<br />
Pinyon Environmental, Inc. (Pinyon) has prepared this Air Quality Emissions Reduction Guidance document <strong>for</strong><br />
the <strong>City</strong> of <strong>Commerce</strong> <strong>City</strong> (<strong>Commerce</strong> <strong>City</strong>) to establish emission reduction strategies <strong>for</strong> air quality<br />
pollutants identified in the Community-Wide Impacts Report (Pinyon, 2021a). The Community-Wide Impacts<br />
Report identifies pollutants of concern including criteria pollutants, precursors <strong>for</strong> criteria pollutants, and toxic<br />
pollutants that may occur within and near the <strong>Commerce</strong> <strong>City</strong> boundary. This Emissions Reduction Guidance<br />
builds upon that previous Impacts Report by presenting what emissions reduction strategies can be developed<br />
to potentially reduce those pollutants quantities and impacts. Specifically, this report includes emissions and<br />
impacts reduction in<strong>for</strong>mation including impacts inventory updates, monitoring network enhancements,<br />
emissions thresholds implementation, oil and gas requirements reviews, utilization of best available control<br />
technology (BACT) and other similar analyses, and other emissions control suggestions.<br />
<strong>Commerce</strong> <strong>City</strong> Emissions Reduction Guidance<br />
<strong>Commerce</strong> <strong>City</strong> Environmental Consulting Services<br />
7887 East 60 th Avenue, <strong>Commerce</strong> <strong>City</strong>, Colorado 80022 Page 1<br />
259
1. Introduction and Purpose<br />
The <strong>City</strong> of <strong>Commerce</strong> <strong>City</strong> (<strong>Commerce</strong> <strong>City</strong>) tasked Pinyon Environmental, Inc. (Pinyon) to provide Air<br />
Quality Emissions Reduction Guidance to address emissions concerns within <strong>Commerce</strong> <strong>City</strong>. The Air Quality<br />
Emissions Reduction Guidance is intended to establish emissions reductions strategies <strong>Commerce</strong> <strong>City</strong> can<br />
improve, develop and/or implement <strong>for</strong> those pollutants identified in the Community Impacts Report <strong>for</strong> both<br />
existing and future sources of air quality emissions.<br />
A review of state and federal requirements was conducted along with a review of best practices <strong>for</strong> reducing<br />
air quality emissions. The scope of air quality significance evaluations extends beyond current state guidance to<br />
include specific toxic air pollutants currently emitted within <strong>Commerce</strong> <strong>City</strong>’s boundaries and secondary air<br />
pollutants that are <strong>for</strong>med as a result of emissions within the <strong>City</strong>’s boundaries. From this review,<br />
recommendations are provided to assist <strong>Commerce</strong> <strong>City</strong> in framing potential options <strong>for</strong> ongoing policy ef<strong>for</strong>ts<br />
<strong>for</strong> existing, new, or modified facilities in the future to reduce emissions and/or pollutant impacts on its<br />
residents and environment.<br />
This document, in conjunction with the previous deliverables Pinyon has completed <strong>for</strong> <strong>Commerce</strong> <strong>City</strong>, will<br />
better in<strong>for</strong>m and direct <strong>Commerce</strong> <strong>City</strong> in evaluating future projects within its boundaries to in<strong>for</strong>m residents,<br />
initiate practical discussion with project proponents, as well as potentially mitigating future negative air quality<br />
impacts.<br />
<strong>Commerce</strong> <strong>City</strong> Emissions Reduction Guidance<br />
<strong>Commerce</strong> <strong>City</strong> Environmental Consulting Services<br />
7887 East 60 th Avenue, <strong>Commerce</strong> <strong>City</strong>, Colorado 80022 Page 2<br />
260
2. Pollutants of Concern<br />
The following list bullets different pollutant emissions that can cause or contribute to ambient air<br />
concentrations that can demonstrate a potential harm to human health or public welfare. These pollutants and<br />
the sources and activities that may result in their emissions are detailed in the Community Impacts Report.<br />
Note, lead is not discussed in detail even though it is a criteria pollutant. As mentioned in the Community<br />
Impacts Report, a lead monitor was taken offline due to many years of low or zero concentrations.<br />
• Carbon monoxide (CO)<br />
• Nitrogen oxides (NO x )<br />
• Particulate matter less than 10 micrometers in diameter (PM 10 )<br />
• Particulate matter less than 2.5 micrometers in diameter (PM 2.5 )<br />
• Sulfur dioxide (SO 2 )<br />
• Volatile organic compounds (VOC)<br />
Toxic air pollutants of concern are presented below based on public concern over the pollutants in and around<br />
the <strong>Commerce</strong> <strong>City</strong> area. This is not a comprehensive list of all pollutants but is meant to include released<br />
pollutants reported to the Colorado Department of Public Health (CDPHE) with public health concern.<br />
• Acetaldehyde<br />
• Benzene<br />
• Ethylbenzene<br />
• Formaldehyde<br />
• Hydrogen cyanide<br />
• Hydrogen sulfide<br />
• n-Hexane<br />
• Toluene<br />
• Xylenes<br />
There are also secondary pollutants that <strong>for</strong>m following chemical reactions in the atmosphere. There are no<br />
direct emissions of these pollutants, however health and environmental standards are developed <strong>for</strong> these<br />
pollutants. It’s important to note that <strong>Commerce</strong> <strong>City</strong> is in the Denver Metro/North Front Range, CO ozone<br />
nonattainment area, which was re-classified as severe nonattainment in 2022.<br />
• Ozone (O 3 )<br />
<strong>Commerce</strong> <strong>City</strong> Emissions Reduction Guidance<br />
<strong>Commerce</strong> <strong>City</strong> Environmental Consulting Services<br />
7887 East 60 th Avenue, <strong>Commerce</strong> <strong>City</strong>, Colorado 80022 Page 3<br />
261
• Secondary PM 2.5<br />
The Clean Air Act (CAA) provided the United States Environmental Protection Agency (EPA) the authority to<br />
establish National Ambient Air Quality Standards (NAAQS) <strong>for</strong> six criteria pollutants. The NAAQS are<br />
categorized as primary standards, which are thresholds <strong>for</strong> public health protection, and secondary standards,<br />
are thresholds <strong>for</strong> public welfare protection. The NAAQS have been modified and added to since the initial<br />
promulgation of the CAA and the current NAAQS are in Table 2-1.<br />
Table 2-1. National Ambient Air Quality Standards<br />
Pollutant<br />
Carbon Monoxide<br />
(CO)<br />
Lead (Pb)<br />
Nitrogen Dioxide<br />
(NO 2 ) 1<br />
Averaging<br />
Time<br />
Primary<br />
NAAQS<br />
1 hour 35 ppm<br />
8 hours 9 ppm<br />
Rolling 3-<br />
month average<br />
<strong>Commerce</strong> <strong>City</strong> Emissions Reduction Guidance<br />
<strong>Commerce</strong> <strong>City</strong> Environmental Consulting Services<br />
7887 East 60 th Avenue, <strong>Commerce</strong> <strong>City</strong>, Colorado 80022 Page 4<br />
262<br />
Secondary<br />
NAAQS<br />
Not applicable<br />
Form of Standard<br />
Not to be exceeded<br />
more than once per year<br />
0.15 µg/m 3 0.15 µg/m 3 Not to be exceeded<br />
1 hour 100 ppb Not applicable<br />
98 th percentile of 1-hour<br />
daily maximum, averaged<br />
over 3 years<br />
Annual 53 ppb 53 ppb Annual mean<br />
Ozone (O 3 ) 2 8 hours 70 ppb 70 ppb<br />
Particulate Matter less<br />
than 2.5 microns<br />
(PM 2.5 )<br />
Particulate Matter less<br />
than 10 microns<br />
(PM 10 )<br />
Sulfur Dioxide (SO 2 )<br />
Source: EPA, 2021<br />
ppm<br />
ppb<br />
µg/m 3<br />
parts per million<br />
parts per billion<br />
micrograms per cubic meter<br />
24 hours 35 µg/m 3 35 µg/m 3<br />
Annual 12 µg/m 3 15 µg/m 3<br />
24 hours 150 µg/m 3 150 µg/m 3<br />
1 hour 75 ppb Not applicable<br />
3 hours Not applicable 0.5 ppm<br />
Annual 4 th highest 8-hour<br />
daily maximum, averaged<br />
over 3 years<br />
98 th percentile, averaged<br />
over 3 years<br />
Annual mean, averaged<br />
over 3 years<br />
Not to be exceeded<br />
more than once per year<br />
on average over 3 years<br />
99 th percentile of 1-hour<br />
daily maximum, averaged<br />
over 3 years<br />
Not to be exceeded<br />
more than once per year<br />
1 The level of the annual NO2 standard is 0.053 ppm. It is shown here in terms of ppb <strong>for</strong> the purposes of clearer<br />
comparison to the 1-hour standard level.<br />
2 Final rule signed October 1, 2015, and effective December 28, 2015. The previous (2008) O3 standards additionally<br />
remain in effect in some areas. Revocation of the previous (2008) O3 standards and transitioning to the current (2015)<br />
standards will be addressed in the implementation rule <strong>for</strong> the current standards. The standard is presented as 0.070 ppm<br />
but is shown in ppb <strong>for</strong> the purposes of clearer comparison to the significant impact level (SIL).
3. Emissions Reduction Ef<strong>for</strong>ts<br />
Air quality emissions reduction and data collection ef<strong>for</strong>ts can be implemented to better in<strong>for</strong>m the public and<br />
establish more stringent requirements <strong>for</strong> current/future sources of air quality pollution in and surrounding<br />
<strong>Commerce</strong> <strong>City</strong>. Below is a bulleted list of mitigation recommendations that may achieve lower impacts <strong>for</strong><br />
one or more criteria, toxic, or precursor pollutants. This list is not meant to be a comprehensive list, as changes<br />
to regulations could require additional consideration <strong>for</strong> best mitigation options. Additional discussion on each<br />
mitigation ef<strong>for</strong>t bulleted below can be found in Sections 3.1 through 3.5.<br />
• Continue making updates to the impacts inventory to keep residents in<strong>for</strong>med on new pollutant source<br />
details and existing source modifications.<br />
• Implement a monitoring network that supplements existing and planned monitoring to help the<br />
community better understand how the existing pollutant sources are impacting residents and/or other<br />
specific locations such as schools and parks.<br />
• Incorporate air quality threshold levels into <strong>City</strong> ordinances that would require additional analysis,<br />
reporting, and potentially mitigation <strong>for</strong> planned emission sources.<br />
• Update oil and gas regulatory requirements on a continuous basis to keep up with evolving industry<br />
technologies and practices.<br />
• Reduce current and future emissions by implementing practices such as BACT analysis requirements<br />
and targeted emissions control requirements as needed.<br />
3.1 Impacts Inventory<br />
Pinyon developed the Community-Wide Impacts Report to identify and analyze permitted air quality emissions<br />
sources in and near <strong>Commerce</strong> <strong>City</strong>. In conjunction with source data maintained by the CDPHE Air Pollution<br />
Control Division (APCD) and oil and gas wells in operation registered with Colorado Oil and Gas Conservation<br />
Commission (COGCC), one hundred fifty-four (154) unique sources of air pollution were identified.<br />
Pinyon recommends regular review and updates to the Community-Wide Impacts Report, which would include<br />
updates to CDPHE APCD and COGCC source inventories, in order to keep residents in<strong>for</strong>med of permitted<br />
pollutant source locations and emission totals in and near <strong>Commerce</strong> <strong>City</strong>. It is important to note not all<br />
sources of pollution are required to obtain an air permit from CDPHE. For example, sources that emit pollution<br />
at rates less than the thresholds detailed in Table 1-1 of the Community-Wide Impacts Report are not required<br />
to obtain a permit. Permit requirements can change, affecting the eligibility of sources presented in the<br />
Community-Wide Impacts Report from reporting emissions in the future and/or requiring new emissions<br />
sources to obtain a permit. Additionally, permitted sources may undergo modifications that result in an increase<br />
in pollutant emissions levels. There<strong>for</strong>e, the sources represented in the Community-Wide Impacts Report may<br />
not accurately represent the full extent of sources within <strong>Commerce</strong> <strong>City</strong> in future months/years and should<br />
be reviewed and updated at least annually.<br />
3.2 Enhanced Monitoring Network<br />
Pinyon developed the Existing and Potential Ambient Air Monitoring <strong>Plan</strong> (Pinyon, 2021b) to identify existing<br />
and proposed monitor locations in and near <strong>Commerce</strong> <strong>City</strong>, along with in<strong>for</strong>mation <strong>for</strong> reference to support<br />
the development of a potential <strong>Commerce</strong> <strong>City</strong> operated monitoring network. As of 2022, APCD conducts<br />
<strong>Commerce</strong> <strong>City</strong> Emissions Reduction Guidance<br />
<strong>Commerce</strong> <strong>City</strong> Environmental Consulting Services<br />
7887 East 60 th Avenue, <strong>Commerce</strong> <strong>City</strong>, Colorado 80022 Page 5<br />
263
air quality and meteorological monitoring at two (2) locations in and surrounding <strong>Commerce</strong> <strong>City</strong> (CDPHE,<br />
2022). The monitors and pollutants monitored include the following: Birch Street (PM 10 & PM 2.5 ) and Welby<br />
(O 3 , CO, NO 2 , SO 2 & PM 10 ). Additional monitoring data is being collected by third parties Suncor Energy and<br />
Cultivando. An overview of each respective monitoring network currently developed in and near <strong>Commerce</strong><br />
<strong>City</strong> is detailed in the Existing and Potential Ambient Air Monitoring <strong>Plan</strong>.<br />
Pinyon recommends the implementation of a monitoring network operated by <strong>Commerce</strong> <strong>City</strong> to supplement<br />
existing and planned monitoring in locations throughout <strong>Commerce</strong> <strong>City</strong> not currently collecting data to<br />
enhance community understanding on the impacts of existing air pollutants to residents and/or sensitive<br />
locations such as schools and parks. This recommendation aligns with a recommendation from the <strong>City</strong>’s<br />
Environmental Policy Advisory Committee (EPAC) <strong>for</strong> the <strong>City</strong> to provide clearer and more robust<br />
communications, data, and in<strong>for</strong>mation regarding monitoring results and air quality emissions and impacts in<br />
the community. Pinyon identified twenty (20) potential monitor deployment site locations within the Existing<br />
and Potential Ambient Air Monitoring <strong>Plan</strong>. The monitors should collect measurement data based on pollutant<br />
concerns at the location but could include up to the following pollutants: O 3 , CH 4 , VOCs, HAPs BTEX,<br />
Hydrogen Cyanide, CO, CO 2 , SO 2 , Dimethylsulfide, Nitric Oxide, NO 2 , and Particulate Matter. Some pollutants<br />
may not be needed depending on the area, but <strong>Commerce</strong> <strong>City</strong> should decide the breadth of the network with<br />
its contractor be<strong>for</strong>e deployment.<br />
3.3 Air Quality Threshold Levels<br />
Pinyon developed the Modeling Thresholds Report (Pinyon 2022a) to establish levels of air quality significance<br />
with recommendations on further evaluation and analysis to determine the potential <strong>for</strong> human health and<br />
environmental impacts. A review of state and federal requirements was conducted along with a review of best<br />
practices <strong>for</strong> determining air quality significance. The scope of air quality significance evaluations extended<br />
beyond current state guidance to include specific toxic air pollutants currently emitted within <strong>Commerce</strong> <strong>City</strong>’s<br />
boundaries and secondary air pollutants that are <strong>for</strong>med as a result of emissions.<br />
Pinyon recommends following the emissions thresholds proposed in Table 3-1 of the Modeling Thresholds<br />
Report <strong>for</strong> any new or modified project within <strong>Commerce</strong> <strong>City</strong> to conduct impacts screening. The Modeling<br />
Thresholds Report suggests impacts thresholds to determine whether a more refined analysis, such as analyses<br />
required by CDPHE <strong>for</strong> air permit applications, may be warranted.<br />
3.4 Oil and Gas Regulatory Requirements<br />
Pinyon developed the Oil and Gas <strong>Plan</strong> Submittal Guidance Overview (Pinyon 2022b) to outline current air<br />
quality compliance requirements related to oil and gas activities. <strong>Commerce</strong> <strong>City</strong> spent two years working to<br />
update its comprehensive oil and gas regulations to reflect current regulatory trends and industry best practices<br />
more accurately. Following several rounds of feedback from <strong>City</strong> Council and stakeholders including regulatory<br />
and government agencies, industry representatives, advocacy groups, and the <strong>Commerce</strong> <strong>City</strong> oil and gas focus<br />
group, Ordinance 2266 was adopted on March 15, 2021.<br />
Pinyon recommends the continued review of regulations pertaining to oil and gas development published by<br />
COGCC. Should any of the regulatory requirements be modified or removed, further analysis is recommended<br />
to determine continued minimization of air quality impacts through Best Management Practices (BMPs) and<br />
future city ordinances. Additionally, periodic review of oil and gas regulatory requirements in neighboring cities<br />
and jurisdictions within Colorado is recommended to ensure the most comprehensive regulations are in effect<br />
within <strong>Commerce</strong> <strong>City</strong>.<br />
<strong>Commerce</strong> <strong>City</strong> Emissions Reduction Guidance<br />
<strong>Commerce</strong> <strong>City</strong> Environmental Consulting Services<br />
7887 East 60 th Avenue, <strong>Commerce</strong> <strong>City</strong>, Colorado 80022 Page 6<br />
264
3.5 BACT and Emissions Control<br />
Best Available Control Technology (BACT) is the level of air contaminant emission control or reduction<br />
required <strong>for</strong> new, modified, relocated, and replacement emission sources. BACT is intended to reduce<br />
emissions to the maximum extent practicable considering technological and economic feasibility.<br />
BACT includes the lowest emitting of any of the following:<br />
• the most stringent emission limitation, or most effective emission control device or control technique,<br />
which has been proven in field application and which is cost-effective <strong>for</strong> such class or category of emission<br />
unit unless demonstrated that such limitation, device or control technique is not technologically feasible;<br />
• any emission control device, emission limitation or control technique which has been demonstrated but<br />
not necessarily proven in field application and which is cost-effective <strong>for</strong> such class or category of emission<br />
unit unless demonstrated that such limitation, device or control technique is not technologically feasible;<br />
• any control equipment, process modifications, changes in raw material including alternate fuels, and<br />
substitution of equipment or processes with any equipment or processes, or any combination unless<br />
demonstrated that such limitation, device or control technique is not technologically feasible or costeffective<br />
• the most stringent emission limitation, or the most effective emission control device or control technique,<br />
contained in any State Implementation <strong>Plan</strong> (SIP) approved by the federal EPA <strong>for</strong> such emission unit<br />
category, unless demonstrated that such limitation or technique has not been proven in field application,<br />
that it is not technologically feasible or that it is not cost-effective <strong>for</strong> such class or category of emission<br />
unit<br />
BACT is commonly determined based on specific equipment categories such as diesel engines, utility boilers,<br />
or turbines. BACT changes with time as improved control technologies are developed and are proven in field<br />
applications and as the cost-effectiveness of control technologies improve.<br />
Pinyon recommends that <strong>Commerce</strong> <strong>City</strong> require existing and/or potential emission sources to implement the<br />
EPA BACT, Lowest Achievable Emissions Rate (LAER), and/or Reasonable Available Control Technology<br />
(RACT) Clearinghouse (EPA, 2022) <strong>for</strong> potential control devices or equipment that can result in lower<br />
emissions to complete the same process or operation. <strong>Commerce</strong> <strong>City</strong> could also internally review these data<br />
specific to facilities or emissions of concern to implement targeted policies and requirements. Examples of<br />
BACT may include but are not limited to the following:<br />
• Operate facilities in accordance with BMP’s and good air pollution practices.<br />
• Minimizing the duration of maintenance, startup, and shutdown (MSS) activities and operate facilities in<br />
accordance with BMPs.<br />
• Fire equipment using low sulfur fuels and BMPs. Limit fuel to firing pipeline quality natural gas.<br />
• Install control equipment on sources where applicable to reduce emissions.<br />
• Implement leak detection and repair programs to identify and repair leaks from equipment as soon as<br />
possible.<br />
<strong>Commerce</strong> <strong>City</strong> Emissions Reduction Guidance<br />
<strong>Commerce</strong> <strong>City</strong> Environmental Consulting Services<br />
7887 East 60 th Avenue, <strong>Commerce</strong> <strong>City</strong>, Colorado 80022 Page 7<br />
265
• Use water sprays during material handling and reduce speeds when driving on unpaved roads.<br />
<strong>Commerce</strong> <strong>City</strong> Emissions Reduction Guidance<br />
<strong>Commerce</strong> <strong>City</strong> Environmental Consulting Services<br />
7887 East 60 th Avenue, <strong>Commerce</strong> <strong>City</strong>, Colorado 80022 Page 8<br />
266
4. Emissions Reduction Ef<strong>for</strong>ts – New or Modified Sources<br />
In the instance of a new or modified facility, mitigation recommendations can be provided to a project<br />
proponent to reduce the facility’s potential emissions, reduce the facility’s potential impacts, or both. Below is<br />
a bulleted list of potential mitigation recommendations that may achieve lower impacts <strong>for</strong> one or more criteria,<br />
toxic, or precursor pollutants. This is not meant to be a comprehensive list, as unique emission sources could<br />
require source specific consideration <strong>for</strong> best mitigation options.<br />
• Review the EPA BACT, LAER, and RACT Clearinghouse <strong>for</strong> potential control devices or equipment that<br />
can result in lower emissions to complete the same process or operation.<br />
• Modify exhaust parameters <strong>for</strong> a specific source especially those that have stacks to allow better dispersion.<br />
Higher release heights, faster exit velocities, and warmer gas temperatures generally result in better<br />
dispersion and less localized impacts.<br />
• Determine if high impact sources at a facility can be located farther from residential housing, gathering<br />
areas, and sensitive communities.<br />
• Limit a high impact source’s operation to periods of calmer meteorology such as low winds and/or the<br />
time of day to reduce the effects of unexpected, exceptional weather conditions.<br />
<strong>Commerce</strong> <strong>City</strong> Emissions Reduction Guidance<br />
<strong>Commerce</strong> <strong>City</strong> Environmental Consulting Services<br />
7887 East 60 th Avenue, <strong>Commerce</strong> <strong>City</strong>, Colorado 80022 Page 9<br />
267
References<br />
Colorado Department of Public Health and Environment (CDPHE), 2022. “Colorado Annual Network<br />
Monitoring <strong>Plan</strong>.” Available at:<br />
https://www.colorado.gov/airquality/tech_doc_repository.aspx?action=open&file=2022AnnualNetwo<br />
rk<strong>Plan</strong>.pdf<br />
EPA, 2021. “NAAQS Table”. February 10, 2021. Available through: https://www.epa.gov/criteria-airpollutants/naaqs-table.<br />
EPA, 2022. “RACT/BACT/LAER Clearinghouse (RBLC) Basic In<strong>for</strong>mation.” Available at:<br />
https://www.epa.gov/catc/ractbactlaer-clearinghouse-rblc-basicin<strong>for</strong>mation#:~:text=EPA%20established%20the%20RACT%2FBACT,case%2Dby%2Dcase%20determi<br />
nations.<br />
Pinyon Environmental, Inc., 2021a. “<strong>Commerce</strong> <strong>City</strong> Community-Wide Impacts Report”. October 1, 2021.<br />
Pinyon Environmental, Inc., 2021b. “Existing and Potential Ambient Air Monitoring in <strong>Commerce</strong> <strong>City</strong>”.<br />
December 21, 2021.<br />
Pinyon Environmental, Inc., 2022a. “Modeling Thresholds Report”. July 31, 2022.<br />
Pinyon Environmental, Inc., 2022b. “Oil & Gas <strong>Plan</strong> Submittal Guidance Overview”. June 2, 2022.<br />
<strong>Commerce</strong> <strong>City</strong> Emissions Reduction Guidance<br />
<strong>Commerce</strong> <strong>City</strong> Environmental Consulting Services<br />
7887 East 60 th Avenue, <strong>Commerce</strong> <strong>City</strong>, Colorado 80022<br />
268
Appendix B. AQ and WQ<br />
Technical Documents<br />
December 14, 2022<br />
Identification of Potential Point and Nonpoint Sources of<br />
Impacts to Water Quality<br />
<strong>Commerce</strong> <strong>City</strong>, Colorado<br />
Prepared <strong>for</strong>:<br />
<strong>Commerce</strong> <strong>City</strong><br />
7887 E. 60 th Ave.<br />
<strong>Commerce</strong> <strong>City</strong>, CO 80022<br />
269
Table of Contents<br />
1. Purpose ................................................................................................................................................................................. 1<br />
2. Approach and Study Area ................................................................................................................................................ 1<br />
2.1 Heat Mapping .......................................................................................................................................................... 1<br />
3. Identification of Pollutant Sources ................................................................................................................................. 2<br />
3.1 Point Sources .......................................................................................................................................................... 2<br />
3.2 Nonpoint Sources .................................................................................................................................................. 2<br />
3.2.1 Hazardous Materials Facility Type Classification ............................................................................ 3<br />
3.3 Alluvial Aquifer / Well Map .................................................................................................................................. 5<br />
4. Key Observations ............................................................................................................................................................... 6<br />
5. References ............................................................................................................................................................................ 7<br />
Tables<br />
Table 3-1. Nonpoint Source Classifications ...................................................................................................................... 4<br />
Figures<br />
Figure 1<br />
Figure 2<br />
Figures 3a & 3b-g<br />
Figure 4<br />
Study Area<br />
Point Source Map<br />
Non-Point Source Maps<br />
Alluvial Aquifer and Drinking Water Wells Map<br />
270<br />
ii
1. Purpose<br />
Pinyon Environmental, Inc. (Pinyon) was tasked with identifying potential point and non-point 1 pollutant sources<br />
<strong>for</strong> <strong>Commerce</strong> <strong>City</strong> that could impact water quality within the city boundary. Pinyon conducted the evaluation<br />
based on available data <strong>for</strong> permitted and non-permitted entities, and land uses, with potential to discharge<br />
pollutants to groundwater and surface water bodies. A series of maps have been developed that are intended<br />
to support <strong>Commerce</strong> <strong>City</strong>’s understanding of locations of potential pollutant sources and are designed <strong>for</strong> use<br />
in high-level planning evaluations where qualitative in<strong>for</strong>mation regarding the types, distribution, and density of<br />
facilities are of interest. The in<strong>for</strong>mation provided can be used <strong>for</strong> a range of pre-project planning and<br />
in<strong>for</strong>mational purposes. Pre-planning examples may include site orientation <strong>for</strong> construction or low-impact<br />
development projects where land disturbance could release pollutants. The maps can also be used <strong>for</strong> general<br />
in<strong>for</strong>mation purposes including, but not limited to, identifying areas of concern that may warrant further<br />
investigation.<br />
2. Approach and Study Area<br />
Several categories of pollutant sources in the study area were considered in the evaluation, including hazardous<br />
materials sites, land-use associated with nutrient loading (e.g., agriculture, onsite wastewater treatment systems<br />
(septic systems) and impervious surfaces, and point sources such as wastewater, industrial, and stormwater<br />
discharges.<br />
Mapping the source categories generally considered a review of:<br />
• Areas within a 1-mile buffer outside of the city boundary and inclusive of the growth boundary (Figure 1)<br />
• Facility types and the potential <strong>for</strong> a facility to degrade the environment<br />
• Density and distribution of known facilities<br />
• Source Types – point or non-point sources<br />
2.1 Heat Mapping<br />
In addition to individual point or polygon map layers that are used to differentiate pollutant sources and<br />
locations, Pinyon developed a “heat map” <strong>for</strong> a subset of the hazardous materials (nonpoint source) map layers.<br />
The heat map represents a combination of the geographic density of features on a map and their associated<br />
likelihood of potential <strong>for</strong> causing degradation denoted by a color range (cooler to hotter). Heat maps are<br />
useful <strong>for</strong> layers with many features.<br />
The heat map in Figure 3a was created using ESRI’s ArcGIS Pro software. Facilities classified as “high” are<br />
“hotter” indicating greater potential impact, which is denoted by red to yellow color gradations; facilities<br />
classified as low are “colder,” indicating a lower potential impact denoted by blue to pink color gradations.<br />
Where a higher density of facilities is present, the heat map illustrates a “hotter” signature; if the higher density<br />
of sites also includes facilities with “high” classifications, the heat signature is pushed further up the color<br />
gradation toward yellow. Heat signatures also register “hotter” at the center point of the high-ranked facility,<br />
1 A point source is defined in the Clean Water Act as “any discernible, confined and discrete conveyance, including but not<br />
limited to any pipe, ditch, channel, tunnel, conduit, well, discrete fissure, container, rolling stock, concentrated animal feeding<br />
operation, or vessel or other floating craft, from which pollutants are or may be discharged.” A non-point source is defined to<br />
mean any source of water pollution that does not meet the legal definition of “point source” in section 502(14) of the clean water<br />
act.<br />
271<br />
1
or cluster, then grade to “colder” moving away from the facility or facilities denoting that the risk from the<br />
facility reduces with increased distance. Importantly, the heat map does not represent the presence or<br />
distribution of potential contamination, but rather illustrates the likelihood of potential <strong>for</strong> causing degradation<br />
based on the methodology described herein. Most of the facilities included in the heat map are represented by<br />
a point depicting the facility address.<br />
3. Identification of Pollutant Sources<br />
Sections 3.1 through 3.3 discuss in more detail the different categories of pollutant sources, Pinyon’s approach<br />
<strong>for</strong> identifying the sources, and the final map products.<br />
3.1 Point Sources<br />
Pinyon identified a point source as being a localized or stationary point of discharge to groundwater or surface<br />
water that is regulated under a National Pollution Discharge Elimination System (NPDES) permit.<br />
Wastewater and industrial treatment facilities are point sources that are heavily regulated by the Colorado<br />
Water Quality Control Division. A check of EPA’s En<strong>for</strong>cement and Compliance History Online database<br />
indicates that neither of the 2 major dischargers in the area - the Suncor Refinery and Metro Wastewater<br />
Reclamation Facility - had violated their surface water discharge permit limitations within the last 3 years. These<br />
facilities would be sources of harmful contaminants if the terms of the permits are violated, or pollutants not<br />
regulated by the permit are discharged.<br />
Many stormwater discharges are also regulated under the NPDES permitting system. Most regulated<br />
stormwater discharges in the study area are associated with property development and highway construction.<br />
Note that NPDES permit discharge locales classified as “Expired”, “Not Needed”, and “Terminated” were not<br />
included in the map. Generally, permitted stormwater point sources are considered a relatively low risk <strong>for</strong><br />
causing water quality degradation.<br />
The Point Source Map (Figure 2) includes point sources with NPDES permits and impervious surfaces and<br />
cropland, which are land uses that can contribute pollutants to groundwater or surface water. Impervious<br />
surfaces can cause sheet runoff or runoff that is channeled to both regulated and unregulated stormwater<br />
sewers during precipitation events. During these events, contaminants that have accumulated on the impervious<br />
surface are mobilized. Uncontrolled or unregulated runoff can impact water quality through pushing excess<br />
sediment, pesticides and fertilizers, motor oil, metals, chloride, and other contaminants into rivers and streams<br />
in high concentrations. In the early runoff stage, a pulse of contaminants in high concentrations can be delivered<br />
to receiving waters and cause shocks to water quality and aquatic organisms in surface waters. Cropland or<br />
agricultural land can be a source of nutrients, pesticides, herbicides, and other potential contaminants, which<br />
can also impact water quality.<br />
3.2 Nonpoint Sources<br />
The non-point source maps (Figures 3a and 3b through 3f) primarily include hazardous materials sources. Figure<br />
3a is a map of the entire study area and Figures 3b through 3f are map segments showing non-point sources<br />
near Sand Creek and the South Platter River within the southern portion of the study area. The locations of<br />
these figures are shown in the Figure 3a legend. For purposes of this document, the term “hazardous materials”<br />
is used to collectively describe hazardous substances as defined by the Comprehensive Environmental<br />
Response, Compensation, and Liability Act (CERCLA, commonly known as Superfund); hazardous and solid<br />
wastes as defined by the Resource Conservation and Recovery Act (RCRA); asbestos; and petroleum products.<br />
272<br />
2
A facility source was identified as being a distributed area of potential groundwater or surface water impacts<br />
resulting from uses that may have resulted in releases into the environment. To generate maps that graphically<br />
illustrate where potential sources occurrences are more likely, Pinyon:<br />
• utilized readily available georeferenced on-line downloadable data from agency databases (e.g., U.S.<br />
Environmental Protection Agency (EPA), Colorado Department of Public Health and Environment<br />
(CDPHE));<br />
• developed a georeferenced database of facility types that occur within 1 mile of the city boundary and<br />
inclusive of the growth boundary; and<br />
• categorized facility type based on the relative potential <strong>for</strong> hazardous materials to have been released into<br />
the environment (i.e., low, medium, high)<br />
3.2.1 Hazardous Materials Facility Type Classification<br />
The facility types have been classified as follows:<br />
• Low: Based on the facility type, it is unlikely that the facility has degraded soil, soil vapor, or groundwater<br />
• Medium: Based on the facility type, it is possible, although unknown, that the facility has degraded soil, soil<br />
vapor, or groundwater<br />
• High: Based on the facility type, it is likely that the facility has degraded soil, soil vapor, or groundwater<br />
Table 3-1 summarizes the facility types and non-point source classifications, whether the facilities were included<br />
in the heatmap, and the rationale <strong>for</strong> the classification assignment. Using publicly available and geolocatable<br />
data, facility types were identified and classified into categories based on facility type and operations. Note that<br />
only a subset of facilities has been included in the heatmap analysis. The map layers not included in the heatmap<br />
are differentiated as polygons or points rather than color gradations.<br />
On-site wastewater treatment systems (OWTSs) are mapped as points and also not included in the heat map<br />
analysis because the density of the systems would have overwhelmed the heat map making it less useful. Further,<br />
OWTSs are important primarily when considering potential nutrient impacts of surrounding ground and surface<br />
waters as opposed to hazardous material facilities (included in the heat map) that may contribute chemical<br />
pollutants.<br />
Other layers not included in the heat map have significant footprints which also showed potential <strong>for</strong><br />
overwhelming the heat map. These facilities are included in the map as polygons and generally include Superfund<br />
sites, historical fill areas (solid waste facilities and landfills), and sites with institutional controls.<br />
273<br />
3
Table 3-1. Nonpoint Source Classifications<br />
Facility Type<br />
Classification<br />
Included in<br />
Heat Map?<br />
Discussion/Rationale<br />
Brownfields (EPA<br />
and CDPHE)<br />
High<br />
Yes<br />
Brownfields are generally commercial or industrial<br />
facilities or properties that have been scrutinized by<br />
a regulatory agency, and possibly remediated to<br />
some level. Generally, these facilities have had, or<br />
are perceived to have, environmental constraints<br />
such as releases of hazardous materials that may<br />
require clean up. There<strong>for</strong>e, there is a high<br />
potential that degradation of the environment has<br />
occurred, and these impacts may persist.<br />
These are facilities that are regulated under the<br />
RCRA regulations, and that use and/or dispose of<br />
hazardous materials, including hazardous wastes.<br />
Although regulated materials are potentially used in<br />
normal business operations, compliance with<br />
regulations may not be understood; impacts related<br />
to this facility type tend to be localized near the<br />
source facility.<br />
These are facilities that are regulated under the<br />
Toxic Substances Control Act (TSCA) regulations,<br />
which address the production, importation, use,<br />
and disposal of specific chemicals such as<br />
polychlorinated biphenyls (PCBs), asbestos, radon,<br />
and lead-based paint.<br />
These facilities may have leaking storage tanks and<br />
are usually associated with gas stations. When<br />
reported, impacts are generally well documented<br />
and tend to be relatively localized near the source<br />
facility. Note, <strong>for</strong> this analysis, active gas stations<br />
that have not reported a release were not included<br />
in the evaluation as the impacts would be<br />
considered low. Further, the Colorado Division of<br />
Oil and Public Safety does not have easily<br />
downloadable GIS data <strong>for</strong> facilities that have not<br />
reported a release.<br />
Like Brownfields described above, these tend to be<br />
blighted properties with environmental liabilities<br />
that impact property uses and redevelopment. As a<br />
result, there is a high potential <strong>for</strong> environmental<br />
issues to be present at these facilities.<br />
EPA RCRA<br />
Generators,<br />
En<strong>for</strong>cement,<br />
Compliance<br />
Medium/High<br />
Yes<br />
EPA TSCA<br />
Facilities<br />
Medium<br />
Yes<br />
Leaking Tanks<br />
(CDLE OPS<br />
Release Events)<br />
Medium<br />
Yes<br />
CDPHE<br />
Voluntary<br />
Cleanup and<br />
Redevelopment<br />
Program (VCUP)<br />
High<br />
Yes<br />
4<br />
274
Facility Type<br />
Classification<br />
Included in<br />
Heat Map?<br />
Discussion/Rationale<br />
COGCC Oil and<br />
Gas Spills<br />
Low<br />
Yes<br />
These are spill reports on record with Colorado<br />
Oil & Gas Conservation Commission (COGCC).<br />
Based on the nature of oil and gas spills (which do<br />
not transition into a VCUP, Brownfield, or other<br />
type of facility), there is a low potential <strong>for</strong> these to<br />
impact soil, soil vapor, and groundwater. Note, <strong>for</strong><br />
this analysis, oil and gas wells that have not<br />
reported a spill were not included in the evaluation<br />
as the impacts would be considered low.<br />
Often referred to as “Superfund” sites, these<br />
facilities tend to be some of the most polluted<br />
facilities in the country. Many of these facilities have<br />
been remediated, and are no longer on the NPL,<br />
but it is possible that residual impacts could persist.<br />
An example is the Rocky Mountain Arsenal, which<br />
is within 1 mile of the city boundary, although most<br />
has remediated.<br />
National Priority<br />
List (NPL)<br />
High<br />
No<br />
(Polygon<br />
Layer)<br />
Containment<br />
System<br />
Remediation<br />
Goals (CSRG)<br />
Potential<br />
Exceedance Area<br />
CDPHE Solid<br />
Waste Facilities<br />
or Operating<br />
Commercial<br />
Landfills<br />
Medium<br />
No<br />
(Polygon<br />
Layer)<br />
This is the area identified as part of the Rocky<br />
Mountain Arsenal Land Use Control <strong>Plan</strong> (Navarro,<br />
2013), where groundwater could potentially exceed<br />
CSRGs.<br />
High<br />
No<br />
(Polygon<br />
Layer)<br />
Regulated or potentially unregulated solid waste<br />
disposal sites where controlled or uncontrolled<br />
filling has likely impacted soil, soil vapor, and<br />
groundwater.<br />
Tri-County<br />
Onsite<br />
Wastewater<br />
Treatment<br />
Systems<br />
Site-Specific<br />
No<br />
(Point layer)<br />
These systems are also known as septic systems.<br />
Onsite wastewater treatment systems have<br />
potential to cause nutrient loading to groundwater<br />
and surface waters. These are denoted as points on<br />
the map but are not the same as point sources as<br />
defined by the Clean Water Act.<br />
3.3 Alluvial Aquifer / Well Map<br />
The Groundwater Vulnerability Atlas has been developed by the Colorado Environmental Public Health<br />
Tracking Program (CDPHE, 2021) with data compiled by CDPHE, COGCC, Colorado Department of Natural<br />
Resources (DNR), Colorado Department of Labor and Employment, and the EPA. Using Source Water<br />
Assessment and Protection (SWAP) methodologies, an aquifer vulnerability coverage map was generated<br />
(Figure 4). The alluvial aquifer vulnerability is the most relevant when considering potential impacts to surface<br />
water. In addition, drinking water wells less than 100 feet in depth have been included on the map. This allows<br />
the user to potentially identify drinking water wells that may be in higher risk areas based on the alluvial aquifer<br />
vulnerability.<br />
275<br />
5
4. Key Observations<br />
The maps provide a birds-eye view of point and non-point sources within the study area and a way to screen<br />
<strong>for</strong> potential large-scale impacts over a broad area. Having broad knowledge of potential sources of pollutants<br />
could also help in<strong>for</strong>m additional sampling and analyses <strong>for</strong> site-specific projects. Pinyon recommends that<br />
impacts to hazardous materials be avoided, then minimized. If conflicts cannot be avoided or minimized,<br />
mitigation options are available including remediation or implementing engineering solutions. It should be noted<br />
that remediation of hazardous materials can be costly; often, depending on the magnitude of the impacts, the<br />
costs could be prohibitive to the goals of the overall project.<br />
A few key observations of the mapping exercise are as follows:<br />
• The area south of the confluence of Sand Creek and South Platte River contains multiple areas of potentially<br />
moderate or high-risk sources and concentrated areas of point sources. This is expected based on the<br />
industrial nature of the area.<br />
• Cropland and agricultural land uses are located primarily in the northern and eastern portions of the study<br />
area. Impacts to water quality could include increased nutrient loading in these areas.<br />
• Multiple areas are identified with a high density of on-site wastewater treatment systems, which are sources<br />
of nutrient loading to ground and surface waters. If development is to occur in these areas, additional<br />
evaluation of the systems should be completed. Evaluation may include review of documents to understand<br />
age and condition of the system or inspection of the systems <strong>for</strong> damage or leaks.<br />
• The CSRG and Rocky Mountain Arsenal have both been identified as potential non-point sources of<br />
pollutants (Figure 3a); however, there is a large quantity of data available <strong>for</strong> these areas which may allow<br />
better definition of specific areas of high risk within the site boundaries.<br />
276<br />
6
5. References<br />
Adams County, 2021. “Landfills.” At https://dataadcogov.opendata.arcgis.com/datasets/8722e0fe43c249f0ac7ad98d8095f70f_0.<br />
As of July 2021.<br />
<strong>City</strong> and County of Denver, 2021. “ENV_HISTORICALFILLAREAS_A.” At<br />
https://services1.arcgis.com/zdB7qR0BtYrg0Xpl/arcgis/rest/services/ODC_ENV_HISTORICALFILLA<br />
REAS_A/FeatureServer. As of July 2021.<br />
Colorado Department of Labor and Employment, 2020. “OPS Petroleum Release Events.” At<br />
https://data.colorado.gov/Environment/OPS-Petroleum-Release-Events-in-Colorado/v5ut-qgp7. As of<br />
March 2020.<br />
Colorado Department of Public Health and Environment, 2021. “CDPHE_Brownfields.” At<br />
https://services3.arcgis.com/66aUo8zsujfVXRIT/arcgis/rest/services/CDPHE_Brownfield/FeatureServe<br />
r. As of July 2021.<br />
Colorado Department of Public Health and Environment, 2021. “CDPHE_Environmental_Covenants.” At<br />
https://services3.arcgis.com/66aUo8zsujfVXRIT/ArcGIS/rest/services/CDPHE_Environmental_Coven<br />
ants/FeatureServer. As of July 2021.<br />
Colorado Department of Public Health and Environment, 2021.<br />
“Colorado_Operating_Commercial_Landfills.” At<br />
https://services3.arcgis.com/66aUo8zsujfVXRIT/arcgis/rest/services/Colorado_Operating_Commerci<br />
al_Landfills/FeatureServer. As of July 2021.<br />
Colorado Department of Public Health and Environment, 2021. “RCRA_sites_in_Colorado.” At<br />
https://services3.arcgis.com/66aUo8zsujfVXRIT/arcgis/rest/services/RCRA_sites_in_Colorado/Featur<br />
eServer. As of July 2021.<br />
Colorado Department of Public Health and Environment, 2021. “Solid_Waste_Facitilites.” At<br />
https://cdphe.maps.arcgis.com/home/item.html?id=21f17a059f7d44049b76d7ce199561e3. As of July<br />
2021.<br />
Colorado Department of Public Health and Environment, 2021. “CDPHE_Colorado_Superfund_NPL_NRD.”<br />
At<br />
https://services3.arcgis.com/66aUo8zsujfVXRIT/arcgis/rest/services/CDPHE_Colorado_Superfund_N<br />
PL_NRD/FeatureServer/0. As of July 2021.<br />
Colorado Department of Public Health and Environment, 2021. “CDPHE Colorado VCUP.” At<br />
https://cdphe.maps.arcgis.com/home/item.html?id=ec26284ceda64d9d9db520ee4709b429. As of July<br />
2021.<br />
Colorado Department of Public Health and Environment, 2021. “Groundwater Vulnerability Atlas.” At<br />
https://www.arcgis.com/apps/webappviewer/index.html?id=72591d6c7d404e089e2475cebab8e8f2. As<br />
of July 2021.<br />
Denver Regional Council of Governments, 2021. “Land Use Land Cover Pilot Project Sections 10, 11, 12, and<br />
13.” Access at https://data.drcog.org/data?page=1&q=land%20use&sort=title. As of July 2021.<br />
EPA (U.S. Environmental Protection Agency), 2021. “FRS_INTERESTS.” At<br />
https://services.arcgis.com/cJ9YHowT8TU7DUyn/arcgis/rest/services/FRS_INTERESTS/FeatureServer<br />
. As of July 2021.<br />
277<br />
7
Tri-County Health Department, 2021. “Oil & Gas Spills.” At<br />
https://services3.arcgis.com/2xoV6w32MCqBwxNd/arcgis/rest/services/OilGasWellsSpills/FeatureSer<br />
ver. As of July 2021.<br />
Tri-County Health Department, 2021. “OWST_05302019.” At<br />
https://services3.arcgis.com/2xoV6w32MCqBwxNd/ArcGIS/rest/services/OWTS_Sept2019/FeatureS<br />
erver. As of July 2021.<br />
Navaroo, 2013. “Rocky Mountain Arsenal, Land Use Control <strong>Plan</strong>, Navarro Research and Engineering, Inc.,<br />
October 10, 2013.<br />
278<br />
8
Appendix B. AQ and WQ<br />
Technical Documents<br />
Technical Memorandum<br />
Date: December 14, 2022<br />
To:<br />
From:<br />
Subject:<br />
Rosemarie Russo, Environmental & <strong>Sustainability</strong> <strong>Plan</strong>ner, <strong>City</strong> of <strong>Commerce</strong> <strong>City</strong><br />
Pam Wegener and Caroline Byus, Pinyon Environmental, Inc.<br />
<strong>Commerce</strong> <strong>City</strong> Water Quality Evaluation, Summary, and Recommendations<br />
1. Purpose<br />
Pinyon Environmental, Inc. (Pinyon), on behalf of <strong>Commerce</strong> <strong>City</strong>, has completed research to evaluate existing<br />
stream water quality in <strong>Commerce</strong> <strong>City</strong>. As part of these services, Pinyon 1) compiled and screened water<br />
quality data from existing stream monitoring stations within a 0.25-mile buffer of <strong>Commerce</strong> <strong>City</strong>, and 2)<br />
conducted a high-level assessment of overall stream monitoring activities and water quality conditions. The<br />
in<strong>for</strong>mation was used to assess data gaps and provide insight on whether additional monitoring is advised, and<br />
to provide a basis <strong>for</strong> recommendations regarding the maintenance, improvement, and protection of water<br />
quality.<br />
2. Water Quality Standards and Stream Impairment - Overview<br />
Water quality standards define the water quality goals of a water body by designating the uses and setting<br />
criteria that protect the designated uses. “Water quality standards are integral <strong>for</strong> the protection and<br />
propagation of fish, shellfish and wildlife and <strong>for</strong> recreation in and on the water…..”(40 CFR § 131.2)<br />
Section 303(d) of the Clean Water Act requires that states submit a list to the U.S. Environmental Protection<br />
Agency (EPA) of those waters <strong>for</strong> which effluent limitations and other required controls are not stringent<br />
enough to implement water quality standards. The Colorado Water Quality Control Commission’s<br />
(Commission) Regulation 93 – Colorado’s Section 303(d) List of Impaired Waters (CDPHE, 2022) – fulfills this<br />
requirement by establishing a list of water-quality limited segments requiring Total Maximum Daily Loads<br />
(TMDLs). Once “listed”, the state is required to prioritize these waterbodies or segments based on the severity<br />
of pollution and other factors. The state will then determine the causes of the water quality problem and<br />
allocate responsibility to point and non-point dischargers <strong>for</strong> controlling the pollution through the issuance of<br />
TMDLs. Colorado also establishes a Monitoring and Evaluation (M&E) list <strong>for</strong> segments, which identifies water<br />
bodies where there is reason to suspect water quality challenges, but there is also uncertainty regarding one<br />
or more factors. These segments require more monitoring data to determine whether a listing is necessary in<br />
the future. The M&E list is a Colorado-only document that is not subject to EPA approval.<br />
The Colorado Department of Health and Environment (CDPHE) 303(d) and M&E listed stream segments that<br />
occur within the <strong>Commerce</strong> <strong>City</strong> study area and <strong>for</strong> which TMDLs have been issued are included in Table 1.<br />
Figure 1 shows a map of the stream segments and monitoring stations.<br />
279
Table 1. Listed Parameters on the TMDLs by Stream Segment<br />
Stream Segment<br />
COSPUS14_B<br />
Mainstem of the South Platte River from Bowles<br />
Avenue to the Burlington Ditch diversion in<br />
Denver, Colorado<br />
COSPUS15_B Mainstem of the South Platte<br />
River from the Burlington Ditch diversion in<br />
Denver, Colorado to Sand Creek<br />
COSPUS15_C<br />
Mainstem of the South Platte River from Sand<br />
Creek, to 180 meters below 120 th Ave.<br />
COSPUS15_D<br />
Mainstem of the South Platte River from 180<br />
meters below 120 th Ave, to a point immediately<br />
below the confluence with Big Dry Creek.<br />
Parameters on<br />
M&E List<br />
• Temperature<br />
Parameters on<br />
303(d) List<br />
-- • Total Arsenic<br />
• Sulfate<br />
• Total Cadmium<br />
• Temperature --<br />
• Temperature --<br />
TMDLs<br />
• Escherichia Coli<br />
((E. coli (2007))<br />
• Total Cadmium<br />
(2011)<br />
• Dissolved<br />
Oxygen (2000)<br />
• E. coli (2016)<br />
• Total Cadmium<br />
(2011)<br />
• Dissolved<br />
Oxygen (2000)<br />
• E. Coli (2016)<br />
• Total Cadmium<br />
(2011)<br />
• Dissolved<br />
Oxygen (2000)<br />
• E. coli (2016)<br />
COSPUS16c_A<br />
All tributaries to the South Platte River, including<br />
all wetlands, from the outlet of Chatfield<br />
Reservoir to a point immediately below the<br />
confluence with Big Dry Creek, except <strong>for</strong><br />
specific listings.<br />
COSPUS16d_A<br />
Second Creek from the source to the O’Brian<br />
Canal at 39.898789, -104817661.<br />
COSPUS16e_A<br />
Third Creek from the source to the O’Brian<br />
Canal at 39.917346, -104.784028.<br />
COSPUS16i_B<br />
Mainstem Sand Creek from the confluence with<br />
Westerly Creek to the confluence with the South<br />
Platte River<br />
COSPCL15_C<br />
Mainstem of Clear Creek from Wadsworth<br />
Boulevard to the confluence with the South<br />
Platte River<br />
--<br />
• E. coli (May –<br />
October)<br />
• Dissolved<br />
Selenium<br />
-- -- --<br />
-- -- --<br />
--<br />
--<br />
• E. coli<br />
• Dissolved<br />
Selenium<br />
• Temperature<br />
• E. coli (May –<br />
October)<br />
• Total Arsenic<br />
• Dissolved<br />
Manganese<br />
• Organic<br />
Sediment<br />
--<br />
--<br />
--<br />
M&E List = Monitoring and Evaluation List; TMDL = Total Maximum Daily Load<br />
Notes: The table includes stream segments of the South Platte River, Sand Creek, First Creek, Second Creek, Third Creek, and Clear Creek<br />
located within a 0.25-mile buffer of <strong>Commerce</strong> <strong>City</strong>.<br />
In<strong>for</strong>mation Sources: CDPHE, 2021; CDPHE, 2007a<br />
Technical Memorandum<br />
Water Quality Evaluation, Summary, and Recommendations Page 2<br />
280
281<br />
Page 3
3. Data Compilation and Screening<br />
Streams within the study area have been monitored by multiple agencies or organizations <strong>for</strong> multiple purposes.<br />
Publicly available monitoring station data indicate that data periods of record range from 2 years or less to<br />
many years. An inventory of water quality monitoring stations and water quality data within Adams County<br />
was compiled from the following sources:<br />
• U.S. Environmental Protection Agency (EPA)’s National Water Quality Monitoring Council<br />
(NWQMC) Database (EPA, 2021).<br />
• Colorado Data Sharing Network (CDSN) Ambient Water Quality Monitoring System (AWQMS)<br />
Portal (CDSN, 2021).<br />
• U.S. Department of the Army (U.S. Army) Draft Fifth Five-Year Review Report <strong>for</strong> the Rocky Mountain<br />
Arsenal, <strong>Commerce</strong> <strong>City</strong>, Adams County, Colorado (U.S. Army, 2021).<br />
The geographic in<strong>for</strong>mation system (GIS) monitoring station location layer was clipped using ArcGIS Pro to<br />
include only those stations within 0.25 mile of <strong>Commerce</strong> <strong>City</strong> and along the South Platte River; Sand Creek;<br />
First, Second, and Third Creeks; and Burlington Ditch. Though there are no en<strong>for</strong>ceable water quality standards<br />
<strong>for</strong> Burlington Ditch, water quality was analyzed because: 1) Burlington Ditch represents the major arterial<br />
waterway within <strong>Commerce</strong> <strong>City</strong>; 2) First, Second, and Third Creeks flow directly into Burlington Ditch; 3)<br />
Burlington Ditch flows directly into Barr Lake, a popular state park utilized <strong>for</strong> hiking, horseback riding, fishing,<br />
boating, and wildlife viewing, just downstream of <strong>Commerce</strong> <strong>City</strong>, and; 4) TMDLs <strong>for</strong> pH and dissolved oxygen<br />
have been implemented <strong>for</strong> Barr Lake to control pollutant loads received from Burlington Ditch and other<br />
upstream point and non-point source contributors.<br />
Complete water quality datasets were downloaded from the NWQMC and AWQMS databases <strong>for</strong> stations of<br />
interest and screened to assess data composition and availability at each site. The water quality monitoring<br />
station names, organizations responsible <strong>for</strong> collecting the data, stream segments where stations are located,<br />
and period of record <strong>for</strong> the available data are included in Table 2. Shaded rows indicate stations that were<br />
chosen <strong>for</strong> the analysis. Chosen stations have a minimum of 10 sample results <strong>for</strong> pollutants of interest where<br />
sampling occurred after January 1, 2016). The monitoring stations chosen <strong>for</strong> the analysis are also shown in<br />
Figure 1 above as red triangles.<br />
Table 2. Summary of Water Quality Monitoring Stations<br />
Stream<br />
Monitoring Stations<br />
Stream<br />
Segment<br />
Organization<br />
South Platte River 21COL001_WQX-5170 COSPUS14_B CDPHE<br />
South Platte River<br />
THORNTON-SP@BUR<br />
CANAL<br />
COSPUS15_B<br />
<strong>City</strong> of Thornton<br />
South Platte River 21COL001-5170 COSPUS15_B CDPHE<br />
South Platte River MWRD_WQX-SPR-1.8 COSPUS15_B MWRD<br />
South Platte River 21COL001-5165 COSPUS15_B CDPHE<br />
South Platte River THORNTON-SP UP CC COSPUS15_B <strong>City</strong> of Thornton<br />
Period of Record<br />
10/11/2007 -<br />
05/22/2018<br />
09/16/1998 -<br />
12/01/2004<br />
02/27/1998 -<br />
06/05/2008<br />
09/08/2011 -<br />
08/27/2020<br />
02/27/1998 -<br />
03/03/1999<br />
09/16/1998 -<br />
12/01/2004<br />
Technical Memorandum<br />
Water Quality Evaluation, Summary, and Recommendations Page 4<br />
282
Stream<br />
South Platte River<br />
Monitoring Stations<br />
21COL001_WQX-<br />
CO0026638-U/S<br />
Stream<br />
Segment<br />
COSPUS15_B<br />
Organization<br />
CDPHE<br />
South Platte River MWRD_WQX-SP-64 COSPUS15_B MWRD<br />
South Platte River MWRD_WQX-SPR-2 COSPUS15_B MWRD<br />
South Platte River CORIVWCH_WQX-788 COSPUS15_C<br />
Colorado River<br />
Watch (Volunteer)<br />
South Platte River MWRD-SP-CC COSPUS15_C MWRD<br />
South Platte River MWRD_WQX-SP-CC COSPUS15_C MWRD<br />
South Platte River MWRD_WQX-SPR-3.5 COSPUS15_C MWRD<br />
South Platte River CORIVWCH_WQX-227 COSPUS15_C<br />
Colorado River<br />
Watch (Volunteer)<br />
South Platte River 21COL001_WQX-5160 COSPUS15_C CDPHE<br />
South Platte River CORIVWCH_WQX-213 COSPUS15_C<br />
Colorado River<br />
Watch (Volunteer)<br />
South Platte River MWRD_WQX-SP-88 COSPUS15_C MWRD<br />
South Platte River MWRD-SP-88 COSPUS15_C MWRD<br />
South Platte River MWRD_WQX-SPR-5 COSPUS15_C MWRD<br />
Sand Creek 21COL001-5210 COSPUS16i_B CDPHE<br />
Sand Creek<br />
21COL001_WQX-<br />
CO0026638-SC<br />
COSPUS16i_B<br />
CDPHE<br />
Sand Creek MWRD-SC COSPUS16i_B MWRD<br />
Sand Creek MWRD_WQX-SC COSPUS16i_B MWRD<br />
Sand Creek 21COL001-5261 COSPUS16i_B CDPHE<br />
Sand Creek 21COL001_WQX-5210 COSPUS16i_B CDPHE<br />
First Creek SW08003 COSPUS16c_A U.S. Army (RMA)<br />
First Creek SW24004 COSPUS16c_A U.S. Army (RMA)<br />
First Creek SW37001 COSPUS16c_A U.S. Army (RMA)<br />
Second Creek BLMRW-2ND CREEK COSPUS16c_A BLMRW<br />
Third Creek BLMRW-3RD CREEK COSPUS16e_A BLMRW<br />
Burlington Ditch MWRD_WQX-BD-64 -- MWRD<br />
Period of Record<br />
03/06/2013 -<br />
12/18/2019<br />
01/03/2001 -<br />
12/12/2018<br />
09/27/1993 -<br />
09/18/2012<br />
02/11/2000 -<br />
05/12/2000<br />
05/18/1995 -<br />
12/16/2004<br />
01/03/2001 -<br />
12/12/2018<br />
09/27/1993 -<br />
10/22/2020<br />
10/30/1992 -<br />
11/15/2016<br />
01/25/2012 -<br />
02/21/2012<br />
11/19/1992 -<br />
01/28/2004<br />
01/03/2001 -<br />
12/18/2018<br />
03/12/1987 -<br />
12/16/2004<br />
10/18/2007 -<br />
10/06/2020<br />
11/12/1997 -<br />
01/26/2000<br />
03/06/2013 -<br />
12/18/2019<br />
04/08/1991 -<br />
12/16/2004<br />
01/03/2001 -<br />
12/12/2018<br />
02/25/1998 -<br />
03/03/1999<br />
07/07/2004 -<br />
01/15/2019<br />
7/29/2015 –<br />
7/17/2019<br />
7/29/2015 –<br />
7/17/2019<br />
7/29/2015 –<br />
7/17/2019<br />
05/20/2014 -<br />
12/02/2014<br />
04/30/2013 -<br />
12/02/2014<br />
01/11/1996 –<br />
12/16/2021<br />
Burlington Ditch MWRD_WQX-DBU-SC -- MWRD 3/10/2010 –<br />
Page 5<br />
283
Stream<br />
Monitoring Stations<br />
Stream<br />
Segment<br />
Organization<br />
Burlington Ditch MWRD_WQX-DBU-88 -- MWRD<br />
Burlington Ditch MWRD_WQX-DBU-104 -- MWRD<br />
Burlington Ditch MWRD_WQX-DBU-PEOR -- MWRD<br />
Burlington Ditch MWRD_WQX-DBU-BARR -- MWRD<br />
Period of Record<br />
12/14/2011<br />
3/10/2010 –<br />
12/14/2011<br />
3/10/2010 –<br />
12/14/2011<br />
3/10/2010 –<br />
7/13/2011<br />
3/10/2010 –<br />
12/14/2011<br />
MWRD = Metro Wastewater Reclamation District; CDPHE = Colorado Department of Health and Environment; BLMRW = Barr Lake Milton<br />
Reservoir Watershed; RMA = Rocky Mountain Arsenal<br />
4. Data Analysis Approach<br />
Pinyon designed the data analysis approach to provide a high-level assessment of water quality <strong>for</strong> stream<br />
segments in the study area. The assessment is intended to identify potential areas of concern, in<strong>for</strong>m additional<br />
data collection needs, and support land-use management strategy decisions through evaluating the spatial<br />
distribution of water quality and how it compares to stream water quality standards. Note that the analysis<br />
was limited to data that were available through publicly accessible databases. Due to the nature of the<br />
<strong>Commerce</strong> <strong>City</strong> area, additional pollutants can enter surface water through groundwater, non-point source<br />
discharges, and point source discharges. There<strong>for</strong>e, pollutants not included in the analysis should not be<br />
construed to mean that those pollutants are not present.<br />
Having said that, multiple water quality monitoring activities and studies have been conducted within Adams<br />
County over the years to assess both point and non-point sources of pollution. While the water quality<br />
overview presented in this memorandum is specific to surface water, Pinyon has developed maps showing<br />
locations of potential point and non-point pollution source locations in <strong>Commerce</strong> <strong>City</strong> as a whole, and more<br />
specifically along the banks of waterbodies within the industrialized areas (i.e., Sand Creek and the South Platte<br />
River). These maps are provided in a separate technical memorandum.<br />
To best analyze and track water quality conditions from upstream to downstream, the study area was divided<br />
into five sub-areas:<br />
• Sand Creek and the South Platte River Upstream of 88 th Avenue<br />
• South Platter River Downstream of 88 th Avenue;<br />
• First Creek;<br />
• Second and Third Creeks; and,<br />
• Burlington Ditch.<br />
Additional detail regarding the data and the analysis approach are provided below. Results of the data analysis<br />
are discussed in Section 5 – “Data Analysis Results”. Conclusions and recommendations are discussed in<br />
Section 6.<br />
Page 6<br />
284
4.1 Sand Creek and the South Platte River Upstream of 88 th Avenue<br />
Four stream water quality monitoring stations were chosen <strong>for</strong> analysis of Sand Creek and the South Platte<br />
River Upstream of 88 th Avenue. The stations have a robust dataset with a current period of record (includes<br />
data after January 1, 2016). The stations are as follows:<br />
• MWRD_WQX-SP-64 (“SP-64”): South Platte River at 64 th Avenue. Located in South Platte River Segment<br />
COSPUS15_B upstream the Metro Wastewater Reclamation District (WRD) and Sand Creek.<br />
• MWRD-SP-CC (“SP-CC”): South Platte River at Clear Creek. Located in South Plate River Segment<br />
COSPUS15_C downstream the Metro WRD and Sand Creek.<br />
• MWRD_WQX-SP-88 (“SP-88”): South Platte River at 88 th Avenue. Located in South Plate River Segment<br />
COSPUS15_C downstream the Metro WRD and Sand Creek.<br />
• MWRD_WQX-SC (“SC”): Sand Creek on Burlington Ditch Flume. Located in Sand Creek Segment<br />
COSPUS16i_B upstream of the confluence with the South Platte River.<br />
4.1.1 Calculation of existing water quality<br />
Existing quality (EQ) is defined in the Commission’s Regulation 31 - The Basic Standards and Methodologies <strong>for</strong><br />
Surface Water (CDPHE, 2007b) as the numeric value that represents the quality of a waterbody and is generally<br />
used <strong>for</strong> comparison with the water quality standard. (31.5(20)). The following analysis generally follows<br />
protocols outlined in Regulation 31 and Colorado’s 303(d) Listing Methodology to assess compliance with<br />
stream standards.<br />
For each of the chosen monitoring stations, the existing quality of metals, dissolved oxygen, total nitrogen, total<br />
phosphorus, sulfate, chloride, and E. coli over a five-year period of record (2016 – 2021) were calculated. For<br />
metals in total or total recoverable <strong>for</strong>m, total nitrogen, and total phosphorus, EQ was calculated as the 50 th<br />
percentile of the data. For E. coli, EQ was calculated as the geometric mean of the data. For the remaining<br />
parameters, EQ was calculated as the 85 th percentile of the data. Non-detect values <strong>for</strong> all parameters were<br />
set equal to zero in the calculation. The EQ was then compared with the relevant water quality standards.<br />
Figures showing the EQ concentrations of the parameters analyzed <strong>for</strong> current conditions (except <strong>for</strong><br />
Burlington Ditch) versus the water quality standards are included in Appendix A. Additional data statistics,<br />
including the 25 th , 50 th , and 85 th percentiles of the data sets, maximum concentrations, mean concentrations,<br />
and standard deviations are summarized in Appendix B. Burlington Ditch EQ compared to standards is included<br />
in Appendix C.<br />
4.1.2 Water quality standards<br />
The water quality standards were determined as follows:<br />
• For the South Platte River stations, the water quality standards were set equal to (with a few exceptions)<br />
to those determined in the Water Quality Assessment <strong>for</strong> the Metro Wastewater Reclamation District,<br />
Robert W. Hite Wastewater Treatment Facility (“MWRD WWTF”); Colorado Discharge Permit System<br />
[CDPS] Permit #CO0026638), issued May 31, 2018 (CDPHE, 2018a). The MWRD WWTF discharges into<br />
Stream Segment COSPUS15_C.<br />
• For the Sand Creek monitoring station, the water quality standards were set equal (<strong>for</strong> the most part) to<br />
those determined in the Water Quality Assessment <strong>for</strong> the Suncor Energy (USA) Inc. Refinery (Suncor),<br />
Page 7<br />
285
<strong>Commerce</strong> <strong>City</strong> Refinery (CDPS Permit #CO0001147), last revised September 5, 2012 (CDPHE, 2012).<br />
Suncor discharges into Stream Segment COSPUSi_B.<br />
For some parameters, the water quality standards listed in the MWRD WWTF or Suncor Water Quality<br />
Assessments were inappropriate to use. For these parameters, the following alternate approaches were used<br />
to determine the stream segment water quality standards:<br />
• Dissolved copper standard at COSPUS15: Pursuant to Regulation 38, the table value standard (TVS) applies<br />
upstream of the MWRD WWTF <strong>for</strong> dissolved copper, and a separate standard based on toxicity (the<br />
“FMB/BLM standard”) applies downstream of the MWRD WWTF. The FMB/BLM standard was revised in<br />
the June 8, 2020 Rulemaking Hearing and described in the Regulation 38 Statement of Basis and Purpose<br />
language (CDPHE, 2007c). The revision occurred after the 2018 MWRD WWTF permit was issued. The<br />
chronic dissolved copper standard used in this analysis is there<strong>for</strong>e based on the revised value listed in<br />
Regulation 38 and not the 2018 MWRD WWTF water quality assessment.<br />
• Total nitrogen (TN) and total phosphorus (TP) “interim” standards at COSPUS15 and COSPUS16i: For<br />
this analysis, the interim “warm stream” TN (2010 ug/L) and TP (170 ug/L) values were used. However, it<br />
should be noted that these values are not currently effective in the segments and are pending revisions in<br />
2027 as described in Clean Water Policy 8 (CDPHE, 2018b). The interim standards are not effective in<br />
these segments and intended only <strong>for</strong> as in<strong>for</strong>mational use. Future nutrient standards may be more<br />
stringent. EQ values above the interim values are not necessarily true exceedances of the standards.<br />
Nutrients standards <strong>for</strong> both warm and cold water streams are expected to be submitted to the<br />
Commission <strong>for</strong> approval in 2027.<br />
• Dissolved oxygen standards at COSPUS15 and COSPUS16i. Site-specific acute and chronic dissolved<br />
oxygen (DO) standards are in place <strong>for</strong> Segment 15 of the South Platte River that require specific sample<br />
collection protocols and data needs. There<strong>for</strong>e, an analysis of DO was not possible <strong>for</strong> Segment 15. The<br />
chronic 5 mg/L DO standard <strong>for</strong> Segment 16 is a table value standard and an analysis of DO <strong>for</strong> this segment<br />
was completed.<br />
4.2 South Platte River Downstream 88 th Avenue<br />
Only one stream water quality monitoring station (MWRD_WQX-SPR-5 [“SPR-5”]) occurs along the South<br />
Platte River downstream of 88 th avenue. This monitoring station’s data set had less than 10 samples <strong>for</strong> each<br />
analyte and no samples were collected after 2013. There<strong>for</strong>e, the data were not included in the current<br />
conditions analysis conducted by Pinyon. However, these data are still of value and were discussed qualitatively.<br />
The data were also included in the statistical summary that can be accessed in Appendix B. General observations<br />
related to this monitoring station are included in Section 5.<br />
4.3 First Creek<br />
Most of First Creek in <strong>Commerce</strong> <strong>City</strong> occurs within the Rocky Mountain Arsenal (RMA) (Figure 1). The RMA<br />
is a Superfund site, and as such has various requirements <strong>for</strong> surface and groundwater monitoring per the<br />
Comprehensive Environmental Response, Compensation, and Liability Act (CERCLA). The U.S. Army, in<br />
collaboration with Shell Oil Co., EPA, CDPHE, and Tri-County Health Department completed a draft Five-<br />
Year Review covering the period from 2015 to 2020 <strong>for</strong> the RMA (U.S. Army, 2021). The Five-Year Review<br />
includes monitoring at three water quality surface water stations along First Creek:<br />
• SW08003: Located in First Creek near Buckley Road<br />
• SW24004: Located in First Creek near 96th Avenue<br />
Page 8<br />
286
• SW37001 Located in First Creek near Highway 2<br />
The locations of these three stations are shown in Figure 1. According to the Five-Year Review, pollutants<br />
were analyzed annually from 2015 to 2020 at the three stations and include aldrin, arsenic, chloride,<br />
diisopropylmethyl phosphate (DIMP), dieldrin, n-nitrosodi-n-propylamine (NDPA), and sulfate (U.S. Army,<br />
2021). The pollutant concentrations were compared with the Containment System Remediation Goals<br />
(CSRGs) and/or Practical Quantitation Limits (PQLs) (U.S. Army, 2021). The CSRGs were established based<br />
on maximum contaminant levels, the Colorado Basic Standard <strong>for</strong> Groundwater, or health-based criteria (U.S.<br />
Army, 2021).<br />
4.4 Second and Third Creeks<br />
Only two water quality stations were found on Second Creek (BLMRW-2 nd CREEK) and Third Creek<br />
(BLMRW-3 rd CREEK). These stations were established by the Barr Lake Milton Reservoir (Barr-Milton)<br />
stakeholder group. Physical parameters were collected <strong>for</strong> both stations that include pH, specific conductivity,<br />
water temperature, and dissolved oxygen. The station on Third Creek also included nutrients, some metals,<br />
and some ions (i.e., sulfate, sodium and potassium). However, the data sets are small and samples were<br />
collected nearly 10 years ago (2013 to 2014). These stations were not included in the current conditions<br />
analysis, but a qualitative review of the data is discussed in the results section below.<br />
4.5 Burlington Ditch<br />
Of the water quality monitoring stations evaluated <strong>for</strong> Burlington Ditch, the station at 64 th Avenue (BD-64),<br />
had a robust dataset that met the analysis criteria. The station is located 0.18 mile downstream of where<br />
Burlington Ditch flows under Sand Creek.<br />
EQ concentrations of metals, dissolved oxygen, total nitrogen, total phosphorus, sulfate, chloride, and E. coli<br />
over a five-year period of record (2016 – 2021) were calculated. According to Regulation 31 (31.13), ditches<br />
are not subject to water quality standards. There<strong>for</strong>e, no water quality standards exist <strong>for</strong> Burlington Ditch.<br />
However, because Burlington Ditch contains point and nonpoint source pollutants that are allocated under a<br />
TMDL <strong>for</strong> the Barr-Milton watershed, Pinyon applied water quality standards equivalent to those of South<br />
Platte Segment 15 <strong>for</strong> assessment purposes. Burlington Ditch diverts from the South Platte River Segment 15<br />
directly upstream of <strong>Commerce</strong> <strong>City</strong>. Figures showing the EQ concentrations of the parameters versus the<br />
water quality standards are included in Appendix C, and a statistical summary of the data (25 th percentile, 50 th<br />
percentile, 85 th percentile, and standard deviation) is presented in Appendix B.<br />
4.5.1 Existing Water Quality<br />
For metals in total or total recoverable <strong>for</strong>m, total nitrogen and total phosphorus, EQ concentrations were<br />
calculated as the 50 th percentile of the data. For E. coli, EQ concentrations were calculated as the geometric<br />
mean of the data. For the remaining parameters, EQ concentrations calculated as the 85 th percentile of the<br />
data. Non-detect values <strong>for</strong> all parameters were set equal to zero.<br />
4.5.2 Water quality standards<br />
Water quality standards <strong>for</strong> the stream segment COSPUS15 of the South Platte River (see Section 4.1.2) were<br />
used as a basis of comparison <strong>for</strong> pollutant concentrations in Burlington Ditch.<br />
Page 9<br />
287
5. Data Analysis Results<br />
5.1 Sand Creek and South Platte River Upstream of 88 th Avenue<br />
Three South Platte River stations (SP-64, SP-CC, and SP-88) and one Sand Creek station (SC) were analyzed<br />
in Sand Creek and the South Platte River Upstream of 88 th Avenue. It is recommended that the figures in<br />
Appendix A be referred to while reading the following results summary. Statistical summaries of each data set<br />
are included in Appendix B.<br />
Table 3 lists the calculated EQ concentrations <strong>for</strong> each parameter at each site <strong>for</strong> the 2016 – 2021 period of<br />
record. Results are color coded as follows:<br />
• Green shading represents EQ concentrations that are less than 50 percent of the water quality standard.<br />
These results indicate the stream is meeting the standard with a considerable amount freeboard between<br />
the result and the standard;<br />
• Yellow shading represents EQ concentrations that are within 50 percent of the water quality standard.<br />
These results indicate that while the stream is meeting the standard, they should be monitored <strong>for</strong> upward<br />
trending.<br />
• Red shading represents EQ concentrations that are greater than the water quality standard. These are<br />
parameters that require further investigation, if not already being addressed in a 303(d) listing or TMDL<br />
<strong>for</strong> the segment.<br />
Table 3. Comparison of EQ Concentrations to the Water Quality Standards<br />
Parameter<br />
Arsenic, Total<br />
(µg/L)<br />
Cadmium,<br />
Dissolved (µg/L)<br />
Cadmium, Total<br />
(µg/L)<br />
Chloride, Total<br />
(mg/L)<br />
Chromium,<br />
Dissolved (µg/L)<br />
Copper,<br />
Dissolved (µg/L)<br />
E. coli (CFU/100<br />
mL)<br />
Iron, Dissolved<br />
(µg/L)<br />
South Platte River<br />
Sand Creek<br />
COSPUS15_B COSPUS15_C COSPUS16i_B<br />
MWRD_WQX-<br />
SP-64<br />
MWRD_WQX-<br />
SP-CC<br />
MWRD_WQX-<br />
SP-88<br />
MWRD_WQX-<br />
SC<br />
1.4 1.0 1.0 1.7<br />
27.9 1.0 0.7 0.1<br />
14.4 0.7 0.6 0.0<br />
271 157 163 N/A<br />
1.0 0.6 0.6 0.4<br />
3.9 4.6 5.3 2.4<br />
427 243 279 390<br />
Water Quality<br />
Standard 1<br />
10 (COSPUS15) /<br />
7.6 (COSPUS16i)<br />
0.67 (COSPUS15) /<br />
1.2 (COSPUS16i)<br />
5<br />
(All Segments)<br />
250 (COSPUS15) /<br />
No standard (COSPUS16i)<br />
11<br />
(All Segments)<br />
18 (COSPUS15) /<br />
29 (COSPUS16i)<br />
126<br />
(All Segments)<br />
91.4 146 174 117 300 (COSPUS15)<br />
Iron, Total (µg/L) 374 364 400 480<br />
Lead, Dissolved<br />
(µg/L)<br />
Lead, Total<br />
(µg/L)<br />
0.2 0.4 0.5 0.0<br />
0.9 0.9 1.0 0.7<br />
1,000<br />
(All Segments)<br />
4.9 (COSPUS15) /<br />
11 (COSPUS16i)<br />
50<br />
(COSPUS15)<br />
Page 10<br />
288
Parameter<br />
South Platte River<br />
Sand Creek<br />
COSPUS15_B COSPUS15_C COSPUS16i_B<br />
MWRD_WQX-<br />
SP-64<br />
MWRD_WQX-<br />
SP-CC<br />
MWRD_WQX-<br />
SP-88<br />
MWRD_WQX-<br />
SC<br />
Water Quality<br />
Standard 1<br />
Manganese,<br />
400<br />
329 163 200 342<br />
(COSPUS15) /<br />
Dissolved (µg/L)<br />
2,618 (COSPUS16i)<br />
Molybdenum,<br />
8.4 6.9 7.3 5.3 150<br />
Total (µg/L)<br />
(COSPUS15)<br />
Nickel, Dissolved<br />
87<br />
3.9 2.6 2.9 2.3<br />
(COSPUS15) /<br />
(µg/L)<br />
168 (COSPUS16i)<br />
Nitrogen, Total<br />
2.01<br />
4.6 5.1 5.4 3.3<br />
2<br />
(mg/L) (All Segments)<br />
Phosphorus,<br />
0.17<br />
0.23 0.69 0.75 0.35<br />
2<br />
Total (mg/L) 1 (All Segments)<br />
Selenium,<br />
4.6<br />
3.0 2.2 1.9 11.3<br />
Dissolved (µg/L)<br />
(All Segments)<br />
Sulfate, Total<br />
532<br />
322 177 170 475<br />
(COSPUS15) /<br />
(mg/L)<br />
535 (COSPUS16i)<br />
Zinc, Dissolved<br />
211<br />
36 45 49 17<br />
(COSPUS15) /<br />
(mg/L)<br />
405 (COSPUS16i)<br />
1 The acute water quality standards are used <strong>for</strong> total lead and total cadmium; the chronic water quality standards are used <strong>for</strong> all other<br />
pollutants.<br />
2 Interim water quality standard<br />
According to Table 3, the following parameters are greater than the water quality standards at one or more<br />
of the four water quality monitoring stations: dissolved and total cadmium, total chloride, E. coli, and dissolved<br />
selenium. Total nitrogen, total phosphorus concentrations are greater than the interim standards, indicating<br />
that a more thorough evaluation should be conducted when the revised standards are adopted in 2027. Results<br />
of the analysis track with existing regulatory actions described below.<br />
• Dissolved and total cadmium: Dissolved and total cadmium EQ concentrations exceed standards and are<br />
significantly higher at station SP-64 than other downstream stations. Station SP-64 is in the South Platte<br />
River upstream of the Metro WWTF discharge and upstream the confluence with Sand Creek. At SP-64,<br />
the dissolved cadmium EQ concentration is 27.9 µg/L (compared with the chronic dissolved cadmium<br />
water quality standard of 0.67 µg/L) and total cadmium EQ concentration is 14.4 µg/L (compared with the<br />
chronic total cadmium water quality standard of 5.0 µg/L).<br />
EQ concentrations of dissolved and total cadmium at stations SP-CC and SP-88, which are in the South<br />
Platte River downstream of the Metro WWTF and the confluence with Sand Creek, are considerably lower<br />
than the upstream station but are still slightly higher than the standard at 1.0 µg/L and (0.7 µg/L),<br />
respectively. These results indicate the source of the cadmium contributions to the South Platte originate<br />
above the Metro WWTF. The effluent discharge from Metro WWTF significantly dilutes the cadmium<br />
concentrations observed upstream.<br />
A dissolved cadmium TMDL was approved <strong>for</strong> stream Segment 15 in July 2011 (CDPHE, 2011). When the<br />
TMDL was developed, the portion of the segment between the Burlington Ditch headgate and the<br />
confluence with Clear Creek (where SP-64 and SP-CC are located) was not in attainment with the<br />
dissolved cadmium aquatic life use-based water quality standard. The primary driver of higher cadmium<br />
concentrations in this area has been attributed to groundwater contamination from the now<br />
decommissioned Globeville American Smelting and Refining Company (ASARCO) facility (CDPHE, 2011).<br />
Page 11<br />
289
• Total chloride: The total chloride EQ concentration at SP-64 (South Platte River upstream of the Metro<br />
WWTF discharge and upstream of the confluence with Sand Creek) is 271 mg/L, which is greater than the<br />
chronic chloride standard (250 mg/L) <strong>for</strong> the stream segment. The other two South Platte River stations<br />
(downstream the Metro WWTF discharge and Sand Creek confluence; SP-CC and SP-88) have EQ<br />
concentrations below, but approaching (i.e., within 50 percent of), the standard. Despite the EQ value<br />
being higher than the standard at SP-64, stream segment 15 is not currently on the 303(d) list and a TMDL<br />
has not been previously prepared <strong>for</strong> total chloride <strong>for</strong> segment 15. Chloride is a water supply standard<br />
based on a secondary maximum concentration level <strong>for</strong> drinking water. Currently, there are no aquatic life<br />
standards <strong>for</strong> chloride, but that could change in the near future.<br />
• E. coli: The E. coli EQ concentrations are greater than the water quality standard (126 colony <strong>for</strong>ming units<br />
(CFU)/100 mL) at all three South Platte River stations upstream 88 th avenue (SP-64, SP-CC, and SP-88).<br />
The maximum E. coli concentration at station SP-64 upstream of the Metro WWTF discharge and the Sand<br />
Creek confluence is 427 CFU/100 mL. A TMDL <strong>for</strong> E. coli <strong>for</strong> stream segment COSPUS15 was approved<br />
in 2016. Following the approval of the TMDL, the WQCC delisted E. coli from the 303(d) list <strong>for</strong><br />
COSPUS15.<br />
The E. coli EQ concentration at SC (Sand Creek upstream the confluence with the South Platte River) is<br />
390 CFU/100 mL, compared with the water quality standard of 126 CFU/100 mL. This value is within the<br />
range observed <strong>for</strong> the three South Platte River stations. Stream segment COSPUS16i is on the 303(d) list<br />
<strong>for</strong> E. coli; however, no approved TMDL exists at this time.<br />
• Total nitrogen: TN EQ concentrations are greater than the interim water quality standard (2.01 mg/L) at<br />
all three South Platte River stations (SP-64, SP-CC, and SP-88. Likewise, the TN EQ value at SC (Sand<br />
Creek upstream the confluence with the South Platte River) is greater than the interim water quality<br />
standard at 3.3 mg/L. It should be noted again that the TN interim criteria is a benchmark from which to<br />
compare stream concentrations, but this criteria is not currently en<strong>for</strong>ceable in any of the segments above<br />
88 th Street. A revised TN standard is expected in 2027 at which point more evaluation would be needed.<br />
• Total phosphorus: TP EQ concentrations are greater than the interim water quality standard (0.17 mg/L)<br />
at all three South Platte River stations (SP-64, SP-CC, and SP-88). However, like TN, the TP standard isn’t<br />
applied to Segment 15. It is also used as a benchmark <strong>for</strong> comparison. Once new stream standards are<br />
adopted in 2027, additional evaluation will be needed.<br />
Unlike Segment 15, Segment 16 (Sand Creek upstream the confluence with the South Platte River) does<br />
have a chronic TP standard of 0.17 mg/L. The EQ <strong>for</strong> TP calculated using data at the SC station is 0.35<br />
mg/L, which is above the interim standard. However, because new standards are expected to be adopted<br />
in 2027, it is unlikely that CDPHE would pursue a TMDL prior to the adoption of the revised standards.<br />
• Dissolved selenium: All of the South Platte River stations in Segment 15 upstream of 88 th Avenue have<br />
dissolved selenium EQ that is lower than the selenium water quality standard. However, the EQ <strong>for</strong><br />
dissolved selenium at SC (Sand Creek upstream the confluence with the South Platte River) is 11.29 µg/L,<br />
which is over two times the water quality table value standard of 4.6 µg/L.<br />
In addition, the dissolved selenium EQ <strong>for</strong> Sand Creek (SC) is over three times higher than those observed<br />
in the South Platte River stations. At least a portion of the selenium is likely from natural background<br />
concentrations associated with the geology of the area that includes shale <strong>for</strong>mations. Shale is known to<br />
leach selenium and salinity into ground and surface water sources in areas of the Denver basin that exceed<br />
aquatic life standards.<br />
Page 12<br />
290
The Suncor refinery is required by the EPA to remove selenium from fuel products; however, the facility<br />
has been unable to discharge levels low enough to ensure compliance with the standard downstream.<br />
Accordingly, the Commission adopted a discharger specific variance (DSV) <strong>for</strong> the South Platte River<br />
(COSPUS15) and Sand Creek (COSPUS16i) <strong>for</strong> selenium. The alternative chronic and acute effluent limits<br />
<strong>for</strong> selenium assigned to Suncor are 24 µg/L and 37 ug/L, respectively. These limits represent the highest<br />
degree of protection of the classified uses that Suncor could feasibly meet. The DSV expires on December<br />
31, 2023. In early 2022, the Water Quality Control Division released a draft Suncor renewal permit that<br />
includes effluent selenium limits of 4.6 ug/L (chronic) and 18 ug/L (daily maximum) that would become<br />
effective in January, 2025. The renewal permit has not yet been finalized.<br />
Stream segment COSPUS16i is on the 303(d) listed <strong>for</strong> selenium; however, there is currently no TMDL.<br />
Parameters that are approaching the standard (yellow shading), but less than the standard include dissolved<br />
iron, dissolved manganese, and dissolved sulfate. Note that in 2020, a portion of the South Platte River<br />
(Segment 15_B) located just below the confluence with Sand Creek was listed <strong>for</strong> total cadmium and sulfate.<br />
5.2 South Platte River Downstream 88 th Avenue<br />
The one South Platte River station that occurs downstream of 88 th Avenue – “SPR-5” – is in stream segment<br />
(COSPUS15c) which includes the mainstem of the South Platte River from Sand Creek to 180 meters below<br />
120th Avenue. This segment has approved TMDLs <strong>for</strong> dissolved cadmium (2011), dissolved oxygen (2000), and<br />
E. coli (2016). It is also on Colorado’s M&E list <strong>for</strong> temperature (Table 1). The station had neither the 10 data<br />
points nor recent data to meet the criteria set by Pinyon <strong>for</strong> current conditions. However, the data are still<br />
valuable in helping to define water quality at a moment in time, which in this case is prior to 2013. General<br />
observations gleaned from the summary statistics table presented in Appendix B indicate that, based on an<br />
average hardness of 256 mg/L CaCO 3 , this station was likely meeting standards <strong>for</strong> copper, cadmium, zinc,<br />
silver, and manganese. Results <strong>for</strong> both TN and TP were higher than the interim standards but recall that the<br />
TN and TP interim standards are in the process of being revised. No data were available <strong>for</strong> E. coli, pH, or<br />
dissolved oxygen.<br />
5.3 First Creek<br />
First Creek is stream segment COSPUSc-A, which is listed <strong>for</strong> E. coli (May-October) and dissolved selenium.<br />
Pinyon was unable to find the data used to support the 303(d) listing in the publicly accessible databases. There<br />
are no approved TMDLs <strong>for</strong> this segment. Water quality data based on the U.S. Army Rocky Mountain Arsenal<br />
(RMA) water quality sampling program along First Creek are documented in the Draft Fifth Five-Year Review<br />
Report <strong>for</strong> the Rocky Mountain Arsenal (US Army, 2021) and are included below in Table 4. Concentrations that<br />
exceeded the CSRGs or practical quantitation limits (PQLs) are shaded in red.<br />
Most of First Creek flows through the RMA National Refuge. The RMA was established in 1942 to produce<br />
chemical warfare agents and incendiary munitions to be used in World War II. Starting in 1946, a portion of<br />
the RMA facilities were leased to private companies to manufacture industrial and agricultural chemicals,<br />
including pesticides. These activities resulted in contamination of approximately 3,000 acres of soil, 15<br />
groundwater plumes, and 790 structures. The principal contaminants included organochlorine pesticides, heavy<br />
metals, agent-degradation products, manufacturing by-products, and chlorinated and aromatic solvents.<br />
Contaminated areas that posed risks to human health and the environment were addressed through the 1996<br />
On-Post Record of Decision (“On-Post ROD”) (Foster Wheeler, 1996). The On-Post ROD required the<br />
interception and treatment of groundwater through groundwater pump-and-treat systems. However, these<br />
treatments occurred after some groundwater contamination had already migrated to the north and northwest<br />
of the RMA boundaries (“off-post" area). In response, a ROD <strong>for</strong> the off-post area (“Off-Post ROD”) was<br />
Page 13<br />
291
prepared and approved in 1995 (HLA, 1995). The Off-Post ROD required operation of an Off-Post<br />
Groundwater Intercept and Treatment System (OGITS) to treat contaminated alluvial groundwater. The<br />
OGITS consist of two separate extraction systems (the First Creek Pathway System and the Northern Pathway<br />
System) located along Highway 2 north of the RMA. The OGITS removes groundwater from the system via<br />
extraction wells, treats the extracted groundwater by carbon adsorption, and returns the groundwater to the<br />
alluvial system using recharge wells or recharge trenches.<br />
The Off-Post ROD established a long-term groundwater and surface water monitoring program to assess<br />
contaminant concentrations and evaluate the success of remediation. Surface water monitoring <strong>for</strong> the three<br />
stations along First Creek indicated that arsenic is the only parameter currently not meeting its containment<br />
system remediation goal (CSRG, Table 1). Arsenic has historically occurred at higher concentrations in samples<br />
at SW37001 (First Creek near Highway 2) compared to samples collected at SW24004 (the RMA boundary at<br />
96 th Avenue). This historical trend has remained consistent; there<strong>for</strong>e, it is likely that high arsenic<br />
concentrations in surface water at SW37001 are naturally occurring and not attributable to activities at the<br />
RMA (U.S. Army, 2021). All other pollutants are currently meeting goals at First Creek. Treatment of<br />
groundwater contaminants at the OGITS is likely having a positive impact on First Creek water quality.<br />
Table 4. First Creek Water Quality Results<br />
Site<br />
Sampling<br />
Date<br />
Analyte Concentrations (µg/L)<br />
Aldrin Arsenic Chloride DIMP Dieldrin NDMA Sulfate<br />
7/29/15<br />
LT<br />
LT LT<br />
1.25 92,200 LT 0.5<br />
0.00499<br />
0.00361 0.00115<br />
172,000<br />
SW08003<br />
LT<br />
LT<br />
7/12/16<br />
LT 1 102,000 LT 0.5<br />
First<br />
0.00499<br />
0.00361<br />
LT 0.0015 176,000<br />
Creek<br />
LT<br />
LT<br />
8/22/17<br />
1.14 92,800 LT 0.5<br />
Near<br />
0.00499<br />
0.00361<br />
LT 0.003 153,000<br />
Buckley<br />
LT<br />
LT<br />
6/07/18<br />
LT 1 77,300 LT 0.5<br />
Road<br />
0.00898<br />
0.00263<br />
LT 0.003 144,000<br />
7/17/19<br />
LT<br />
LT<br />
1.25 96,500 LT 0.5<br />
0.00898<br />
0.00263<br />
LT 0.003 147,000<br />
7/29/15<br />
LT<br />
LT LT<br />
1.82 115,000 LT 0.5<br />
0.00499<br />
0.00361 0.00115<br />
229,000<br />
LT<br />
LT<br />
SW24004 7/12/16<br />
1.14 134,000 LT 0.5<br />
LT 0.0015 227,000<br />
0.00499<br />
0.00361<br />
First<br />
LT<br />
LT<br />
Creek 8/22/17<br />
1.70 127,000 LT 0.5<br />
0.00445 222,000<br />
0.00499<br />
0.00361<br />
Near 96 th<br />
LT<br />
LT<br />
Avenue 6/07/18<br />
1.66 105,000 LT 0.5<br />
LT 0.003 189,000<br />
0.00898<br />
0.00263<br />
7/17/19<br />
LT<br />
0.00898<br />
2.56 121,000 LT 0.5 0.00327 LT 0.003 172,000<br />
7/29/15<br />
LT<br />
LT LT<br />
2.43 136,000 LT 0.5<br />
0.00499<br />
0.00361 0.00115<br />
250,000<br />
LT<br />
SW37001 7/12/16<br />
2.83 135,000 LT 0.5 0.00908 LT 0.0015 223,000<br />
0.00499<br />
First<br />
LT<br />
LT<br />
Creek 8/22/17<br />
2.07 142,000 LT 0.5<br />
0.00409 242,000<br />
0.00499<br />
0.00361<br />
Near<br />
LT<br />
Highway 2 6/07/18<br />
2.60 127,000 LT 0.5 0.00659 LT 0.003 230,000<br />
0.00898<br />
7/17/19<br />
LT<br />
0.00898<br />
3.12 129,000 LT 0.5 0.00535 LT 0.003 179,000<br />
CSRG/PQL (µg/L) 0.014 2.35 1 250,000 8 0.013 0.009 540,000<br />
DIMP = diisopropylmethyl phosphate; NDPA = n-nitrosodi-n-propylamine; CSRG = Containment System Remediation Goal; PQL = Practical<br />
Quantitation Limit; LT = Concentrations less than the method reporting limit.<br />
Page 14<br />
292
Values shaded in red exceeded the CSRG/PQL<br />
Table source: U.S. Army, 2021<br />
1<br />
Established based on health-based criteria<br />
5.4 Second and Third Creeks<br />
Neither Second nor Third Creeks are listed as impaired. There are also no approved TMDLs <strong>for</strong> these<br />
segments. Data collected by the Barr-Milton watershed stakeholders at the Second Creek (BLMRW-2 nd<br />
CREEK) and Third Creek (BLMRW-3 rd CREEK) stations included a short period of record (2013 to 2014) with<br />
relatively few results <strong>for</strong> each parameter. Though not robust enough <strong>for</strong> the current conditions analysis, the<br />
data were qualitatively reviewed:<br />
• Sulfate values ranged 260 to 1720 mg/L compared to the sulfate standard of 250 mg/L.<br />
• Temperatures were lower than the Warm Stream III standards.<br />
• Dissolved oxygen values ranged from 0.8 to 11.1 mg/L. The stream standard is 4.0 mg/L (15 th percentile<br />
of data collected between 6:30 am and 6:30 pm). No times were provided <strong>for</strong> the samples, but it is likely<br />
they were collected during daylight hours. More data would be necessary to assess compliance.<br />
• Dissolved iron values ranged from less than 0.05 mg/L to 0.72 mg/L compared to the water supply standard<br />
of 0.3 mg/L.<br />
• All pH values were within the standard range of 6.5 to 9.<br />
• Total phosphorus ranged from 0.25 to 3.96 mg/L. The interim standard is 0.17 mg/L.<br />
• Total nitrogen was not collected at this location.<br />
Observations of the Second Creek data include:<br />
• Dissolved oxygen values ranged from 3.8 to 13.3 mg/L. The stream standard is 3.33 mg/L (15 th percentile<br />
of data collected between 6:30 am and 6:30 pm). Not enough in<strong>for</strong>mation is available to assess compliance.<br />
• pH ranged from 7.51 to 8.19 compared to the standard range of 6.5 to 9.<br />
• Temperature values were lower than the standards <strong>for</strong> Warm Stream III.<br />
5.5 Burlington Ditch<br />
Burlington Ditch at 64 th Avenue (BD-64) had sufficient data <strong>for</strong> the current conditions water quality data<br />
analysis. Figures showing the EQ concentrations of the parameters versus the water quality standards are<br />
included in Appendix C, and a statistical summary of the data (25 th percentile, 50 th percentile, 85 th percentile,<br />
and standard deviation) is available in Appendix B. According to the Commission’s Regulation 31, ditches are<br />
not classified and there<strong>for</strong>e do not have water quality standards. Despite this, Burlington Ditch is subject to<br />
pollutant loading allocations defined in TMDL(s) <strong>for</strong> the Barr-Milton watershed. To gain a sense of water quality<br />
in the Burlington Ditch, data were analyzed against the same standards used <strong>for</strong> the South Platte River upstream<br />
of 88 th Avenue, except <strong>for</strong> sulfate where the table value standard of 250 mg/L was substituted <strong>for</strong> the sitespecific<br />
standard of 532 mg/L.<br />
Page 15<br />
293
Table 5 lists the calculated EQ concentrations compared to water quality standards at BD-64 <strong>for</strong> the 2016 –<br />
2021 period of record. Results are color coded as follows:<br />
• Green shading represents EQ concentrations that are less than 50 percent of the water quality standard.<br />
These results indicate the stream is meeting the standard with plenty of freeboard between the result and<br />
the standard;<br />
• Yellow shading represents EQ concentrations that are within 50 percent of the water quality standard.<br />
These results indicate that while the stream is meeting the standard, they are flagged as within 50 percent<br />
of the standard indicating a need to track them.<br />
• Red shading represents EQ concentrations that are greater than the water quality standard. These are<br />
parameters that should be further investigated, if not already included in a 303(d) listing <strong>for</strong> the segment.<br />
Table 5. Analyte Concentrations in Relation to the Water Quality Standards<br />
Parameter<br />
Burlington Ditch at 64 th<br />
Avenue<br />
COSPUS15<br />
Water Quality Standard 1<br />
Arsenic, Total (µg/L) 1.0 10<br />
Cadmium, Dissolved (µg/L) 0.1 0.67<br />
Cadmium, Total (µg/L) 0.0 5<br />
Chloride, Total (mg/L) 137 250<br />
Chromium, Dissolved (µg/L) 0.6 11<br />
Copper, Dissolved (µg/L) 3.5 18<br />
E. coli (CFU/100 mL) 471 126<br />
Iron, Dissolved (µg/L) 76 300<br />
Iron, Total (µg/L) 427 1,000<br />
Lead, Dissolved (µg/L) 0.0 4.9<br />
Lead, Total (µg/L) 1.0 50<br />
Manganese, Dissolved (µg/L) 129 400<br />
Molybdenum, Total (µg/L) 6.2 150<br />
Nickel, Dissolved (µg/L) 2.3 87<br />
Nitrogen, Total (mg/L) 4.40 2.01 2<br />
Phosphorus, Total (mg/L) 1 0.57 0.17 2<br />
Selenium, Dissolved (µg/L) 2.7 4.6<br />
Sulfate, Total (mg/L) 172 250<br />
Zinc, Dissolved (mg/L) 24 211<br />
1 The acute water quality standards are used <strong>for</strong> total lead and total cadmium; the chronic water quality standards are used <strong>for</strong> all other<br />
pollutants. Water quality standards are based on standards <strong>for</strong> stream segment COSPUS15<br />
2<br />
Interim water quality standard<br />
Page 16<br />
294
As shown in Table 5, the geometric mean <strong>for</strong> E. coli at BD-64 is greater than water quality standard of 126<br />
cfu/mL <strong>for</strong> COSPUS15. TN and TP were also higher than the interim standards, which indicates these<br />
parameters should be further evaluated when revised standards <strong>for</strong> nutrients are adopted. Additionally, total<br />
chloride and dissolved selenium are approaching (i.e., are within 50 percent of) the water quality standards <strong>for</strong><br />
those constituents, but not an immediate concern.<br />
6. Per- and Polyfluoralkyl Substances (PFAS) in Ground- and Surface<br />
Water<br />
6.1 PFAS in Groundwater<br />
PFAS are a large, complex group of manufactured chemicals that are used widely in everyday goods including<br />
food packaging, stain resistant carpets, clothing, non-stick products, and firefighting foam. The chain linked<br />
carbon and fluorine atoms of PFAS <strong>for</strong>m one of the strongest chemical bonds, which is why PFAS are also<br />
called “<strong>for</strong>ever chemicals”. It is unknown how long it takes <strong>for</strong> them to degrade in the environment and it may<br />
take many years <strong>for</strong> them to leave the human body. PFAS has been linked to health effects that include<br />
pregnancy complications, developmental effects, and liver and kidney effects. (CDPHE, Policy 20-1, 2020)<br />
PFAS have been detected in several different locations across Colorado, including <strong>Commerce</strong> <strong>City</strong>. In mid-<br />
2018, the South Adams County Water and Sanitation District (SACWSD) detected PFAS in samples of water<br />
tested from certain shallow groundwater wells in the Quebec/I-270 corridor that feed into the water supply.<br />
In 2019, after learning of PFAS contamination impacting SACWSD’s public drinking water wells, CDPHE<br />
partnered with Tri-County Health Department to conduct a large, bilingual campaign to find which residents<br />
drink well water in the area and educate them on how to reduce possible exposure to the chemicals. Tri-<br />
County notified and educated residents of the campaign through press releases, letters, and door-to-door<br />
contact. During this time, Tri-County identified private wells in the area and tested many of them. The private<br />
wells that tested above the current EPA health advisory of 70 parts per trillion 1 (ppt) combined were owned<br />
by residents who did not drink the water. The remaining private wells that were not tested are: 1) either used<br />
<strong>for</strong> irrigation, 2) are located at a depth not likely to be contaminated by PFAS, or 3) not used <strong>for</strong> drinking.<br />
In 2021, CDPHE again partnered with the Tri-County Health Department to identify designated areas in Adams<br />
County with the potential <strong>for</strong> PFAS contamination. Ten private wells <strong>for</strong> 31 different types of PFAS were tested.<br />
The analytical laboratory could measure most of the PFAS compounds down to 10 ppt. All of the water samples<br />
collected during this project were below detection levels <strong>for</strong> the PFAS compounds: Perflourooctanoic acid<br />
(PFOA) and Perfluorooctanesulfonic acid (PFOS). Nine of the ten samples collected during this project were<br />
below detection levels <strong>for</strong> all the PFAS compounds analyzed. One sample had measurable levels <strong>for</strong> two of the<br />
PFAS compounds, Perfluoro-n-hexanoic acid (PFHxA) at 11.5 ppt and Perfluoro-n-pentanoic acid (PFPeA) at<br />
16.6 ppt. These two compounds are not part of the current EPA health advisory. The Tri-County Health<br />
Department website provides a report and regional map containing private well test results from this sampling<br />
ef<strong>for</strong>t 2 .<br />
CDPHE has found that <strong>for</strong> the SACWSD drinking water wells, PFAS groundwater contamination originates at<br />
the Denver Fire Training Facility. Together, CDPHE and the <strong>City</strong> of Denver are conducting PFAS sampling and<br />
evaluation at this site to fill in data gaps, better understand the impacts and identify other possible sources of<br />
contamination. The extent of the contamination is still being investigated and CDPHE hopes to have more<br />
in<strong>for</strong>mation available after Phase II of the investigation is completed. A final report summarizing findings is<br />
1 EPA has established the combined total health advisory level <strong>for</strong> PFOA and PFOS in drinking water at 70 parts per trillion..<br />
2 PFAS Testing | Tri-County Health Department - Official Website (tchd.org)<br />
Page 17<br />
295
expected in June or July of 2022. Phase I of the investigation was to confirm the contamination and Phase II is<br />
designed to identify the plume boundary.<br />
6.2 PFAS in Surface Water<br />
In addition to concerns regarding PFAS contamination at the Denver Fire Training Facility, a large quantity of<br />
firefighting foams containing PFAS have been used on the Suncor refinery property resulting in levels above<br />
1,000 ppt (PFOA+PFOS) in some groundwater monitoring wells on the facility’s site. High levels of PFAS have<br />
also been observed in Sand Creek and the South Platte River below the confluence of Sand Creek. 3 In<br />
accordance with the Commission’s Policy 20-1 (CDPHE, 2020), several actions, conditions, monitoring,<br />
requirements, and limits have been proposed in Suncor’s draft permit – currently in the process of renewal -<br />
to protect downstream surface waters from PFAS discharge and groundwater impacts. For example, new PFAS<br />
limits have been proposed <strong>for</strong> the facility’s primary discharge outfall and <strong>for</strong> three stormwater outfalls. The<br />
limits are set equal to the EPA’s health advisory threshold of 70 ppt. These proposed limits are subject to<br />
change until the final permit is adopted, which is expected within the next several months. <strong>Commerce</strong> <strong>City</strong><br />
has been actively engaged in CDPHE’s outreach ef<strong>for</strong>ts and has provided public comment during the permit<br />
renewal process.<br />
7. Summary<br />
Key findings of the water quality evaluation provided in this technical memorandum are as follows:<br />
• Extensive water quality monitoring <strong>for</strong> both surface and ground water within <strong>Commerce</strong> <strong>City</strong> has been<br />
conducted <strong>for</strong> many years <strong>for</strong> multiple purposes and by multiple agencies/organizations.<br />
• Portions of Sand Creek, the South Platte River, the Burlington Ditch, and First, Second, and Third Creeks<br />
are within <strong>Commerce</strong> <strong>City</strong> boundaries.<br />
• Several stream segments within <strong>Commerce</strong> <strong>City</strong> have been placed on the 303(d) list <strong>for</strong> impaired waters,<br />
including the following:<br />
o<br />
o<br />
o<br />
o<br />
Sand Creek Segment 16i_B: E. coli, dissolved selenium.<br />
South Platte River Segment 15_B (below Sand Creek): sulfate, total cadmium and M&E List<br />
<strong>for</strong> temperature.<br />
South Platte River Segment 15_C (mainstem to below 120 th Ave.): M&E List <strong>for</strong> temperature.<br />
First Creek Segment 16c_A: E. coli (May – October), dissolved selenium.<br />
• Several TMDLs have been written <strong>for</strong> segments within <strong>Commerce</strong> <strong>City</strong> with the goal of bringing these<br />
streams back into compliance with standards. Once TMDLs are written and approved, the stream is<br />
delisted <strong>for</strong> the parameter of concern. The following segments have completed TMDLs:<br />
o<br />
South Platte River Segment 15_B (below Sand Creek): Dissolved cadmium, dissolved oxygen,<br />
E. coli.<br />
3 Results of PFAS analysis <strong>for</strong> Sand Creek can be accessed at:<br />
https://drive.google.com/file/d/1jYC20sjvBXP5M4mvavGpFkJOnzBt4HWB/view<br />
Page 18<br />
296
o<br />
South Platte River Segment 15C (mainstem to below 120 th Ave.): Total cadmium, dissolved<br />
oxygen, E. coli.<br />
• Analysis results that compare existing quality to water quality standards track well with 303 (d) listings and<br />
TMDLs, and show that:<br />
o<br />
o<br />
o<br />
o<br />
o<br />
o<br />
o<br />
o<br />
Dissolved cadmium concentrations in the South Platte River upstream of 88 th Street may not<br />
be meeting standards. A TMDL is in place <strong>for</strong> Segment 15_B.<br />
The total cadmium standard is not being met in the South Platte River Segment 15_B,<br />
however; this segment was placed on the 303(d) list <strong>for</strong> total cadmium in 2020.<br />
Existing quality <strong>for</strong> total chloride concentrations in the South Platte River Segment 15_B is<br />
slightly higher than the standard indicating that this segment may be out of compliance with<br />
the standard. Chloride is a secondary drinking water standard and not highly toxic.<br />
E. coli standards are not being met in Sand Creek or in the South Platte River segments<br />
upstream of 88 th . The South Platte River segments have TMDLs <strong>for</strong> E. coli (2016). Sand Creek<br />
does not have a TMDL <strong>for</strong> E. coli. Concentrations of E. coli in Burlington Ditch are also higher<br />
than the standard, but this in<strong>for</strong>mation is <strong>for</strong> comparison only since ditches are not subject<br />
to water quality standards.<br />
The dissolved selenium standard is not being met in Sand Creek, which is listed <strong>for</strong> this<br />
parameter. A TMDL has not yet been developed.<br />
All surface water sampling sites analyzed (including Burlington Ditch) indicate that existing<br />
quality <strong>for</strong> total nitrogen and total phosphorus are higher than the interim nutrient standards.<br />
For sites where EQ could not be evaluated due to data limitations, maximum TN and TP<br />
concentrations were generally higher than the interim standards. Revised nutrient standards<br />
will be adopted in 2027.<br />
First Creek is subject to containment system remediation goals, all of which are being met<br />
except <strong>for</strong> arsenic. It is believed that arsenic concentrations are primarily driven by the<br />
geology of the area. Note that the CDPHE is in the process of revising total arsenic standards<br />
and there has been talk that the arsenic standard may become less stringent.<br />
Second and Third Creeks had limited data sets. Data that were available <strong>for</strong> metals, dissolved<br />
oxygen, pH, and temperature were reviewed and indicated, generally, that these constituents<br />
are of low concern. However, maximum TN and TP values were higher than the interim<br />
standard, and sulfate values <strong>for</strong> Third Creek were substantially higher than the standard.<br />
• PFAS threats in South Adams County continue to be investigated by CDPHE. Groundwater source<br />
remedial actions will be identified once the investigations conclude. Surface water threats from point<br />
source discharges are addressed through water quality permits. CDPHE has included limits <strong>for</strong> PFAS<br />
in recent permit renewals.<br />
8. Recommendations<br />
The water quality evaluation conducted by Pinyon indicates that most identified water quality issues within<br />
<strong>Commerce</strong> <strong>City</strong> either have been, or are in the process of being, addressed through regulatory means (e.g.,<br />
303(d) listings, TMDLs, CSRGs, specialized PFAS investigations). The evaluation also shows that nutrients (TN<br />
Page 19<br />
297
and TP) and temperature have potential to be future contaminants of concern. E. coli standards are also not<br />
met in multiple segments despite TMDLs that have been developed to control point and non-point<br />
contributions <strong>for</strong> this contaminant. Based on these observations, Pinyon makes the following recommendations:<br />
1. Delay implementation of water quality monitoring. One purpose of the water quality evaluation<br />
presented above was to assess whether there were significant data gaps that should be addressed<br />
through a synoptic water quality sampling event, or a sustained monitoring program. Pinyon finds that<br />
there would be little immediate benefit to selective monitoring at this time. Several long-term<br />
monitoring stations have been established throughout the <strong>City</strong>’s stream segments over the years<br />
including those monitored by CDPHE, Metro WRD, the <strong>City</strong> of Thornton, Barr-Milton Watershed<br />
group, Colorado Riverwatch, and the US Army. Most of the current monitoring stations are<br />
established and maintained by Metro WRD, which has conducted frequent sampling <strong>for</strong> many years.<br />
Parameters monitored are generally the same as those that exist <strong>for</strong> water quality standards.<br />
Additionally, CDPHE is working to revise several water quality standards in an ongoing Water Quality<br />
Forum workgroup that include temperature, nutrients (both stream and lake), arsenic, selenium, and<br />
ammonia. The proposed standards will be considered by the Commission over the next several years<br />
through 2027. At that time, all the “new” standards are expected to become immediately effective in<br />
individual Colorado basin standards. Pinyon recommends that <strong>Commerce</strong> <strong>City</strong> track the progress of<br />
the standards revisions and consider conducting baseline monitoring in 2024 or 2025, if appropriate.<br />
2. Develop a Stream Corridor Management Reference Document. The Environmental Services contract<br />
includes a task to develop long-term management <strong>for</strong> creek corridors. Pinyon proposes that this be<br />
designed as a high-level reference document that would include a limited menu of available<br />
tools/approaches that are designed specifically <strong>for</strong> <strong>Commerce</strong> <strong>City</strong> and relatively easy to implement.<br />
The goal would be to ideally limit the scope to non-controversial regulatory alternatives (code and<br />
en<strong>for</strong>cement), education and outreach activities, and development/re-development strategies that<br />
focus on reduction of land-use impacts. Examples include:<br />
a. Managing impacts associated with riparian buffer degradation and maintenance/protection of<br />
undeveloped buffers. Examples include redefining (if necessary) and en<strong>for</strong>cing setback<br />
requirements; implementing no-mow zones; encouraging voluntary or incentive programs to<br />
restore and protect riparian areas. Strategies and design elements should focus on reducing<br />
nutrients, temperature, and E. coli to the degree possible.<br />
b. Managing impacts associated with impervious cover and urban runoff such as implementation<br />
of stormwater infrastructure design standards that incorporate low impact development (LID)<br />
and green infrastructure (GI) practices and design criteria. This may also include updating (if<br />
necessary) the <strong>City</strong>’s operations and maintenance <strong>Plan</strong>(s) <strong>for</strong> existing and new infrastructure,<br />
and education and outreach to in<strong>for</strong>m people about regulatory requirements and LID and GI.<br />
c. Managing impacts of pollutants associated with land-use activities. The adverse effects of<br />
pollutants in stormwater and urban runoff on water quality and aquatic health are well<br />
documented in scientific literature. In residential and commercial areas, a variety of pollutants<br />
are generated in stormwater that may include sediment, pesticides, lawn chemicals, nutrients,<br />
de-icers, E. coli, trace metals, oil, grease and hydrocarbons. Examples of managing land-use<br />
activities may include actions like establishing and en<strong>for</strong>cing “restricted spray zones”, educating<br />
citizens about the use of lawn care chemicals (quantity, composition, toxicity, application, etc.),<br />
and establishing an Integrated Pest Management (IPM) Policy to name a few.<br />
Page 20<br />
298
3. Track water quality monitoring activities and discharge permit violations. Pinyon recommends that<br />
<strong>Commerce</strong> <strong>City</strong> develop a system to track water quality monitoring activities and discharge permit<br />
compliance <strong>for</strong> waterbodies within <strong>City</strong> boundaries. Tracking violations will allow the <strong>City</strong> to flag noncompliance<br />
issues of concern and facilitate discussions with CDPHE regarding if/how concerns are/will<br />
be addressed.<br />
Page 21<br />
299
9. References<br />
Colorado Department of Health and Environment (CDPHE), 2011. Total Maximum Daily Load Assessment,<br />
Cadmium, S. Platte River Segment 15, Denver County, Colorado. CDPHE, Water Quality Control<br />
Division (WQCD).<br />
CDPHE, 2012. Water Quality Assessment – Sand Creek – <strong>City</strong> of Aurora Sand Creek Water Reuse Facility<br />
and Suncor Energy (USA) Inc., Wastewater Treatment Facility. Permit #s CO002611; CO00011147.<br />
CDPHE, WQCD.<br />
CDPHE, 2007a. “5 CCR 1002-93 Regulation 93 – Colorado’s Section 303(d) List of Impaired Waters and<br />
Monitoring and Evaluation List.” Available at:<br />
https://www.sos.state.co.us/CCR/GenerateRulePdf.do?ruleVersionId=8787&fileName=5%20CCR%20<br />
1002-93. CDPHE, Water Quality Control Commission (WQCC). Effective July 2007, Revised<br />
December 2020. Accessed June 2021.<br />
CDPHE, 2007b. “5 CCR 1002-31-Regulation No. 31 – The Basic Standards and Methodologies <strong>for</strong> Surface<br />
Water.” Available at:<br />
https://www.sos.state.co.us/CCR/GenerateRulePdf.do?ruleVersionId=9874&fileName=5%20CCR%20<br />
1002-31. CDPHE, WQCC. Effective July 2007, Revised December 2021.<br />
CDPHE, 2007c. “5 CCR 1002-38 Regulation 38 – Classifications and Numeric Standards <strong>for</strong> South Platte River<br />
Basin, Larimer River Basin, Republican River Basin, Smoky Hill River Basin.” Available at:<br />
https://www.sos.state.co.us/CCR/GenerateRulePdf.do?ruleVersionId=9210&fileName=5%20CCR%20<br />
1002-38. CDPHE, WQCC. Effective July 2007, Revised December 2020. Accessed June 2021<br />
CDPHE, 2018a. Colorado Discharge Permit System (CDPS) Fact Sheet to Permit Number CO200638 -Metro<br />
Wastewater Reclamation District, Robert W. Hite Treatment Facility, Adams County. Colorado<br />
CDPHE, WQCD.<br />
CDPHE, 2018b. “Colorado Nutrient Management <strong>Plan</strong> and 10-Year Water Quality Roadmap.” CDPHE, Water<br />
Quality Control Division. Effective Date: September 30, 2018. Available at:<br />
https://oitco.hylandcloud.com/CDPHERMPop/docpop/docpop.aspx<br />
CDPHE, 2020. “Policy 20-1. Policy <strong>for</strong> Interpreting the Narrative Water Quality Standards <strong>for</strong> Per- and<br />
Polyfluoroalkyl Substances (PFAS). CDPHE, WQCC. Approved: July, 2020. Expires: July, 2025.<br />
Available at: https://drive.google.com/file/d/119FjO4GZVaJtw7YFvFqs9pmlwDhDO_eG/view<br />
CDPHE, 2021. “TMDL: South Platte River basin.” Available at: https://cdphe.colorado.gov/tmdl-south-platteriver-basin.<br />
Accessed June 2021.<br />
CDPHE, 2022. “Section 303(d) Listing Methodology 2024 Listing Cycle”.” Available at<br />
https://drive.google.com/file/d/1jlgq37fgFV5MpUC3HPA5misOmvhKeMrZ/view<br />
Environmental Protection Agency (EPA), 2021. “National Water Quality Monitoring Council.” Available at:<br />
https://www.waterqualitydata.us/portal/. Accessed May 2021.<br />
Foster Wheeler Environmental Corporation (Foster Wheeler), 1996. Record of Decision <strong>for</strong> the On-Post<br />
Operable Unit. Version 3.1. December 1996<br />
Page 22<br />
300
Harding Lawson Associate (HLA), 1995. Rocky Mountain Arsenal Offpost Operable Unit, Final Record of<br />
Decision. December 19, 1995.<br />
U.S. Department of the Army (U.S. Army), 2021. “Draft Fifth Five-Year Report <strong>for</strong> the Rocky Mountain Arsenal<br />
<strong>Commerce</strong> <strong>City</strong> Adams County, Colorado.” May 2021, Revision E. Prepared <strong>for</strong> the U.S. Department<br />
of the Army by Navarro Research and Engineering, Inc. Available at:<br />
https://www.rma.army.mil/Portals/32/May%202021%20updates/Draft%20Fifth%20FYRR%20Rev.%20E<br />
%20(Part%201%20-%20Text).pdf?ver=2D7DRXN7FqZdRnmRVNFSiQ%3d%3d. Accessed July 2021.<br />
Page 23<br />
301
Appendix C. Resolutions <strong>for</strong><br />
Consideration<br />
RESOLUTION ESTABLISHING A STANDING ENVIRONMENTAL POLICY<br />
ADVISORY COMMITTEE<br />
NO. 2023-XX<br />
WHEREAS, the <strong>City</strong> of <strong>Commerce</strong> <strong>City</strong> (“<strong>City</strong>”), by and through the <strong>City</strong> Council of the<br />
<strong>City</strong> of <strong>Commerce</strong> <strong>City</strong> (“<strong>City</strong> Council”), on June 7, 2021, approved and adopted Resolution 2021-<br />
38, establishing the Environmental Policy Advisory Committee (“EPAC”);<br />
WHEREAS, EPAC was created as an advisory committee with limited duration to enhance<br />
the ef<strong>for</strong>ts of community organizations and grassroots movements in furthering environmental<br />
justice, elevating the voices of historically disengaged community members, and providing policy<br />
design reflective of the concerns, needs, and desires of the community;<br />
WHEREAS, EPAC was charged with providing recommendations to <strong>City</strong> Council to<br />
improve environmental quality outcomes across a broad spectrum of environmental concerns and<br />
issues;<br />
WHEREAS, EPAC has held community meetings, training sessions and a Business<br />
Outreach meeting to solicit feedback and additional sustainability strategies;<br />
WHEREAS, since its inception the EPAC has developed 124 strategies, prioritized<br />
recommendations, and produced measureable goals to further environmental restoration and<br />
protection to enhance community health and economic development, all summarized in the EPAC<br />
<strong>Action</strong> <strong>Plan</strong> <strong>for</strong> <strong>Sustainability</strong>, to be presented to <strong>City</strong> Council on January 9, 2023;<br />
WHEREAS, in recognition of the progress made by EPAC and the value it has contributed<br />
to <strong>Commerce</strong> <strong>City</strong> and the <strong>City</strong> Council, the <strong>City</strong> Council has resolved to make it a standing<br />
committee so that the <strong>City</strong> may continue to receive the contributions and added value of EPAC<br />
ef<strong>for</strong>ts; and<br />
WHEREAS, pursuant to Section 11.1 of the <strong>City</strong> Charter, the <strong>City</strong> Council is authorized to<br />
create advisory commissions and appoint members to such commissions as set <strong>for</strong>th in the Charter,<br />
the <strong>Commerce</strong> <strong>City</strong> Revised Municipal Code, and the <strong>City</strong> of <strong>Commerce</strong> <strong>City</strong> Council Policies.<br />
NOW, THEREFORE, BE IT RESOLVED BY THE CITY COUNCIL OF THE CITY OF<br />
COMMERCE CITY, COLORADO, AS FOLLOWS:<br />
SECTION 1. Findings. The recitals to this resolution are incorporated as findings of the<br />
<strong>City</strong> Council. This resolution is found to be necessary <strong>for</strong> the preservation of the public health,<br />
safety, and welfare and in the public interest.<br />
1. Committee Established. An advisory committee known as the <strong>Commerce</strong> <strong>City</strong><br />
Environmental Policy Advisory Committee (“EPAC”) was established pursuant to Section 11.1 of<br />
the <strong>City</strong> Charter by Resolution 2021-38 on June 7, 2021. The duties of EPAC, described below,<br />
previously scheduled to be completed by the end of December 2022, are hereby extended<br />
indefinitely, and EPAC shall now be a permanent committee, <strong>for</strong> as long as the <strong>City</strong> Council deems<br />
appropriate;<br />
302
RESOLUTION ESTABLISHING A STANDING ENVIRONMENTAL POLICY<br />
ADVISORY COMMITTEE<br />
NO. 2023-XX<br />
WHEREAS, the <strong>City</strong> of <strong>Commerce</strong> <strong>City</strong> (“<strong>City</strong>”), by and through the <strong>City</strong> Council of the<br />
<strong>City</strong> of <strong>Commerce</strong> <strong>City</strong> (“<strong>City</strong> Council”), on June 7, 2021, approved and adopted Resolution 2021-<br />
38, establishing the Environmental Policy Advisory Committee (“EPAC”);<br />
WHEREAS, EPAC was created as an advisory committee with limited duration to enhance<br />
the ef<strong>for</strong>ts of community organizations and grassroots movements in furthering environmental<br />
justice, elevating the voices of historically disengaged community members, and providing policy<br />
design reflective of the concerns, needs, and desires of the community;<br />
WHEREAS, EPAC was charged with providing recommendations to <strong>City</strong> Council to<br />
improve environmental quality outcomes across a broad spectrum of environmental concerns and<br />
issues;<br />
WHEREAS, EPAC has held community meetings, training sessions and a Business<br />
Outreach meeting to solicit feedback and additional sustainability strategies;<br />
WHEREAS, since its inception the EPAC has developed 124 strategies, prioritized<br />
recommendations, and produced measureable goals to further environmental restoration and<br />
protection to enhance community health and economic development, all summarized in the EPAC<br />
<strong>Action</strong> <strong>Plan</strong> <strong>for</strong> <strong>Sustainability</strong>, to be presented to <strong>City</strong> Council on January 9, 2023;<br />
WHEREAS, in recognition of the progress made by EPAC and the value it has contributed<br />
to <strong>Commerce</strong> <strong>City</strong> and the <strong>City</strong> Council, the <strong>City</strong> Council has resolved to make it a standing<br />
committee so that the <strong>City</strong> may continue to receive the contributions and added value of EPAC<br />
ef<strong>for</strong>ts; and<br />
WHEREAS, pursuant to Section 11.1 of the <strong>City</strong> Charter, the <strong>City</strong> Council is authorized to<br />
create advisory commissions and appoint members to such commissions as set <strong>for</strong>th in the Charter,<br />
the <strong>Commerce</strong> <strong>City</strong> Revised Municipal Code, and the <strong>City</strong> of <strong>Commerce</strong> <strong>City</strong> Council Policies.<br />
NOW, THEREFORE, BE IT RESOLVED BY THE CITY COUNCIL OF THE CITY OF<br />
COMMERCE CITY, COLORADO, AS FOLLOWS:<br />
SECTION 1. Findings. The recitals to this resolution are incorporated as findings of the<br />
<strong>City</strong> Council. This resolution is found to be necessary <strong>for</strong> the preservation of the public health,<br />
safety, and welfare and in the public interest.<br />
1. Committee Established. An advisory committee known as the <strong>Commerce</strong> <strong>City</strong><br />
Environmental Policy Advisory Committee (“EPAC”) was established pursuant to Section 11.1 of<br />
the <strong>City</strong> Charter by Resolution 2021-38 on June 7, 2021. The duties of EPAC, described below,<br />
previously scheduled to be completed by the end of December 2022, are hereby extended<br />
indefinitely, and EPAC shall now be a permanent committee, <strong>for</strong> as long as the <strong>City</strong> Council deems<br />
appropriate;<br />
303
RESOLUTION ESTABLISHING A STANDING ENVIRONMENTAL POLICY<br />
ADVISORY COMMITTEE<br />
NO. 2023-XX<br />
WHEREAS, the <strong>City</strong> of <strong>Commerce</strong> <strong>City</strong> (“<strong>City</strong>”), by and through the <strong>City</strong> Council of the<br />
<strong>City</strong> of <strong>Commerce</strong> <strong>City</strong> (“<strong>City</strong> Council”), on June 7, 2021, approved and adopted Resolution 2021-<br />
38, establishing the Environmental Policy Advisory Committee (“EPAC”);<br />
WHEREAS, EPAC was created as an advisory committee with limited duration to enhance<br />
the ef<strong>for</strong>ts of community organizations and grassroots movements in furthering environmental<br />
justice, elevating the voices of historically disengaged community members, and providing policy<br />
design reflective of the concerns, needs, and desires of the community;<br />
WHEREAS, EPAC was charged with providing recommendations to <strong>City</strong> Council to<br />
improve environmental quality outcomes across a broad spectrum of environmental concerns and<br />
issues;<br />
WHEREAS, EPAC has held community meetings, training sessions and a Business<br />
Outreach meeting to solicit feedback and additional sustainability strategies;<br />
WHEREAS, since its inception the EPAC has developed 124 strategies, prioritized<br />
recommendations, and produced measureable goals to further environmental restoration and<br />
protection to enhance community health and economic development, all summarized in the EPAC<br />
<strong>Action</strong> <strong>Plan</strong> <strong>for</strong> <strong>Sustainability</strong>, to be presented to <strong>City</strong> Council on January 9, 2023;<br />
WHEREAS, in recognition of the progress made by EPAC and the value it has contributed<br />
to <strong>Commerce</strong> <strong>City</strong> and the <strong>City</strong> Council, the <strong>City</strong> Council has resolved to make it a standing<br />
committee so that the <strong>City</strong> may continue to receive the contributions and added value of EPAC<br />
ef<strong>for</strong>ts; and<br />
WHEREAS, pursuant to Section 11.1 of the <strong>City</strong> Charter, the <strong>City</strong> Council is authorized to<br />
create advisory commissions and appoint members to such commissions as set <strong>for</strong>th in the Charter,<br />
the <strong>Commerce</strong> <strong>City</strong> Revised Municipal Code, and the <strong>City</strong> of <strong>Commerce</strong> <strong>City</strong> Council Policies.<br />
NOW, THEREFORE, BE IT RESOLVED BY THE CITY COUNCIL OF THE CITY OF<br />
COMMERCE CITY, COLORADO, AS FOLLOWS:<br />
SECTION 1. Findings. The recitals to this resolution are incorporated as findings of the<br />
<strong>City</strong> Council. This resolution is found to be necessary <strong>for</strong> the preservation of the public health,<br />
safety, and welfare and in the public interest.<br />
1. Committee Established. An advisory committee known as the <strong>Commerce</strong> <strong>City</strong><br />
Environmental Policy Advisory Committee (“EPAC”) was established pursuant to Section 11.1 of<br />
the <strong>City</strong> Charter by Resolution 2021-38 on June 7, 2021. The duties of EPAC, described below,<br />
previously scheduled to be completed by the end of December 2022, are hereby extended<br />
indefinitely, and EPAC shall now be a permanent committee, <strong>for</strong> as long as the <strong>City</strong> Council deems<br />
appropriate;<br />
304
Appendix C. Resolutions <strong>for</strong><br />
Consideration<br />
RESOLUTION ESTABLISHING MEASUREABLE SUSTAINABILILTY GOALS<br />
NO. 2023-XX<br />
WHEREAS, the <strong>City</strong> of <strong>Commerce</strong> <strong>City</strong> (“<strong>City</strong>”), by and through the <strong>City</strong> Council of the <strong>City</strong> of<br />
<strong>Commerce</strong> <strong>City</strong> (“<strong>City</strong> Council”), on June 7, 2021, approved and adopted Resolution 2021-38, establishing the<br />
Environmental Policy Advisory Committee (“EPAC”);<br />
WHEREAS, EPAC was charged with providing recommendations to <strong>City</strong> Council to improve<br />
environmental quality outcomes across a broad spectrum of environmental concerns and issues that include some<br />
voluntary and mandatory actions in the <strong>for</strong>m of resolutions; ordinances and measurable reduction and restoration<br />
goals;<br />
WHEREAS, EPAC has held community meetings, training sessions and a Business Outreach meeting to<br />
solicit feedback regarding the sustainability strategies;<br />
WHEREAS, in order to measure and track, EPAC recommends setting the following goals:<br />
• Energy use reduction by 25% by 2030;<br />
• Increase percentage of renewable by 10% each year;<br />
• Rooftop and community solar are utilized by 40% of households and commercial buildings by<br />
2050;<br />
• Electrification is adopted by 15% of all buildings;<br />
• 30% of light-duty vehicles are EVs by 2030;<br />
• Idling time is reduced by 78%;<br />
• Waste diversion increases to 85% by 2050;<br />
• There is a 20% mode shift by 2030 and a 50% mode shift by 2050 towards greater use of transit,<br />
bikes, walking, and other modes;<br />
• Tree canopy is increased to 20% by 2030; and<br />
• Reduction of carbon pollution by 50% by 2030 and 90% by 2050.<br />
NOW, THEREFORE, BE IT RESOLVED BY THE CITY COUNCIL OF THE CITY OF COMMERCE<br />
CITY, COLORADO, AS FOLLOWS:<br />
SECTION 1. Findings. The recitals to this resolution are incorporated as findings of the <strong>City</strong> Council.<br />
This resolution is found to be necessary <strong>for</strong> the preservation of the public health, safety, and welfare and in the<br />
public interest.<br />
SECTION 2. Repealer. All other resolutions or portions thereof inconsistent or conflicting with this<br />
resolution or any portion hereof are hereby repealed to the extent of such inconsistency.<br />
SECTION 3. Effective Date. This Resolution shall be effective immediately upon passage.<br />
RESOLVED AND PASSED THIS 23rd DAY OF FEBRUARY 2023<br />
ATTEST<br />
________________________________<br />
Dylan A. Gibson, <strong>City</strong> Clerk<br />
CITY OF COMMERCE CITY, COLORADO<br />
_________________________________<br />
Benjamin A. Huseman, Mayor<br />
305
Appendix C. Resolutions <strong>for</strong><br />
Consideration<br />
RESOLUTION ESTABLISHING COMMERCE CITY AS A EV GO CITY AND<br />
PLEDGING TO IMPLEMENT STRATEGIES TO REDUCE<br />
TRANSPORTATION –RELATED EMISSIONS<br />
NO. 2023-XX<br />
WHEREAS, the transportation sector is a contributing factor to air pollution and climate change,<br />
threatening the health and well-being of our residents; and<br />
WHEREAS, the Denver metropolitan area, including <strong>Commerce</strong> <strong>City</strong>, is in violation (non-attainment) of<br />
federal health-based standards <strong>for</strong> ground-level ozone pollution; and<br />
WHEREAS, the transportation sector needs support to move toward adoption of clean energy technology<br />
with zero-emission vehicles (ZEVs), which include battery-electric vehicles (BEVs), plug-in hybrid<br />
electric vehicles (PHEVs), and hydrogen fuel cell vehicles, that reduce our dependence on <strong>for</strong>eign fuels<br />
and support a healthy environment and economy; and<br />
WHEREAS, <strong>Commerce</strong> <strong>City</strong> will not be able to meet its goals <strong>for</strong> reductions in transportation<br />
emissions without a thoughtful ef<strong>for</strong>t to electrify the transportation sector; and<br />
WHEREAS, <strong>Commerce</strong> <strong>City</strong> is dedicated to being a leader in the use of clean energy, establishing policies<br />
and programs that conserve energy, promote sustainability, and support Colorado’s goal of nearly one<br />
million EVs on the road by 2030; and<br />
SECTION 1. Findings. The recitals to this resolution are incorporated as findings of the<br />
<strong>City</strong> Council. This resolution is found to be necessary <strong>for</strong> the preservation of the public health,<br />
safety, and welfare and in the public interest.<br />
SECTION 2. <strong>Commerce</strong> <strong>City</strong> is a EVGO <strong>City</strong> and pledges to develop and implement policies<br />
and strategies to meet the following transportation electrification goals and priorities:<br />
A) <strong>Commerce</strong> <strong>City</strong> will establish a “ZEV First” procurement policy to ensure that all new light<br />
duty vehicles purchased by the <strong>City</strong> Fleet are electric vehicles when the technology accommodates<br />
the needs of the vehicle use and departmental budgets can accommodate both vehicle acquisition<br />
and the associated charging infrastructure. The <strong>City</strong> will include the total cost of vehicle<br />
ownership, including fuel and maintenance costs, and the social cost of carbon in its vehicle<br />
procurement calculations.<br />
B) <strong>Commerce</strong> <strong>City</strong> will transition its municipal fleet to medium- and heavy-duty zero-emission<br />
vehicles and off-road equipment as these vehicles become available and cost competitive in<br />
Colorado.<br />
C) <strong>Commerce</strong> <strong>City</strong> will support the electric vehicle charging station infrastructure needed to<br />
accommodate the transition of fleet and privately-owned vehicles.<br />
D) <strong>Commerce</strong> <strong>City</strong> will implement community and resident-focused programs, policies,<br />
incentives, and infrastructure to support transition of 30% of all vehicles registered within the <strong>City</strong><br />
to zero-emissions by 2030, and near-100% of all vehicles by 2050.<br />
E) <strong>Commerce</strong> <strong>City</strong> will advocate that public transit providers (including, but not limited to the<br />
Regional Transportation District (RTD) and the Adams County School District) transition all of<br />
their vehicles within C3 to electric or zero-emission vehicles by 2035.<br />
306
F) <strong>Commerce</strong> <strong>City</strong> will encourage shared fleets operating within the <strong>City</strong> such as taxis, Uber and<br />
Lyft, and carshare companies to transition all shared fleet vehicles to full electric or zero-emission<br />
fleets by 2040.<br />
G) <strong>Commerce</strong> <strong>City</strong> will develop partnerships with micro-mobility companies to promote the use of<br />
electric assisted bicycles.<br />
H) <strong>Commerce</strong> <strong>City</strong> will work across <strong>City</strong> departments, with residents, businesses, developers and<br />
partners throughout the region and state to create an inclusive, low carbon, and healthy<br />
community.<br />
NOW, THEREFORE, BE IT RESOLVED BY THE CITY COUNCIL OF THE CITY OF<br />
COMMERCE CITY, COLORADO, AS FOLLOWS:<br />
RESOLVED AND PASSED THIS _____TH DAY OF FEB. 2023.<br />
CITY OF COMMERCE CITY, COLORADO<br />
ATTEST<br />
Benjamin A. Huseman, Mayor<br />
Dylan A. Gibson, <strong>City</strong> Clerk<br />
307
Appendix C. Resolutions <strong>for</strong><br />
Consideration<br />
RESOLUTION ESTABLISHING LOW IMPACT DEVELOPMENT<br />
NO. 2023-XX<br />
WHEREAS, on August 16, 2021, the <strong>City</strong> Council adopted a set of technical criteria<br />
governing the design and per<strong>for</strong>mance of storm water improvements and related practices,<br />
referred to as the "Storm Drainage Design and Technical Criteria Manual (herein referred<br />
to as Drainage Manual"; and<br />
WHEREAS, the Drainage Manual consists of certain portions of the Mile High Flood<br />
District Criteria Manual (MHFD), a locally applied and referenced set of storm waterrelated<br />
standards adopted by reference, and a separately codified set of guidelines outlined<br />
in the Low Impact Development Guidance document customizing the standards, policies,<br />
and practices <strong>for</strong> use in <strong>Commerce</strong> <strong>City</strong>; and<br />
WHEREAS, the Drainage Manual, including the separately codified <strong>Commerce</strong> <strong>City</strong>'<br />
Amendments, has been modified from time to time by limited technical revisions adopted<br />
administratively by the Public Works Director and filed with the <strong>City</strong> Clerk; and<br />
WHEREAS, the <strong>City</strong> is a Municipal Separate Storm Sewer System (MS4) “permittee”;<br />
and<br />
WHEREAS, the <strong>City</strong> is committed to a storm water management program that protects<br />
water quality and water supply by employing watershed-based approaches that balance<br />
environmental and economic considerations; and<br />
WHEREAS, urbanization and a long history of industrial activities has led to increased<br />
impervious surface areas, resulting in increased contaminated water runoff and less<br />
percolation to groundwater aquifers, causing the transport of pollutants to receiving waters;<br />
and<br />
WHEREAS one element of the integrated, sustainable storm water management system<br />
established under the Drainage Manual is the use of low impact development ("LID")<br />
criteria to require and encourage more distributed and landscaping-based storm water<br />
runoff management and control, relying on filtration and infiltration to treat and manage<br />
storm water runoff; and<br />
WHEREAS staff has recommended that the LID criteria set <strong>for</strong>th in the Low Impact<br />
Development Guidance document be included in the approved Drainage Manual and amended<br />
LDC Article VII. Development and Design Standards Sec. 21-7511 Water Conservation<br />
Requirements; Sec. 21-7530 Detention/Retention Areas; and Sec. 21-7532 to clarify the Low<br />
Impact Development Criteria set <strong>for</strong>th therein; and Drainage Manual Chapters 1.0, 2.0,<br />
3.0, 14.0, and newly-created Appendix A<br />
WHEREAS the <strong>City</strong>'s <strong>Sustainability</strong> Initiatives Committee considered staff’s<br />
recommendation at the meeting on August 25, 2022 and voted to recommend <strong>City</strong> Council<br />
adopt such amendments to the LID criteria in the Drainage Manual; and<br />
308
WHEREAS, Council has determined that the adoption and implementation of this<br />
Ordinance will facilitate the holistic and integrated management of storm water in<br />
<strong>Commerce</strong> <strong>City</strong>.<br />
\<br />
NOW, THEREFORE, BE IT RESOLVED BY THE CITY COUNCIL OF THE CITY OF<br />
COMMERCE CITY, COLORADO, AS FOLLOWS:<br />
SECTION 1. Findings. The recitals to this resolution are incorporated as findings of the<br />
<strong>City</strong> Council. This resolution is found to be necessary <strong>for</strong> the preservation of the public health,<br />
safety, and welfare and in the public interest.<br />
SECTION 2. Repealer. All other resolutions or portions thereof inconsistent or<br />
conflicting with this resolution or any portion hereof are hereby repealed to the extent of such<br />
inconsistency. Furthermore, Article VII, Section Division 5 Landscaping, Sec 21-7530 – Sec -<br />
7532 of the <strong>Commerce</strong> <strong>City</strong> LDC and Drainage Manual is hereby amended to read as<br />
follows:<br />
Low Impact Development Criteria<br />
Once the WQCV has been calculated in accordance with the specifications provided<br />
in Chapter 14 of the Drainage Manual, the total WQCV must be treated by one or<br />
more of the methods outlined in the Low Impact Development Guidance Manual. In<br />
addition, the requirements set <strong>for</strong>th below in this Section, referred to as Low Impact<br />
Development (LID) Criteria, must be met. For the purposes of this Section, the LID<br />
methods and techniques described in the Drainage Manual, together with any<br />
methods or techniques determined by the Public Works Director to be functionally<br />
equivalent, shall, be considered LID techniques.<br />
The LID Criteria are as follows:<br />
(a)<br />
No less than seventy five percent (75%) of total disturbed project<br />
area <strong>for</strong> which a grading permit is required under <strong>City</strong> codes and<br />
regulations must be treated using one or a combination of LID<br />
techniques on new developments, redevelopment; or<br />
(b)<br />
(c)<br />
If, in the judgment of the <strong>City</strong> Engineer, one or more requirements<br />
of this Section cannot be met due to site engineering constraints,<br />
then a design alternative will be allowed, provided that the design<br />
results in equal or better storm water quality than by compliance<br />
with the otherwise applicable requirement.<br />
The provisions of this Ordinance establish requirements <strong>for</strong><br />
construction activities and facility operations of Development and<br />
Redevelopment projects to comply with the current MS4 Permit,<br />
lessen the water quality impacts of development by using smart<br />
I<br />
growth practices, and integrate LID practices and standards <strong>for</strong> storm<br />
309
water pollution mitigation through means of infiltration,<br />
evapotranspiration, biofiltration, and rainfall harvest and use. LID<br />
shall be inclusive of new development or redevelopment<br />
requirements.<br />
(d)<br />
This Ordinance authorizes the <strong>City</strong> to further define and adopt storm<br />
I<br />
water control measures, and to develop LID principles and<br />
requirements, including, but not limited to the objectives and<br />
specifications <strong>for</strong> integration of LID strategies. Except as otherwise<br />
provided herein, the <strong>City</strong> shall administer, implement and en<strong>for</strong>ce the<br />
provisions of this Ordinance.<br />
SECTION 3. Effective Date. This Resolution shall be effective immediately upon<br />
passage.<br />
RESOLVED AND PASSED THIS 13 TH DAY OF FEBRUARY 2023<br />
CITY OF COMMERCE CITY, COLORADO<br />
_________________________________<br />
Benjamin A. Huseman, Mayor<br />
ATTEST<br />
________________________________<br />
Dylan A. Gibson, <strong>City</strong> Clerk<br />
310
Appendix C. Resolutions <strong>for</strong><br />
Consideration<br />
AN ORDINANCE AMENDING THE CITY OF COMMERCE CITY MUNICIPAL<br />
CODE, CHAPTER 11: VEHICLES AND TRAFFIC<br />
CITY OF COMMERCE CITY 2023 – XX<br />
The following findings describe the intent and purpose of this ordinance:<br />
WHEREAS, the <strong>City</strong> Council ("Council") adopted the Municipal Code<br />
("Code") and especially Chapter 11, also known as "Vehicles and Traffic" in an<br />
ef<strong>for</strong>t to promote safe use of all <strong>City</strong> streets and vehicles within the <strong>City</strong> limits;<br />
and<br />
WHEREAS, the <strong>City</strong> has noticed that there is a need to amend the Code in<br />
order to clarify existing uses or prohibit activities that may be deemed unsafe<br />
and contribute to poor health; and<br />
WHEREAS, the increase in vehicle traffic and idling is negatively impacting<br />
air quality (i.e., SOx, NOx and VOCs) and exacerbating the severity and<br />
number of allergies and asthma attacks, and other health conditions; and<br />
WHEREAS, the two air pollutants that cause the most problems in Colorado<br />
are ground level ozone and PM2.5. African Americans are exposed to 64<br />
percent higher PM2.5 concentrations from on-road transportation than the<br />
average PM2.5 exposure <strong>for</strong> all Coloradans. Asian Americans and Latinos<br />
experience concentrations 24 percent and 15 percent higher, respectively, than<br />
the average resident. At the same time, white residents have an average<br />
exposure that is 9 percent lower than the average <strong>for</strong> the state. i<br />
WHEREAS, exposure to PM2.5 is the largest environmental risk factor in the<br />
United States, responsible <strong>for</strong> 63 percent of deaths from environmental causes.<br />
WHEREAS, communities in South <strong>Commerce</strong> <strong>City</strong> are exposed to a<br />
confluence of impacts from multiple emission sources in addition to the<br />
refinery, such as multiple interstate highways, the Cherokee Generating <strong>Plan</strong>t,<br />
the Robert W Hite Treatment Facility, and a variety of other industrial land<br />
uses, a condition not otherwise seen in the Denver Metro Area, or the State of<br />
Colorado, at such a scale, density, or intensity. Transportation related<br />
emissions are significant with the annual average daily vehicle miles travelled<br />
(“VMT”) on I-270 within <strong>City</strong> limits at 521,309; the annual average daily<br />
VMT at SH-265 is 15,363; and the annual average daily VMT on I-76 from<br />
the intersection with I- 270 and ending at the junction with SH 470 at 621,462<br />
(CDOT 2021).<br />
WHEREAS, the Colorado Air Pollution Control Division has observed that the<br />
unnecessary idling or cars, trucks and buses affects the quality of air we<br />
breathe both at the point of idling (often most concentrated in front of schools<br />
and homes), and regionally due to pollutants released into the atmosphere;<br />
and<br />
311
WHEREAS, in addition to health impacts, air pollution imposes significant<br />
economic costs and negative impacts on our quality of life; and<br />
WHEREAS, vehicle exhaust is a source of carbon monoxide, particulate<br />
matter, toxic air contaminants, and greenhouse gases; and<br />
WHEREAS, the <strong>City</strong> has received noise complaints from residents due to<br />
commercial trucks and recreational vehicles parking <strong>for</strong> hours on public<br />
streets while running or idling; and<br />
WHEREAS, the <strong>City</strong> of <strong>Commerce</strong> <strong>City</strong> has found that unattended idling vehicles attract<br />
vehicle theft and pose a public safety hazard to pedestrians and motorists on public rights-ofway;<br />
WHEREAS, <strong>City</strong> of <strong>Commerce</strong> <strong>City</strong> should play an important role in<br />
improving air quality by limiting the amount of time engines in <strong>City</strong>-owned<br />
vehicles are allowed to idle and thereby will led the ef<strong>for</strong>t to improve air<br />
quality; and<br />
WHEREAS, according to the Environmental Protection Agency, fuel costs<br />
alone from engine idling are enormous, as car engines use over a gallon of fuel<br />
<strong>for</strong> each hour they idle. In addition, according to the U.S. Department of<br />
Energy, more than 3 billion gallons of fuel are used every year fueling idling<br />
engines.<br />
NOW, THEREFORE, BE IT ORDAINED BY THE CITY COUNCIL OF THE CITY<br />
OF COMMERCE CITY, COLORADO, AS FOLLOWS:<br />
SECTION 1. Findings. The recitals to this ordinance are incorporated as findings of<br />
the <strong>City</strong> Council. This ordinance is found to be necessary <strong>for</strong> the preservation of the public<br />
health, safety, and welfare and in the public interest.<br />
312
SECTION 2: CHAPTER 11 – MOTOR VEHICLES AND TRAFFIC shall be<br />
amended as follows:<br />
Article II. – Miscellaneous Provisions specifically Section 11-2100 and 11-2106 as<br />
follows:<br />
Unlawful Idling or Camping<br />
A. Definitions. As used in this section:<br />
1. "Block" means the distance on both sides of a street between two (2)<br />
intersecting streets.<br />
2. "Commercial vehicle" means a motor vehicle in excess of one-ton<br />
capacity of whatever make or type designed <strong>for</strong> or adapted to<br />
commercial or agricultural purposes, regardless of the use to which<br />
such vehicle is put at any particular time. The term "commercial<br />
vehicle" includes, without limitation, all so- called "semi" truck<br />
tractors and "semi" truck-trailers, as well as motorized equipment,<br />
such as loaders, backhoes, excavators, or the like.<br />
3. "Idling:" means running an engine on a motor vehicle while parked.<br />
4. "Public Street" means any right of way owned by the<br />
<strong>Commerce</strong> <strong>City</strong>, Adams County or Colorado Department of<br />
Transportation (CDOT) within the city limits of the <strong>City</strong> of<br />
<strong>Commerce</strong> <strong>City</strong>. This includes roads, streets and alleys.<br />
5. "Running" means any vehicle, as defined in this section,<br />
parked with a motor-powered generator or refrigeration unit<br />
in operation.<br />
6. "Trailer" means any truck trailer or other trailer designed or adapted<br />
313
primarily <strong>for</strong> the transportation of materials, debris, or property of<br />
whatever kind, including, without limitation, boats, personal<br />
watercraft, snowmobiles, all- terrain vehicles, or motorcycles,<br />
whether occupied or empty.<br />
7. "Travel trailer," "camping trailer," or "fifth wheel trailer" means a<br />
portable vehicle without motive power, whether occupied or empty,<br />
designed as a temporary dwelling <strong>for</strong> travel, recreational or vacation<br />
use that does not require a special highway movement permit when<br />
drawn by a self-propelled motor vehicle.<br />
B. Idling or Running Prohibited. It is unlawful <strong>for</strong> any person to park or to<br />
cause to park or leave standing, idling, or running any motor vehicle<br />
commercial vehicle, or recreational vehicle as defined in this section on any<br />
public road, street, alley or municipal property <strong>for</strong> a period of time in<br />
excess of twenty (20) minutes. Any vehicle parked or left standing in<br />
violation of this subsection may be impounded or removed by any certified<br />
peace officer or other designated official, and the owner may be fined as<br />
provided in this chapter, except <strong>for</strong> the following kinds of idling:<br />
1. Idling while stopped:<br />
a. For an official traffic control;<br />
b. For an official traffic control signal;<br />
c. At the direction of a police officer.<br />
2. Idling as needed to operate heaters or air conditioners where the<br />
temperature is below zero degrees Fahrenheit (0°F) or above ninety<br />
degrees Fahrenheit (90°F) as determined by the National Weather<br />
Service, <strong>for</strong> the health or safety of a driver or passenger, including<br />
service animals and pets.<br />
3. Idling as needed <strong>for</strong> emergency vehicles to operate equipment.<br />
4. Idling as needed to ascertain that a vehicle is in safe operating<br />
condition and equipped as required by all provisions of law, and that all<br />
equipment is in good working order, either as part of the daily vehicle<br />
inspection, or as otherwise needed.<br />
5. Idling as needed <strong>for</strong> testing, servicing, repairing, installation,<br />
maintenance or diagnostic purposes.<br />
6. Idling <strong>for</strong> the period recommended by the manufacturer to warm<br />
up or cool down a turbocharged heavy duty vehicle.<br />
7. Idling as needed to operate auxiliary equipment <strong>for</strong> which the vehicle<br />
was primarily designed or equipped, other than transporting goods,<br />
such as: operating a transportation refrigeration unit (TRU), lift, crane,<br />
pump, or drill.<br />
314
8. Idling as needed to operate a lift or other piece of equipment<br />
designed to ensure safe loading and uploading of goods or people.<br />
9. Idling to recharge a battery or other energy storage unit of a hybrid<br />
electric vehicle.<br />
10. Idling as needed <strong>for</strong> vehicles that house K-9 or other service<br />
animals.<br />
11. Idling by on duty police officers as necessary <strong>for</strong> the per<strong>for</strong>mance<br />
of their official duties.<br />
C. Camping Prohibited. It is unlawful to park any motor vehicle, commercial<br />
vehicle, or recreational vehicle on a public road, street, alley, or private<br />
property, <strong>for</strong> purposes of human habitation or overnight camping. Any<br />
vehicle parked or left standing in violation of this subsection <strong>for</strong> a period<br />
exceeding four consecutive hours may be impounded or removed by a<br />
peace officer or other designated official, and the owner may be fined as<br />
provided in this chapter.<br />
1. Vehicles moved from a parking spot and then re-parked on the same<br />
block, as defined in this section, within twenty four (24) hours from<br />
the time of removal shall be deemed to have been continuously<br />
parked <strong>for</strong> the purposes of this subsection.<br />
D. Impoundment. For purposes of impoundment and removal, a certified<br />
peace officer, or other designated official, may, after placing a visible<br />
notification on the vehicle and making a reasonable ef<strong>for</strong>t to locate the<br />
owner, impound and remove any motor vehicle which has been unmoved<br />
<strong>for</strong> four consecutive hours. The cost of impoundment and removal shall be<br />
charged to the owner or any person who claims the impounded motor<br />
vehicle.<br />
E. Ownership. The presence of any motor vehicle, commercial vehicle, or<br />
recreational vehicle when parked in violation of this section is prima facie<br />
evidence that the registered owner or lessee of such vehicle parked the<br />
same, or that the driver was acting as the agent of the owner or lessee.<br />
F. Relocation. No motor vehicle, commercial vehicle, or recreational vehicle<br />
that has been the subject of a violation of this section shall be subsequently<br />
relocated or parked on the same block where the violation occurred <strong>for</strong> a<br />
period of one hundred eighty days from the date of violation, while idling.<br />
Relocation or parking of the vehicle in violation of this subsection shall be<br />
a separate violation.<br />
G. Continuing Violations. In the case of a continuing violation under this<br />
section, each day of violation shall be deemed a separate offense.<br />
315
H. Conflicting Ordinances. This section shall control and take precedence<br />
over any conflicting provisions in this code concerning parking or storage<br />
of vehicles. (Sec. 11-2105 and Article III, Sec. 11-41)<br />
Editor's note: Ord. No. 2315 §2 (Exh. A), 1-4-21; Ord. No. 2318, §2 (Exh. A), 3-1-21<br />
SECTION 3. Repealer. All other ordinances or portions thereof inconsistent or<br />
conflicting with this ordinance or any portion hereof are hereby repealed to the extent<br />
of such inconsistency.<br />
SECTION 4. Effective Date. This ordinance shall be effective immediately upon<br />
passage on second and final reading.<br />
RESOLVED AND PASSED THIS 27 TH DAY OF FEBUARY, 2023.<br />
CITY OF COMMERCE CITY, COLORADO<br />
ATTEST<br />
Benjamin A. Huseman, Mayor<br />
Dylan A. Gibson, <strong>City</strong> Clerk<br />
316
Appendix C. Resolutions <strong>for</strong><br />
Consideration<br />
CARDBOARD ORDINANCE AMENDING THE CODE OF THE CITY OF COMMERCE<br />
CITY TO PROHIBIT THE DISPOSAL OF CARDBOARD IN THE COMMUNITY'S<br />
WASTE STREAM AND TO AMEND REQUIREMENTS FOR RECYCLING<br />
APPLICABLE SOLID WASTE COLLECTION<br />
ORDINANCE NO. 2023-XX<br />
WHEREAS, the <strong>City</strong> of <strong>Commerce</strong> <strong>City</strong> (“<strong>City</strong>) created the Environmental Policy Advisory<br />
Committee (EPAC) in 2021. EPAC was charged with providing recommendations to <strong>City</strong> Council<br />
to improve environmental quality outcomes across a broad spectrum of environmental concerns and<br />
issues;<br />
WHEREAS, EPAC recommends increasing waste diversion rates through amending the<br />
<strong>City</strong>’s solid waste requirements set in Chapter 6, Article II of the <strong>City</strong> Code’<br />
WHEREAS, the disposal of 10,056 tons/year of cardboard material from <strong>Commerce</strong><br />
<strong>City</strong>’s' waste stream contributes an estimated 72, 656 tons of carbon dioxide equivalents, a<br />
damaging greenhouse gas, to the earth's atmosphere;<br />
WHEREAS, the monetary value of 10,056 tons/year of cardboard that is sent to landfills<br />
<strong>for</strong> disposal from the community is currently worth $583,248 in commodity markets; and<br />
WHEREAS, the number of jobs in the recycling industry that it takes to process<br />
cardboard is calculated to be ten times as great as the number of jobs that it takes to bury cardboard<br />
in landfills, so that recycling results in economic benefit and greater revenue <strong>for</strong> communities,<br />
including <strong>Commerce</strong> <strong>City</strong>; and '<br />
WHEREAS, in addition to lost commodity rebates and fewer jobs, the landfill disposal of<br />
10,056 tons/year of cardboard costs $1,500,000 in current landfill gate fees; and<br />
WHEREAS, the disposal of 10,056 tons/ year of cardboard in landfills that could otherwise<br />
be recycled reduces the lifespan of local landfills, including the Tower landfill;<br />
WHEREAS, the solid waste in <strong>Commerce</strong> <strong>City</strong> accounts <strong>for</strong> 4% of greenhouse gas<br />
emissions;<br />
WHEREAS, residential customers of trash hauling companies who live in single-family<br />
homes or in multi-family complexes of fewer than eight units are able to receive curbside<br />
cardboard recycling services at no additional cost on their trash bills; and<br />
WHEREAS, all businesses and residential generators of waste cardboard may take<br />
cardboard to be recycled at no cost at the <strong>City</strong>'s recycling drop-off facility; and<br />
WHEREAS, in addition to the licensure provisions <strong>for</strong> solid waste haulers, Article II of<br />
Chapter 6 - 2003 of the <strong>City</strong> Code also addresses generally the collection and disposal of solid<br />
waste, currently referred to in those provisions as "garbage and trash"; and<br />
317
NOW, THEREFORE, BE IT RESOLVED BY THE CITY COUNCIL OF THE CITY OF<br />
COMMERCE CITY, COLORADO, AS FOLLOWS:<br />
SECTION 1. Findings. The recitals to this resolution are incorporated as findings of the<br />
<strong>City</strong> Council. This resolution is found to be necessary <strong>for</strong> the preservation of the public health,<br />
safety, and welfare and in the public interest.<br />
SECTION 2. Repealer. All other resolutions or portions thereof inconsistent or conflicting<br />
with this resolution or any portion hereof are hereby repealed to the extent of such inconsistency<br />
specifically that Section 6-2004 of the Code of the <strong>City</strong> of <strong>Commerce</strong> <strong>City</strong> is hereby amended by the<br />
addition of a new definition "Recyclable cardboard" which reads in its entirety as follows:<br />
Recyclable cardboard shall mean corrugated cardboard, and shall include, but not be limited<br />
to, materials used in packaging or storage containers that consist of three or more layers of<br />
Kraft paper material, at least one of which is rippled or corrugated. Cardboard shall be<br />
considered recyclable cardboard regardless of whether it has glue, staples or tape affixed,<br />
but not if it is permanently attached to other packing material or a non-paper liner, waxed<br />
cardboard, or cardboard contaminated with oil, paint, blood or other organic material.<br />
Required Recycling: No person shall place recyclable cardboard in refuse containers <strong>for</strong> collection,<br />
nor shall any person bury or otherwise dispose of recyclable cardboard in or on private or public<br />
property within the <strong>City</strong>. All recyclable cardboard must either be stored and presented or delivered<br />
to a licensed solid waste collector <strong>for</strong> recycling in accordance with the provisions of Section 6 -<br />
2004, or delivered directly to a qualified recycling facility appropriate <strong>for</strong> recyclable cardboard.<br />
It shall be the duty of any owner or occupant of any premises to ensure that bags or containers do not contain<br />
materials required to be recycled under this Section when such bags or containers are offered <strong>for</strong> solid waste<br />
collection.<br />
SECTION 3. Effective Date. This Resolution shall be effective immediately upon<br />
passage.<br />
RESOLVED AND PASSED THIS 23rd DAY OF FEBRUARY, 2023.<br />
CITY OF COMMERCE CITY, COLORADO<br />
_________________________________<br />
Benjamin A. Huseman, Mayor<br />
ATTEST<br />
________________________________<br />
Dylan A. Gibson, <strong>City</strong> Clerk<br />
318
Appendix C. Resolutions <strong>for</strong><br />
Consideration<br />
CONSTRUCTION AND DEMOLITION DEBRIS ORDINANCE AMENDING THE CODE OF THE<br />
CITY OF COMMERCE CITY TO PROHIBIT THE DISPOSAL OF CONSTRUCTION AND<br />
DEMOLITION IN THE COMMUNITY'S WASTE STREAM AND TO AMEND REQUIREMENTS<br />
FOR APPLICABLE SOLID WASTE COLLECTION<br />
ORDINANCE NO. 2023-XX<br />
WHEREAS, the <strong>City</strong> of <strong>Commerce</strong> <strong>City</strong> (“<strong>City</strong>) created the Environmental Policy Advisory Committee<br />
(EPAC) in 2021. EPAC was charged with providing recommendations to <strong>City</strong> Council to improve environmental<br />
quality outcomes across a broad spectrum of environmental concerns and issues;<br />
WHEREAS, EPAC recommends increasing waste diversion rates through amending the <strong>City</strong>’s solid<br />
waste requirements set in Chapter 6, Article II of the <strong>City</strong> Code’<br />
WHEREAS, The Construction and Demolition Ordinance applies to projects that fit the following<br />
criteria: 1. The new construction or full demolition of any residential or commercial buildings. 2. Any alteration<br />
(addition, tenant improvement) of a commercial building when the value of the project exceeds $200,000 or<br />
increases building size by 1,000 square feet.<br />
WHEREAS, According to the Disposal Facility-Based Characterization of Solid Waste Report<br />
construction and demolition (C&D) materials are estimated to account <strong>for</strong> between 21.7 to 25.5 percent of the<br />
disposed waste stream. i<br />
WHEREAS, The cement industry is a major producer of carbon dioxide, a potent greenhouse gas.<br />
Concrete damages the most fertile layer of soil, topsoil. Concrete is used to create hard surfaces that contribute<br />
to surface runoff that can cause soil erosion, water pollution and flooding. If the cement industry were a<br />
country, it would be the third largest emitter in the world, behind China and the United States. ii<br />
WHEREAS, Common C&D materials include lumber, drywall, metals, masonry (brick, concrete, etc.),<br />
carpet, plastic, pipe, rocks, dirt, paper, cardboard, or green waste related to land development. Many of these<br />
materials can be reused or recycled, thus prolonging our supply of natural resources and potentially saving<br />
money in the process.<br />
WHEREAS, the disposal of <strong>Commerce</strong> <strong>City</strong>’s' waste stream contributes an estimated 201,944 tons of<br />
carbon dioxide equivalents, a damaging greenhouse gas, to the earth's atmosphere;<br />
WHEREAS, the solid waste in <strong>Commerce</strong> <strong>City</strong> accounts <strong>for</strong> 4% of greenhouse gas emissions;<br />
WHEREAS, the number of jobs in the recycling industry at least three times the number of jobs that it<br />
takes to bury material in landfills, so that recycling results in economic benefit and greater revenue <strong>for</strong><br />
<strong>Commerce</strong> <strong>City</strong>; and<br />
'<br />
WHEREAS, in addition to lost commodity rebates and fewer jobs, the landfill disposal of in current<br />
landfill gate fees; and<br />
WHEREAS, the disposal of concrete and demolition debris in landfills that could otherwise be recycled<br />
reduces the lifespan of local landfills, including the Tower landfill;<br />
WHEREAS, in addition to the licensure provisions <strong>for</strong> solid waste haulers, Article II of Chapter 6 -<br />
2003 of the <strong>City</strong> Code also addresses generally the collection and disposal of solid waste, currently referred to<br />
in those provisions as "garbage and trash"; and definitions will be added to Chapter 6.<br />
319
Chapter 6<br />
XX - Definitions.<br />
A. Applicant means any individual, firm, limited liability company, association, partnership, political<br />
subdivision, government agency, municipality, industry, public or private <strong>for</strong> profit or nonprofit<br />
corporation, or any other entity whatsoever who applies to the <strong>City</strong> <strong>for</strong> the applicable permits to<br />
undertake any construction, demolition, or renovation project within the <strong>City</strong>.<br />
B. Construction means the building of any improvement or any portion thereof including any tenant<br />
improvements to an existing facility or structure.<br />
C. Construction and Demolition Debris ("C&D Debris") means used or discarded materials removed<br />
from premises during construction or renovation of a structure resulting from construction,<br />
remodeling, repair, deconstruction, or demolition operations on any pavement, house, garage,<br />
greenwaste, commercial building, or other structure.<br />
D. Conversion rate means the rate set <strong>for</strong>th in the standardized conversion rate table approved by the<br />
city pursuant to this chapter <strong>for</strong> use in estimating the volume or weight of materials identified in a<br />
waste management plan.<br />
E. Deconstruction means the process of carefully dismantling a building or structure in order to salvage<br />
components <strong>for</strong> reuse and recycling.<br />
F. Demolition means the decimating, razing, ruining, tearing down or wrecking of any facility,<br />
structure, pavement or building, whether in whole or in part, whether interior or exterior.<br />
G. Divert means to use construction or demolition debris <strong>for</strong> any purpose other than disposal in a landfill.<br />
H. Emergency: A sudden, unexpected occurrence demanding immediate action to prevent or mitigate<br />
loss of or damage to life, health, property or public services<br />
I. .Project means any activity which requires an application <strong>for</strong> a building or demolition permit or any<br />
similar permit from the <strong>City</strong>.<br />
J. Recycling means the process of collecting, sorting, cleansing, treating, and reconstituting materials<br />
that would otherwise become solid waste, and returning them to the economic mainstream in the<br />
<strong>for</strong>m of raw material <strong>for</strong> new, reused, or reconstituted products which meet the quality standards<br />
necessary to be used in the marketplace.<br />
K. Remodel means any change, addition, or modification in an existing structure.<br />
L. Renovation means any change, addition, or modification in an existing structure.<br />
M. Reuse means the use, in the same <strong>for</strong>m as it was produced, of a material which might otherwise be<br />
discarded.<br />
N. Salvage means the controlled removal of construction or demolition debris from a permitted building<br />
or demolition site <strong>for</strong> the purpose of recycling, reuse, or storage <strong>for</strong> later recycling or reuse.<br />
O. Waste Management <strong>Plan</strong> (WMP) review fee means the fee <strong>for</strong> processing WMP applications as<br />
adopted by the <strong>City</strong> Council by resolution, if any.<br />
P. WMP report means the final calculation of construction and demolition debris diversion <strong>for</strong> the<br />
project.<br />
Submission of Waste Management <strong>Plan</strong>.<br />
A. Waste Management <strong>Plan</strong> (WMP) Forms. Applicants <strong>for</strong> a Building Permit plan check shall complete<br />
and submit a Waste Management <strong>Plan</strong> on a <strong>City</strong>-approved <strong>for</strong>m and pay a WMP review fee, if any,<br />
be<strong>for</strong>e a building or demolition permit may be issued. The completed WMP shall indicate all of the<br />
following:<br />
1. Estimated weight of C&D debris, by materials type, to be generated;<br />
2. Maximum weight of such materials that can feasibly be diverted via reuse or recycling;<br />
3. Vendor or facility that the applicant proposes to use to collect or receive that material;<br />
4. .Estimated weight of C&D materials that will be landfilled; and<br />
5. Total square footage of the project.<br />
320
6. Indicates that the minimum required percentage set <strong>for</strong>th of all C&D debris generated by the project<br />
will be diverted.<br />
7. Calculating Weight of Debris. In estimating the weight of materials identified in the WMP, the<br />
applicant shall use the standardized conversion rates approved by the <strong>City</strong><br />
8. .Deconstruction. In preparing the WMP, applicants <strong>for</strong> a building permit plan check involving the<br />
removal of all or part of an existing structure shall consider deconstruction, to the maximum extent<br />
feasible, and shall make the materials generated thereby available <strong>for</strong> salvage prior to sending to a<br />
landfill.<br />
Review of Waste Management <strong>Plan</strong>.<br />
A. Approval. Notwithstanding any other provision of this code, no Building Permit shall be issued<br />
unless the WMP has been approved. Approval shall not be required, however, where an emergency<br />
demolition, as determined by the <strong>Plan</strong>ning and Community Development Director, is required to<br />
protect public health or safety. The WMP shall not be approved unless it provides all of the<br />
in<strong>for</strong>mation set <strong>for</strong>th above.<br />
B. Non-approval. If the WMP is incomplete or fails to indicate that the minimum required percentage<br />
set <strong>for</strong>th above of all C&D debris generated by the project will be diverted, the WMP shall be returned<br />
to the applicant marked "Denied," including a statement of reasons, and so notify the Community<br />
Development Department, which shall withhold permit issuance until the WMP is resubmitted and<br />
approved.<br />
Compliance with Waste Management <strong>Plan</strong>.<br />
A. Documentation. Prior to final inspection, the applicant shall submit documentation to the Building<br />
Official that the diversion requirement <strong>for</strong> the project has been met. If the applicant does not submit<br />
the required documentation, the applicant may be subject to en<strong>for</strong>cement action pursuant to XXX.<br />
The documentation <strong>for</strong> compliance shall include the following:<br />
(i) Copies of receipts from the vendor or facility that collected or received each material,<br />
showing the actual weight of that material.<br />
(ii) A copy of the approved WMP <strong>for</strong> the project adding the actual weight of each material<br />
diverted and landfilled.<br />
(iii) Weighing of Wastes. Applicants shall make reasonable ef<strong>for</strong>ts to ensure that all C&D<br />
debris diverted or landfilled is measured and recorded using the most accurate method of<br />
measurement available. To the extent practical, all C&D debris shall be weighed by<br />
measurement on scales. Such scales shall be in compliance with all regulatory<br />
requirements <strong>for</strong> accuracy and maintenance. For C&D debris <strong>for</strong> which weighing is not<br />
practical due to small size or other considerations, a volumetric measurement shall be<br />
used. For conversion of volumetric measurements to weight, the applicant shall use the<br />
standardized conversion rates.<br />
(iv) Determination of Compliance.<br />
1. Full Compliance. If the applicant has fully complied with the diversion requirement<br />
<strong>for</strong> the project, the final WMP report shall be approved.<br />
2. Good Faith Ef<strong>for</strong>t to Comply. On a very limited basis, if the diversion requirement<br />
has not been achieved, the <strong>Plan</strong>ning and Community Development Director shall<br />
determine on a case-by-case basis whether the applicant has made a good faith ef<strong>for</strong>t<br />
to comply considering the following:<br />
a. The availability of markets <strong>for</strong> the C&D debris landfilled<br />
b. The percent of total waste diverted.<br />
c. The size of the project; and<br />
d. The documented ef<strong>for</strong>ts of the applicant to divert C&D debris.<br />
If the <strong>Plan</strong>ning and Community Development Director determines that the<br />
applicant has made a good faith ef<strong>for</strong>t to comply with this chapter, the Director may<br />
approve the final WMP report.<br />
321
3. Noncompliance. If the applicant has been found to have not made a good faith ef<strong>for</strong>t<br />
to comply with the diversion requirement applicable to the project, or if the applicant<br />
fails to submit the documentation required by Subsection A of this Section, then the<br />
applicant shall be subject to the en<strong>for</strong>cement provisions. Any penalty assessed must<br />
be paid to the <strong>City</strong> prior to final inspection.<br />
4. Noncompliance Notification and Appeal. Upon a determination of noncompliance,<br />
the applicant shall be notified of the WMP report findings. The notice shall be in<br />
writing and shall identify the specific area(s) of noncompliance with the WMP and<br />
in<strong>for</strong>m the applicant that it has a right to a hearing to appeal the determination.<br />
Exemptions<br />
A. The following project types are exempt from the requirements of this Chapter:<br />
1. Emergency demolition projects, if the projects are required to protect public health or safety, as<br />
determined by the <strong>Plan</strong>ning and Community Development Director in consultation with the <strong>City</strong>'s<br />
Building Official.<br />
2. Infeasibility Exemption Application. If unique circumstances make it infeasible <strong>for</strong> a project<br />
applicant to comply with the diversion requirement, the applicant may apply <strong>for</strong> an exemption at<br />
the time that the applicant submits the required WMP. The applicant shall indicate on the WMP<br />
the maximum rate of diversion he or she believes is feasible <strong>for</strong> each material and the specific<br />
unique circumstances that make it infeasible to comply with the diversion requirement.<br />
3. Granting of Exemption. The Director of <strong>Plan</strong>ning and Community Development shall not issue<br />
an infeasibility exemption unless the Director can make at least one of the following findings:<br />
a. That circumstances exist that are unique to the project to the effect that compliance with<br />
the provisions of this Chapter would create an unusual burden on the project that is<br />
different than that of similarly situated properties.<br />
b. That <strong>for</strong> a specific project compliance with this Chapter would result in minimal or no<br />
increase in recycled materials or reduction in waste stream.<br />
c. That diversion of one or more substances involved in the project presents unique and<br />
burdensome obstacles and would create an especially onerous economic burden on the<br />
project unless diversion of that substance is reduced or eliminated.<br />
If one or more of the above findings may be made <strong>for</strong> a project, the project may be exempted from<br />
compliance with this chapter or determine the maximum feasible reduced diversion rate <strong>for</strong> each material as<br />
reported by the applicant and shall indicate this rate on the WMP submitted by the applicant. A copy of the<br />
WMP shall be returned to the applicant marked "Approved <strong>for</strong> Exemption".<br />
Denial of Exemption. If the Director of <strong>Plan</strong>ning and Community Development does not approve the exemption<br />
request, the applicant shall be in<strong>for</strong>med in writing. The applicant shall have 30 days to resubmit a WMP <strong>for</strong>m in<br />
full compliance. If the applicant fails to resubmit the WMP, or if the resubmitted WMP does not comply with<br />
stated requirements, the Director of <strong>Plan</strong>ning and Community Development shall deny the WMP.<br />
Notwithstanding any other provision of this Code, the determination of the WMP shall be final.<br />
En<strong>for</strong>cement.<br />
A. Criminal <strong>Action</strong>. Any applicant who violates or fails to comply with any provision of this Chapter<br />
shall be guilty of a misdemeanor and subject to the en<strong>for</strong>cement provisions.<br />
B. Civil <strong>Action</strong>. The <strong>City</strong> may redress a violation of, or failure to comply with, any provision of this<br />
Chapter.<br />
NOW, THEREFORE, BE IT RESOLVED BY THE CITY COUNCIL OF THE CITY OF COMMERCE<br />
CITY, COLORADO, AS FOLLOWS:<br />
322
SECTION 1. Findings. The recitals to this resolution are incorporated as findings of the <strong>City</strong> Council.<br />
This resolution is found to be necessary <strong>for</strong> the preservation of the public health, safety, and welfare and in the<br />
public interest.<br />
SECTION 2. Repealer. All other resolutions or portions thereof inconsistent or conflicting with this<br />
resolution or any portion hereof are hereby repealed to the extent of such inconsistency specifically that Section<br />
6-2004 of the Code of the <strong>City</strong> of <strong>Commerce</strong> <strong>City</strong> is hereby amended by the addition of a new definition XXX" which<br />
reads in its entirety as follows:<br />
SECTION 3. Effective Date. This Resolution shall be effective immediately upon passage.<br />
RESOLVED AND PASSED THIS 27 TH DAY OF FEBRUARY, 2023.<br />
CITY OF COMMERCE CITY, COLORADO<br />
_________________________________<br />
Benjamin A. Huseman, Mayor<br />
ATTEST<br />
________________________________<br />
Dylan A. Gibson, <strong>City</strong> Clerk<br />
i<br />
2014 Disposal Facility-Based Characterization of Solid Waste in Cali<strong>for</strong>nia.<br />
ii<br />
https://www.concreterecruiters.com/why-is-concrete-bad-<strong>for</strong>-the-environment<br />
323
Appendix D. Community<br />
Engagement & Education<br />
Suggested Approach <strong>for</strong> a Community Engagement and<br />
Education Campaign to Support the <strong>City</strong>’s <strong>Sustainability</strong> Work<br />
Throughout this project, community<br />
members shared several suggestions<br />
regarding how they would like to best be<br />
in<strong>for</strong>med and engaged throughout this<br />
process. However, there are additional<br />
things that could be done to ensure a robust<br />
community engagement and education<br />
campaign to ensure the <strong>City</strong>’s future<br />
sustainability work is holistic, collaborative,<br />
and long-lasting. Based on the feedback heard<br />
throughout this process, as well as industry<br />
best practices, we recommend the following:<br />
► Stay connected to community members<br />
through a variety of communication<br />
methods. Survey respondents noted that<br />
email, <strong>Commerce</strong> <strong>City</strong> Connections, and<br />
Facebook were the most used methods of<br />
communication. However, using a variety<br />
of methods such as social media, texting,<br />
mailed flyers, face-to-face events, and<br />
communication through local nonprofits<br />
will help expand reach.<br />
► Build capacity of community members<br />
to meaningfully participate in this<br />
process.<br />
─ This includes sharing available data<br />
in clear, concise, and understandable<br />
ways, helping community members<br />
understand the issues and feel a sense<br />
of agency in addressing them (i.e.,<br />
through Civics Academy training,<br />
324<br />
tours, or free opportunities to learn<br />
about how things work behind the<br />
scenes).<br />
─ Supporting a permanent EPAC is also<br />
an example of this.<br />
► Build trust between stakeholders,<br />
including community members.<br />
─ Allocate funding, time, and resources<br />
to meaningfully engage stakeholders.<br />
If possible, provide stipends, food,<br />
childcare, and transportation<br />
assistance.<br />
─ Ensure that materials are available<br />
concurrently in English and Spanish.<br />
─ Foster the growth of community<br />
partnerships and hire community<br />
connectors to strengthen community<br />
engagement and create meaningful<br />
change.<br />
─ Agencies should coordinate and<br />
communicate with each other on<br />
outreach events to ensure community<br />
time is used wisely and partner on<br />
events where possible.<br />
─ Follow up with incremental, actionable<br />
steps to implement change. Practice<br />
transparency in communication<br />
whenever possible.
Appendix D. Community<br />
Engagement & Education<br />
► Meet people where they are.<br />
─ Host updates at regularly occurring<br />
community events, recreation centers,<br />
and other gatherings. Offer a hybrid<br />
option when planning meetings.<br />
─ <strong>Plan</strong> meetings that are accessible via<br />
public transportation, safe, and close<br />
to the focal community.<br />
“[We] focus our resources on<br />
civics education. If you teach the<br />
people how to use the tools, they<br />
can work on whatever comes<br />
next; whatever else is important<br />
to them.” - Community Organizer<br />
Figure AD1 Preferred method of communication by survey respondents<br />
325
Appendix D. Community<br />
Engagement & Education<br />
The State’s Environmental Justice Task Force is finalizing recommendations <strong>for</strong> the State in<br />
regard to EJ policy and initiatives in Colorado, which include specific guidance on community<br />
outreach and engagement.<br />
<strong>Commerce</strong> <strong>City</strong> should integrate the EJ Task Force’s guidance <strong>for</strong> community engagement<br />
wherever and whenever possible, specific as it relates to: *<br />
► Timing and locations of meetings—meeting times should be scheduled based on data<br />
regarding most attended meetings in the past. Meetings should be held at community<br />
locations that are easily accessible by transit or bike paths, safe, include free parking,<br />
accessible <strong>for</strong> people with disabilities, and in close proximity to local businesses.<br />
► Outreach materials and methods—materials should be culturally relevant, easily<br />
understood (i.e., avoid technical language), available on diverse plat<strong>for</strong>ms, in multiple<br />
languages, and disseminated across several types of media.<br />
► Accessibility in gathering input—a wide variety of methods should be used to gather<br />
input, including traditional methods (i.e., public meetings, surveys) and more innovative<br />
methods that reach people where they are (i.e., monthly coffee meetings, ‘office hours’,<br />
etc.).<br />
* Find the final report on the CDPHE’s EJ website: https://cdphe.colorado.gov/environmental-justice<br />
326
Appendix E. Community<br />
Survey & Intercept Interviews<br />
The community-wide engagements,<br />
survey, and intercept interviews reflected<br />
the complexity of the C3 community. In<br />
conducting these outreach activities, the<br />
<strong>City</strong> sought to obtain feedback on the policy<br />
recommendations and insights into the <strong>City</strong>’s<br />
environmental and sustainability issues from<br />
a wide swath of the community. In summary,<br />
over 100 people responded to the survey with<br />
various ages, genders, and areas of the city<br />
represented. Many respondents spoke about<br />
a variety of issues, with “water quality,” “air<br />
quality,” “concerns about waste and pollutants<br />
from living near an industrial facility,”<br />
“concerns around waste and pollutants from<br />
living near a landfill,” “healthy food access,”<br />
“industrial waste,” and “transportation” being<br />
the primary areas of concern.<br />
“I am concerned about the<br />
inequities that exist in CC. I’d<br />
love to see ef<strong>for</strong>ts supported<br />
in the lower and middle CC<br />
areas, led by residents of these<br />
areas with the history and lived<br />
experience to guide priorities. “<br />
- Survey Respondent<br />
Additionally, interviewees noted that they<br />
would like the <strong>City</strong>’s sustainability actions to<br />
be focused on understanding and addressing<br />
root causes (i.e., poverty, homelessness,<br />
land use) in tandem with environmental<br />
recommendations; ensuring that stakeholders<br />
are engaged and educational opportunities<br />
are present; and creating change that is<br />
incremental, thoughtful, and sustainable.<br />
Survey Results<br />
During the two-month window that the<br />
survey was publicly available on Survey<br />
Monkey, the <strong>City</strong> recorded over 100 responses<br />
from people who lived or worked in C3, with<br />
an additional four responses from people<br />
familiar with C3. *<br />
Respondents noted that they lived or worked<br />
in different areas of the <strong>City</strong>, with 69% of<br />
respondents coming from the north section<br />
of the <strong>City</strong> (96th Ave and North), 18% from<br />
the south section of the <strong>City</strong> (72nd and<br />
South) and 13% from the middle section of<br />
the <strong>City</strong> (72nd – 96th Ave).<br />
When asked to rank their top environmental<br />
concerns in C3, the majority of survey<br />
respondents noted that “water quality” and<br />
* The respondents were majority female-identified (66%), with 32% identifying as male and two percent identifying as<br />
non-binary. Most of the respondents were between the ages of 31-40 (31%) or 41-50 (24%). The race respondents selected<br />
ranged from American Indian/Alaska Native, Asian, Black or African American, Mexican, Mestizo, and Native Hawaiian,<br />
but the largest survey respondent group identified as White or Caucasian. 79% of respondents did not identify as Hispanic<br />
or Latino/a/x, and 18% noted that they did identify as Hispanic or Latino/a/x. The majority of respondents filled out the<br />
survey in English; four respondents answered the open-ended questions in Spanish.<br />
327
Appendix E. Community<br />
Survey & Intercept Interviews<br />
Figure AE1 Survey respondents top environmental concerns.<br />
Figure AE2 Top environmental concerns by geographic location.<br />
328
Appendix E. Community<br />
Survey & Intercept Interviews<br />
“air quality” were most important, followed<br />
by “concerns about waste and pollutants from<br />
living near an industrial facility,” “concerns<br />
around waste and pollutants from living near<br />
a landfill,” “healthy food access,” “industrial<br />
waste,” and “transportation.” Figure AE1<br />
shows the range of environmental concerns<br />
presented to respondents and distribution of<br />
their top concerns.<br />
The respondents’ environmental priorities<br />
differed slightly depending on the part of C3<br />
in which respondents lived and/or worked.<br />
Virtually all respondents cited concerns<br />
regarding air and water quality. Respondents<br />
who said they lived and/or worked in<br />
northern <strong>Commerce</strong> <strong>City</strong> listed concerns<br />
about waste and pollutants from living near<br />
a facility from living near the landfill, as well<br />
as biodiversity and green space. Similarly,<br />
respondents who reported that they lived<br />
in the southern portion of <strong>Commerce</strong><br />
<strong>City</strong>, where the Suncor refinery is located,<br />
identified concerns from living near an<br />
industrial facility, plus transportation, as chief<br />
concerns. In contrast, the concerns from<br />
the remaining respondents reflected their<br />
location in the center of the <strong>City</strong>: availability<br />
of recycling bins at home, availability to<br />
purchase products made of recycled materials<br />
or compost, food accessibility, healthy food<br />
access, industrial waste, residential energy<br />
efficiency, and transportation.<br />
When asked “what specific concerns do<br />
you have to the items selected,” many<br />
respondents expressed how these issues<br />
impact them significantly.<br />
Water & Air Quality<br />
Several respondents noted similar concerns<br />
with the local air and water quality:<br />
► Concern regarding chemicals and<br />
pollution from fire retardants the levels<br />
and impact of PFAS chemicals in the<br />
water.<br />
► Dissatisfaction with the water softening<br />
system without addressing underlying<br />
issues.<br />
► Concern regarding health-related issues,<br />
such as asthma, due to poor air and water<br />
quality, and the impact on vulnerable<br />
populations.<br />
► Overall distrust that the water and air<br />
quality are safe <strong>for</strong> people and animals in<br />
the area.<br />
Waste & Pollution<br />
Concerns about waste and pollutants from<br />
living near an industrial facility, landfill and<br />
industrial waste pollution:<br />
► Concern about the environmental justice<br />
impact <strong>for</strong> vulnerable populations living<br />
near facilities such as Suncor.<br />
► Concern regarding the public health<br />
impact <strong>for</strong> the broader community,<br />
including adjacent communities to Suncor.<br />
329
Appendix E. Community<br />
Survey & Intercept Interviews<br />
► Concerns about proper industrial waste<br />
disposal and accountability.<br />
Healthy Food Access & Transportation<br />
Several respondents noted concerns about<br />
healthy food access and transportation. These<br />
comments followed the general themes:<br />
► Concern about the prevalence of junk<br />
food and lack of healthy food options.<br />
► Acknowledgement of a lack of grocery<br />
stores in <strong>Commerce</strong> <strong>City</strong>, contributing<br />
to car dependence and Vehicle Miles<br />
Traveled to access food.<br />
► Concern over the cost of food.<br />
► Concern regarding an inadequate supply<br />
of food options overall, especially as<br />
<strong>Commerce</strong> <strong>City</strong> population grows.<br />
Other Topics<br />
In addition to the categories listed, survey<br />
respondents voiced concerns with:<br />
► Homelessness and lack of adequate<br />
homeless services.<br />
► Rapid residential growth near pollutants<br />
and without adequate infrastructure to<br />
support the growth.<br />
► The need <strong>for</strong> more equitable and<br />
community-focused solutions.<br />
► The need <strong>for</strong> long-term sustainability over<br />
short-term solutions (i.e., planting trees<br />
and having minimal plans of how to take<br />
care of the trees long-term.)<br />
The community engagement process relied heavily on the involvement of the Environmental<br />
Policy Advisory Committee, who were tasked with providing recommendations to staff,<br />
<strong>Plan</strong>ning Commission, and <strong>City</strong> Council on ways to improve environmental quality outcomes in<br />
an equitable manner across the community. Survey respondents overwhelmingly voiced support<br />
<strong>for</strong> the continuation of this committee, and this did not vary by geographic area.<br />
“[<strong>Commerce</strong> <strong>City</strong>] needs more resources <strong>for</strong> equitable community<br />
health, such as food access, medical, resources <strong>for</strong> homelessness,<br />
programming, and ef<strong>for</strong>ts in the well-being of the community and its<br />
housed/unhoused residents. I am also concerned about the homeless<br />
population and waste they are leaving in/around their campsites and<br />
the city. Help them help themselves.” - Survey Respondent<br />
330
Appendix E. Community<br />
Survey & Intercept Interviews<br />
Key In<strong>for</strong>mant and Intercept<br />
Interviews<br />
To complement the breadth of the survey<br />
results, the consultant team also conducted<br />
interviews with community leaders to gather<br />
qualitative data through more in-depth oneon-one<br />
conversations. The interviewees,<br />
all residents of <strong>Commerce</strong> <strong>City</strong>, included<br />
business operators, employees at small<br />
businesses, <strong>City</strong> Staff, Councilmembers and<br />
community organizers, as well as both youth<br />
and adult perspectives. They covered similar<br />
topics as did the survey, such as air and water<br />
quality concerns, availability of food sources,<br />
concerns around af<strong>for</strong>dable housing and<br />
homelessness, transportation, and prevalence<br />
of garbage in some C3 neighborhoods.<br />
Interviewees’ comments centered<br />
around three key themes that the<br />
community would like to see reflected in<br />
the <strong>City</strong>’s sustainability actions:<br />
1. Understanding and addressing root<br />
causes (poverty, homelessness, land<br />
use) in tandem with environmental<br />
recommendations.<br />
2. Ensuring that stakeholders<br />
are engaged and educational<br />
opportunities are present.<br />
3. Creating change that is incremental,<br />
thoughtful, and sustainable.<br />
Addressing Root Causes as<br />
an Environmental Issue<br />
Interviewees spoke about the history of<br />
<strong>Commerce</strong> <strong>City</strong>, chiefly its founding based<br />
on industries whose toxic byproducts affect<br />
air and water quality. They noted that a<br />
successful environmental approach will<br />
need to ensure that resources are dedicated<br />
towards actions that lower harmful pollution,<br />
update technologies that support the industry<br />
while promoting clean energy, pursue<br />
bioremediation and soil and water testing,<br />
and address health and economic disparities<br />
so that all residents can actively participate<br />
in advancing environmental solutions in the<br />
<strong>City</strong>.<br />
331<br />
Ensuring That Stakeholders<br />
are Engaged, and Education<br />
is Key to Implementing<br />
Change<br />
Another theme that arose out of the<br />
interviews was the importance of building a<br />
culture of collaboration amongst stakeholders<br />
and ensuring that businesses, residents,<br />
and industry know how to create change.<br />
Interviewees spoke about the looming<br />
environmental issues facing the <strong>City</strong> as well<br />
as the importance of collaboration and open<br />
discussion to understand the impact of<br />
potential solutions on various stakeholders.<br />
Several interviewees highlighted their
Appendix E. Community<br />
Survey & Intercept Interviews<br />
sense that <strong>Commerce</strong> <strong>City</strong> feels divided<br />
geographically, politically, and culturally; and<br />
that a more collaborative approach would<br />
ensure that the <strong>City</strong>’s environmental policies<br />
meet the needs of a variety of stakeholders.<br />
As a corollary, the interviewees also<br />
stressed the importance of education,<br />
noting that both sharing data and creating<br />
opportunities to educate the community<br />
on environmental issues would develop a<br />
shared baseline of knowledge across C3. This<br />
collective understanding would ultimately<br />
lead to creating more innovative, impactful<br />
solutions to priority issues. Their suggested<br />
avenues <strong>for</strong> community education included<br />
civics trainings, networking or connection<br />
opportunities, multilingual educational<br />
materials, an ongoing EPAC, and regional<br />
collaboration.<br />
“I’m nervous about community<br />
gardens when there are toxins in<br />
the environment. Primary focus<br />
is addressing the toxins and then<br />
the food comes after. If you have<br />
pollution coming down, is the soil<br />
safe to grow? Is the water safe? If<br />
your toxins are in the food you’re<br />
only increasing your exposure.” -<br />
Community Organizer<br />
Creating change that is<br />
incremental, thoughtful, and<br />
sustainable<br />
Several interviewees emphasized the<br />
importance of an incremental approach to a<br />
fiscal, economic, and technological transition<br />
and of fully understanding the adverse<br />
impacts of any policy change on businesses<br />
and residents. A couple interviewees noted<br />
that pursuing a pilot program approach could<br />
smooth out the necessary, but sometimes<br />
difficult, transition periods and help adjust<br />
the C3 community to a concept over time:<br />
<strong>for</strong> example, the <strong>City</strong> may adopt <strong>for</strong>wardthinking<br />
energy efficiency initiatives by<br />
first creating voluntary programs, then reassessing<br />
their feasibility, and ultimately<br />
phasing in a mandate or ordinance.<br />
In terms of pursuing a just transition,<br />
interviewees reaffirmed the need to center<br />
equity: <strong>for</strong> example, the <strong>City</strong> should consider<br />
housing justice and renters’ rights as they<br />
develop plans to expand green space and tree<br />
canopy to avoid gentrification issues. Another<br />
example includes working with the business<br />
community to identify solutions to replace<br />
the tax base if any large industries shutter.<br />
Finally, interviewees suggested leaning on<br />
connections with various regional, State,<br />
and federal programs to ensure the solutions<br />
implemented are accessible <strong>for</strong> C3 residents<br />
of any income level.<br />
332
Appendix E. Community<br />
Survey & Intercept Interviews<br />
“Policies that the <strong>City</strong> of <strong>Commerce</strong> <strong>City</strong> may consider should ensure<br />
that there is a view of the holistic picture. Things to consider are balance,<br />
reasonableness and business certainty, while weighing the whole<br />
community’s needs. It’s critical that you look beyond the policy language<br />
on paper and understand the practicality of the policy, including<br />
any unintended consequences. Finally, ensure that there is time built<br />
into the policy to realize and understand benefits of the new policies’<br />
implementation.” - Local Business Operator<br />
333
Appendix F. Municipal Government<br />
Implementation <strong>Plan</strong><br />
<strong>Commerce</strong> <strong>City</strong> Organizational <strong>Sustainability</strong> Recommendations<br />
Introduction<br />
The purpose of this memo is to identify the key components of a vision <strong>for</strong> organizational sustainability and<br />
recommendations <strong>for</strong> the <strong>City</strong> of <strong>Commerce</strong> <strong>City</strong> (the <strong>City</strong> / <strong>Commerce</strong> <strong>City</strong>) to consider regarding energy efficiency,<br />
fleet management, waste reduction, water use, and organizational capacity-building strategies as it pertains to<br />
municipal facilities and operations. This is an organization-wide ef<strong>for</strong>t; there<strong>for</strong>e, outreach was conducted across all<br />
departments. Consultants from Lotus Engineering and <strong>Sustainability</strong>, LLC. (Lotus) conducted research, facilitated<br />
in<strong>for</strong>mational interviews and a focus group with staff, and disseminated a citywide survey to ensure a comprehensive<br />
outlook of organizational sustainability recommendations. This ef<strong>for</strong>t took place from April to September 2021.<br />
This document outlines the findings and the top sustainability recommendations <strong>for</strong> the organization based on those<br />
activities. Recommendations are sorted by sector, and the items that were prioritized by staff rose to the top tier of<br />
recommendations, with a focus on those activities that are expected to have the most impact with little ef<strong>for</strong>t. The<br />
second tier of recommendations can be done with little ef<strong>for</strong>t but have a lower impact. The third tier<br />
recommendations have a high impact but are likely to require more ef<strong>for</strong>t, which may be more appropriate <strong>for</strong><br />
longer-term implementation.<br />
VISION STATEMENT:<br />
To drive sustainability work within <strong>Commerce</strong> <strong>City</strong>, consultants developed three vision statements based on staff<br />
input. Staff who participated in the focus group voted in their top choice <strong>for</strong> a vision statement that aligned with this<br />
work. Below is the vision statement <strong>for</strong> organizational sustainability that received the most votes.<br />
The <strong>City</strong> of <strong>Commerce</strong> <strong>City</strong> is committed to environmental stewardship and is dedicated to making internal<br />
improvements that foster a sustainable future.<br />
334
Table of Contents<br />
<br />
Overview of Organizational <strong>Sustainability</strong> Recommendations<br />
Data Collection and Methodology<br />
Detailed Recommendations by Sector<br />
First Tier Recommendations<br />
Second Tier Recommendations<br />
Third Tier Recommendations<br />
Future Recommendations to Consider<br />
Data Collection<br />
<br />
3<br />
5<br />
10<br />
11<br />
14<br />
16<br />
19<br />
19<br />
335
Overview of Organizational <strong>Sustainability</strong> Recommendations<br />
Below is an overview of the top recommendations sorted by impact and ef<strong>for</strong>t based on staff input and consultant<br />
expertise. The recommendations are listed based on the priority level that they were assigned by staff that attended<br />
the focus group and responded with their prioritized recommendations. Please see the section “Detailed<br />
Recommendations by Sector” <strong>for</strong> further in<strong>for</strong>mation on each recommendation, including the level of impact and<br />
ef<strong>for</strong>t involved, which department is responsible, and a more detailed description of the activity.<br />
First Tier Recommendations | High Impact, Low Ef<strong>for</strong>t (1-2 years)<br />
1. Implement digital systems to reduce the amount of paper used.<br />
2. Make it a policy to upgrade facility, street, and trail lights to high-efficiency LEDs.<br />
3. Develop processes and policies <strong>for</strong> maintaining and replacing equipment to reduce energy use, conserve fuel, and reduce air<br />
pollution.<br />
4. Develop a Green Meetings and Events Policy with checklists and resources <strong>for</strong> staff.<br />
5. Ensure all waste disposal systems are consistent in terms of look, style, and signage.<br />
6. Create a <strong>City</strong>-wide Green Team with representation from each department to lead sustainability ef<strong>for</strong>ts.<br />
7. Provide incentives <strong>for</strong> sustainability-based professional development.<br />
8. Recognize staff <strong>for</strong> sustainable decision-making.<br />
9. Adopt work-from-home policies.<br />
10. Purchase Renewable Energy Credits.<br />
Second Tier Recommendations | Low Impact, Low Ef<strong>for</strong>t (2-4 years)<br />
1. Improve air quality in buildings.<br />
2. Develop a <strong>City</strong>-wide environmental management system (EMS) that is fully integrated and operational across all facilities.<br />
3. Develop a program <strong>for</strong> employees that provides sustainable education, training, and incentives.<br />
4. Develop a policy <strong>for</strong> recycling electronic office equipment and other hard to recycle items.<br />
5. Establish an employee donation or volunteer program.<br />
6. Require that new <strong>City</strong> infrastructure projects be evaluated <strong>for</strong> environmental and social impacts.<br />
336
7. Develop a municipal policy and procedure to consider life-cycle costs in procurement.<br />
8. Develop waste reduction and diversion policies that are aligned with zero-waste practices and include green standards.<br />
9. Ensure facilities cleaning contractors are utilizing sustainable practices.<br />
Third Tier Recommendations | High Impact, High Ef<strong>for</strong>t (4+ years)<br />
1. Improve building efficiency.<br />
2. Introduce electric and hybrid vehicles into the fleet and invest in the charging infrastructure needed to support electric vehicles.<br />
3. Implement Xeriscaping.<br />
4. Identify and develop projects to expand local renewable energy generation and use on <strong>City</strong> facilities and land.<br />
5. Collect data to start building climate action plans and goals.<br />
6. Develop a policy to increase construction recycling <strong>for</strong> <strong>City</strong>-funded projects.<br />
7. Diversify staff.<br />
8. Develop a sustainability or innovation grant program <strong>for</strong> staff to implement and make operations more sustainable.<br />
9. Adopt a policy that all new <strong>City</strong> facilities or major renovations will be built to a high-efficiency standard (e.g., LEED).<br />
A final recommendation that is crucial to ensuring the success of both <strong>Commerce</strong> <strong>City</strong>’s internal (i.e., organizational)<br />
and external (i.e., community-wide) sustainability work is to build capacity and skill within the organization to lead<br />
sustainability ef<strong>for</strong>ts. Lotus recommends that <strong>Commerce</strong> <strong>City</strong> consider creating a staff position specifically<br />
dedicated to leading <strong>City</strong>-wide organizational and community sustainability ef<strong>for</strong>ts; this position could be housed<br />
in the <strong>City</strong> Manager’s Office or Community Development Department, but it is recommended that the position be<br />
structured to specially work on sustainability projects alone, including implementing the recommendations herein<br />
and the <strong>for</strong>thcoming community-wide sustainability strategies that <strong>Commerce</strong> <strong>City</strong> is developing in partnership with<br />
a community Environmental Policy Advisory Committee. By maintaining the core functions of the position discreetly<br />
on sustainability, staff in this position would have the ability to focus time on implementing sustainability policies and<br />
programs, collaborating with other <strong>City</strong> departments to ensure success, and facilitating a <strong>City</strong>-wide Green Team to<br />
continue to build capacity <strong>for</strong> sustainability throughout the organization.<br />
337
Data Collection and Methodology<br />
PEER CITY RESEARCH<br />
Research was conducted on the current sustainability practices within peer cities both within and outside Colorado.<br />
The cities chosen were based on similar demographics and structure to <strong>Commerce</strong> <strong>City</strong>, or unique and innovative<br />
approaches to sustainability. Below is a list of peer cities and organizations that help guide recommendations:<br />
● <strong>City</strong> of Fort Collins.<br />
● <strong>City</strong> of Thornton.<br />
● <strong>City</strong> of Westminster.<br />
● <strong>City</strong> of Lancaster, MA.<br />
● <strong>City</strong> of Portland, ME.<br />
● Anchorage, AK.<br />
● New Belgium Brewery (B-Corp).<br />
● Adam's County.<br />
338
HIGH LEVEL TAKEAWAYS FROM PEER CITIES RESEARCH<br />
The organizations researched are at varying levels of the depth of their<br />
sustainability ef<strong>for</strong>ts. Some organizations have been engaged with<br />
sustainability <strong>for</strong> 5+ years (<strong>City</strong> of Fort Collins, <strong>City</strong> of Portland, ME, Anchorage,<br />
AK, Adams County, New Belgium) and are focusing on organizational<br />
sustainability goals that will help them reach their climate targets. These<br />
organizations often have a specific staff member (or team) dedicated to<br />
leading the organization’s sustainability work (both internally and externally).<br />
Based on staff engagement, access to resources, alignment with other ef<strong>for</strong>ts,<br />
and perceived impact, the largest ef<strong>for</strong>ts within these organizations are<br />
generally in building efficiency and fleet management.<br />
Other organizations are just beginning to develop policies and programs<br />
around sustainability (<strong>City</strong> of Westminster, <strong>City</strong> of Thornton, <strong>City</strong> of Lancaster).<br />
These organizations that are newer to sustainability are focusing on staff<br />
education and policy development, data collection, and waste diversion. Some<br />
of these organizations (e.g., the <strong>City</strong> of Westminster) have dedicated staff to<br />
lead this work, while others have integrated sustainability into other staff roles.<br />
In general, having a specific staff member (or a team) dedicated to<br />
implementing sustainability related work is more likely to result in success,<br />
especially when the organization is approaching sustainability from both an<br />
internal (i.e., organizational) and external (i.e., community-wide) perspective.<br />
Based on this research, it is best practice to start with data collection, goal<br />
setting, and recommendations that are considered low ef<strong>for</strong>t/high impact.<br />
Recommended Best Practices<br />
in Organizational<br />
<strong>Sustainability</strong><br />
Starting with data collection<br />
and goal setting in regard to<br />
organizational sustainability<br />
opportunities will allow the <strong>City</strong><br />
to focus on opportunities <strong>for</strong><br />
integrating sustainability that<br />
have the highest impact with<br />
the least amount of ef<strong>for</strong>t.<br />
Formalizing a staff position that<br />
is specifically devoted to<br />
implementing and advancing<br />
the <strong>City</strong>’s sustainability goals is<br />
more likely to result in<br />
successfully implementation<br />
and collaboration across <strong>City</strong><br />
departments and levels of<br />
leadership.<br />
339
See Appendix A: Research Matrix <strong>for</strong> more detailed in<strong>for</strong>mation on the specific policies and procedures that are being<br />
implemented within each of these organizations.<br />
Recommended Best Practices in Organizational <strong>Sustainability</strong><br />
Strategies and actions that are chosen <strong>for</strong> implementation should:<br />
●<br />
●<br />
●<br />
●<br />
●<br />
Be developed by sector, not by department, to encourage cross-collaboration.<br />
Be data-driven and have clear metrics.<br />
Be tied to current and future plans/policies/programs.<br />
Include employee education and culture changes.<br />
Include incentives and be coupled with tools and resources <strong>for</strong> success.<br />
STAFF INFORMATIONAL INTERVIEWS<br />
Five departments across <strong>Commerce</strong> <strong>City</strong> engaged in in<strong>for</strong>mational interviews. These interviews allowed Lotus to dive<br />
deeper into the specific needs, pinch points, and ideas around sustainability particular to each department. The five<br />
departments that participated were:<br />
● Public Works.<br />
● Fleet and Facilities.<br />
● In<strong>for</strong>mation Technology.<br />
● Parks, Recreation, and Golf.<br />
● Emergency Management.<br />
340
HIGH LEVEL TAKEAWAYS FROM INFORMATIONAL INTERVIEWS<br />
The commonality these departments shared was a desire <strong>for</strong><br />
more sustainable practices across the organization. It was agreed<br />
that implementation should happen in phases, be developed<br />
cross-collaboratively, and that staff who would be directly<br />
impacted should be involved in the planning process <strong>for</strong><br />
sustainability work. The recommendations that were similar across<br />
departments were around waste diversion and building efficiency.<br />
However, because operations differ across departments, there<br />
were some differences in prioritization around some<br />
recommendations. There were also some hesitations expressed by<br />
staff due to a lack of proven available technology on the market<br />
currently (i.e., a challenge <strong>for</strong> converting maintenance equipment<br />
to electric engines), infrastructure (i.e., lack of current access to<br />
transit near <strong>City</strong> facilities), and safety (i.e., difficulty of banning<br />
space heaters be<strong>for</strong>e building occupant com<strong>for</strong>t issues are improved).<br />
Recommended Best Practices in<br />
Organizational <strong>Sustainability</strong><br />
• Practice phased implementation to<br />
allow the organization to iterate on its<br />
own successes.<br />
• Develop and implement<br />
sustainability strategies and actions<br />
collaboratively across departments,<br />
divisions, and levels of management.<br />
• Involve staff who will be directly<br />
impacted by strategies and actions<br />
in the planning process.<br />
CITYWIDE STAFF SURVEY<br />
The citywide staff survey was open <strong>for</strong> several weeks. Seventy-three employees filled out the survey, and at least one<br />
staff member per department participated. The survey had questions regarding:<br />
●<br />
●<br />
●<br />
Current sustainability ef<strong>for</strong>ts within departments.<br />
Areas of improvement <strong>for</strong> sustainability by sector.<br />
What actions need to be taken in order to implement recommendations.<br />
341
● The level of support staff has <strong>for</strong> recommendations.<br />
● Barriers that exist to implementation.<br />
● Potential risks associated with implementation.<br />
HIGH LEVEL TAKEAWAYS FROM THE STAFF SURVEY<br />
Staff had many recommendations to share <strong>for</strong> each sector, with the<br />
most ideas and enthusiasm around waste diversion and<br />
organizational culture/employee education. It was evident from the<br />
survey that staff believes there is a lack of current policies in place to<br />
support sustainability, and developing such policies is critical <strong>for</strong><br />
implementation.<br />
Staff also shared what barriers they believe need to be addressed in<br />
order to turn opportunities into action. The key takeaways are that<br />
the organization's most significant challenges to enhancing<br />
sustainability are a lack of current policy and a lack of support <strong>for</strong><br />
change, including from leadership. It is important to note that staff<br />
seemed willing to take this work on and, in general, do not feel they<br />
are too busy to implement sustainability practices.<br />
Further details on the survey results can be found in Appendix B: Staff<br />
Survey Results.<br />
16%<br />
Does your department have current<br />
policy?<br />
10%<br />
74%<br />
<br />
<br />
<br />
<br />
<br />
Figure 1. Results from the staff survey regarding<br />
9%<br />
33%<br />
current policy.<br />
Barriers to Implementation<br />
25%<br />
33%<br />
<br />
<br />
<br />
<br />
<br />
<br />
<br />
Figure 2. Results from the staff survey regarding<br />
barriers to implementation.<br />
342
STAFF FOCUS GROUP<br />
Staff from various departments joined a focus group to<br />
review the findings and recommendations of the research,<br />
interviews, and citywide staff survey. They were asked to<br />
provide additional feedback and sort the various<br />
opportunities into an impact and ef<strong>for</strong>t matrix. Following that<br />
sorting, staff provided input on the ways that different<br />
opportunities may align with or conflict with current work,<br />
any synergistic ef<strong>for</strong>ts happening, and some of the critical<br />
first steps that should be taken to implement this work.<br />
Finally, staff were asked to rank their top three<br />
recommendations.<br />
Full details on the input provided by staff can be found in<br />
Appendix C: Focus Group Notes.<br />
Detailed Recommendations by Sector<br />
Further in<strong>for</strong>mation on the recommendations within each<br />
sector are provided in the table below, including the level of<br />
impact and ef<strong>for</strong>t involved, predicted duration, a more<br />
detailed description of the activity, and which department is<br />
responsible. Note: this is an organization-wide ef<strong>for</strong>t,<br />
there<strong>for</strong>e the department noted here is the suggested ‘lead’<br />
department. However, collaboration across departments<br />
and levels of management will be essential <strong>for</strong> the success<br />
<strong>Commerce</strong> <strong>City</strong> Staff Interest in <strong>Sustainability</strong><br />
In the staff survey, <strong>Commerce</strong> <strong>City</strong> employees<br />
showed the greatest enthusiasm <strong>for</strong><br />
sustainability actions that would address<br />
waste diversion and they would provide<br />
employee education around sustainability.<br />
Staff noted they were interested in pursuing<br />
this work and do not feel they are too busy to<br />
implement sustainability in their workflow.<br />
Perceived Barriers to Organizational<br />
<strong>Sustainability</strong> in <strong>Commerce</strong> <strong>City</strong><br />
In the staff survey, <strong>Commerce</strong> <strong>City</strong> employees<br />
expressed that the barriers to organizational<br />
sustainability include:<br />
• A lack of current policy.<br />
• A lack of support <strong>for</strong> change at the<br />
leadership level within the organization.<br />
• A lack of sustainability being woven<br />
through organizational culture.<br />
343
<strong>for</strong> the majority of recommendations. Impact, ef<strong>for</strong>t, and duration were defined by Lotus based on research and past<br />
experience and then further in<strong>for</strong>med by staff input during the focus group.<br />
Impact, ef<strong>for</strong>t, and duration were defined as:<br />
Impact (I.E., SOCIAL, ENVIRONMENTAL, AND ECONOMIC BENEFITS)<br />
High<br />
Medium<br />
Low<br />
Likely to significantly reduce energy use, costs, or greenhouse gas (GHG) emissions.<br />
Likely to somewhat reduce energy use, costs, or GHG emissions.<br />
Likely to reduce energy use, costs, or GHG emissions by a small amount.<br />
Ef<strong>for</strong>t (I.E., COMPLEXITY OF IMPLEMENTATION)<br />
High<br />
Medium<br />
Low<br />
Likely to require significant staff resources (i.e., greater than 0.25 Full-Time Employees [FTE] per week).<br />
Likely to require moderate staff resources (i.e., between 0.1-0.25 FTE/week).<br />
Likely to require minimal staff resources (i.e., less than 0.1 FTE/week).<br />
DURATION (I.E., LENGTH OF TIME FOR FULL IMPLEMENTATION)<br />
Long<br />
Medium<br />
Short<br />
Ongoing Ongoing<br />
Likely to require 12 months or more to complete.<br />
Likely to require 6-12 months to complete.<br />
Likely to require less than 6 months to complete.<br />
This ef<strong>for</strong>t will continue into perpetuity once started. Note, if an ef<strong>for</strong>t is ongoing, the initial duration <strong>for</strong><br />
implementation of the ef<strong>for</strong>t will be listed first.<br />
It should be noted that the final groupings into first, second, and third tier were based on the level of impact and ef<strong>for</strong>t<br />
as well as the level of priority placed on the action by staff that participated in the focus group.<br />
344
First Tier Recommendations<br />
Energy and Water Use<br />
Adopt a policy to upgrade the facility, street, and trail lights to high-efficiency LEDs. While facilities<br />
often already replace lights with LEDs, a concrete policy will ensure this is standard practice.<br />
Purchase Renewable Energy Credits (RECs). RECs can be purchased through the local electricity<br />
utility to offset the carbon emissions associated with energy used in <strong>City</strong> facilities. When on-site<br />
renewable energy is not an option, this is an easy and low-cost way to offset emissions and energy<br />
use.<br />
TRANSPORTATION<br />
Adopt work-from-home policies. Staff have already become accustomed to working from home<br />
throughout the COVID-19 pandemic. By continuing to provide opportunities <strong>for</strong> staff to work<br />
remotely, energy use, GHG emissions, and air quality impacts associated with staff commuting can<br />
be mitigated. This additionally is seen as a quality-of-life benefit <strong>for</strong> many employees.<br />
WASTE DIVERSION<br />
Implement digital systems to reduce the amount of paper used. Staff frequently noted the use of<br />
redundant and excessive paper <strong>for</strong> processes that could be digitized, including building permits and<br />
internal documentation. Digital systems may also help to reduce staff time associated with tasks as<br />
these systems can be more efficient; proper training on the use of the systems will be necessary.<br />
Develop processes and policies <strong>for</strong> maintaining and replacing equipment. Ensuring there is a<br />
<strong>for</strong>malized and written process <strong>for</strong> maintaining equipment (e.g., mowers, lawn equipment, and office<br />
equipment) to ensure that it is functioning well and efficiently can save staff time and energy in the<br />
long run. This policy should also include details on when equipment should be replaced and the<br />
criteria that should be used <strong>for</strong> replacement.<br />
Develop a Green Meetings and Events Policy with checklists and resources <strong>for</strong> staff. This policy<br />
should include in<strong>for</strong>mation on the types of materials that can be used <strong>for</strong> events and meetings (i.e.,<br />
Department: Facilities<br />
Impact:<br />
Ef<strong>for</strong>t:<br />
Duration:<br />
Department: Finance; Facilities<br />
Impact:<br />
Ef<strong>for</strong>t:<br />
Duration:<br />
, Ongoing<br />
Department: Human resources<br />
Impact:<br />
Ef<strong>for</strong>t:<br />
Duration:<br />
Department: In<strong>for</strong>mation Technology<br />
Impact:<br />
Ef<strong>for</strong>t:<br />
Duration:<br />
, Ongoing<br />
Department: Purchasing<br />
Impact:<br />
Ef<strong>for</strong>t:<br />
Duration:<br />
Department: <strong>City</strong> Manager’s Office<br />
Impact:<br />
Ef<strong>for</strong>t:<br />
345
anning the use of Styrofoam or single-use items) and guidance on how to host a “green” event or<br />
meeting.<br />
Ensure all waste disposal systems are consistent in terms of look, style, and signage. A tenet of a<br />
strong waste diversion program is consistent collection bin style and signage that is clear,<br />
illustrative, and hung at eye level <strong>for</strong> the user. Trash and recycling bins should always be co-located.<br />
Duration:<br />
Department: Facilities<br />
Impact:<br />
Ef<strong>for</strong>t:<br />
Duration:<br />
, Ongoing<br />
CULTURE AND RESILIENCY<br />
Create a <strong>City</strong>-wide Green Team with representation from each department to lead sustainability<br />
ef<strong>for</strong>ts. Many staff noted the desire to participate in a <strong>for</strong>mal group that was moving sustainability<br />
work <strong>for</strong>ward within the <strong>City</strong>. A Green Team would ensure there is a group accountable <strong>for</strong> identifying<br />
opportunities and supporting implementation.<br />
Provide incentives <strong>for</strong> sustainability-based professional development. This may include providing<br />
<strong>for</strong>mal opportunities <strong>for</strong> staff training (i.e., through sustainability associations or professional<br />
development organizations) or creating internal trainings that may be led by outside experts or staff<br />
themselves (i.e., on proper recycling, how to compost, use of digital tools, etc.). This could be<br />
coordinated by the Green Team.<br />
Recognize staff <strong>for</strong> sustainable decision-making. Either through the existing staff rewards and<br />
recognition program (i.e., Kazoo) or through developing another recognition plat<strong>for</strong>m (e.g.,<br />
‘<strong>Sustainability</strong> Star of the Quarter’), a rewards program can be a useful driver <strong>for</strong> behavioral change.<br />
This could be managed by the Green Team.<br />
Department: <strong>City</strong> Manager’s Office<br />
Impact:<br />
Ef<strong>for</strong>t:<br />
Duration:<br />
, Ongoing<br />
Department: <strong>City</strong> Manager’s Office; Human<br />
Resources<br />
Impact:<br />
Ef<strong>for</strong>t:<br />
Duration:<br />
, Ongoing<br />
Department: Human Resources<br />
Impact:<br />
Ef<strong>for</strong>t:<br />
Duration:<br />
, Ongoing<br />
346
Second Tier Recommendations<br />
ENERGY AND WATER USE<br />
Improve air quality in buildings through policies and purchasing. Improved indoor air quality can<br />
result from multiple actions that the <strong>City</strong> can take: 1) improving air flow in buildings through the use<br />
of fans or the ability to open windows; 2) ensuring cleaning staff and contractors are using lowtoxicity<br />
cleaning products; 3) developing a policy that requires only low- or no-VOC materials<br />
(furniture, carpets, paint, etc.) be used in <strong>City</strong> facilities.<br />
Develop a <strong>City</strong>-wide environmental management system (EMS) that is fully integrated and<br />
operational across all facilities. An EMS will establish a system and allow <strong>for</strong> the real-time tracking,<br />
monitoring, and communication of environmental policies, procedures, trainings, and data<br />
throughout <strong>City</strong> facilities and operations.<br />
Ensure facilities cleaning contractors are utilizing sustainable practices. This includes both<br />
ensuring that contractors are using sustainable and low-toxicity products and materials in their<br />
work in <strong>City</strong> buildings, and also that recycling and other waste diversion activities are prioritized.<br />
Require that new <strong>City</strong> infrastructure projects be evaluated <strong>for</strong> environmental and social impacts.<br />
A sustainability checklist/assessment <strong>for</strong> <strong>City</strong> infrastructure projects that can be used as a decisionmaking<br />
tool is a key way to guide staff on conducting and evaluation <strong>for</strong> social and environmental<br />
impacts of projects. This could include staff training to encourage systematic use of the Triple<br />
Bottom Line Scan <strong>for</strong> decision making. Additionally, updating the Transportation Master <strong>Plan</strong> to<br />
include requirements <strong>for</strong> sustainable practices in public works projects will ensure this policy is<br />
followed.<br />
WASTE DIVERSION<br />
Develop a policy <strong>for</strong> recycling electronic office equipment and other hard to recycle items. Many<br />
items and materials are recyclable but cannot be placed in a traditional recycling bin to be recycled<br />
properly. The <strong>City</strong> should ensure that all materials that are recyclable (e.g., electronics [including<br />
computers, cell phones, media, etc.), chemicals and paints, oils, etc.). are diverted from the landfill<br />
Department: Facilities<br />
Impact:<br />
Ef<strong>for</strong>t:<br />
Duration:<br />
, Ongoing<br />
Department: <strong>City</strong> Manager’s Office<br />
Impact:<br />
Ef<strong>for</strong>t:<br />
Duration:<br />
, Ongoing<br />
Department: Facilities<br />
Impact:<br />
Ef<strong>for</strong>t:<br />
Duration:<br />
Department: Community Development;<br />
Public Works<br />
Impact:<br />
Ef<strong>for</strong>t:<br />
Duration:<br />
, Ongoing<br />
Department: Facilities<br />
Impact:<br />
Ef<strong>for</strong>t:<br />
Duration:<br />
347
y establishing relationships with proper recycling entities and providing facilities and<br />
training/education <strong>for</strong> staff to recycle these items properly.<br />
Develop a municipal policy and procedure to consider life-cycle costs in procurement. The <strong>City</strong><br />
may establish an online decision-making tree <strong>for</strong> staff to look at be<strong>for</strong>e purchasing and develop<br />
guidelines <strong>for</strong> RFP and purchasing processes that ensure that sustainability of a material or service is<br />
considered as a scoring criterion when making a purchasing decision. Many peer communities have<br />
policies that could be considered as an example of a starting point.<br />
Develop waste reduction and diversion policies that are aligned with zero-waste practices and<br />
include green standards. This may include employee-based programs such as implementing a<br />
recycling challenge across <strong>City</strong> facilities, building floors, or departments. The <strong>City</strong> may also consider<br />
an office-supply exchange program, where unused or gently-used office supplies that are no longer<br />
needed by one employee/department can be reused by another. A key component to any waste<br />
reduction program will be education and training <strong>for</strong> staff.<br />
CULTURE AND RESILIENCY<br />
Develop a program <strong>for</strong> employees that provides sustainable education, training, and incentives.<br />
Education, training, and providing incentives <strong>for</strong> behavior change are key components to getting<br />
staff excited and engaged in the <strong>City</strong>’s internal sustainability ef<strong>for</strong>ts. The Green Team may be the<br />
ideal group to facilitate an education and training program, in collaboration with the Human<br />
Resources department or other staff training programs.<br />
Establish an employee donation or volunteer program. While not directly related to sustainability,<br />
providing staff with the opportunity to give back to their community through a donation or volunteer<br />
program is an effective way to increase staff morale and create and improve a culture of service<br />
within the organization.<br />
Department: <strong>City</strong> Manager’s Office;<br />
Purchasing<br />
Impact:<br />
Ef<strong>for</strong>t:<br />
Duration:<br />
Department: <strong>City</strong> Manager’s Office<br />
Impact:<br />
Ef<strong>for</strong>t:<br />
Duration:<br />
Department: Human Resources<br />
Impact:<br />
Ef<strong>for</strong>t:<br />
Duration:<br />
, Ongoing<br />
Department: Human Resources<br />
Impact:<br />
Ef<strong>for</strong>t:<br />
Duration: Ongoing<br />
348
Third Tier Recommendations<br />
ENERGY AND WATER USE<br />
Improve building efficiency (e.g., weatherize buildings, install automatic light switches and smart<br />
thermostats, retrofit <strong>City</strong> facilities with high efficiency (HE) plumbing fixtures and appliances,<br />
lighting, and HVAC in existing buildings). Many staff interviews and survey responses noted the<br />
need to improve building operational efficiency both to reduce energy use and improve occupant<br />
com<strong>for</strong>t. The Facilities team at <strong>Commerce</strong> <strong>City</strong> is actively working to address noted issues and<br />
starting with implementing any recommendations from the recent McKinstry building audit, as<br />
Facilities is planning to do, is a first step. Developing additional policies around building efficiency<br />
and the replacement of equipment and technology with high-efficiency options may be supportive<br />
of this ef<strong>for</strong>t.<br />
Implement Xeriscaping (i.e., create Xeriscape demonstration gardens on <strong>City</strong> land; convert turf to<br />
native grasses; plant more trees on <strong>City</strong>-owned properties). Utilizing Xeriscape design techniques<br />
can help to reduce water use on <strong>City</strong> properties and infrastructure, while also providing useful pilot<br />
and demonstration sites <strong>for</strong> low-impact development that can be used to communicate these<br />
design principals and any <strong>for</strong>thcoming requirements in <strong>City</strong> development code to project<br />
developers in the community. Pinyon Environmental, which are supporting the Water Quality scope<br />
of work in the Environmental Consulting Services contract, is currently working with <strong>City</strong> staff to<br />
identify sites and projects that may be useful <strong>for</strong> a low-impact development demonstration site,<br />
which could include Xeriscaping.<br />
Identify and develop projects to expand local renewable energy generation and use on <strong>City</strong><br />
facilities and land. The use of renewable energy, including on-site solar, to power <strong>City</strong> facilities and<br />
infrastructure is one of the most immediate and effective ways to reduce the environmental impact<br />
of the <strong>City</strong>’s daily operations. The <strong>City</strong> should consider rooftop space, open pieces of land, and other<br />
resources (e.g., geothermal or wind resources) that may be appropriate to deploy <strong>for</strong> a renewable<br />
energy project. Working closely with the <strong>City</strong>’s utilities will be necessary <strong>for</strong> project success. The <strong>City</strong><br />
could consider outright ownership of a renewable energy system, leasing a system, a power<br />
purchase agreement with a solar provider, or another model deemed appropriate in conversations<br />
with utility providers and renewable technology companies.<br />
Department: Facilities<br />
Impact:<br />
Ef<strong>for</strong>t:<br />
Duration:<br />
, Ongoing<br />
Department: Facilities; Parks, Recreation,<br />
and Golf<br />
Impact:<br />
Ef<strong>for</strong>t:<br />
Duration:<br />
, Ongoing<br />
Department: <strong>Plan</strong>ning; Facilities<br />
Impact:<br />
Ef<strong>for</strong>t:<br />
Duration:<br />
349
Develop a <strong>City</strong>-wide municipal GHG inventory and set targets <strong>for</strong> emissions reduction and<br />
climate action. Without knowing the <strong>City</strong>’s baseline GHG emissions, it is impossible to know whether<br />
any of the other recommended policies or strategies result in emissions reductions. Additionally,<br />
setting climate action and emissions reductions goals sends a strong signal to the community and<br />
to staff about the importance of this work.<br />
Adopt a policy that all new <strong>City</strong> facilities or major renovations will be built to a high-efficiency<br />
standard (e.g., LEED).<br />
TRANSPORTATION<br />
Incorporate electric vehicles through right-timing purchases with a planned vehicle replacement<br />
schedule. Introduce electric and hybrid vehicles into the fleet and invest in the charging<br />
infrastructure needed to support electric vehicles. After investments in renewable energy,<br />
transitioning to a cleaner and greener fleet is a clear way to reduce carbon emissions and improve<br />
air quality. If appropriate models of fleet vehicles (e.g., sedans) are replaced with electric vehicles<br />
(EVs) and powered by carbon-free energy (e.g., solar), the environmental impact of these vehicles’<br />
operation is near to zero. As the <strong>City</strong> looks at the opportunity to renew its lease with Enterprise <strong>for</strong> the<br />
current fleet, significant consideration should be given to the ability to achieve green fleet objectives<br />
through this tool, and what other opportunities there may be to green the fleet by investing in EVs.<br />
While EVs sometimes come with a higher upfront cost (which can in some cases be offset by<br />
grants), the operational cost of these vehicles is much lower.<br />
Department: Community Development;<br />
<strong>City</strong> Managers Office<br />
Impact:<br />
Ef<strong>for</strong>t:<br />
Duration:<br />
, Ongoing<br />
Department: Facilities<br />
Impact:<br />
Ef<strong>for</strong>t:<br />
Duration:<br />
Department: Fleet<br />
Impact:<br />
Ef<strong>for</strong>t:<br />
Duration:<br />
, Ongoing<br />
In addition to vehicle replacements, the <strong>City</strong> should consider installing a networking of charging<br />
infrastructure to power any fleet vehicles and also provide access to charging <strong>for</strong> employees or<br />
members of the public that visit <strong>City</strong> facilities. Grants and support <strong>for</strong> both the purchase of EVs and<br />
the installation of charging stations are available through the Regional Air Quality Council’s Charge<br />
Ahead Colorado program.<br />
Work to obtain the Government Fleet and American Public Works Association Leading Fleets<br />
Award. This award recognizes public sector fleets leadership, efficiency, and vision. Staff noted this<br />
as a goal to strive <strong>for</strong> and a useful framework <strong>for</strong> how to approach the green fleet transition.<br />
Department: Fleet<br />
Impact:<br />
Ef<strong>for</strong>t:<br />
Duration:<br />
350
WASTE DIVERSION<br />
Develop a policy to increase construction recycling <strong>for</strong> <strong>City</strong>-funded projects. Construction and<br />
Demolition (C&D) projects result in a large amount of waste being produced; while a large portion of<br />
that waste can be diverted from the landfill, it frequently is not due to a lack of infrastructure or<br />
policy requiring such diversion. <strong>City</strong>-funded C&D projects, including Public Works projects, should<br />
require that waste diversion by prioritized by contractors completing the work, and the evaluation of<br />
potential bids should include a scoring metric <strong>for</strong> the ability to divert waste.<br />
CULTURE AND RESILIENCY<br />
Diversify staff. Comments from staff surveys illustrated that there is a level of concern regarding<br />
how well the current <strong>City</strong> staff represent the broader <strong>Commerce</strong> <strong>City</strong> community in terms of culture,<br />
race, and heritage. A need <strong>for</strong> more Spanish-speaking staff was specifically noted by multiple<br />
interviewees and survey respondents. From a sustainability and resiliency perspective, ensuring that<br />
the civil servants that are accountable to the community reflect that community and their lived<br />
experiences is important to creating space <strong>for</strong> community-drive dialogue and public participation.<br />
Develop a sustainability or innovation grant program <strong>for</strong> staff to implement and make operations<br />
more sustainable. Providing staff the opportunity to identify potential projects in the sustainability,<br />
resiliency, or innovation spaces (i.e., operational efficiency, employee well-being, etc.) is a unique<br />
and effective way to create a culture of sustainability and innovation and allow <strong>for</strong> a more engaged<br />
and invested staff community. The <strong>City</strong> could facilitate a mini-grant program where staff can<br />
propose small projects (e.g., those up to $2,000, or another limit deemed appropriate) that will<br />
improve organizational sustainability, efficiency, or general culture. The Green Team could help to<br />
facilitate this program.<br />
Department: Community Development;<br />
Public Works; Facilities<br />
Impact:<br />
Ef<strong>for</strong>t:<br />
Duration:<br />
Department: <strong>City</strong> Manager’s Office; Human<br />
Resources<br />
Impact:<br />
Ef<strong>for</strong>t:<br />
Duration:<br />
, Ongoing<br />
Department: <strong>City</strong> Manager’s Office<br />
Impact:<br />
Ef<strong>for</strong>t:<br />
Duration:<br />
, Ongoing<br />
351
Future Recommendations to Consider<br />
Throughout conversations with staff and analyzing the survey data, it is recommended to consider the following<br />
opportunities once certain parameters are in place.<br />
• As infrastructure improves (i.e., transit access increases or development around <strong>City</strong> facilities increases to<br />
facilitate non-vehicular trips), reduce vehicle miles travelled <strong>for</strong> business purposes by incentivizing alternatives<br />
<strong>for</strong> getting around such as walking, biking, carpooling, and taking public transit.<br />
• As technology advances, convert municipal small engines, such as lawn and garden equipment, to be fossil<br />
fuel free.<br />
• Once more data is collected, enhance the traffic operations center equipment to be more efficient.<br />
• As buildings become more efficient and occupant com<strong>for</strong>t improves, ban the use of space heaters.<br />
Data Collection<br />
Through research of best practices in other municipalities, it is clear that an integral component of organizational<br />
sustainability work is to develop metrics and collet data prior to implementing policies or strategies; this allows one to<br />
measure the action against the baseline and the intended result. Below are some opportunities <strong>for</strong> this:<br />
• <strong>City</strong>wide:<br />
o Collect data to start building climate action plans and goals. This will help prioritize the following data and<br />
allow <strong>for</strong> the setting of metrics and a timeline.<br />
• Energy and Water Use:<br />
352
o<br />
o<br />
Develop a <strong>City</strong>wide building assessment to identify strategies and determine opportunities <strong>for</strong> building<br />
efficiency. Adopt green building standards <strong>for</strong> <strong>City</strong> facilities and establish policies that increase the<br />
efficiency of all new buildings.<br />
Gather system-wide data on municipal uses of water and identify efficiency opportunities to incorporate<br />
into policies and standard operating procedures.<br />
o Conduct regular water and energy audits in all facilities.<br />
• Transportation:<br />
o Conduct a fleet analysis to determine types of cars and opportunities <strong>for</strong> efficiency.<br />
• Waste:<br />
o Conduct a waste analysis <strong>for</strong> municipal buildings and improve waste data collection and tracking to<br />
evaluate life-cycle costs in planning and procurement.<br />
• Funding:<br />
o Explore third party financing models and credit systems <strong>for</strong> clean energy projects to offset <strong>City</strong> facility<br />
energy use (e.g., on-site solar, community solar, purchase RECs, etc.).<br />
353
354