

Water Framework Directive Marine Plants Task Team Tools Paper ...
Water Framework Directive Marine Plants Task Team Tools Paper ...
Water Framework Directive Marine Plants Task Team Tools Paper ...

You also want an ePaper? Increase the reach of your titles
YUMPU automatically turns print PDFs into web optimized ePapers that Google loves.
Table 3: Calculation of ‘deshoring’ factor for all possible shore description values<br />
based on the predicted levels of species richness<br />
Species Richness<br />
120<br />
100<br />
80<br />
60<br />
40<br />
20<br />
0<br />
Shore Predicted Deshoring<br />
Description Richness factor<br />
5 29.69 2.06<br />
6 31.40 1.94<br />
7 33.32 1.83<br />
8 35.50 1.72<br />
9 37.96 1.61<br />
10 40.73 1.50<br />
11 43.87 1.39<br />
12 47.41 1.29<br />
13 51.42 1.19<br />
14 55.94 1.09<br />
15 61.04 1.00<br />
16 66.81 0.91<br />
17 73.33 0.83<br />
18 80.69 0.76<br />
19 89.01 0.69<br />
20 98.40 0.62<br />
6 8 10 12 14 16 18 20<br />
Shore Description<br />
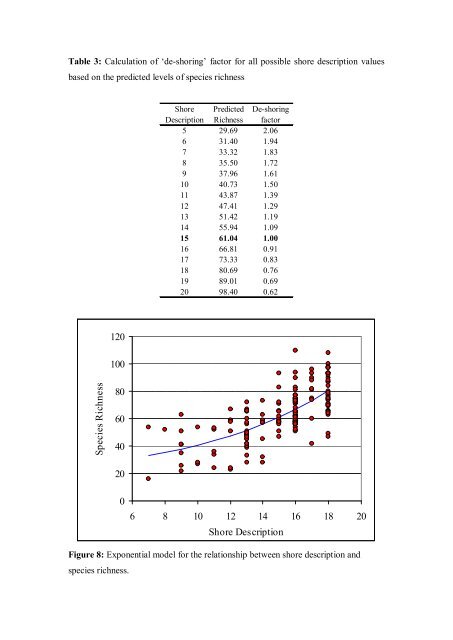
Figure 8: Exponential model for the relationship between shore description and<br />
species richness.


