Environmental Internship Program - 2023 Booklet
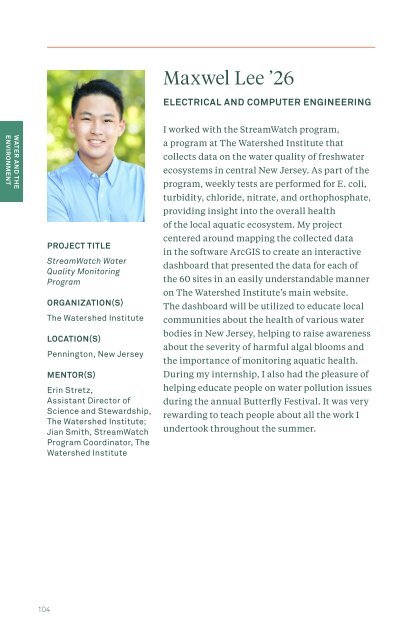
Maxwel Lee ’26 ELECTRICAL AND COMPUTER ENGINEERING WATER AND THE ENVIRONMENT PROJECT TITLE StreamWatch Water Quality Monitoring Program ORGANIZATION(S) The Watershed Institute LOCATION(S) Pennington, New Jersey MENTOR(S) Erin Stretz, Assistant Director of Science and Stewardship, The Watershed Institute; Jian Smith, StreamWatch Program Coordinator, The Watershed Institute I worked with the StreamWatch program, a program at The Watershed Institute that collects data on the water quality of freshwater ecosystems in central New Jersey. As part of the program, weekly tests are performed for E. coli, turbidity, chloride, nitrate, and orthophosphate, providing insight into the overall health of the local aquatic ecosystem. My project centered around mapping the collected data in the software ArcGIS to create an interactive dashboard that presented the data for each of the 60 sites in an easily understandable manner on The Watershed Institute’s main website. The dashboard will be utilized to educate local communities about the health of various water bodies in New Jersey, helping to raise awareness about the severity of harmful algal blooms and the importance of monitoring aquatic health. During my internship, I also had the pleasure of helping educate people on water pollution issues during the annual Butterfly Festival. It was very rewarding to teach people about all the work I undertook throughout the summer. 104
Christopher Li ’26 CIVIL AND ENVIRONMENTAL ENGINEERING PROJECT TITLE StreamWatch Water Quality Monitoring Program ORGANIZATION(S) The Watershed Institute LOCATION(S) Pennington, New Jersey MENTOR(S) Erin Stretz, Assistant Director of Science and Stewardship, The Watershed Institute; Jian Smith, StreamWatch Program Coordinator, The Watershed Institute The StreamWatch program at The Watershed Institute collects data on the water quality of freshwater ecosystems in central New Jersey by performing weekly tests for E. coli, turbidity, chlorides, nitrates and orthophosphates. These tests can give insight into the overall health of the local aquatic ecosystem. My project focused on using the software ArcGIS StoryMaps to create an interactive webpage about the Stony Brook-Millstone Watershed. This resource allows visitors to view water quality data from 60 sites monitored by the StreamWatch program and to learn about different forms of water pollution and current threats to the ecosystem. In addition to its value as an educational asset, data insights from this resource offer a foundation for The Watershed Institute to recommend and implement environmental initiatives to protect and restore natural habitats. Through this internship, I gained experience in ArcGIS and learned how to operate various laboratory equipment utilized in the testing of water samples. The experience also allowed me to cultivate a personal interest in developing solutions to aquatic ecosystem threats. WATER AND THE ENVIRONMENT 105
- Page 53 and 54: Sava Evangelista ’26 COMPUTER SCI
- Page 55 and 56: Alliyah Gregory ’25 ECOLOGY AND E
- Page 57 and 58: Noe Iwasaki ’26 UNDECLARED PROJEC
- Page 59 and 60: Chien Nguyen ’25 COMPUTER SCIENCE
- Page 61 and 62: Martina Qua ’25 CIVIL AND ENVIRON
- Page 63 and 64: Angelica She ’26 CIVIL AND ENVIRO
- Page 65 and 66: Sarina Wen ’26 CHEMICAL AND BIOLO
- Page 67 and 68: Rees Barnes ’26 ELECTRICAL AND CO
- Page 69 and 70: Leilani Bender ’24 CIVIL AND ENVI
- Page 71 and 72: Yagiz Devre ’26 COMPUTER SCIENCE
- Page 73 and 74: Helena Frudit ’25 MECHANICAL AND
- Page 75 and 76: John Kim ’25 PHYSICS Certificates
- Page 77 and 78: Nicholas Lim ’24 SCHOOL OF PUBLIC
- Page 79 and 80: Stephane Morel ’25 ELECTRICAL AND
- Page 81 and 82: Chloe Park ’25 CHEMISTRY Certific
- Page 83 and 84: Azhar Razin ’26 CHEMICAL AND BIOL
- Page 85 and 86: Maya Avida ’26 PHYSICS Certificat
- Page 87 and 88: Rebecca Cho ’26 GEOSCIENCES OCEAN
- Page 89 and 90: Dylan Epstein-Gross ’25 COMPUTER
- Page 91 and 92: Lindsay Anne Pagaduan ’26 CHEMIST
- Page 93 and 94: Sophia Villacorta ’24 GEOSCIENCES
- Page 95 and 96: Tienne Yu ’26 MOLECULAR BIOLOGY O
- Page 97 and 98: Braeden Carroll ’26 CIVIL AND ENV
- Page 99 and 100: Ashley DeFrates ’25 CIVIL AND ENV
- Page 101 and 102: PROJECT TITLE Molecular Simulation
- Page 103: Wiley Kohler ’25 MATHEMATICS PROJ
- Page 107 and 108: Alyssa Ritchie ’25 CHEMISTRY Cert
- Page 109 and 110: Acknowledgments FUNDING FOR THE 202
Maxwel Lee ’26<br />
ELECTRICAL AND COMPUTER ENGINEERING<br />
WATER AND THE<br />
ENVIRONMENT<br />
PROJECT TITLE<br />
StreamWatch Water<br />
Quality Monitoring<br />
<strong>Program</strong><br />
ORGANIZATION(S)<br />
The Watershed Institute<br />
LOCATION(S)<br />
Pennington, New Jersey<br />
MENTOR(S)<br />
Erin Stretz,<br />
Assistant Director of<br />
Science and Stewardship,<br />
The Watershed Institute;<br />
Jian Smith, StreamWatch<br />
<strong>Program</strong> Coordinator, The<br />
Watershed Institute<br />
I worked with the StreamWatch program,<br />
a program at The Watershed Institute that<br />
collects data on the water quality of freshwater<br />
ecosystems in central New Jersey. As part of the<br />
program, weekly tests are performed for E. coli,<br />
turbidity, chloride, nitrate, and orthophosphate,<br />
providing insight into the overall health<br />
of the local aquatic ecosystem. My project<br />
centered around mapping the collected data<br />
in the software ArcGIS to create an interactive<br />
dashboard that presented the data for each of<br />
the 60 sites in an easily understandable manner<br />
on The Watershed Institute’s main website.<br />
The dashboard will be utilized to educate local<br />
communities about the health of various water<br />
bodies in New Jersey, helping to raise awareness<br />
about the severity of harmful algal blooms and<br />
the importance of monitoring aquatic health.<br />
During my internship, I also had the pleasure of<br />
helping educate people on water pollution issues<br />
during the annual Butterfly Festival. It was very<br />
rewarding to teach people about all the work I<br />
undertook throughout the summer.<br />
104


