Assessing high growth firms in Kenya, Ethiopia, and Rwanda
We spotlight high growth firms in the context of all activity conducted by startups and scaleups in these countries.
We spotlight high growth firms in the context of all activity conducted by startups and scaleups in these countries.

You also want an ePaper? Increase the reach of your titles
YUMPU automatically turns print PDFs into web optimized ePapers that Google loves.
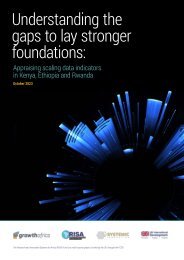
<strong>Assess<strong>in</strong>g</strong> <strong>high</strong> <strong>growth</strong><br />
<strong>firms</strong> <strong>in</strong> <strong>Kenya</strong>, <strong>Ethiopia</strong>,<br />
<strong>and</strong> Rw<strong>and</strong>a<br />
Build<strong>in</strong>g data basel<strong>in</strong>es to help guide future leaps<br />
December 2023<br />
The Research <strong>and</strong> Innovation Systems for Africa (RISA) Fund is a multi-country project, funded by the UK, through the FCDO
Contents<br />
Our Approach 3<br />
Evaluat<strong>in</strong>g High Growth 3<br />
Key Insights 4<br />
<strong>Kenya</strong> snapshot 5<br />
<strong>Ethiopia</strong> snapshot 11<br />
Rw<strong>and</strong>a snapshot 19<br />
What to measure <strong>in</strong> the future 26<br />
In this report, we spotlight <strong>high</strong> <strong>growth</strong> <strong>firms</strong> <strong>Kenya</strong>, <strong>Ethiopia</strong> <strong>and</strong> Rw<strong>and</strong>a,<br />
<strong>and</strong> nest <strong>in</strong> the context of all activity conducted by startups <strong>and</strong> scaleups <strong>in</strong><br />
these countries. Access to robust data is varied across the three nations; this<br />
report seeks to apply available data to <strong>high</strong>light opportunities for augmented<br />
underst<strong>and</strong><strong>in</strong>g of <strong>high</strong> <strong>growth</strong> <strong>and</strong> <strong>in</strong>novation ecosystems, which <strong>in</strong> turn<br />
contributes to economic <strong>growth</strong>, <strong>and</strong> <strong>high</strong> quality job creation. The report<br />
po<strong>in</strong>ts out where data is miss<strong>in</strong>g which dem<strong>and</strong>s a more jo<strong>in</strong>ed up approach<br />
to venture <strong>and</strong> ecosystem data curation to address gaps <strong>and</strong> market failures<br />
stemm<strong>in</strong>g from <strong>in</strong>formation asymmetries.<br />
This <strong>in</strong>sight report is the third of a series produced by GrowthAfrica <strong>and</strong><br />
Systemic Innovation under a FCDO-funded Research <strong>and</strong> Innovation Systems<br />
for Africa (RISA) Fund project to conceptualise, design <strong>and</strong> launch a scalable<br />
<strong>and</strong> replicable model for a data observatory for scal<strong>in</strong>g commercial ventures <strong>in</strong><br />
<strong>Kenya</strong>, <strong>Ethiopia</strong> <strong>and</strong> Rw<strong>and</strong>a.
PAGE. 3<br />
<strong>Assess<strong>in</strong>g</strong> <strong>high</strong><br />
<strong>growth</strong> <strong>firms</strong> <strong>in</strong> <strong>Kenya</strong>,<br />
<strong>Ethiopia</strong>, <strong>and</strong> Rw<strong>and</strong>a:<br />
build<strong>in</strong>g data basel<strong>in</strong>es<br />
to help guide future<br />
leaps.<br />
Insight report<br />
No. 3<br />
Our Approach<br />
To develop this report we assessed, then aggregated, data from a range of sources, <strong>in</strong>clud<strong>in</strong>g<br />
Dealroom, the Rw<strong>and</strong>a Development Board (RDB), Shega Insights, Village Capital, GALI,<br />
<strong>and</strong> Somo Africa to build a mosaic of data coverage across <strong>Kenya</strong>, <strong>Ethiopia</strong> <strong>and</strong> Rw<strong>and</strong>a.<br />
Aggregat<strong>in</strong>g data from numerous sources - rather than one platform provider - enables a more<br />
complete underst<strong>and</strong><strong>in</strong>g of ecosystem activity.<br />
Far from aim<strong>in</strong>g to be comprehensive, this report aims to provide a series of snapshots to show<br />
both how data can be used to better underst<strong>and</strong> <strong>high</strong> <strong>growth</strong> startup <strong>and</strong> scaleup ecosystems,<br />
<strong>and</strong> where gaps exist <strong>in</strong> the current data l<strong>and</strong>scape, to motivate enhanced collective action.<br />
Vast differences exist across the countries we are exam<strong>in</strong><strong>in</strong>g (especially <strong>in</strong> terms of <strong>in</strong>vestment<br />
<strong>and</strong> ecosystem development). A very large proportion of the <strong>firms</strong> <strong>in</strong> the countries we cover are<br />
micro enterprises - only a very small fraction can be considered <strong>high</strong>-<strong>growth</strong> ventures (those<br />
that transition from startup to scaleup). We have started to pa<strong>in</strong>t a picture of how <strong>high</strong> <strong>growth</strong><br />
ecosystems are constructed, however, we are also aware that the underst<strong>and</strong><strong>in</strong>g presented<br />
through this report is not perfect, call<strong>in</strong>g for a unified, <strong>and</strong> jo<strong>in</strong>ed up approach to data curation<br />
<strong>and</strong> dissem<strong>in</strong>ation <strong>in</strong> the future. This is the start, not the end of the journey.<br />
Evaluat<strong>in</strong>g High Growth<br />
The OECD’s framework is commonly used as a start<strong>in</strong>g po<strong>in</strong>t to underst<strong>and</strong> <strong>high</strong> <strong>growth</strong><br />
ventures, namely: a level of <strong>growth</strong> (revenues <strong>and</strong>/or employment) over a fixed period of time)<br />
We po<strong>in</strong>t to work done by lead<strong>in</strong>g a ScaleUp Institute 1 which further classify venture <strong>growth</strong> as<br />
follows:<br />
• ‘Scalers’: companies with average annualised <strong>growth</strong> greater than 10% per annum, over a<br />
three year period, with ten or more employees at the beg<strong>in</strong>n<strong>in</strong>g of the observation period.<br />
• High Growth Firms (HGFs): companies with average annualised <strong>growth</strong> greater than 20%<br />
per annum, over this three-year period, with ten or more employees at the beg<strong>in</strong>n<strong>in</strong>g of the<br />
observation period.<br />
• Consistent HGFs: companies with average annualised <strong>growth</strong> greater than 20% per<br />
annum, over this three-year period, <strong>and</strong> have grown 20% or more for at least two out of<br />
three years, with ten or more employees at the beg<strong>in</strong>n<strong>in</strong>g of the observation period.<br />
• Hyper-growers: companies with average annualised <strong>growth</strong> greater than 40% per annum,<br />
over this three-year period, <strong>and</strong> have grown 40% or more for at least two out of three years,<br />
with ten or more employees at the beg<strong>in</strong>n<strong>in</strong>g of the observation period.<br />
For the purposes of this report, the data currently available limits our ability to provide this<br />
level of detailed analysis apply<strong>in</strong>g such classifications. We expect this to change, as our data<br />
collaborative model is developed allow<strong>in</strong>g us to dive far deeper to offer a more holistic approach<br />
to evaluat<strong>in</strong>g scal<strong>in</strong>g. We also expect to aggregate further data collected around firm-level <strong>and</strong><br />
organisational dynamics. Together this will improve the way assessments related to scal<strong>in</strong>g - as<br />
a dynamic capability - can be made <strong>in</strong> the future - across Africa.<br />
1. Crack<strong>in</strong>g the Growth Code: Traits <strong>and</strong> Strategies of High-Growth Firms <strong>in</strong> Europe. European Scaleup Monitor. European Scale Up Institute (2023).
PAGE. 4<br />
<strong>Assess<strong>in</strong>g</strong> <strong>high</strong><br />
<strong>growth</strong> <strong>firms</strong> <strong>in</strong> <strong>Kenya</strong>,<br />
<strong>Ethiopia</strong>, <strong>and</strong> Rw<strong>and</strong>a:<br />
build<strong>in</strong>g data basel<strong>in</strong>es<br />
to help guide future<br />
leaps.<br />
Insight report<br />
No. 3<br />
Key <strong>in</strong>sights<br />
→ In <strong>Kenya</strong>, the presence of eight future unicorns <strong>high</strong>lights a thriv<strong>in</strong>g ecosystem with <strong>high</strong><br />
<strong>growth</strong> potential. The 440 fund<strong>in</strong>g rounds s<strong>in</strong>ce 2015, amount<strong>in</strong>g to $1.8 billion, <strong>and</strong> a<br />
robust ecosystem value of $7.8 billion underscore the attractiveness of <strong>Kenya</strong>’s startup<br />
l<strong>and</strong>scape. The significant number of employees <strong>in</strong> <strong>high</strong> <strong>growth</strong>, or <strong>high</strong> <strong>growth</strong> potential<br />
startups <strong>and</strong> scaleups (c13,000, or c171k employees <strong>in</strong> the ecosystem more broadly)<br />
further emphasises the ecosystem’s impact on job creation.<br />
→ Rw<strong>and</strong>a is significantly smaller, but demonstrates a steady evolution with 17 fund<strong>in</strong>g<br />
rounds s<strong>in</strong>ce 2015, total<strong>in</strong>g $12 million. The value of exits at $48.1 million <strong>in</strong>dicates a<br />
grow<strong>in</strong>g maturity, <strong>and</strong> the 800 employees reflect the sector’s contribution to employment.<br />
The ecosystem value of $115 million suggests a nascent but promis<strong>in</strong>g environment,<br />
although the number of <strong>high</strong> <strong>growth</strong> startups founded s<strong>in</strong>ce 2013 (48) <strong>in</strong>dicates a more<br />
gradual <strong>growth</strong> trajectory compared to <strong>Kenya</strong>.<br />
→ <strong>Ethiopia</strong> exhibits a similar number of fund<strong>in</strong>g rounds (17) s<strong>in</strong>ce 2015, with a total fund<strong>in</strong>g<br />
of $43.7 million. The number of <strong>high</strong> <strong>growth</strong> startups founded s<strong>in</strong>ce 2013 (39) suggests a<br />
develop<strong>in</strong>g, but still embryonic ecosystem.<br />
There are vary<strong>in</strong>g degrees of data availability across these countries. While data for <strong>Kenya</strong><br />
is more comprehensive from sources like Dealroom enabl<strong>in</strong>g a deeper underst<strong>and</strong><strong>in</strong>g of its<br />
<strong>high</strong>-<strong>growth</strong> sectors Rw<strong>and</strong>a <strong>and</strong> <strong>Ethiopia</strong> show gaps particularly <strong>in</strong> the number of new funds<br />
<strong>and</strong> certa<strong>in</strong> ecosystem metrics. Conversely, while lead<strong>in</strong>g global data aggregators primarily<br />
scrape publicly available <strong>in</strong>formation their access to local data may be constra<strong>in</strong>ed <strong>in</strong> markets<br />
with lesser <strong>in</strong>vestment. Data discrepancies <strong>in</strong> market data are anticipated <strong>and</strong> can be starkly<br />
illustrated by way of example <strong>in</strong> the chart below assess<strong>in</strong>g employment <strong>in</strong> <strong>high</strong> <strong>growth</strong> startups<br />
(i.e for <strong>Ethiopia</strong>, there are approximately 2,200 jobs created, rather than 81). This underscores<br />
the critical importance of secur<strong>in</strong>g data <strong>in</strong>puts from local providers to ensure a more<br />
comprehensive <strong>and</strong> accurate market representation.<br />
Table 1: Ecosystem characteristics for <strong>Kenya</strong>n, <strong>Ethiopia</strong>n, <strong>and</strong> Rw<strong>and</strong>an <strong>high</strong> <strong>growth</strong> economies<br />
<strong>Kenya</strong> Rw<strong>and</strong>a <strong>Ethiopia</strong><br />
Number of unicorns 0 0 0<br />
Number of future unicorns 8 0 0<br />
Number of fund<strong>in</strong>g rounds s<strong>in</strong>ce 2015 440 17 17<br />
Fund<strong>in</strong>g s<strong>in</strong>ce 2015 ($mn) 1800 12 43.7<br />
Value of exits s<strong>in</strong>ce 2015 ($mn) 632 48.1 510<br />
Number of employees 13,000 800<br />
81*<br />
(c.f. above)<br />
Ecosystem value ($mn) 7,800 115 214<br />
Number of <strong>high</strong> <strong>growth</strong> startups founded s<strong>in</strong>ce 2013 591 48 39<br />
Number of <strong>high</strong> <strong>growth</strong> startups 785 63 43<br />
(Source: Dealroom, 2023)
PAGE. 5<br />
<strong>Assess<strong>in</strong>g</strong> <strong>high</strong><br />
<strong>growth</strong> <strong>firms</strong> <strong>in</strong> <strong>Kenya</strong>,<br />
<strong>Ethiopia</strong>, <strong>and</strong> Rw<strong>and</strong>a:<br />
build<strong>in</strong>g data basel<strong>in</strong>es<br />
to help guide future<br />
leaps.<br />
Insight report<br />
No. 3<br />
<strong>Kenya</strong> snapshot<br />
In <strong>Kenya</strong>, the ecosystem has undergone significant transformation <strong>and</strong> uplift<br />
<strong>in</strong> recent years. Growth suggests a favourable environment for attract<strong>in</strong>g<br />
substantial scal<strong>in</strong>g fund<strong>in</strong>g, <strong>and</strong> captur<strong>in</strong>g <strong>growth</strong> - as evidenced by the 440<br />
fund<strong>in</strong>g rounds conducted s<strong>in</strong>ce 2015. The frequent <strong>in</strong>jection of capital,<br />
total<strong>in</strong>g $1.8 billion, <strong>in</strong>dicates an emergent <strong>and</strong> matur<strong>in</strong>g ecosystem.<br />
The value of exits, total<strong>in</strong>g $632 million s<strong>in</strong>ce 2015, <strong>in</strong>dicates the relative maturity of the<br />
ecosystem, with successful acquisitions <strong>and</strong> IPOs contribut<strong>in</strong>g to the overall <strong>growth</strong>, however,<br />
given the relative immaturity of the ecosystem on a global basis, it could be argued that<br />
the oft discussed ‘flywheel’ (of <strong>in</strong>vestment, <strong>growth</strong>, <strong>and</strong> realisations to enable re<strong>in</strong>vestment<br />
<strong>in</strong> the ecosystem) has not yet truly engaged. The number of employees <strong>in</strong> <strong>high</strong> <strong>growth</strong><br />
startups st<strong>and</strong>s at an relatively impressive level - c13,000 (of total ecosystem employment of<br />
c170k), <strong>in</strong>dicat<strong>in</strong>g a substantial job creation impact. This not only underscores the economic<br />
significance of the entrepreneurship ecosystem sector but also <strong>high</strong>lights its role <strong>in</strong> address<strong>in</strong>g<br />
employment challenges, both now, <strong>and</strong> <strong>in</strong> the future.<br />
The ecosystem’s value, currently st<strong>and</strong><strong>in</strong>g at $7.8 billion, signifies the culm<strong>in</strong>ation of various<br />
factors, <strong>in</strong>clud<strong>in</strong>g successful startups, strategic <strong>in</strong>vestments, <strong>and</strong> a supportive <strong>in</strong>frastructure.<br />
The <strong>in</strong>flux of $368 million <strong>in</strong> new funds s<strong>in</strong>ce 2015 further strengthens the f<strong>in</strong>ancial backbone of<br />
the ecosystem, provid<strong>in</strong>g a positive outlook for susta<strong>in</strong>ed <strong>growth</strong> <strong>and</strong> development.<br />
S<strong>in</strong>ce 2013, <strong>Kenya</strong> has witnessed the found<strong>in</strong>g of 591 <strong>high</strong> <strong>growth</strong> startups - <strong>in</strong> the context of<br />
an ecosystem with 2,741 startups <strong>and</strong> scaleups <strong>in</strong> operation (which is a subset of all <strong>firms</strong>). The<br />
number of <strong>high</strong> <strong>growth</strong> startups, comb<strong>in</strong>ed fund<strong>in</strong>g rounds, pa<strong>in</strong>ts a picture of a burgeon<strong>in</strong>g<br />
ecosystem with opportunities for further <strong>growth</strong>.<br />
Significant <strong>growth</strong> has been captured through firm value over the past 2 years <strong>in</strong> <strong>Kenya</strong>,<br />
represent<strong>in</strong>g approximately one third of the total ecosystem value, despite a significant drop <strong>in</strong><br />
VC <strong>in</strong>vestment (see Figure 5).<br />
High <strong>growth</strong> <strong>firms</strong> represent around 10% of total ecosystem value as of 2023, ow<strong>in</strong>g to the<br />
<strong>in</strong>fluence of <strong>high</strong> value, low <strong>growth</strong> <strong>in</strong>cumbents - this figure will be expected to rise over the next<br />
five to ten years.<br />
Look<strong>in</strong>g <strong>in</strong>itially at <strong>high</strong> <strong>growth</strong> <strong>firms</strong>, <strong>and</strong> then turn<strong>in</strong>g our attention to the startup ecosystem as<br />
a whole, we can see that <strong>Kenya</strong>’s <strong>in</strong>vestment l<strong>and</strong>scape has undergone significant change over<br />
the past decade, reflect<strong>in</strong>g not only the resilience of its economy given global macro economic<br />
conditions experienced, but also the <strong>in</strong>creas<strong>in</strong>g attractiveness of its startup, <strong>and</strong> <strong>high</strong> <strong>growth</strong><br />
sectors. In 2008, <strong>in</strong>vestment stood at $200,000, a figure that mirrored the early stages of tech<br />
development <strong>in</strong> the country. However, a notable surge occurred <strong>in</strong> 2010 with an <strong>in</strong>vestment of<br />
$905,000.
PAGE. 6<br />
<strong>Assess<strong>in</strong>g</strong> <strong>high</strong><br />
<strong>growth</strong> <strong>firms</strong> <strong>in</strong> <strong>Kenya</strong>,<br />
<strong>Ethiopia</strong>, <strong>and</strong> Rw<strong>and</strong>a:<br />
build<strong>in</strong>g data basel<strong>in</strong>es<br />
to help guide future<br />
leaps.<br />
Insight report<br />
No. 3<br />
Figure 1: Enterprise value by launch year ($mn)<br />
2015-2021 2010-2014 2005-2009 2000-2004 1995-1999 1990-1994 1900-1989<br />
12,500<br />
10,000<br />
7,500<br />
5,000<br />
2,500<br />
0<br />
2014 2015 2016 2017 2018 2019 2020 2021 2022 2023<br />
(Source: Dealroom, 2023)<br />
Figure 2: Enterprise value by valuation ($mn)<br />
$10bn+ $1.0-10bn $200mn-1bn $0-200mn<br />
12,500<br />
10,000<br />
7,500<br />
5,000<br />
2,500<br />
0<br />
2014 2015 2016 2017 2018 2019 2020 2021 2022 2023<br />
(Source: Dealroom, 2023)
PAGE. 7<br />
<strong>Assess<strong>in</strong>g</strong> <strong>high</strong><br />
<strong>growth</strong> <strong>firms</strong> <strong>in</strong> <strong>Kenya</strong>,<br />
<strong>Ethiopia</strong>, <strong>and</strong> Rw<strong>and</strong>a:<br />
build<strong>in</strong>g data basel<strong>in</strong>es<br />
to help guide future<br />
leaps.<br />
Figure 3: Employees by team size<br />
10k+ 5k-10k 1k-5k 500-1k 200-500 50-200 10-50<br />
200,000<br />
2-10<br />
Insight report<br />
No. 3<br />
150,000<br />
100,000<br />
50,000<br />
0<br />
2018 2019 2020 2021 2022 2023<br />
(Source: Dealroom, 2023)<br />
This data represents all startups <strong>and</strong> scaleups (not just those generat<strong>in</strong>g <strong>high</strong> <strong>growth</strong>), <strong>and</strong> also <strong>in</strong>cludes mature companies, hence the difference<br />
between employment numbers presented elsewhere <strong>in</strong> this report.<br />
Figure 4: Employees by company valuation<br />
$10bn+ $1.0-10bn $200mn-1bn $0-200mn<br />
200,000<br />
150,000<br />
100,000<br />
50,000<br />
0<br />
2018 2019 2020 2021 2022 2023<br />
(Source: Dealroom, 2023)<br />
This data represents all startups <strong>and</strong> scaleups (not just those generat<strong>in</strong>g <strong>high</strong> <strong>growth</strong>), <strong>and</strong> also <strong>in</strong>cludes mature companies, hence the difference<br />
between employment numbers presented elsewhere <strong>in</strong> this report.
PAGE. 8<br />
<strong>Assess<strong>in</strong>g</strong> <strong>high</strong><br />
<strong>growth</strong> <strong>firms</strong> <strong>in</strong> <strong>Kenya</strong>,<br />
<strong>Ethiopia</strong>, <strong>and</strong> Rw<strong>and</strong>a:<br />
build<strong>in</strong>g data basel<strong>in</strong>es<br />
to help guide future<br />
leaps.<br />
Insight report<br />
No. 3<br />
2013 marked a turn<strong>in</strong>g po<strong>in</strong>t with a significant jump to $7.6 million <strong>in</strong> <strong>in</strong>vestment. This spike<br />
aligns with the broader macroeconomic trends <strong>in</strong> <strong>Kenya</strong>, where the country experienced<br />
susta<strong>in</strong>ed economic <strong>growth</strong> dur<strong>in</strong>g this period. The subsequent years witnessed a consistent<br />
upward trajectory, reach<strong>in</strong>g a peak of $168 million <strong>in</strong> 2018.<br />
Several factors contribute to this upward trend. <strong>Kenya</strong>’s strong macroeconomic fundamentals,<br />
<strong>in</strong>clud<strong>in</strong>g a stable political environment, improved <strong>in</strong>frastructure, <strong>and</strong> a burgeon<strong>in</strong>g middle<br />
class, create a conducive environment for <strong>in</strong>vestment. Additionally, the government’s efforts<br />
to promote a digital economy, coupled with the rise of f<strong>in</strong>tech <strong>and</strong> mobile technology, have<br />
positioned <strong>Kenya</strong> as a hub for tech <strong>in</strong>novation <strong>in</strong> the region.<br />
The impact of COVID-19 on global economies <strong>in</strong> 2020 had a noticeable effect on <strong>in</strong>vestment,<br />
with a slight dip to $154 million. However, the rebound <strong>in</strong> 2021, with an <strong>in</strong>vestment of $178<br />
million, <strong>and</strong> the projected <strong>in</strong>crease to $207 million <strong>in</strong> 2023, <strong>in</strong>dicate the resilience <strong>and</strong> cont<strong>in</strong>ued<br />
<strong>growth</strong> of <strong>Kenya</strong>’s ecosystem.<br />
Figure 5: VC <strong>in</strong>vestment <strong>in</strong> <strong>Kenya</strong> by year <strong>and</strong> round size (ALL companies)<br />
$250mn+<br />
$0-1mn (pre-seed)<br />
$100-$250mn $40-100mn (Series C) $15-40mn (Series B) $4-15mn (Series A)<br />
$1-4mn (seed)<br />
1000.0<br />
750.0<br />
500.0<br />
250.0<br />
0.0<br />
2010 2011 2012 2013<br />
2014 2015 2016 2017 2018 2019 2020 2021 2022 2023<br />
(Source: Dealroom, 2023)<br />
<strong>Kenya</strong>’s wider startup <strong>and</strong> scaleup ecosystem, comprises 171,000 employees, <strong>and</strong><br />
experienced a slight dip from 2022 to 2023, align<strong>in</strong>g with broader trends observed <strong>in</strong> the<br />
ecosystem dur<strong>in</strong>g that period.<br />
The majority of people employed <strong>in</strong> ALL startups <strong>in</strong> <strong>Kenya</strong> are <strong>in</strong> <strong>firms</strong> valued between $0-<br />
200mn, which aligns with the early stage, <strong>high</strong>-change nature of the ecosystem.
PAGE. 9<br />
<strong>Assess<strong>in</strong>g</strong> <strong>high</strong><br />
<strong>growth</strong> <strong>firms</strong> <strong>in</strong> <strong>Kenya</strong>,<br />
<strong>Ethiopia</strong>, <strong>and</strong> Rw<strong>and</strong>a:<br />
build<strong>in</strong>g data basel<strong>in</strong>es<br />
to help guide future<br />
leaps.<br />
Insight report<br />
No. 3<br />
The proportion of <strong>in</strong>vestment from corporates <strong>and</strong> other types of equity <strong>in</strong>vestors has<br />
reduced over time, as venture capital ga<strong>in</strong>s a majority (56.1% <strong>in</strong> 2023, from 37% <strong>in</strong> 2022).<br />
Figure 6: Investment (%) by type of <strong>in</strong>vestor<br />
100<br />
Other<br />
Corporate<br />
Venture Capital<br />
75<br />
50<br />
25<br />
0<br />
2018 2019 2020 2021 2022 2023<br />
(Source: Dealroom, 2023)<br />
Investment from the US, Asia <strong>and</strong> Europe has stabilised, <strong>and</strong> <strong>in</strong>creased over the past five<br />
years. As of YTD 2023, US <strong>in</strong>vestors represent a quarter of <strong>in</strong>vestment made <strong>in</strong>to <strong>Kenya</strong>n<br />
<strong>firms</strong>, <strong>and</strong> over 35% from Europe.<br />
Figure 7: Investment (%) by location of <strong>in</strong>vestor<br />
Unknown HQ Rest of World Asia USA European Domestic<br />
100<br />
75<br />
50<br />
25<br />
0<br />
2018 2019 2020 2021 2022 2023<br />
(Source: Dealroom, 2023)
PAGE. 10<br />
<strong>Assess<strong>in</strong>g</strong> <strong>high</strong><br />
<strong>growth</strong> <strong>firms</strong> <strong>in</strong> <strong>Kenya</strong>,<br />
<strong>Ethiopia</strong>, <strong>and</strong> Rw<strong>and</strong>a:<br />
build<strong>in</strong>g data basel<strong>in</strong>es<br />
to help guide future<br />
leaps.<br />
Insight report<br />
No. 3<br />
Investment by sector<br />
<strong>Kenya</strong>’s <strong>in</strong>vestment l<strong>and</strong>scape reflects a diverse range of sectors. Firms operat<strong>in</strong>g <strong>in</strong> the energy<br />
sector witnessed a significant upsw<strong>in</strong>g, with <strong>in</strong>vestments <strong>in</strong>creas<strong>in</strong>g from $40,000 <strong>in</strong> 2011 to<br />
$144 million <strong>in</strong> 2022. This surge may be attributed to the grow<strong>in</strong>g focus on susta<strong>in</strong>able <strong>and</strong><br />
renewable energy solutions, align<strong>in</strong>g with global trends.<br />
The food <strong>in</strong>dustry experienced a steady ascent, with <strong>in</strong>vestments climb<strong>in</strong>g from $198,000 <strong>in</strong><br />
2015 to $115 million <strong>in</strong> 2022, <strong>and</strong> the wellness <strong>and</strong> beauty sector experienced a leap <strong>in</strong> fund<strong>in</strong>g,<br />
with <strong>in</strong>vestments mov<strong>in</strong>g from $4 million <strong>in</strong> 2022 to $41 million <strong>in</strong> 2023.<br />
F<strong>in</strong>tech, a key component of <strong>Kenya</strong>’s tech ecosystem, demonstrated consistent <strong>growth</strong>,<br />
reach<strong>in</strong>g $153 million <strong>in</strong> 2022. This sector’s resilience <strong>and</strong> cont<strong>in</strong>uous <strong>in</strong>novation contribute<br />
significantly to <strong>Kenya</strong>’s reputation as a f<strong>in</strong>tech hub <strong>in</strong> Africa.<br />
Other notable sectors <strong>in</strong>clude transportation, real estate, education, <strong>and</strong> telecom, each<br />
showcas<strong>in</strong>g vary<strong>in</strong>g degrees of <strong>in</strong>vestment <strong>and</strong> <strong>growth</strong>. The telecommunications sector, <strong>in</strong><br />
particular, experienced a substantial <strong>in</strong>crease, reach<strong>in</strong>g $28 million <strong>in</strong> 2023, reflect<strong>in</strong>g the<br />
importance of connectivity <strong>and</strong> communication <strong>in</strong>frastructure.<br />
The data also reveals emerg<strong>in</strong>g sectors, such as enterprise software, health, <strong>and</strong> security,<br />
attract<strong>in</strong>g noteworthy <strong>in</strong>vestments. Enterprise software, for <strong>in</strong>stance, saw an uptick from<br />
$125,000 <strong>in</strong> 2016 to $745,000 <strong>in</strong> 2023.<br />
While some sectors experienced fluctuations or dips <strong>in</strong> <strong>in</strong>vestment, such as market<strong>in</strong>g <strong>and</strong><br />
travel, others like fashion, media, <strong>and</strong> event tech witnessed consistent <strong>in</strong>vestor <strong>in</strong>terest.
PAGE. 11<br />
<strong>Assess<strong>in</strong>g</strong> <strong>high</strong><br />
<strong>growth</strong> <strong>firms</strong> <strong>in</strong> <strong>Kenya</strong>,<br />
<strong>Ethiopia</strong>, <strong>and</strong> Rw<strong>and</strong>a:<br />
build<strong>in</strong>g data basel<strong>in</strong>es<br />
to help guide future<br />
leaps.<br />
Insight report<br />
No. 3<br />
<strong>Ethiopia</strong> snapshot<br />
Available data on <strong>Ethiopia</strong>’s ecosystem <strong>in</strong>dicates low levels of activity, but<br />
with <strong>high</strong> <strong>growth</strong> prospects. Most startups are at early stage, but with a large<br />
population, <strong>and</strong> positive market reforms encourag<strong>in</strong>g greater private sector<br />
<strong>in</strong>vestment, there appears untapped potential for future <strong>high</strong>-value startups.<br />
The 17 fund<strong>in</strong>g rounds s<strong>in</strong>ce 2015 - totall<strong>in</strong>g $43.7 million - evidence a low<br />
level, but steady <strong>in</strong>put of capital.<br />
The substantial value of exits compared to <strong>in</strong>vestment ($510 million s<strong>in</strong>ce 2015), is anomalous<br />
- the buyout of National Tobacco Enterprise, by Japan Tobacco. Otherwise, there have been no<br />
significant or documented realisations of value <strong>in</strong> the ecosystem.<br />
The current ecosystem value st<strong>and</strong>s at $214 million, <strong>in</strong>dicat<strong>in</strong>g a grow<strong>in</strong>g <strong>and</strong> dynamic<br />
l<strong>and</strong>scape. The <strong>in</strong>jection of $43.7 million <strong>in</strong> new funds s<strong>in</strong>ce 2015 reflects <strong>in</strong>creas<strong>in</strong>g <strong>in</strong>vestor<br />
confidence <strong>in</strong> <strong>Ethiopia</strong>’s potential <strong>and</strong> serves as a catalyst for further <strong>in</strong>novation <strong>and</strong> expansion.<br />
To supplement this data, ga<strong>in</strong><strong>in</strong>g <strong>in</strong>sights <strong>in</strong>to the specific sectors or <strong>in</strong>dustries that have<br />
attracted fund<strong>in</strong>g, the diversity of startup founders, <strong>and</strong> the level of government support <strong>and</strong><br />
policies for the <strong>in</strong>novation ecosystem would provide a more comprehensive underst<strong>and</strong><strong>in</strong>g.<br />
Explor<strong>in</strong>g the number of partnerships <strong>and</strong> collaborations between startups <strong>and</strong> established<br />
companies can shed light on the ecosystem’s <strong>in</strong>terconnectedness <strong>and</strong> potential for<br />
collaborative <strong>growth</strong>. Data from Shega Insights starts to allow for this, but is based on a small<br />
sample of 100 <strong>high</strong> <strong>growth</strong> startups <strong>in</strong> <strong>Ethiopia</strong>.<br />
While the number of startups founded s<strong>in</strong>ce 2013 st<strong>and</strong>s small, delv<strong>in</strong>g <strong>in</strong>to the success<br />
<strong>and</strong> failure rates, as well as the key challenges faced by these startups, would provide <strong>high</strong>ly<br />
valuable context. Additionally, track<strong>in</strong>g the number of educational programs <strong>and</strong> <strong>in</strong>itiatives<br />
aimed at nurtur<strong>in</strong>g entrepreneurial talent can offer <strong>in</strong>sights <strong>in</strong>to the ecosystem’s long-term<br />
susta<strong>in</strong>ability. Such data is essential to gather much richer underst<strong>and</strong><strong>in</strong>gs as to what is<br />
happen<strong>in</strong>g below the surface.
PAGE. 12<br />
<strong>Assess<strong>in</strong>g</strong> <strong>high</strong><br />
<strong>growth</strong> <strong>firms</strong> <strong>in</strong> <strong>Kenya</strong>,<br />
<strong>Ethiopia</strong>, <strong>and</strong> Rw<strong>and</strong>a:<br />
build<strong>in</strong>g data basel<strong>in</strong>es<br />
to help guide future<br />
leaps.<br />
Insight report<br />
No. 3<br />
Figure 8: Enterprise value by launch year ($mn)<br />
2015-2021 2010-2014 2005-2009 2000-2004 1995-1999 1990-1994 1900-1989<br />
250<br />
200<br />
150<br />
100<br />
50<br />
0<br />
2014 2015 2016 2017 2018 2019 2020 2021 2022 2023<br />
(Source: Dealroom, 2023)<br />
Figure 9: Enterprise value by valuation ($mn)<br />
$10bn+ $1.0-10bn $200mn-1bn $0-200mn<br />
300<br />
250<br />
200<br />
150<br />
100<br />
50<br />
0<br />
2016 2017 2018 2019 2020 2021 2022<br />
2023<br />
(Source: Dealroom, 2023)
PAGE. 13<br />
<strong>Assess<strong>in</strong>g</strong> <strong>high</strong><br />
<strong>growth</strong> <strong>firms</strong> <strong>in</strong> <strong>Kenya</strong>,<br />
<strong>Ethiopia</strong>, <strong>and</strong> Rw<strong>and</strong>a:<br />
build<strong>in</strong>g data basel<strong>in</strong>es<br />
to help guide future<br />
leaps.<br />
Insight report<br />
No. 3<br />
Figure 10: Employees by team size<br />
10k+ 5k-10k 1k-5k 500-1k 200-500 50-200 10-50<br />
14000<br />
12000<br />
10000<br />
8000<br />
2-10<br />
6000<br />
4000<br />
2000<br />
0<br />
2018 2019 2020 2021 2022 2023<br />
(Source: Dealroom, 2023)<br />
This data represents all startups <strong>and</strong> scaleups (not just those generat<strong>in</strong>g <strong>high</strong> <strong>growth</strong>), <strong>and</strong> also <strong>in</strong>cludes mature companies, hence the difference<br />
between employment numbers presented elsewhere <strong>in</strong> this report.<br />
Figure 11: Employees by company valuation<br />
$10bn+ $1.0-10bn $200mn-1bn $0-200mn<br />
14000<br />
12000<br />
10000<br />
8000<br />
6000<br />
4000<br />
2000<br />
0<br />
2018 2019 2020 2021 2022 2023<br />
(Source: Dealroom, 2023)<br />
This data represents all startups <strong>and</strong> scaleups (not just those generat<strong>in</strong>g <strong>high</strong> <strong>growth</strong>), <strong>and</strong> also <strong>in</strong>cludes mature companies, hence the difference<br />
between employment numbers presented elsewhere <strong>in</strong> this report.
PAGE. 14<br />
<strong>Assess<strong>in</strong>g</strong> <strong>high</strong><br />
<strong>growth</strong> <strong>firms</strong> <strong>in</strong> <strong>Kenya</strong>,<br />
<strong>Ethiopia</strong>, <strong>and</strong> Rw<strong>and</strong>a:<br />
build<strong>in</strong>g data basel<strong>in</strong>es<br />
to help guide future<br />
leaps.<br />
Insight report<br />
No. 3<br />
High <strong>growth</strong> <strong>firms</strong> <strong>in</strong> <strong>Ethiopia</strong> have created over 2,200 jobs.<br />
High-<strong>growth</strong> <strong>firms</strong> <strong>in</strong> <strong>Ethiopia</strong> have played a pivotal role <strong>in</strong> job creation across diverse sectors,<br />
with notable contributions from renewable energy, software development, <strong>and</strong> agriculture. The<br />
renewable energy sector emerges as a significant contributor, generat<strong>in</strong>g 281 jobs. Software<br />
development follows closely, creat<strong>in</strong>g 234 jobs, underscor<strong>in</strong>g the <strong>growth</strong> <strong>and</strong> dem<strong>and</strong> for techrelated<br />
expertise <strong>in</strong> the country. Health, logistics, <strong>and</strong> employment sectors also demonstrate<br />
substantial job creation, reflect<strong>in</strong>g the multifaceted impact of <strong>high</strong>-<strong>growth</strong> <strong>firms</strong> on <strong>Ethiopia</strong>’s<br />
evolv<strong>in</strong>g economic l<strong>and</strong>scape.<br />
Figure 12: High <strong>growth</strong> firm jobs creation <strong>in</strong> <strong>Ethiopia</strong> by sector (N=100)<br />
Sector<br />
Renewable Energy<br />
Software Developers<br />
Agriculture<br />
Health<br />
Logistics<br />
Employment<br />
Education<br />
Transporation<br />
Media & Enterta<strong>in</strong>ment<br />
E-commerce<br />
F<strong>in</strong>ance<br />
Unknown<br />
Apparel & Textiles<br />
Delivery<br />
Manufactur<strong>in</strong>g<br />
Construction<br />
Real Estate<br />
0 100 200 300<br />
Total jobs created<br />
(Source: Shega, 2023)<br />
While the data <strong>in</strong>dicates a lack of VC <strong>in</strong>vestment <strong>in</strong> <strong>Ethiopia</strong> from 2008 to 2015,<br />
the l<strong>and</strong>scape started evolv<strong>in</strong>g <strong>in</strong> 2016, marked by <strong>in</strong>vestment of $1 million.<br />
The subsequent years saw <strong>in</strong>termittent periods without recorded VC <strong>in</strong>vestments, underscor<strong>in</strong>g<br />
the challenges <strong>and</strong> nascent nature of the ecosystem. However, 2020 marked a significant<br />
turn<strong>in</strong>g po<strong>in</strong>t with a noteworthy <strong>in</strong>vestment of $2 million, <strong>in</strong>dicat<strong>in</strong>g a renewed <strong>in</strong>terest <strong>and</strong><br />
confidence from venture capitalists <strong>in</strong> <strong>Ethiopia</strong>’s emerg<strong>in</strong>g l<strong>and</strong>scape.<br />
The trend cont<strong>in</strong>ued to ga<strong>in</strong> momentum <strong>in</strong> 2022, reach<strong>in</strong>g $5.8 million <strong>in</strong> VC <strong>in</strong>vestment. This<br />
substantial <strong>in</strong>crease suggests a grow<strong>in</strong>g recognition of <strong>Ethiopia</strong>’s potential for <strong>in</strong>novation<br />
<strong>and</strong> technological advancement. The data for 2023 <strong>in</strong>dicates a dip or a pause <strong>in</strong> the upward<br />
trajectory, <strong>and</strong> further analysis would be needed to underst<strong>and</strong> the factors <strong>in</strong>fluenc<strong>in</strong>g<br />
downward shifts.
PAGE. 15<br />
Figure 13: VC <strong>in</strong>vestment <strong>in</strong> <strong>Ethiopia</strong> by year <strong>and</strong> round size (ALL startups <strong>and</strong> scaleups)<br />
<strong>Assess<strong>in</strong>g</strong> <strong>high</strong><br />
<strong>growth</strong> <strong>firms</strong> <strong>in</strong> <strong>Kenya</strong>,<br />
<strong>Ethiopia</strong>, <strong>and</strong> Rw<strong>and</strong>a:<br />
build<strong>in</strong>g data basel<strong>in</strong>es<br />
to help guide future<br />
leaps.<br />
Insight report<br />
No. 3<br />
$250mn+ $100-$250mn $40-100mn (Series C) $15-40mn (Series B) $4-15mn (Series A)<br />
$0-1mn (pre-seed)<br />
30,000,000<br />
$1-4mn (seed)<br />
20,000,000<br />
10,000,000<br />
0<br />
2011 2012 2013<br />
2014 2015 2016 2017 2018 2019 2020 2021 2022 2023<br />
(Source: Dealroom, 2023)<br />
82% of <strong>in</strong>vestment made <strong>in</strong>to <strong>Ethiopia</strong>n startups <strong>and</strong> scaleups <strong>in</strong> 2023 has come from<br />
<strong>in</strong>vestors other than corporates <strong>and</strong> VCs, suggest<strong>in</strong>g the important role of ESOs,<br />
government <strong>and</strong> global donor organisations.<br />
Figure 14: Investment (%) by type of <strong>in</strong>vestor<br />
Other<br />
Corporate<br />
Venture Capital<br />
100<br />
75<br />
50<br />
25<br />
0<br />
2011<br />
2012<br />
2013 2014 2015 2016<br />
2017<br />
2018 2019 2020 2021 2022 2023<br />
(Source: Dealroom, 2023)
PAGE. 16<br />
<strong>Assess<strong>in</strong>g</strong> <strong>high</strong><br />
<strong>growth</strong> <strong>firms</strong> <strong>in</strong> <strong>Kenya</strong>,<br />
<strong>Ethiopia</strong>, <strong>and</strong> Rw<strong>and</strong>a:<br />
build<strong>in</strong>g data basel<strong>in</strong>es<br />
to help guide future<br />
leaps.<br />
Insight report<br />
No. 3<br />
Data on the location of <strong>in</strong>vestors mak<strong>in</strong>g deals <strong>in</strong> <strong>Ethiopia</strong> is patchy, with significant portions<br />
of unknown location data.<br />
Where <strong>in</strong>vestor location is known, it is clear that European, <strong>and</strong> domestic <strong>in</strong>vestment have<br />
historically been a ma<strong>in</strong>stay of <strong>high</strong> <strong>growth</strong> f<strong>in</strong>anc<strong>in</strong>g, but <strong>in</strong> recent years this has dropped off,<br />
<strong>and</strong> been substituted by US, Asian, <strong>and</strong> possibly ROW <strong>in</strong>vestors.<br />
Figure 15: Investor location by proportion of <strong>in</strong>vestment<br />
Unknown HQ Rest of World Asia USA European Domestic<br />
100<br />
75<br />
50<br />
25<br />
0<br />
2011<br />
2012<br />
2013 2014 2015 2016<br />
2017<br />
2018 2019 2020 2021 2022 2023<br />
(Source: Dealroom, 2023)
PAGE. 17<br />
<strong>Assess<strong>in</strong>g</strong> <strong>high</strong><br />
<strong>growth</strong> <strong>firms</strong> <strong>in</strong> <strong>Kenya</strong>,<br />
<strong>Ethiopia</strong>, <strong>and</strong> Rw<strong>and</strong>a:<br />
build<strong>in</strong>g data basel<strong>in</strong>es<br />
to help guide future<br />
leaps.<br />
Insight report<br />
No. 3<br />
Investment by sector<br />
In the absence of specific <strong>in</strong>vestment data for most sectors, the recorded <strong>in</strong>vestments <strong>in</strong> travel,<br />
security, media, <strong>and</strong> education st<strong>and</strong> out. The travel sector saw a substantial <strong>in</strong>vestment of<br />
$1 million <strong>in</strong> 2016 <strong>and</strong> an additional $150,000 <strong>in</strong> 2021, <strong>in</strong>dicat<strong>in</strong>g a focus on <strong>in</strong>novations <strong>in</strong> the<br />
travel <strong>and</strong> tourism space. Security also received attention, suggest<strong>in</strong>g <strong>in</strong>terest <strong>in</strong> solutions for<br />
related challenges.<br />
Media <strong>and</strong> education sectors have seen <strong>in</strong>vestments of $2 million each <strong>in</strong> 2023. The<br />
<strong>in</strong>vestments <strong>in</strong> media may <strong>in</strong>dicate <strong>in</strong>terest <strong>in</strong> digital content creation, stream<strong>in</strong>g platforms,<br />
or other media-related technologies. Similarly, the education sector’s <strong>in</strong>vestments align with<br />
global trends toward edtech solutions, emphasis<strong>in</strong>g the importance of technology <strong>in</strong> shap<strong>in</strong>g<br />
educational experiences.<br />
While these recorded <strong>in</strong>vestments provide valuable <strong>in</strong>sights, the lack of data for some sectors<br />
limits a comprehensive underst<strong>and</strong><strong>in</strong>g of the broader <strong>in</strong>vestment l<strong>and</strong>scape <strong>in</strong> <strong>Ethiopia</strong>. The<br />
presence of <strong>in</strong>vestments <strong>in</strong> specific sectors suggests a gradual diversification of the startup<br />
ecosystem, with potential opportunities for <strong>growth</strong> <strong>and</strong> <strong>in</strong>novation.<br />
A subset of <strong>high</strong> <strong>growth</strong> companies identified by Shega po<strong>in</strong>t <strong>in</strong> the same direction as Dealroom<br />
data, suggest<strong>in</strong>g that Software development, education <strong>and</strong> e-commerce are among the most<br />
populous sectors for <strong>high</strong> <strong>growth</strong> <strong>firms</strong>, alongside agriculture <strong>and</strong> energy.<br />
Figure 16: High <strong>growth</strong> companies by sector (N=100)<br />
Sector<br />
Software Development<br />
Agriculture<br />
Renewable Energy<br />
E-commerce<br />
Education<br />
Health<br />
F<strong>in</strong>ance<br />
Logistics<br />
Media & Enterta<strong>in</strong>ment<br />
Employment<br />
Apparel & Textiles<br />
Transporation<br />
Delivery<br />
Manufactur<strong>in</strong>g<br />
Construction<br />
F<strong>in</strong>ancials<br />
Real Estate<br />
0 5 10 15<br />
Number of <strong>high</strong> <strong>growth</strong> companies<br />
(Source: Shega, 2023)
PAGE. 18<br />
<strong>Assess<strong>in</strong>g</strong> <strong>high</strong><br />
<strong>growth</strong> <strong>firms</strong> <strong>in</strong> <strong>Kenya</strong>,<br />
<strong>Ethiopia</strong>, <strong>and</strong> Rw<strong>and</strong>a:<br />
build<strong>in</strong>g data basel<strong>in</strong>es<br />
to help guide future<br />
leaps.<br />
Insight report<br />
No. 3<br />
The majority (87%) of these jobs <strong>in</strong> <strong>high</strong> <strong>growth</strong> <strong>firms</strong> have been created <strong>in</strong> the capital,<br />
Addis Ababa.<br />
Figure 17: Job creation by <strong>high</strong> <strong>growth</strong> <strong>firms</strong> <strong>in</strong> <strong>Ethiopia</strong> by city (N=93)<br />
Addis Ababa<br />
Bahir Dar<br />
Awash<br />
City (HQ)<br />
Hawassa<br />
Adama<br />
Jimma<br />
Debre Birhan<br />
Welkite<br />
0 500 1000 1500 2000<br />
Number of <strong>high</strong> <strong>growth</strong> employees<br />
(Source: Shega, 2023)<br />
Most <strong>high</strong> <strong>growth</strong> <strong>firms</strong> operat<strong>in</strong>g <strong>in</strong> <strong>Ethiopia</strong> are achiev<strong>in</strong>g less than $100k annual<br />
revenues, however, a h<strong>and</strong>ful are turn<strong>in</strong>g over more than $500k per annum.<br />
Figure 18: High <strong>growth</strong> company revenue generation by revenue b<strong>and</strong>s (N=76)<br />
0-20k USD<br />
20k-50k USD<br />
Annual Revenue<br />
50k-100k USD<br />
100k-500k USD<br />
500k-2.5m USD<br />
2.5m-10m USD<br />
0 10 20 30 40<br />
Number of <strong>firms</strong><br />
(Source: Shega, 2023)
PAGE. 19<br />
<strong>Assess<strong>in</strong>g</strong> <strong>high</strong><br />
<strong>growth</strong> <strong>firms</strong> <strong>in</strong> <strong>Kenya</strong>,<br />
<strong>Ethiopia</strong>, <strong>and</strong> Rw<strong>and</strong>a:<br />
build<strong>in</strong>g data basel<strong>in</strong>es<br />
to help guide future<br />
leaps.<br />
Insight report<br />
No. 3<br />
Rw<strong>and</strong>a snapshot<br />
Rw<strong>and</strong>a’s ecosystem is <strong>in</strong> a formative stage - a very small portion of<br />
bus<strong>in</strong>esses qualify as <strong>high</strong> <strong>growth</strong> <strong>and</strong> many startups are not <strong>in</strong>vestment-ready.<br />
97% of bus<strong>in</strong>esses <strong>in</strong> Rw<strong>and</strong>a fall under the category of micro <strong>and</strong> small-sized<br />
(National Institute of Statistics Rw<strong>and</strong>a (NISR), Labour Force Survey, 2021).<br />
Only 3% of bus<strong>in</strong>esses <strong>in</strong> Rw<strong>and</strong>a are medium or large, <strong>and</strong> even fewer (less<br />
than 1%) are <strong>high</strong>-<strong>growth</strong> oriented.<br />
Only 15% of <strong>firms</strong> survive beyond 5 years <strong>in</strong> operation <strong>and</strong> of those that make it past 15 years,<br />
half rema<strong>in</strong> under 4 employees (see NISR, “Establishment Survey,” 2020). The 17 fund<strong>in</strong>g<br />
rounds <strong>in</strong>to tech startups s<strong>in</strong>ce 2015, amount<strong>in</strong>g to $12 million, suggest a steady but moderate<br />
flow of capital. The number of entrepreneurs <strong>in</strong> Rw<strong>and</strong>a is gradually <strong>in</strong>creas<strong>in</strong>g, with annual<br />
<strong>growth</strong> rates of micro <strong>and</strong> small enterprises of c20%, some of which could represent startups<br />
with <strong>growth</strong> potential that need ESO support to scale. Dalberg has identified 60 bus<strong>in</strong>esses with<br />
<strong>high</strong>-<strong>growth</strong> potential, with 80% at the pre-seed stage, which limits their read<strong>in</strong>ess to take on<br />
<strong>in</strong>vestment.<br />
The value of exits, total<strong>in</strong>g $48.1 million s<strong>in</strong>ce 2015, reflects a grow<strong>in</strong>g maturity <strong>in</strong> the market,<br />
with successful acquisitions or IPOs contribut<strong>in</strong>g to the overall ecosystem value. The 800<br />
employees engaged <strong>in</strong> the tech startup sector <strong>high</strong>light the sector’s contribution to job creation,<br />
a crucial aspect for economic development.<br />
The ecosystem’s current value st<strong>and</strong>s at $115 million, signall<strong>in</strong>g the early stages of<br />
development. The <strong>in</strong>jection of $12 million <strong>in</strong> new funds s<strong>in</strong>ce 2015 demonstrates a positive<br />
trajectory, <strong>in</strong>dicat<strong>in</strong>g <strong>in</strong>creas<strong>in</strong>g <strong>in</strong>vestor <strong>in</strong>terest <strong>and</strong> confidence <strong>in</strong> Rw<strong>and</strong>a’s potential. This<br />
new fund<strong>in</strong>g can be seen as a catalyst for further <strong>in</strong>novation <strong>and</strong> expansion.<br />
To supplement this data, additional <strong>in</strong>sights <strong>in</strong>to the specific sectors or <strong>in</strong>dustries that have<br />
attracted fund<strong>in</strong>g, the diversity of startup founders, <strong>and</strong> the level of government support <strong>and</strong><br />
policies for the <strong>in</strong>novation ecosystem would provide a more comprehensive underst<strong>and</strong><strong>in</strong>g.<br />
Explor<strong>in</strong>g the number of partnerships <strong>and</strong> collaborations between startups <strong>and</strong> established<br />
companies can shed light on the ecosystem’s <strong>in</strong>terconnectedness <strong>and</strong> potential for<br />
collaborative <strong>growth</strong>.<br />
While the number of <strong>high</strong> <strong>growth</strong> startups founded s<strong>in</strong>ce 2013 st<strong>and</strong>s at 48, explor<strong>in</strong>g the<br />
success <strong>and</strong> failure rates, as well as the key challenges faced by these startups, would provide<br />
valuable context. An enhanced focus on <strong>in</strong>sights <strong>and</strong> performance-related metrics will bolster<br />
the extensive range of entrepreneur support programmes, nurtur<strong>in</strong>g entrepreneurial talent <strong>and</strong><br />
ventures to foster the ecosystem’s endur<strong>in</strong>g susta<strong>in</strong>ability.
PAGE. 20<br />
<strong>Assess<strong>in</strong>g</strong> <strong>high</strong><br />
<strong>growth</strong> <strong>firms</strong> <strong>in</strong> <strong>Kenya</strong>,<br />
<strong>Ethiopia</strong>, <strong>and</strong> Rw<strong>and</strong>a:<br />
build<strong>in</strong>g data basel<strong>in</strong>es<br />
to help guide future<br />
leaps.<br />
Figure 19: Enterprise value by launch year ($mn)<br />
2015-2021 2010-2014 2005-2009 2000-2004 1995-1999 1990-1994 1900-1989<br />
150<br />
Insight report<br />
No. 3<br />
100<br />
50<br />
0<br />
2018 2019 2020 2021 2022 2023<br />
(Source: Dealroom, 2023)<br />
Figure 20: Enterprise value by valuation ($mn)<br />
$10bn+ $1.0-10bn $200mn-1bn $0-200mn<br />
150<br />
100<br />
50<br />
0<br />
2018 2019 2020 2021 2022 2023<br />
(Source: Dealroom, 2023)
PAGE. 21<br />
<strong>Assess<strong>in</strong>g</strong> <strong>high</strong><br />
<strong>growth</strong> <strong>firms</strong> <strong>in</strong> <strong>Kenya</strong>,<br />
<strong>Ethiopia</strong>, <strong>and</strong> Rw<strong>and</strong>a:<br />
build<strong>in</strong>g data basel<strong>in</strong>es<br />
to help guide future<br />
leaps.<br />
Insight report<br />
No. 3<br />
Figure 21: Employees by team size<br />
10k+ 5k-10k 1k-5k 500-1k 200-500 50-200 10-50 2-10<br />
7000<br />
6000<br />
5000<br />
4000<br />
3000<br />
2000<br />
1000<br />
0<br />
2018 2019 2020 2021 2022 2023<br />
(Source: Dealroom, 2023)<br />
This data represents all startups <strong>and</strong> scaleups (not just those generat<strong>in</strong>g <strong>high</strong> <strong>growth</strong>), <strong>and</strong> also <strong>in</strong>cludes mature companies, hence the difference<br />
between employment numbers presented elsewhere <strong>in</strong> this report.<br />
Figure 22: Employees by company valuation<br />
$10bn+ $1.0-10bn $200mn-1bn $0-200mn<br />
8,000<br />
6,000<br />
4,000<br />
2,000<br />
0<br />
2018 2019 2020 2021 2022 2023<br />
(Source: Dealroom, 2023)<br />
This data represents all startups <strong>and</strong> scaleups (not just those generat<strong>in</strong>g <strong>high</strong> <strong>growth</strong>), <strong>and</strong> also <strong>in</strong>cludes mature companies, hence the difference<br />
between employment numbers presented elsewhere <strong>in</strong> this report.
PAGE. 22<br />
Figure 23: VC <strong>in</strong>vestment <strong>in</strong> Rw<strong>and</strong>a by year <strong>and</strong> round size (ALL startups <strong>and</strong> scaleups)<br />
<strong>Assess<strong>in</strong>g</strong> <strong>high</strong><br />
<strong>growth</strong> <strong>firms</strong> <strong>in</strong> <strong>Kenya</strong>,<br />
<strong>Ethiopia</strong>, <strong>and</strong> Rw<strong>and</strong>a:<br />
build<strong>in</strong>g data basel<strong>in</strong>es<br />
to help guide future<br />
leaps.<br />
$250mn+ $100-$250mn $40-100mn (Series C) $15-40mn (Series B) $4-15mn (Series A)<br />
$0-1mn (pre-seed)<br />
3,000,000<br />
$1-4mn (seed)<br />
Insight report<br />
No. 3<br />
2,000,000<br />
1,000,000<br />
0<br />
2011 2012 2013<br />
2014 2015 2016 2017 2018 2019 2020 2021 2022 2023<br />
(Source: Dealroom, 2023)<br />
The <strong>in</strong>vestment data for Rw<strong>and</strong>a <strong>in</strong>dicates a discernible shift <strong>in</strong> the latter years, with<br />
<strong>in</strong>vestments materialis<strong>in</strong>g from 2020 onwards. In 2020, there was a noteworthy <strong>in</strong>fusion of<br />
$400,000, mark<strong>in</strong>g a potential turn<strong>in</strong>g po<strong>in</strong>t for Rw<strong>and</strong>a’s startup <strong>and</strong> <strong>in</strong>vestment l<strong>and</strong>scape.<br />
Subsequently, 2023 shows a considerable <strong>in</strong>crease with a total <strong>in</strong>vestment of $1 million. While<br />
the data prior to 2020 is unavailable, the recent upward trend suggests a grow<strong>in</strong>g <strong>in</strong>terest <strong>in</strong><br />
Rw<strong>and</strong>a’s emerg<strong>in</strong>g ecosystem.. The recorded <strong>in</strong>vestments <strong>in</strong> 2022 <strong>and</strong> 2023 signify a positive<br />
trajectory. Further analysis of sectoral distribution is presented later <strong>in</strong> this section, <strong>and</strong> <strong>in</strong> depth<br />
<strong>in</strong>formation around startup characteristics would offer valuable <strong>in</strong>sights <strong>in</strong>to Rw<strong>and</strong>a’s specific<br />
areas of <strong>growth</strong> <strong>and</strong> development.<br />
Agriculture <strong>and</strong> F<strong>in</strong>ance are the most prevalent startup sectors for <strong>firms</strong> operat<strong>in</strong>g <strong>in</strong><br />
Rw<strong>and</strong>a, accord<strong>in</strong>g to a database curated by the Rw<strong>and</strong>an Development Board (N=429).
PAGE. 23<br />
Figure 24: Sectoral distribution of <strong>firms</strong><br />
<strong>Assess<strong>in</strong>g</strong> <strong>high</strong><br />
<strong>growth</strong> <strong>firms</strong> <strong>in</strong> <strong>Kenya</strong>,<br />
<strong>Ethiopia</strong>, <strong>and</strong> Rw<strong>and</strong>a:<br />
build<strong>in</strong>g data basel<strong>in</strong>es<br />
to help guide future<br />
leaps.<br />
Insight report<br />
No. 3<br />
Sector<br />
Agriculture<br />
F<strong>in</strong>ance<br />
Professional services<br />
Manufactur<strong>in</strong>g<br />
Health<br />
Real estate & Construction<br />
Logistics<br />
Tech<br />
Hospitality & Tourism<br />
Energy & Utilities<br />
Education<br />
Retail<br />
M<strong>in</strong><strong>in</strong>g<br />
Enterta<strong>in</strong>ment<br />
Hospitality<br />
Multi-sector & Hold<strong>in</strong>g company<br />
Pr<strong>in</strong>t<strong>in</strong>g<br />
Cafe<br />
Corrections<br />
Media<br />
Security<br />
0 25 50 75 100 125<br />
Number of <strong>firms</strong><br />
(Source: RDB, 2023)
PAGE. 24<br />
<strong>Assess<strong>in</strong>g</strong> <strong>high</strong><br />
<strong>growth</strong> <strong>firms</strong> <strong>in</strong> <strong>Kenya</strong>,<br />
<strong>Ethiopia</strong>, <strong>and</strong> Rw<strong>and</strong>a:<br />
build<strong>in</strong>g data basel<strong>in</strong>es<br />
to help guide future<br />
leaps.<br />
Investor type has fluctuated significantly over the last decade, with VCs play<strong>in</strong>g an evermore<br />
important role, but with corporate <strong>and</strong> government/ donor/ ESO f<strong>in</strong>anc<strong>in</strong>g historically<br />
provid<strong>in</strong>g a backbone to Rw<strong>and</strong>a’s startup ecosystem.<br />
Figure 25: Investment by <strong>in</strong>vestor type (%)<br />
Insight report<br />
No. 3<br />
Other<br />
Corporate<br />
Venture Capital<br />
100<br />
75<br />
50<br />
25<br />
0<br />
2011<br />
2012<br />
2013 2014 2015 2016<br />
2017<br />
2018 2019 2020 2021 2022 2023<br />
(Source: Dealroom, 2023)<br />
Aga<strong>in</strong>, the data is noisy when look<strong>in</strong>g at <strong>in</strong>vestment by <strong>in</strong>vestor location, ow<strong>in</strong>g to low deal<br />
numbers, however, Rw<strong>and</strong>an <strong>firms</strong> are attract<strong>in</strong>g <strong>in</strong>vestment from around the world, <strong>and</strong> the<br />
picture will likely stabilise as more deals are done, <strong>and</strong> ecosystem scale <strong>in</strong>creases.<br />
Figure 26: Investment (%) by <strong>in</strong>vestor location<br />
Unknown HQ Rest of World Asia USA European Domestic<br />
100<br />
75<br />
50<br />
25<br />
0<br />
2011<br />
2012<br />
2013 2014 2015 2016<br />
2017<br />
2018 2019 2020 2021 2022 2023<br />
(Source: Dealroom, 2023)
PAGE. 25<br />
<strong>Assess<strong>in</strong>g</strong> <strong>high</strong><br />
<strong>growth</strong> <strong>firms</strong> <strong>in</strong> <strong>Kenya</strong>,<br />
<strong>Ethiopia</strong>, <strong>and</strong> Rw<strong>and</strong>a:<br />
build<strong>in</strong>g data basel<strong>in</strong>es<br />
to help guide future<br />
leaps.<br />
Insight report<br />
No. 3<br />
Investment by sector<br />
Rw<strong>and</strong>a’s <strong>in</strong>vestment data <strong>in</strong> various sectors reflects a gradual emergence <strong>and</strong> grow<strong>in</strong>g <strong>in</strong>terest<br />
<strong>in</strong> specific <strong>in</strong>dustries with<strong>in</strong> the startup ecosystem. The notable <strong>in</strong>vestments <strong>in</strong> the education<br />
sector, with a leap from $150,000 <strong>in</strong> 2021 to $1 million <strong>in</strong> 2022 <strong>and</strong> 2023, <strong>in</strong>dicate a focus on<br />
<strong>in</strong>novative solutions <strong>in</strong> the education technology space, align<strong>in</strong>g with global trends towards<br />
digital learn<strong>in</strong>g.<br />
While some sectors, such as gam<strong>in</strong>g, enterprise software, <strong>and</strong> health, show no recorded<br />
<strong>in</strong>vestments, others demonstrate potential areas of <strong>growth</strong>. The f<strong>in</strong>tech sector, for <strong>in</strong>stance,<br />
received a modest <strong>in</strong>vestment of $100,000 <strong>in</strong> 2022, suggest<strong>in</strong>g nascent but <strong>in</strong>creas<strong>in</strong>g <strong>in</strong>terest<br />
<strong>in</strong> f<strong>in</strong>ancial technology solutions with<strong>in</strong> Rw<strong>and</strong>a.<br />
The telecommunications sector experienced a noteworthy <strong>in</strong>vestment of $250,000 <strong>in</strong> 2022,<br />
reflect<strong>in</strong>g potential advancements <strong>in</strong> communication <strong>in</strong>frastructure <strong>and</strong> technology. Similarly,<br />
the energy sector saw a substantial <strong>in</strong>crease, with an <strong>in</strong>vestment of $3.5 million <strong>in</strong> 2023,<br />
signall<strong>in</strong>g a recognition of the importance of susta<strong>in</strong>able energy solutions.<br />
The data also <strong>in</strong>dicates <strong>in</strong>vestments <strong>in</strong> the jobs recruitment sector, with $150,000 <strong>in</strong> 2021,<br />
reflect<strong>in</strong>g a focus on address<strong>in</strong>g employment challenges through technological solutions.
PAGE. 26<br />
<strong>Assess<strong>in</strong>g</strong> <strong>high</strong><br />
<strong>growth</strong> <strong>firms</strong> <strong>in</strong> <strong>Kenya</strong>,<br />
<strong>Ethiopia</strong>, <strong>and</strong> Rw<strong>and</strong>a:<br />
build<strong>in</strong>g data basel<strong>in</strong>es<br />
to help guide future<br />
leaps.<br />
Insight report<br />
No. 3<br />
What to measure <strong>in</strong> the future<br />
Underst<strong>and</strong><strong>in</strong>g <strong>and</strong> measur<strong>in</strong>g the dynamics of the ecosystem <strong>in</strong> Rw<strong>and</strong>a, <strong>Ethiopia</strong>, <strong>and</strong> <strong>Kenya</strong><br />
requires a comprehensive approach that considers the nuances of each country's <strong>in</strong>novation,<br />
entrepreneurship, <strong>and</strong> technological l<strong>and</strong>scape. To beg<strong>in</strong> with, a deeper assessment of<br />
ecosystem support organisations is crucial. This <strong>in</strong>volves identify<strong>in</strong>g <strong>and</strong> evaluat<strong>in</strong>g the various<br />
entities that play a role <strong>in</strong> foster<strong>in</strong>g the <strong>growth</strong> of tech startups, such as government <strong>in</strong>itiatives,<br />
donors, <strong>in</strong>cubators, accelerators, <strong>and</strong> non-profit organisations. Gather<strong>in</strong>g data on their<br />
programmes, fund<strong>in</strong>g mechanisms, success stories, <strong>and</strong> areas of focus can provide <strong>in</strong>sights<br />
<strong>in</strong>to the level of support available <strong>and</strong> its impact on the overall ecosystem. Some organisations<br />
have made significant progress <strong>in</strong> this regard, such as ANDE <strong>and</strong> Emory University’s GALI<br />
<strong>in</strong>itiative, to underst<strong>and</strong> the effectiveness of accelerators. The cessation of collective ESO<br />
data collection activities a few years ago is a mistake. Investors are also pivotal players <strong>in</strong> the<br />
ecosystem, <strong>in</strong>fluenc<strong>in</strong>g the direction <strong>and</strong> pace of <strong>in</strong>novation - as seen from the data, many<br />
<strong>in</strong>vestors <strong>in</strong>to Rw<strong>and</strong>an, <strong>Ethiopia</strong>n <strong>and</strong> <strong>Kenya</strong>n <strong>high</strong> <strong>growth</strong> ecosystems are from outside the<br />
cont<strong>in</strong>ent, so a global scope will be necessary. We signal a crucial need for the ecosystem to<br />
re-engage <strong>in</strong> unified measurement efforts, now more than ever.<br />
Collect<strong>in</strong>g data on <strong>in</strong>vestment trends through an <strong>in</strong>vestor lens - <strong>in</strong>clud<strong>in</strong>g characteristics of<br />
<strong>in</strong>vestors (angel <strong>in</strong>vestors, venture capitalists, government fund<strong>in</strong>g), <strong>and</strong> the sectors they are<br />
most <strong>in</strong>terested <strong>in</strong>, offers a nuanced underst<strong>and</strong><strong>in</strong>g of the f<strong>in</strong>ancial l<strong>and</strong>scape. This <strong>in</strong>cludes<br />
track<strong>in</strong>g the amount of fund<strong>in</strong>g received by startups, the stages at which <strong>in</strong>vestments are made,<br />
<strong>and</strong> the success rates of funded ventures. Moreover, analys<strong>in</strong>g the diversity of the <strong>in</strong>vestor pool<br />
<strong>and</strong> its collaboration with other ecosystem stakeholders <strong>high</strong>lights opportunities for further<br />
<strong>growth</strong>. But <strong>in</strong> addition to ecosystem support organisations <strong>and</strong> <strong>in</strong>vestors, a comprehensive<br />
data collection effort should extend to startups themselves.<br />
Underst<strong>and</strong><strong>in</strong>g the demographics of founders, the <strong>in</strong>dustries they operate <strong>in</strong>, <strong>and</strong> the challenges<br />
they face is the miss<strong>in</strong>g <strong>in</strong>gredient. Rich <strong>in</strong>sights about how <strong>and</strong> why <strong>firms</strong> have evolved (<strong>and</strong><br />
the underly<strong>in</strong>g dynamics) are likely better captured than simply <strong>in</strong>terpret<strong>in</strong>g quantitative data<br />
alone. This <strong>in</strong>cludes assess<strong>in</strong>g the success <strong>and</strong> failure factors, the regulatory environment, <strong>and</strong><br />
the availability of skilled talent. Analys<strong>in</strong>g the collaborative networks <strong>and</strong> partnerships formed<br />
by startups can shed light on the ecosystem's <strong>in</strong>terconnectedness <strong>and</strong> identify potential areas<br />
for improvement. It is the comb<strong>in</strong>ation of <strong>in</strong>sights that matter most. This holds true because of<br />
ventures heterogeneous characteristics <strong>and</strong> because of the r<strong>and</strong>om nature of <strong>growth</strong>.<br />
To enhance ecosystem underst<strong>and</strong><strong>in</strong>g, it is crucial to employ both quantitative <strong>and</strong> qualitative<br />
research methods. Surveys, <strong>in</strong>terviews, <strong>and</strong> case studies will provide deeper depth to the<br />
quantitative data collected, offer<strong>in</strong>g a more holistic view of the challenges <strong>and</strong> opportunities<br />
present <strong>in</strong> ecosystems. To this end, we have partnered with lead<strong>in</strong>g experts, Scaleup Nation<br />
to capture new data via scaleup (organisational health diagnostic) scans - to enrich us with a<br />
much richer underst<strong>and</strong><strong>in</strong>g as to how <strong>and</strong> why ventures are grow<strong>in</strong>g (dist<strong>in</strong>guish<strong>in</strong>g scaleup<br />
<strong>and</strong> ‘stallup’ factors). This multifaceted approach to data collection ensures a comprehensive<br />
underst<strong>and</strong><strong>in</strong>g of the factors shap<strong>in</strong>g the l<strong>and</strong>scape <strong>in</strong> these countries, lay<strong>in</strong>g the foundation for<br />
<strong>in</strong>formed decision-mak<strong>in</strong>g <strong>and</strong> strategic <strong>in</strong>terventions to foster further <strong>growth</strong> <strong>and</strong> <strong>in</strong>novation<br />
<strong>in</strong>to the future.<br />
There is no set path to scale. Underst<strong>and</strong><strong>in</strong>g scal<strong>in</strong>g strategies <strong>and</strong> specific firm behaviours<br />
<strong>in</strong> pursu<strong>in</strong>g opportunities for <strong>growth</strong>, <strong>and</strong> how they deal with specific challenges will become<br />
ever more important, both at venture, <strong>and</strong> at ecosystems levels. Build<strong>in</strong>g, <strong>and</strong> shar<strong>in</strong>g more<br />
knowledge on scaleups, will become <strong>in</strong>creas<strong>in</strong>gly core to an improved <strong>in</strong>clusive <strong>in</strong>novation<br />
agenda. And <strong>in</strong> the end, we will all wonder how we could have ever thought otherwise.<br />
For further <strong>in</strong>formation, please contact us at contact@systemic<strong>in</strong>novation.work<br />
To learn more about the RISA Fund visit risa-fund.org