15 Broad St - Q3 Report

Create successful ePaper yourself
Turn your PDF publications into a flip-book with our unique Google optimized e-Paper software.
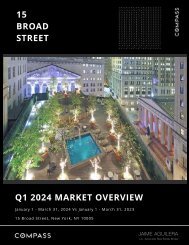
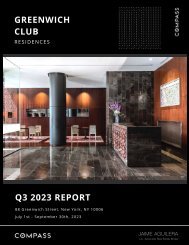
<strong>15</strong><br />
BROAD<br />
STREET<br />
<strong>Q3</strong> 2023 REPORT<br />
DOWNTOWN CONDOMINIUM<br />
July 1st - September 30th, 2023<br />
JAIME AGUILERA<br />
Lic. Associate Real Estate Broker
<strong>15</strong> <strong>Broad</strong> <strong>St</strong>reet - Sales Market Analysis <br />
<strong>Q3</strong> 2023 Sales Activity:<br />
Size<br />
Avg. Sales <br />
Price<br />
Sold Units<br />
(<strong>Q3</strong> 2023)<br />
Avg. $/PSF % Change<br />
(<strong>Q3</strong> 2023 vs <strong>Q3</strong> 2022)<br />
Avg. Days <br />
on Market<br />
<strong>St</strong>udio $787,500 1 12.55% 199<br />
1 BR + 1 Home Office $1,590,000 1 no data 50<br />
1 BR + 2 Home Office $2,200,000 1 no data 44<br />
Total $1,525,833 3 16.87% 98<br />
Market Overview:<br />
The third quarter of 2023 showcased significant changes in the sales market at <strong>15</strong> <strong>Broad</strong><br />
<strong>St</strong> when compared to the same quarter in 2022. These changes were evident across<br />
multiple key market metrics:<br />
Sales Price: The average sales price for <strong>Q3</strong> 2023 was recorded at $1,525,833, showing<br />
a decline of 16.87% from the previous year's average of $1,835,000 for the same<br />
quarter.<br />
Days on Market: Properties during <strong>Q3</strong> 2023 spent an average of 98 days on the market,<br />
marking a significant increase when compared to the 52 days average from <strong>Q3</strong> 2022.<br />
Units Sold: A total of 3 units were sold during the third quarter of 2023. This is a<br />
decrease from the 5 units sold during the same period in 2022.<br />
Sales Volume: The total sales volume for <strong>Q3</strong> 2023 reached $4,577,500 signifying a 50%<br />
decrease from the $9,175,000 recorded in the third quarter of 2022.<br />
Price per Square Foot: The third quarter's average price per square foot settled at<br />
$1,041, which is a natural adjustment from the previous year and a reflection of the everevolving<br />
market dynamics.
<strong>15</strong> <strong>Broad</strong> <strong>St</strong>reet - Sales Market Analysis <br />
Breakdown by Unit Type:<br />
<strong>St</strong>udio Apartments: One studio apartment was sold during <strong>Q3</strong> 2023 for an amount of<br />
$787,500. This apartment remained on the market for 199 days. The price per square<br />
foot was $1,052, registering a 12.55% decrease from <strong>Q3</strong> 2022.<br />
1 Bedroom + 1 Home Office: A single unit of this category was sold for $1,590,000. This<br />
unit was listed on the market for 50 days.<br />
1 Bedroom + 2 Home Office: This type saw a sale of one unit, which was priced at<br />
$2,200,000. The unit was available on the market for 44 days.<br />
Summary: The third quarter of 2023 revealed mixed trends for the sales market at <strong>15</strong><br />
<strong>Broad</strong> <strong>St</strong>. Although there was a decline in the number of units sold and in the sales<br />
volume, the details show varying patterns when we dissect the data by unit type. The<br />
increased average days on the market is an indication of a relatively slower market<br />
movement. Notwithstanding these general trends, the market remains dynamic, and it<br />
will be interesting to observe how it responds to external economic factors and buyer<br />
preferences in the coming months.<br />
Recent Sales:<br />
Apartment Size Sold Price $/PSF DOM Date Sold<br />
1914 1 BR + 2 Home Office $2,200,000 $1,084 44 9/28/2023<br />
901 <strong>St</strong>udio $787,500 $1,052 199 9/11/2023<br />
2504 1 BR + 1 Home Office $1,590,000 $988 50 8/2/2023<br />
2904 1 BR + 1 Home Office $1,599,000 $1,126 41 5/12/2023<br />
3530 3 Bedroom $2,940,000 $1,258 26 5/17/2023<br />
816 1 BR + 1 Home Office $1,900,000 $1,087 52 5/9/2023<br />
1602 <strong>St</strong>udio $1,037,500 $1,100 234 3/24/2023
<strong>15</strong> <strong>Broad</strong> <strong>St</strong>reet - Rental Market Analysis <br />
<strong>Q3</strong> 2023 Rental Activity:<br />
Size<br />
Avg. Asking<br />
Rent<br />
Leased Units<br />
(<strong>Q3</strong> 2023)<br />
Avg. Asking Rent % Change<br />
(<strong>Q3</strong> 2023 vs <strong>Q3</strong> 2022)<br />
Avg. Days <br />
on Market<br />
<strong>St</strong>udio $4,233 3 5.82% 8<br />
1 Home Office $7,000 1 8.53% 19<br />
2 Home Office $7,100 1 6.53% 34<br />
2 Bedroom $7,950 1 6.47% 76<br />
Total $5,792 6 7.56% 26<br />
Rental Market Overview:<br />
In the third quarter of 2023, the rental market at <strong>15</strong> <strong>Broad</strong> <strong>St</strong> showcased stable and<br />
promising trends, solidifying its position in the Financial District’s housing scene.<br />
Average Rent: By the end of <strong>Q3</strong>, the average asking rent was established at $5,792.<br />
While this denotes a slight adjustment from the previous year, it underscores the<br />
competitive pricing strategy in place to meet the evolving rental market dynamics.<br />
Leased Units: This quarter saw the leasing of 6 units. This metric confirms the sustained<br />
attractiveness of <strong>15</strong> <strong>Broad</strong> <strong>St</strong> among prospective tenants.<br />
Days on Market: Units were secured by renters in an average of 26 days, reflecting the<br />
efficiency and alignment of property offerings with market demand.<br />
Breakdown by Unit Type:<br />
<strong>St</strong>udio Apartments: These were the quickest to move, with 3 units being leased at an<br />
average asking rate of $4,233 — a growth of 5.82% from the previous year. Their swift<br />
occupancy rate resonates with the appeal of this type of unit.<br />
1 Home Office Units: One unit in this category was secured for $7,000, marking a rise of<br />
8.53% from last year's rates. Its days on the market stood at 19.
<strong>15</strong> <strong>Broad</strong> <strong>St</strong>reet - Rental Market Analysis <br />
2 Home Office Units: A unit in this segment was taken up for $7,100, reflecting a 6.53%<br />
year-on-year increase. It remained available for a span of 34 days.<br />
2 Bedroom Units: A spacious 2 bedroom was rented at $7,950. Even though there was<br />
a 6.47% adjustment from the previous year, it embodies the premium positioning of<br />
such layout. Its market duration was 76 days.<br />
Summary: The <strong>Q3</strong> 2023 data for <strong>15</strong> <strong>Broad</strong> <strong>St</strong> paints a picture of a robust rental market<br />
that successfully meets the diverse needs of tenants in the Financial District. While each<br />
unit type had its unique trajectory, the overarching theme was one of adaptability, and<br />
sustained demand.<br />
Recent Rentals:<br />
<br />
Apartment<br />
Size<br />
Last Asking<br />
Price<br />
DOM<br />
Leased Date<br />
928 1 Home Office $5,950 11 10/9/2023<br />
1408 <strong>St</strong>udio $4,200 8 9/29/2023<br />
824 2 Home Office $7,100 34 9/12/2023<br />
2028 <strong>St</strong>udio $4,500 8 8/21/2023<br />
2108 <strong>St</strong>udio $4,000 9 8/21/2023<br />
1424 1 Home Office $7,000 19 8/21/2023<br />
1700 2 Bedroom $7,950 76 7/12/2023<br />
3330 2 BR + 1 Home Office $9,000 74 6/26/2023<br />
908 <strong>St</strong>udio $3,900 28 6/20/2023<br />
1624 2 Home Office $6,750 17 6/6/2023<br />
2728 <strong>St</strong>udio $4,000 32 5/9/2023<br />
3508 1 Home Office $4,400 8 5/11/2023
Financial District - <strong>Q3</strong> 2023 Sales <strong>Report</strong><br />
Condominium Market Analysis<br />
Market Metrics <strong>Q3</strong> 2023 <strong>Q3</strong> 2022 % Change<br />
Number of Sales 75 114 34.21%<br />
Average Sales Price<br />
Average Discount<br />
Average Price per SF<br />
Average SF<br />
Average Days on Market<br />
$1,451,507 $1,368,361 6.08%<br />
8% 6% 33.33%<br />
$1,244 $1,255 0.88%<br />
1,140 1,073 6.24%<br />
99 194 48.97%<br />
Market Overview:<br />
The Financial District's condominium market witnessed various shifts in <strong>Q3</strong> 2023 when<br />
compared to <strong>Q3</strong> 2022. Some metrics, such as the number of sales, exhibited a<br />
decrease, while the average sales price and average square footage showed an upward<br />
trajectory. Interestingly, there was a surge in the average discount offered. Additionally,<br />
condos were sold faster compared to the previous year, as indicated by the reduction in<br />
the average days on the market.<br />
Number of Sales: In <strong>Q3</strong> 2023, the Financial District observed a considerable decrease in<br />
the number of sales. A total of 75 condos were sold, marking a decline of 34.21% from<br />
<strong>Q3</strong> 2022, which reported 114 units sold.<br />
Average Sales Price and Price per SF: The average sales price of condos rose by<br />
6.08%, moving from $1,368,361 in <strong>Q3</strong> 2022 to $1,451,507 in <strong>Q3</strong> 2023. However, the<br />
average price per square foot exhibited a minor decrease of 0.88%, settling at $1,244 in<br />
<strong>Q3</strong> 2023, down from $1,255 in the previous year.<br />
Average Discount: The average discount in the Financial District saw a significant<br />
increase. There was a jump of 33.33% in the average discount, growing from 6% in <strong>Q3</strong><br />
2022 to 8% in <strong>Q3</strong> 2023. This rise indicates a strategic approach to stimulate sales<br />
amidst a fluctuating market.
Financial District - <strong>Q3</strong> 2023 Sales <strong>Report</strong><br />
Condominium Market Analysis<br />
Average Square Footage: The average square footage of the condos sold witnessed an<br />
upswing. In <strong>Q3</strong> 2023, condos had an average size of 1,140 SF, marking a 6.24%<br />
increase from the 1,073 SF average in <strong>Q3</strong> 2022. This could be indicative of a growing<br />
preference for slightly larger units and the availability of bigger units in the market.<br />
Average Days on Market: One of the most positive indicators was the reduction in the<br />
average days a condo stayed on the market. This number decreased by an impressive<br />
48.97%, dropping from 194 days in <strong>Q3</strong> 2022 to just 99 days in <strong>Q3</strong> 2023.<br />
Summary: The Financial District's condo market in <strong>Q3</strong> 2023 presented a mix of<br />
indicators. While certain metrics like the number of sales indicated a cooler market, the<br />
rise in average sales price and the significant drop in average days on the market might<br />
suggest heightened buyer interest. The increased average discount could also be<br />
pointing towards heightened seller activity in response to the current market's dynamics.
RECENT<br />
SALES<br />
AND<br />
RENTALS
Apt. #901 | <strong>St</strong>udio | 1 BA | 748 SF | $787,500 | SOLD<br />
Apt. #2504 | 1 BR | 1 HO | 2 BA | 1,608 SF | $1,590,000 | SOLD
Apt. #824 | 2 HO | 2 BA | 1,524 SF | $7,100 | RENTED<br />
Apt. #2028 | <strong>St</strong>udio | 1 BA | 916 SF | $4,500 | RENTED
Apt. #2108 | <strong>St</strong>udio | 1 BA | 659 SF | $4,000 | RENTED<br />
Apt. #1424 | 1 HO | 2 BA | 1,509 SF | $7,000 | RENTED
Jaime Aguilera<br />
Lic. Associate Real Estate Broker<br />
212 470 8774<br />
110 Fifth Avenue<br />
New York, NY 10003