Smart Cities (PDF / 2646kb) - Arup
Smart Cities (PDF / 2646kb) - Arup
Smart Cities (PDF / 2646kb) - Arup

Create successful ePaper yourself
Turn your PDF publications into a flip-book with our unique Google optimized e-Paper software.
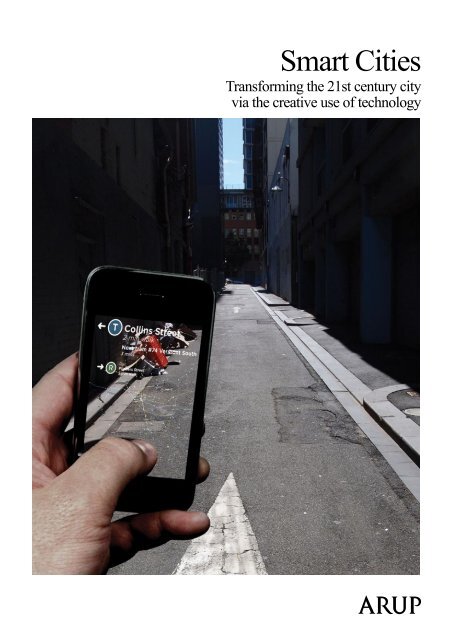
<strong>Smart</strong> <strong>Cities</strong><br />
Transforming the 21st century city<br />
via the creative use of technology
First published September 2010<br />
Written by informatics specialists from <strong>Arup</strong>’s IT<br />
and Communications Systems team, this report is<br />
informed by their experiences of working on cities<br />
in the Ecological Age, and the opportunities and<br />
challenges faced.<br />
The next report will focus on key smart city issues<br />
including: the value case for ICT in cities; a road map<br />
for political and civil leaders; and financing of smart<br />
solutions.<br />
Page 2<br />
Contents<br />
3 Executive summary<br />
4 21st century smart cities<br />
4 <strong>Smart</strong> cities<br />
5 Why the smart city?<br />
6 New urban user experience<br />
7 <strong>Smart</strong> cities as a system<br />
8 <strong>Smart</strong> behavioural change<br />
9 <strong>Smart</strong> city strategies<br />
11 Feedback loops<br />
12 <strong>Cities</strong> have a choice<br />
13 What we do<br />
13 Strategy and organisation<br />
13 Urban informatics<br />
13 Business systems and architecture<br />
13 Infrastructure<br />
14 <strong>Smart</strong> cities workshop reports<br />
16 <strong>Smart</strong> cities case studies<br />
24 Urban informatics examples<br />
Contacts<br />
London<br />
Volker Buscher<br />
volker.buscher@arup.com<br />
Léan Doody<br />
lean.doody@arup.com<br />
Hong Kong<br />
Michael Tomordy<br />
michael.tomordy@arup.com<br />
San Francisco<br />
Gareth Ashley<br />
gareth.ashley@arup.com<br />
Sydney<br />
Michelle Tabet<br />
michelle.tabet@arup.com<br />
Jason McDermott<br />
jason.mcdermott@arup.com
Executive summary<br />
<strong>Cities</strong> are real-time systems, but rarely<br />
run as such. In the past many have<br />
used Information and Communications<br />
Technology (ICT) to improve performance<br />
at a departmental level including mobility,<br />
utilities, community and eGovernment<br />
services. In these cities “smart<br />
technologies” are creating more efficient<br />
systems and better informed citizens.<br />
Now leading cities have started to push<br />
this concept further. They are exploring<br />
how smart cities can add value within<br />
a strategic framework. This will mean<br />
moving from departmental solutions to a<br />
city wide approach, creating economies of<br />
scale and scope that will result in:<br />
• Economic development and the creation<br />
of jobs.<br />
• Promoting resource efficiency and<br />
mitigating climate change.<br />
• Providing a greater place to live and<br />
work.<br />
• Running cities more efficiently.<br />
• Supporting communities<br />
With the Internet of Things (the networked<br />
connection between everyday objects) now<br />
including smart phones and tablets, social<br />
media, super fast broadband, and real-time<br />
instrumentation, we already have all the<br />
necessary tools to deliver smart cities.<br />
So how can we harness the power of these<br />
emerging technologies?<br />
Amidst the vast array of options and<br />
possibilities, which this report will attempt<br />
to cut through and organise, the core<br />
message is that now is the time for cities to<br />
take ownership of this issue. Industry has<br />
developed services that cities could procure,<br />
either through public private partnerships<br />
or in more traditional ways. But to capture<br />
the opportunities cities need to be informed<br />
users of smart concepts.<br />
Governance structures must reflect political<br />
priorities and deliver clear leadership for<br />
smart services. <strong>Cities</strong> need to develop an<br />
architecture in which technology can evolve,<br />
providing space for global players to create<br />
value and start ups to innovate. Citizens<br />
need to see the value in these services and<br />
have access to them through well designed<br />
interfaces.<br />
We believe smart cities will become part of<br />
the tool kit for our political and civil leaders<br />
to create 21st century cities and regions,<br />
better equipped to deal with climate change,<br />
population growth, demographic change and<br />
resource depletion, often in an environment<br />
of financial constraints.<br />
<strong>Arup</strong> is committed to meet these challenges;<br />
we are investing in our smart cities<br />
framework and welcome your feedback<br />
regarding our ideas.<br />
<strong>Arup</strong> | <strong>Smart</strong> <strong>Cities</strong> Page 3
21st century smart cities<br />
The challenges of climate change,<br />
population growth, demographic change,<br />
urbanisation and resource depletion<br />
mean that the world’s great cities need<br />
to adapt to survive and thrive over the<br />
coming decades. Slashing greenhouse<br />
gas emissions to prevent catastrophic<br />
climate change while maintaining or<br />
increasing quality of life could be a<br />
costly and difficult process. There is an<br />
increasing interest, therefore, in the role<br />
that information and communications<br />
technologies could play in transforming<br />
existing power-hungry metropolises into<br />
low-carbon cities of the future. But, as yet,<br />
few cities have fully grasped the possibility<br />
of becoming a ‘smart city’...<br />
<strong>Smart</strong> cities<br />
A smart city is one in which the seams and<br />
structures of the various urban systems are<br />
made clear, simple, responsive and even<br />
malleable via contemporary technology and<br />
design. Citizens are not only engaged and<br />
informed in the relationship between their<br />
activities, their neighbourhoods, and the<br />
wider urban ecosystems, but are actively<br />
encouraged to see the city itself as something<br />
they can collectively tune, such that it is<br />
efficient, interactive, engaging, adaptive and<br />
flexible, as opposed to the inflexible, monofunctional<br />
and monolithic structures of many<br />
20th century cities.<br />
This is not simply a philosophical aspiration<br />
but can directly address core strategic<br />
drivers, such as reducing costs or greenhouse<br />
gas (GHG) emissions, and increasing<br />
competitiveness.<br />
Page 4<br />
Key to this is the idea of measurement;<br />
of infrastructure, buildings and activities<br />
reporting their state and behaviour to systems<br />
that learn and adapt in response. These<br />
systems could be technological, legislative<br />
or social. The maxim “if you can’t measure<br />
it, you can’t manage it” applies here, and so<br />
the idea that urban fabric and activity can be<br />
‘instrumented’ and measured in detail, and<br />
acted upon instantly, enables a new form of<br />
management, operation and engagement,<br />
perhaps equivalent to the difference between<br />
a traditional high street bookstore and<br />
Amazon.com. The latter is a constantly<br />
shifting, scalable system that is automatically<br />
generated ‘on the fly’ by constant learning<br />
from millions of interactions in near-realtime,<br />
within a framework that enables<br />
both top-down intervention and bottom-up<br />
organisation.<br />
Every single interaction within Amazon.<br />
com reconfigures the offering in real-time.<br />
The offering itself is largely constructed<br />
from the actions of its users, such that it<br />
near-effortlessly moulds itself around the<br />
apparent desires of its users. For policymakers,<br />
often accused of being out of touch<br />
and only capable of taking the temperature of<br />
their citizens via ad-hoc, expensive opinion<br />
surveys or unrepresentative focus groups,<br />
this level of engagement seems impossible.<br />
Yet the smart city vision entails a similar<br />
shift in thinking. ICT gives city governments<br />
a way of involving citizens more directly<br />
in the direction and operation of their city,<br />
and by doing so, creates a platform through<br />
which the city can learn from their actions.<br />
Yet even though the city is also a form of<br />
distributed, even emergent real-time system<br />
in reality, it is rarely run as such. Most<br />
city governments retain the structure and<br />
operational modes of the 20th century city.
SOFT INFRASTRUCTURE<br />
HARD INFRASTRUCTURE<br />
In contrast, many if not all contemporary<br />
business and cultural sectors are being<br />
transformed by the internet, and businesses<br />
themselves increasingly understand<br />
and position themselves as data-driven<br />
organisations. This often entails moving<br />
information management, and its associated<br />
ICT, from a back-room activity right to the<br />
front of organisations in which they are<br />
reconceived as key strategic drivers. If the<br />
city is to be increasingly run on data, ICT<br />
can become a major tool of public policy in<br />
smart cities.<br />
The smart city vision does involve hard<br />
infrastructure—such as introducing smart<br />
grids alongside various forms of renewable<br />
energy generation and building new systems<br />
of mobility based on distributed networks—<br />
but is perhaps primarily articulated through<br />
‘soft infrastructure’ i.e. social networks and<br />
communities, legal and cultural systems, and<br />
various forms of ICT. This fast-moving layer<br />
is perhaps more approachable and appealing<br />
for cities, offering a way to quickly retrofit<br />
existing buildings and infrastructure with<br />
smart elements at relatively low-cost, whilst<br />
planning carefully for the longer-term shift to<br />
the ‘heavier’ forms of smart infrastructure.<br />
Equally, the output of such thinking, through<br />
the emerging medium of urban informatics,<br />
can often be engaging, informative, even<br />
beautiful, realised in the form of increasingly<br />
If a soft city can be<br />
retrofitted onto the<br />
existing city, what<br />
soft infrastructure<br />
does a city build?<br />
refined audio-visual displays and interfaces,<br />
installations, websites and systems, all<br />
driven via these real-time learning layers<br />
overlaid onto the existing city. This has the<br />
effect of ‘making the invisible visible’ thus<br />
raising awareness about urban infrastructure,<br />
activity and ecosystem.<br />
Why the smart city?<br />
The benefits of pursuing a smart city strategy<br />
are manyfold.<br />
Harvard Business School academics<br />
Rosabeth Moss Kanter and Stanley S. Litow<br />
have described a ‘smarter city manifesto’<br />
in order to address the many problems<br />
facing city governments in particular 1 . With<br />
a slant towards North American cities, the<br />
authors outline issues such as the silo-based<br />
structures governments ended up with at<br />
the end of the 20th century, combined with<br />
the inability of governments to stretch their<br />
services over the large sprawling distances<br />
and conditions of the contemporary city, a<br />
weakened civic leadership, and a focus on<br />
delivery rather than addressing the cause of<br />
problems (described as a lack of ‘strategic<br />
impact orientation’).<br />
1 “Informed and Interconnected: A Manifesto for <strong>Smart</strong>er <strong>Cities</strong>”,<br />
Rosabeth Moss Kanter and Stanley S. Litow, Harvard Business<br />
School Working Paper 09-141, 2009<br />
Trees Near You<br />
Trees Near You displays information on over 500,000 trees on New York City streets.<br />
For any area of the city, from block to borough, the different species that live there are<br />
displayed via a map interface. The app also indicates the environmental and economic<br />
benefits that these street trees provide.<br />
Trees Near You was created by Brett Camper using street tree census data publicly<br />
released by the New York city government, and won a Best Application Honorable<br />
Mention in the NYC BigApps competition.<br />
<strong>Arup</strong> | <strong>Smart</strong> <strong>Cities</strong> Page 5
Will<br />
contemporary<br />
ICT transform<br />
government and<br />
urban services<br />
as it has in<br />
other sectors?<br />
Page 6<br />
LOGISTICS<br />
MEDIA<br />
This can leave city governments in a position<br />
where they are unable to scale, where they are<br />
inefficient in delivery, where they are unable<br />
to create holistic, interconnected services due<br />
to a fragmented approach to strategic data,<br />
branding, operations and management.<br />
Kanter and Litow compare this with the notfor-profit<br />
or social innovation sector, which<br />
has been able to plug the gap at the local<br />
level, but which also suffers from an inability<br />
to scale and an inability to connect.<br />
We might also compare this with emergence<br />
of new media and social media-based<br />
services that have transformed apparently<br />
unrelated sectors, such as Facebook or<br />
iTunes for example, which have levels of<br />
engagement that city governments might<br />
only dream of. 33% of the Australian<br />
population is on Facebook and 25% of all<br />
music sales in the US are through iTunes.<br />
Both services are only six and seven years<br />
old respectively. This indicates a new kind of<br />
system, one that is user-centred, responsive,<br />
real-time, flexible, local and global,<br />
pervasive, location-based, platform-based,<br />
and so on. Compared to these new kinds of<br />
systems, how do existing city systems stack<br />
up?<br />
This perhaps implies that the expectations<br />
of citizens will become increasingly key.<br />
Perhaps the city’s systems will seem ‘broken’<br />
in comparison, unless they too evolve?<br />
RETAIL<br />
INTERNET OR REAL-TIME INFORMATION-BASED TRANSFORMATION<br />
HEALTH DESIGN<br />
ADVERTISING<br />
CITY<br />
GOVERNMENT<br />
+ URBAN<br />
SERVICES<br />
However, it also implies that this evolution<br />
of technology is something that city<br />
governments can take advantage of. These<br />
internet-based systems are predicated on a<br />
kind of connectivity quite different to the<br />
traditional corporate IT department and one<br />
that is almost becoming a de facto standard<br />
defining how systems in general should be.<br />
So this presents both a challenge and an<br />
opportunity to cities, in that citizens may<br />
increasingly expect urban systems to<br />
behave how the other systems in the rest of<br />
their life behave, but also that a city’s ICT<br />
services could also take advantage of these<br />
contemporary approaches.<br />
NEW urban user experience<br />
What might this mean in practice? The smart<br />
city is already around us all the time, to some<br />
extent 2 . Urban infrastructure now includes<br />
smartphones, wireless internet, netbooks<br />
and tablets, media façades, sensor networks,<br />
smart meters, RFID tags and so on, upon<br />
which sits a rich layer of sophisticated<br />
user experiences comprising social media<br />
like Twitter and Foursquare, ‘apps’, maps<br />
and augmented reality, as well as so-called<br />
‘e-government’ services.<br />
2 “The Street As Platform”, Dan Hill, in Best Technology Writing<br />
2009, Steven Johnson (ed.), Yale University Press, 2009. Also<br />
published at http://cityofsound.com/blog/2008/02/the-street-as-p.html<br />
3 ‘The Data-Driven Life’, Gary Wolf, New York Times, April<br />
26 2010. http://www.nytimes.com/2010/05/02/magazine/02selfmeasurement-t.html<br />
Trashtrack<br />
Developed by MIT’s SENSEable <strong>Cities</strong> Lab, TrashTrack is an experimental use of<br />
wireless sensor networks to trace the movement of waste in the city.<br />
Using simple mobile phone technology, sensors are attached to consumer waste<br />
products, such as aluminium cans or coffee cups. The sensors report the location of<br />
the object in real-time, as it embarks on its journey to landfill or recycling. This is<br />
then visualised and mapped, indicating how such techniques can provide insight into<br />
otherwise imperceptible urban processes.
BETTER<br />
EXPERIENCE<br />
INCREASED<br />
USAGE<br />
BETTER<br />
DATA<br />
RICHER<br />
INTERFACES<br />
However, the smart city also describes a<br />
step-change in both intensity and extent<br />
of connection, in that almost all aspects of<br />
infrastructure—from transit networks to<br />
energy, waste and water; from housing to<br />
street trees—can wirelessly broadcast their<br />
state and activity in real-time through the use<br />
of robust, cheap and discreet sensors. This<br />
concept is known as ‘the internet of things’,<br />
in which almost every inanimate object<br />
can become aware to some degree. As with<br />
contemporary engine control systems, smart<br />
urban infrastructure can tirelessly watch its<br />
own operation, predicting faults before they<br />
occur, optimising delivery of resources or<br />
services to match demand.<br />
Equally, sensors can be placed on existing<br />
infrastructure, such as installations that<br />
monitor water quality or air quality or mobile<br />
phone data revealing patterns of movement<br />
of people in the city.<br />
Multiply this by the increasing interest in<br />
both individual citizens and communities<br />
logging their own descriptive data about their<br />
lives and activities 3 , and by a vast and varied<br />
range of technologies of both input and<br />
output, the smart city emerges as a vision in<br />
which almost every urban activity is enabled<br />
by pervasive, wireless technology.<br />
The advantage for citizens is the sense that<br />
<strong>Arup</strong> | <strong>Smart</strong> <strong>Cities</strong><br />
BETTER<br />
EXPERIENCE<br />
How can smart<br />
cities generate<br />
better user<br />
experiences<br />
and better<br />
strategic data?<br />
their city has a series of smart interfaces,<br />
enabling a richer, more efficient, more<br />
personalised experience. The advantage for<br />
cities is in the more effective delivery of<br />
services, more efficient use of infrastructure<br />
and unprecedented strategic information on<br />
the use of the city and their services.<br />
This combination demonstrates the real<br />
potential of the smart city: the more effective<br />
delivery of popular services with vastly<br />
improved user experiences for citizens,<br />
which in turn delivers in-depth data on their<br />
operation.<br />
Better user experience generates increased<br />
uptake. Increased uptake generates better<br />
data. Better data generates better user<br />
experience. And so on.<br />
<strong>Smart</strong> City as a System<br />
Contemporary thinking about the integrated<br />
sustainable city—of the city as a system—<br />
can only be turned into reality with a smart,<br />
integrated approach to both delivery and<br />
strategy.<br />
In an interconnected urban system, trees<br />
and green walls naturally cool streets<br />
and buildings; their green waste can be<br />
transformed into energy via anaerobic<br />
digestion or similar biological treatment;<br />
Real-time Rome<br />
Using several days worth of mobile phone data for central Rome, MIT’s SENSEable <strong>Cities</strong><br />
Lab mapped detailed patterns of urban activity derived purely from SMS and voice call<br />
data. Choosing the week of the European Championships final, the mobile phone patterns<br />
could be mapped to particular dramatic events, such as Italy winning the final, parading the<br />
cup through the streets of Rome, or a Madonna concert the following weekend.<br />
<strong>Arup</strong> has developed a similar system, based around real-time sensing of mobile phones<br />
via Bluetooth and wi-fi.<br />
Given the near-ubiquity of mobile phones, many citizens are effectively walking around<br />
with sensors in their pockets. There are significant ethics and privacy issues to using<br />
such techniques but careful system design and operation can enable both an ethical and<br />
secure approach that respects the privacy of individuals appropriately.<br />
Page 7
If data is the<br />
connective tissue<br />
in an urban<br />
system, what<br />
urban data does<br />
a city government<br />
manage?<br />
this energy can be used to power a fleet of<br />
street cleaning vehicles; the vehicles can<br />
make use of the recycled greywater from<br />
nearby apartments; the organic waste from<br />
the apartments can be used in greenhouses<br />
on the roof; and this can deliver food back<br />
to the apartments or the café at street level,<br />
and so on. Nutrient cycles are closed, water<br />
cycles are closed, energy is transferred from<br />
one system to another, communities are<br />
engaged. Benefits are environmental, social<br />
and economic.<br />
Importantly, data forms part of the<br />
‘connective tissue’ linking these systems<br />
together—just as natural ecosystems rely<br />
on feedback loops—enabling these systems<br />
to be managed, balanced and efficient, as<br />
well as those feedback loops enabling the<br />
behavioural change required to make it<br />
happen. The strategic value derived from<br />
embedding data in such processes enables<br />
the system, and the city, to learn from its<br />
own activity, transforming almost all aspects<br />
of operation, from planning to delivery and<br />
beyond.<br />
This connected vision might be described as<br />
‘ecological age’ thinking, but is also heavily<br />
predicated on smart city thinking, which is<br />
intrinsically oriented around users, which<br />
intrinsically enables interoperability and<br />
lateral connectivity, which intrinsically binds<br />
disparate structures together rather than<br />
allowing them to float free of each other.<br />
Page 8<br />
ENERGY<br />
FOOD<br />
WATER WASTE<br />
LOGISTICS<br />
LAND USE<br />
MOBILITY<br />
So the idea of the smart city has become<br />
important not simply due to the emergence<br />
of the internet over the last two decades but<br />
also due to political, organisational, social,<br />
cultural and spatial challenges now facing<br />
city governments.<br />
While smart city thinking can address<br />
virtually every walk of life, as indicated by<br />
the internet’s extraordinary reach, climate<br />
change has substantially focused the thinking<br />
around smart cities in terms of reducing<br />
GHG emissions.<br />
<strong>Smart</strong> behavioural change<br />
As discussed, the area of smart cities<br />
encompasses a number of different<br />
technology-led or -enabled advances,<br />
running from the hard infrastructure of smart<br />
grids through to a soft infrastructure of<br />
community engagement.<br />
‘<strong>Smart</strong> <strong>Cities</strong> thinking’ also addresses<br />
the new products, services, protocols,<br />
and governance layers enabled by these<br />
contemporary ICT, and so the area also<br />
addresses organisational and cultural<br />
aspects, including the relationship between<br />
behavioural change and such approaches.<br />
Building on the need to address emissions<br />
and the potential of a smart infrastructure<br />
for engagement and management, a core<br />
premise is that people make bad decisions<br />
due to poor information and that with better<br />
Fix my Street<br />
Launched in February 2007, FixMyStreet is a web service to help people report, view,<br />
or discuss local problems with their local council by simply locating them on a map.<br />
Built by MySociety, a not-for-profit company, in conjunction with The Young<br />
Foundation, FixMyStreet smartly routes reports of things that are broken or dumped, or<br />
need fixing, cleaning or clearing, direct to the relevant council in the UK.<br />
Similar systems include CitySourced in the USA, which uses an iPhone ‘app’ as the<br />
primary interface.
information, behaviour change will follow,<br />
which can cut emissions and increase quality<br />
of life.<br />
This premise is supported by behavioural<br />
psychology research that indicates two key<br />
drivers of behavioural change are ‘active<br />
learning’ and ‘social proof’ i.e. trying<br />
something out, and seeing others doing<br />
it too. Contemporary ICT, such as social<br />
media, can enable this self-learning and<br />
self-reflection, as well as reinforce these<br />
broader social patterns, essentially making<br />
‘social proof’ visible. Drawing out these<br />
wider civic patterns of use may balance the<br />
individualising tendencies of only seeing<br />
personal data, say via smart meters, as well<br />
as leading to greater behavioural change.<br />
A precedent also exists in terms of water use<br />
in Australia, where significant behavioural<br />
change has been achieved through a<br />
combination of regulation (restrictions) and<br />
information (more focused and contextualised<br />
information on usage, sometimes indicating<br />
an individual’s performance in a wider social<br />
context or against targets set for the city).<br />
Household water use diminished by 7% from<br />
2000-01 to 2004-05, despite an increase in<br />
population during this period. (It is worth<br />
noting that this action was in response<br />
to severe drought i.e. a clear and present<br />
external environmental signal.)<br />
While many cities have been reluctant to<br />
directly address the possibility of sustainability-<br />
<strong>Arup</strong> | <strong>Smart</strong> <strong>Cities</strong><br />
POPULATION<br />
+1.4%<br />
-7%<br />
HOUSEHOLD<br />
WATER USE<br />
If people make<br />
bad decisions<br />
because of poor<br />
information,<br />
is the opposite<br />
true?<br />
related behaviour change amongst citizens,<br />
perhaps understandably given their history and<br />
culture, some cities are beginning to realise<br />
that it could significantly contribute to both<br />
a more sustainable city and a higher quality<br />
of life. London is expecting that 30% of its<br />
reduction in carbon emissions will be driven by<br />
behavioural change. In Helsinki, the Low2No<br />
project explicitly states that 50% of a citizen’s<br />
carbon footprint concerns lifestyle choices<br />
and has launched an informatics-enabled<br />
behavioural change workstream accordingly.<br />
Other sectors, such as media, marketing,<br />
product/service design, social innovation<br />
and non-profits, aim to enable behavioural<br />
change as a core mission. Although they<br />
might have different motives and drivers,<br />
cities can also use these tools to effect more<br />
sustainable urban systems.<br />
<strong>Smart</strong> city strategies<br />
From the smart city projects <strong>Arup</strong> has been<br />
involved with, it is possible to discern three<br />
interlinked component parts of a smart<br />
city vision, each of which is necessary to<br />
complete the holistic view of the smart<br />
city. (It should be noted that any smart city<br />
strategy is itself necessarily integrated into<br />
other strategies i.e. mobility, sustainability,<br />
economic development and so on.)<br />
The overarching framework or layer is that<br />
of urban information architecture. This<br />
describes the most obviously organisational<br />
Cabspotting<br />
Cabspotting, by San Francisco Exploratorium and design firm Stamen, traces San<br />
Francisco’s taxi cabs as they travel throughout the Bay Area. The patterns traced by each<br />
cab create a real-time map of patterns of movement and urban activity across the city.<br />
The data is derived from GPS tracking devices fitted into Yellow Cabs and used by<br />
dispatchers.<br />
Numerous visualisations have been produced based on the data, all exploring what<br />
insightful information about the city can be derived from apparently mundane data.<br />
Page 9
Is IT too<br />
important<br />
for the IT<br />
department?<br />
Page 10<br />
1<br />
Head of IT<br />
Corporate IT<br />
Provide IT services<br />
to city employees<br />
set of activities, from the procurement,<br />
design and operational models of ICT<br />
services and infrastructure through to<br />
the shape, profile and staffing of the city<br />
government itself. The implication here is<br />
that the smart city is so different in essence<br />
to the 20th century city that the governance<br />
models and organisational frameworks<br />
themselves must evolve.<br />
In simple terms, cities will have a housing<br />
strategy, a transport strategy, a sustainability<br />
strategy and so on, yet the IT strategy,<br />
if it exists, will tend to be focused on<br />
streamlining administration, cutting basic<br />
operational costs and perhaps internal<br />
knowledge management. Yet when it is so<br />
integral to the functioning of the 21st century<br />
city, why would this not assume a similar<br />
level of significance as those public-facing<br />
strategies? Particularly if it enables more<br />
effective ways of delivering those strategies.<br />
An urban information architecture would<br />
describe how this might occur.<br />
This involves a strategic re-framing of how<br />
ICT is thought of in the organisation. At one<br />
level it needs to re-badge ICT itself. Within<br />
several cultures, it is still usually described<br />
as ‘IT’, and taken to mean those backroom<br />
administrative operations, somewhat<br />
subservient to other more strategic functions.<br />
2<br />
CIO<br />
eGovernment<br />
Provide city services<br />
online to citizens<br />
Tracing Velib’<br />
Researcher Fabien Girardin has created a visualisation of daily usage patterns for both<br />
the Bicing bike-sharing network in Barcelona, and its equivalent, Velib’, in Paris.<br />
Using a technique known as ‘scraping’, Girardin used the data published on the bikesharing<br />
network websites, indicating the number of bikes left at each hub. He then<br />
overlaid a simple Excel-style visualisation over a Google Map of the city, creating an<br />
animation of how the bikes move around the city.<br />
In this way, it is easy to see, for example, how the bikes in Barcelona move from<br />
the city to the beach and back again, on a sunny Sunday afternoon, or how the bikes<br />
shift in and out of the centre of Paris around lunchtime. Simple daily patterns are<br />
perceptible in the performance of infrastructure, and such data can be drawn simply<br />
from municipal websites.<br />
3<br />
CIO+<br />
<strong>Smart</strong> City<br />
Address city’s major<br />
strategic issues<br />
Yet this doesn’t reflect the contemporary<br />
cultural status associated with internet-based<br />
communications technology.<br />
In other words, can we really describe a<br />
teenager updating her Facebook status from<br />
her mobile as she walks down the street as<br />
‘IT’? Technically, it might be, but it is also<br />
obviously deeply social and cultural, highlyvalued<br />
and intimate, increasingly a core part<br />
of how people perceive themselves and what<br />
they are.<br />
Perhaps ‘IT’ is too important for the IT<br />
department?<br />
By this, it should not be inferred that a city’s<br />
current IT department is without value; quite<br />
the opposite. Rather, it means realising the<br />
smart city vision will entail repositioning<br />
ICT at the strategic heart of the organisation,<br />
with the new culture, status and approach<br />
intimated to above.<br />
<strong>Cities</strong> will be at differing stages along<br />
this evolution, and this progress can often<br />
be discerned from indicators such as the<br />
presence, status, and budget of their Chief<br />
Information Officer (CIO). Yet there is<br />
far more to it than one role. So an urban<br />
information architecture may be required to<br />
help the city in defining projects, making
MODEL<br />
SENSORS FEEDBACK<br />
ACTIVITY<br />
decisions about outsourcing, procurement<br />
and technical design, operational frameworks<br />
and management, organisational structure,<br />
data protocols and policies. It transforms a<br />
smart city vision into strategy.<br />
Within a smart city, urban informatics plays<br />
the role of making data tangible, by creating<br />
design-led interventions, often drawing from<br />
real-time data on urban activity. It provides<br />
the new interfaces through which citizens<br />
can engage with their city. It encompasses<br />
web and mobile services, urban-scale<br />
displays, installations within architecture and<br />
infrastructure, and extends from analytical<br />
dashboards to public art.<br />
Examples might include feedback loops<br />
on energy consumption or environmental<br />
quality, real-time transport information,<br />
visualisations of traffic, network activity<br />
or food miles and so on (case studies can<br />
be found throughout this report). Not all<br />
of these examples need be commissioned,<br />
managed or owned by city governments—<br />
indeed, a contemporary approach might be<br />
for a public body to publish and manage<br />
civic data upon which others could build.<br />
This layer is the most obvious to citizens,<br />
and so it is through informatics that activities<br />
enabling behavioural change might be<br />
effected and coordinated. Urban informatics<br />
is the public interface onto the smart city.<br />
<strong>Arup</strong> | <strong>Smart</strong> <strong>Cities</strong><br />
How should a<br />
smart city organise<br />
itself? What<br />
departments exist<br />
in the 21st century<br />
city government?<br />
The third layer, instrumenting resource<br />
systems, is a genuine enabler of the other<br />
components. It involves the design—for<br />
either new-build or retrofit—of sensor<br />
networks and associated technologies that<br />
report on the activity and performance of<br />
infrastructure. This reporting is increasingly<br />
real-time, recognising that efficient operation<br />
requires immediate feedback loops and is<br />
built upon a platform of software services and<br />
wireless sensor networks distributed across<br />
much of the city’s infrastructure, including<br />
natural ecosystems as well as built fabric.<br />
Interpreting the concept of sensors widely,<br />
they could include the data from integrated<br />
ticketing systems as well as comments<br />
from the general public via council web<br />
services, or derived from ‘bottom-up’<br />
community-initiated services. They provide<br />
a constant, ongoing feedback that drives<br />
both informatics and operations as well as<br />
building longitudinal data to inform strategic<br />
decision-making.<br />
Feedback loops<br />
The interplay between these three systems<br />
enables feedback loops on urban activity.<br />
Urban activity is instrumented and<br />
monitored by sensors, which feed data to<br />
an organisational layer or model, which is<br />
then fed back via informatics, such that<br />
it can affect urban activity i.e. modify the<br />
operation of infrastructure (re-route trams to<br />
where demand exists, for example) or inform<br />
Medialab Prado<br />
The media façade offers the opportunity to create feedback loops into civic spaces.<br />
Here, the MediaLab Prado’s well-designed LED display is integrated into the form of<br />
the building and the content is integrated into the programming of the organisation.<br />
Here, the feedback loops concern the work created by the organisation rather than any<br />
particular sustainability information, yet indicate how informatics might highlight and<br />
reinforce patterns of work and play as well as infrastructure.<br />
Page 11
citizens about environmental qualities, and<br />
so on. This can create a virtuous cycle, if<br />
well-designed and well-run.<br />
At a basic level, this is how smart meters can<br />
modify energy use in the home. The meter<br />
(sensor) monitors energy use (activity),<br />
which is then quickly analysed (modelled)<br />
and displayed (feedback) to the user, whose<br />
energy use drops. While the longitudinal<br />
patterns of activity around these simple<br />
feedback loops indicate that this needs to be<br />
part of a wider series of behavioural change<br />
strategies and activities, this ‘smart meter<br />
effect’ begins to indicate their potential<br />
nonetheless.<br />
<strong>Cities</strong> have a choice<br />
Political and civil leaders working with<br />
businesses and the community can create a<br />
21st century city using <strong>Arup</strong>’s <strong>Smart</strong> <strong>Cities</strong><br />
Framework, described above, as a guide.<br />
Globally, many cities are beginning to<br />
explore these new approaches. Some<br />
are introducing a top-down approach<br />
starting with a strategic framework and<br />
then deploying this to guide major urban<br />
development projects; others are developing<br />
specific, distributed interventions for<br />
buildings, open data or mobility, before<br />
trying to connect these dots. Either approach<br />
is valid and in 2010, it is more important<br />
to act than to stand back and wait to be<br />
transformed.<br />
Page 12
What we do<br />
Our <strong>Smart</strong> <strong>Cities</strong> offering is a service for policy makers, executives, city departments,<br />
developers, and industry.<br />
We help our clients improve economic performance, resource efficiency, climate change<br />
mitigation, operational efficiency and to deliver a greater place to live and work. We advise<br />
our clients on defining how much to invest and how much value they can get from being<br />
“smart”.<br />
Our range of services covers strategy and<br />
organisation, urban informatics, business<br />
systems and architecture, and infrastructure<br />
advice that, taken together or individually,<br />
will help deliver smart services. We<br />
apply these services at city scale, on<br />
urban developments or for specific areas<br />
including transportation, utilities, property<br />
and eGovernment services.<br />
Strategy and organisation<br />
<strong>Arup</strong> is experienced in developing strategies<br />
that reflect priorities for our clients. We<br />
produce business cases to establish ongoing<br />
viability of projects. Our leadership<br />
development ensures that the client’s<br />
procurement strategy determines the options<br />
on ownership and the best supply chain mix.<br />
During implementation we provide technical<br />
assurance and programme management to<br />
ensure that projects are delivered on time<br />
and within budget. We help establish the best<br />
way to deliver smart cities.<br />
Urban Informatics<br />
<strong>Arup</strong> can design urban interfaces that help<br />
visualise real-time feedback loops of urban<br />
activity. These can be engaging design-led<br />
installations at a civic or neighbourhood<br />
scale, behavioural-change strategies, or<br />
functional web services for citizens and<br />
city officials, making visible the invisible<br />
patterns of activity in the city. Informatics<br />
provides the public interface onto the smart<br />
city.<br />
<strong>Arup</strong> | <strong>Smart</strong> <strong>Cities</strong><br />
2.<br />
CS<br />
CS S<br />
INFORMATICS<br />
1. AR<br />
ORGANISATION<br />
OR<br />
STRATEGY<br />
3.<br />
SYSTEMS<br />
INTERFACE<br />
INFRASTRUCTURE<br />
Business systems and architecture<br />
<strong>Arup</strong> designs the broad range of technologies<br />
that deliver smart city projects. Our first<br />
step is to develop an enterprise architecture<br />
including key requirements, information<br />
systems and a supporting technical<br />
infrastructure. Specifications can then be<br />
developed to support costing and tendering.<br />
We define the information systems smart<br />
cities are built upon.<br />
Infrastructure<br />
The design of telecoms infrastructure is a<br />
key component of smart solutions. <strong>Arup</strong> is<br />
experienced in the design of infrastructure<br />
on major projects. Our capabilities include<br />
regulatory strategy, design of fixed ducts and<br />
mobile communications infrastructure, and<br />
site wide IT services (such as datacentres,<br />
control room, TV and satellite antennae).<br />
Future proofing infrastructure is a defining<br />
aspect of smart cities.<br />
Page 13
<strong>Smart</strong> <strong>Cities</strong> workshop reports<br />
<strong>Arup</strong>’s <strong>Smart</strong> <strong>Cities</strong> workshop reports are the output of <strong>Arup</strong> <strong>Smart</strong><br />
<strong>Cities</strong> workshops.<br />
The workshop report is designed to collate into one concise document<br />
the workshop findings, key recommendations and a tailored road<br />
map to a <strong>Smart</strong> City that provides a bespoke solution to each city’s<br />
environmental, social, economic and political context, with case<br />
studies and research as supporting evidence. It can include prototypes<br />
of urban services, such as those described later in ‘Urban Informatics<br />
examples’.<br />
Melbourne <strong>Smart</strong> City is one such report produced as a result of the<br />
C40 UrbanLife workshop in March 2010, and is available to C40<br />
cities and others, via the contacts listed at the back of this document.<br />
<strong>Arup</strong> and the City of Melbourne worked<br />
together to produce a workshop under the<br />
C40 UrbanLife programme in March 2010.<br />
The workshop addressed the possibilities<br />
of a ‘smart city’ in terms of reduction of<br />
greenhouse gas emissions (GHG) as part of<br />
a broader urban sustainability agenda for<br />
Melbourne.<br />
Within this scope, particular focus was<br />
placed on the possibilities of enabling<br />
behavioural change via community<br />
engagement using contemporary information<br />
and communications technology (ICT) to<br />
generate a resilient and sustainable urbanism.<br />
Page 14<br />
The report is primarily centred on initially<br />
helping reduce Melbourne’s GHG but also<br />
drawing in other aspects of sustainability<br />
(mobility, food, systems, economic<br />
development and so on).<br />
As such, the workshop decribed an initial<br />
approach to understanding this new soft<br />
infrastructure of the city, seeing the city<br />
as a system in an ‘ecological age ‘vision,<br />
enabling behavioural change and demand<br />
management through urban informatics as<br />
well as deploying efficient operation and<br />
governance.
<strong>Arup</strong> | <strong>Smart</strong> <strong>Cities</strong><br />
MELBOURNE<br />
SMART<br />
CITY<br />
Page 15
<strong>Smart</strong> <strong>Cities</strong> case studies<br />
The following case studies indicate the range of smart city work being<br />
conducted by <strong>Arup</strong> globally and highlight the potential of the smart<br />
city approach.<br />
Page 16
Low2No, Jätkäsaari, Helsinki<br />
This urban development project in Jätkäsaari, Helsinki, features a<br />
wide range of pervasive informatics strategies and services aimed<br />
at significant reduction in the carbon footprint of the community.<br />
With informatics strategy and services currently being developed<br />
by <strong>Arup</strong> and Experientia, these services will include in-street<br />
displays that report on personal and civic footprints in real-time,<br />
next-generation smart meter concepts for apartments and displays<br />
and services that highlight patterns of production—including urban<br />
agriculture and knowledge-based work—in order to reinforce<br />
innovation processes in the area.<br />
The Low2No development is intended to become an exemplar in<br />
terms of carbon neutral urban development, including smart city<br />
solutions.<br />
<strong>Arup</strong> | <strong>Smart</strong> <strong>Cities</strong><br />
Keywords<br />
<strong>Smart</strong> cities, smart<br />
infrastructure,<br />
urban informatics,<br />
visualisation<br />
Organisation<br />
<strong>Arup</strong><br />
Experientia<br />
Galley Eco Capital<br />
SRV<br />
Sitra<br />
VVO<br />
Location<br />
Helsinki, Finland<br />
Page 17
EcoMap, Amsterdam and San Francisco<br />
Urban EcoMap is an interactive web service that displays<br />
environmental footprints for Amsterdam and San Francisco.<br />
(footprint comprises CO 2 emissions, waste and transportation<br />
activity, broken down by postal code.)<br />
Created by Cisco and others, EcoMap attempts to raise awareness<br />
and build community activity around reduction of GHG emissions.<br />
Page 18<br />
Keywords<br />
Urban informatics,<br />
information<br />
visualisation<br />
Organisation<br />
Cisco<br />
<strong>Arup</strong><br />
Location<br />
San Francisco<br />
Amsterdam
Barangaroo, Sydney<br />
The Barangaroo project in Sydney is a major urban development<br />
project on the harbour foreshore.<br />
Working with Rogers Stirk Harbour + Partners and Bovis Lend<br />
Lease, <strong>Arup</strong> is developing an informatics strategy for the site which<br />
includes smart demand management techniques via engaging<br />
public interfaces onto the state-of-the-art sustainable infrastructure<br />
being developed for the project.<br />
The informatics services will address water use, energy use and<br />
other resource use. Yet the development will also benefit from<br />
a pervasive approach to ICT that enables smart workplaces, in<br />
office spaces, co-working spaces and across the public domain.<br />
Responsive public interfaces will display sustainable infrastructure<br />
patterns, real-time transit activity and community information, as<br />
well as enable a public art strategy.<br />
<strong>Arup</strong> | <strong>Smart</strong> <strong>Cities</strong><br />
Keywords<br />
Urban informatics,<br />
smart infrastructure,<br />
information<br />
visualisation<br />
Organisation<br />
Rogers Stirk Harbour +<br />
Partners<br />
Bovis Lend Lease<br />
<strong>Arup</strong><br />
Location<br />
Sydney, Australia<br />
Page 19
New Songdo City, Incheon<br />
This new ‘eco-city’ constructed on marshland near Incheon, South<br />
Korea, is a private development by Gale International, supported<br />
by new ‘hard infrastructure’ provided by Incheon, and designed by<br />
Kohn Pedersen Fox and <strong>Arup</strong>, amongst others.<br />
However, the ‘soft infrastructure’ is arriving courtesy of Cisco<br />
which envisages a layer of urban services supporting residents and<br />
workers in the city, including direct access to healthcare, education,<br />
local municipal services, video conferencing, information and<br />
recreational facilities, amongst other everyday urban activities.<br />
These are delivered over high-speed networks and to multiple<br />
platforms in the home and office.<br />
With such developments, Cisco suggests embedding such an ‘urban<br />
services layer’ into the city can generate significant additional<br />
returns for developers, ranging from an extra US$3 per m 2 as<br />
‘standard’, to US$8 per m 2 in an ‘advanced’ implementation, to<br />
US$13 per m 2 in a ‘transformational’ development, in which smart<br />
city services are integrated from the very beginning of the project.<br />
Page 20<br />
Keywords<br />
<strong>Smart</strong> cities, smart<br />
infrastructure, urban<br />
services<br />
Organisation<br />
Incheon Municipal<br />
Council<br />
Gale International<br />
Cisco<br />
Kohn Pedersen Fox<br />
<strong>Arup</strong><br />
Location<br />
Incheon, South Korea
The CLOUD, London<br />
The CLOUD is a proposal for a ‘civic-scale smart meter’ for<br />
London, connected to the 2012 Olympic Games.<br />
A giant viewing structure, the CLOUD is composed of ETFE<br />
bubbles, laced with thousands of energy-efficient LED lights.<br />
These can be addressed to form pixellated patterns, which are<br />
high-resolution when viewed from a distance. In this way, the<br />
structure display video – such as the Games itself – or be used as an<br />
enormous data visualisation platform displaying, say, the internet<br />
traffic patterns of London (assessing the ‘mood’ of the city, as<br />
well as its global connectivity), public transport activity, energy<br />
consumption and so on.<br />
The viewing experience for those within the CLOUD, looking<br />
down on London, creates a form of augmented reality, in which<br />
visualisations can be overlaid onto the city beneath.<br />
<strong>Arup</strong> | <strong>Smart</strong> <strong>Cities</strong><br />
Keywords<br />
Urban informatics,<br />
information<br />
visualisation<br />
Organisation<br />
MIT<br />
<strong>Arup</strong><br />
Atmos<br />
Google<br />
Location<br />
London<br />
Page 21
© <strong>Arup</strong><br />
Legible London, UK<br />
Legible London is a ground breaking scheme to develop a system<br />
of mapping and wayfinding information tailored specifically<br />
to the needs of pedestrians. <strong>Arup</strong> has provided strategic advice,<br />
programme management and technical support to Transport for<br />
London (TfL) for this innovative and organisationally complex<br />
programme.<br />
The information will be consistently presented through a TfL<br />
branded suite of on-street signage across London, and integrated<br />
with existing local Borough and TfL customer information<br />
(including inside London Underground and London rail stations, on<br />
bus shelters and via new technology).<br />
The programme is now integrated into TfL’s business as usual<br />
processes across a range of TfL departments, with clear ownership<br />
and roles and responsibilities determined. <strong>Arup</strong> retains an advisory<br />
role for the programme, providing guidance to the programme<br />
manager as required.<br />
Page 22<br />
Keywords<br />
Wayfinding<br />
Client<br />
Transport for London<br />
Location<br />
London, UK
© <strong>Arup</strong><br />
Dongtan, China<br />
<strong>Arup</strong> was the designer and masterplanner for Dongtan, the world’s<br />
first eco-city. The 8,600 ha site is located on the third largest island<br />
in China at the mouth of the Yangtze River. The client’s aim was to<br />
create a development with low energy consumption that is as close<br />
to carbon neutral as possible. Comprised of three villages, with the<br />
demonstrator phase for up to 10,000 people completed by 2010,<br />
Dongtan will be a vibrant city that will create many new jobs.<br />
<strong>Arup</strong> developed an ICT strategy that supported the overall<br />
sustainability objectives for the site. We proposed an Urban<br />
Information Architecture of services, systems, networks and<br />
infrastructure. This would support the urban strategies and deliver<br />
information on resource availability to residents, businesses,<br />
visitors and city management in Dongtan. Examples include the<br />
provision of real-time public transport information across the<br />
site; energy information at various scales to support end users,<br />
districts and the management company; and waste information.<br />
This information would be delivered over a variety of platforms—<br />
mobile phone, Internet, urban displays.<br />
<strong>Arup</strong> | <strong>Smart</strong> <strong>Cities</strong><br />
Keywords<br />
Urban information<br />
architecture<br />
Telecoms infrastructure<br />
Client<br />
Shanghai Industrial<br />
Investment Corporate<br />
(SIIC)<br />
Location<br />
Dongtan, China<br />
Page 23
Urban informatics examples<br />
<strong>Arup</strong> produced a series of fictional example visualisations of potential<br />
informatics services for a C40 UrbanLife workshop in Melbourne in<br />
March 2010.<br />
The images centre on both Melbourne and the workshop’s themes,<br />
and worked as ‘sketches’ to help make concrete the content of the<br />
workshop without directing it. Note that not all are intended to be<br />
exemplars; some illustrate issues with visualisation- or informaticsled<br />
approaches, and are used in a collaborative workshop context.<br />
Page 24
C40 UrbanLife: Melbourne <strong>Smart</strong> City<br />
Resources<br />
Civic smart meter<br />
City-wide service in which streets and blocks can<br />
broadcast their resource data (energy, water etc.)<br />
to a City of Melbourne service, which collates and<br />
verifies the data, and then distributes to public<br />
displays enabling civic pride around sustainability.<br />
C40 UrbanLife: Melbourne <strong>Smart</strong> City<br />
Resources<br />
Each building, block or street<br />
has a public ‘digital shadow’<br />
conveying more detailed data<br />
on its performance and targets.<br />
‘Transparent’ City buildings<br />
All City of Melbourne buildings convey information<br />
about their real-time resource use (primarily<br />
electricity, gas and water) via smart networked<br />
displays fixed to outside of each building. There is<br />
a corresponding webpage for each building (also<br />
accessible via QR code displayed on-screen.)<br />
Display is legible from a distance (red<br />
means building is over its targets,<br />
currently) as well as up-close.<br />
<strong>Arup</strong> | <strong>Smart</strong> <strong>Cities</strong><br />
Display indicates targets for energy<br />
(top) and water (bottom), and reports<br />
in ‘real-time’, hourly, fed by building<br />
management systems.<br />
Displays attached to outside of<br />
all City of Melbourne buildings<br />
conveying real-time data on<br />
building resource use.<br />
Displays are designed to deliver<br />
detailed information up-close,<br />
and provide ‘glance-able’<br />
information from a distance.<br />
As smart meters become more<br />
prevalent, buildings, blocks and<br />
streets can deliver their data to<br />
a City of Melbourne aggregator.<br />
Displays are designed to deliver<br />
detailed information up-close,<br />
and provide ‘glance-able’<br />
information from a distance.<br />
Each building has a display, with QR<br />
code leading to more detail for that<br />
building.<br />
Page 25
C40 UrbanLife: Melbourne <strong>Smart</strong> City<br />
Environment<br />
Water sculpture<br />
An installation in the River Yarra that uses river<br />
water itself to convey the water quality in the river,<br />
and in the litter traps that dot the banks. In doing so,<br />
it illustrates the effect and value of cleaning the river.<br />
C40 UrbanLife: Melbourne <strong>Smart</strong> City<br />
Health<br />
Page 26<br />
Jets of water burst<br />
intermittently to visualise levels<br />
of water quality in the litter trap<br />
(near jet) and in the river (far jet).<br />
Fountain jets can be lit to indicate<br />
water quality (red = bad). Jets stop/<br />
start to ‘draw’ words and numbers in<br />
the water, illustrating change in data.<br />
Stadium as canvas for visualisation<br />
Contemporary buildings can be used as a canvas<br />
for display of information, such as data visualisation.<br />
Here, Melbourne’s AAMI Park stadium conveys realtime<br />
data on bike use vs. car use within the city, while<br />
the stadium is not in use<br />
LEDs are often deployed within<br />
buildings like the this stadium. There<br />
may be an opportunity to re-use such<br />
buildings as displays.<br />
Real-time data on bike use in<br />
the city is drawn from various<br />
sensors dotted around the city.<br />
Key landmarks, such as the AAMI<br />
Park stadium, can act as ‘civic-scale<br />
smart meters’, conveying data visible<br />
at the urban scale.<br />
Pumps can be powered by the<br />
tide of the river itself, and use<br />
the river water as the display.<br />
Installation is visible at different<br />
times along the course of the<br />
Yarra, yet when not activated<br />
does not impinge upon the view<br />
of the river or its activity.<br />
Stadium panels are lit (via<br />
embedded LED) to indicate<br />
proportion of bikes (green)<br />
versus proportion of private<br />
vehicles (grey).
C40 UrbanLife: Melbourne <strong>Smart</strong> City<br />
Health<br />
Vélo smart bike garage<br />
A distributed, networked bike infrastructure,<br />
featuring ‘robot’ bike garages which conveys their<br />
state (occupancy, emissions saved by cycling etc.) in<br />
real-time on their exteriors and onto smart poles &<br />
screens around the city as well as phones/web.<br />
‘Vélo’ system distributes data to<br />
screens and smart poles around the<br />
city as well as to phones/web.<br />
C40 UrbanLife: Melbourne <strong>Smart</strong> City<br />
Mobility<br />
<strong>Smart</strong> Home Delivery<br />
Enabling people to go shopping without driving,<br />
bikes and electric vans deliver produce from<br />
markets, or goods from warehouses located in<br />
suburbs, at your convenience, tracked via phone.<br />
Bikes wait until they have<br />
enough to make the trip<br />
worthwhile, although not longer<br />
than customer desires.<br />
While bikes serve markets and dense<br />
high-streets, electric vans deliver<br />
from warehouses dotted around<br />
suburbs, often during off-peak times.<br />
<strong>Arup</strong> | <strong>Smart</strong> <strong>Cities</strong><br />
At night, bike indicator is lit (by LED)<br />
and functional display becomes<br />
urban performance.<br />
Indication of CO2 saved by<br />
using this mode of delivery<br />
(as opposed to driving to/from<br />
same destinations).<br />
As retail no longer has to carry<br />
excess stock, it can focus on the<br />
retail experience and fit into smaller<br />
spaces.<br />
<strong>Smart</strong> card-based bike hire<br />
system generates detailed data<br />
on activity in real-time<br />
Building/system tracks<br />
presence of cyclists in the area<br />
and regulates building systems<br />
accordingly<br />
Facade of building indicates<br />
current occupancy level by LED<br />
screen component and neon<br />
bike sculpture which moves<br />
across the roof<br />
Page 27
C40 UrbanLife: Melbourne <strong>Smart</strong> City<br />
Mobility<br />
Distributed mobility<br />
Real-time data indicating location, speed,<br />
occupancy etc. is drawn directly from trams, buses<br />
and trains. This data is visualised into interactive<br />
‘living maps’ of the city’s transit (which is combined<br />
with bike and pedestrian wayfinding information).<br />
Tram-stops, bus-stops and train<br />
stations are ‘informationally-rich’<br />
spaces, embedded with real-time<br />
transit data & wayfinding elements.<br />
C40 UrbanLife: Melbourne <strong>Smart</strong> City<br />
Mobility<br />
Public transport space<br />
Vehicles such as trams, buses and trains are seen as<br />
high-quality public space, offering amenities such as<br />
free wi-fi as well as real-time location-based information.<br />
These services provide users with unparalleled service,<br />
as well generating real-time data on mobility patterns,<br />
occupancy rates, interaction and so on.<br />
Page 28<br />
Distributing pervasively (mobile, web,<br />
street) increases the amenity and<br />
quality of service associated with<br />
walking, cycling and public transit.<br />
Vehicles, inside and outside, can<br />
also incorporate information to<br />
convey its position, occupancy<br />
levels, destination etc.<br />
Projected signs contain<br />
real-time information as well<br />
as directions, and highlight<br />
connectivity between modes.<br />
Real-time visualisation of trams,<br />
buses and trains in Melbourne,<br />
indicating connections & delays,<br />
drawn direct from the vehicles.<br />
All trams, buses and trains<br />
offer free public wi-fi on-board,<br />
providing a level of service that<br />
cars cannot compete with.
C40 UrbanLife: Melbourne <strong>Smart</strong> City<br />
Mobility<br />
Informational amenity<br />
Tram-stops, bus-stops and train stations are<br />
‘informationally-rich’ spaces, embedded with realtime<br />
transit data & wayfinding elements. Vehicles,<br />
such as trams and buses, are equipped with free<br />
wi-fi for customers, and report their position in realtime,<br />
generating data on all public mobility.<br />
Multi-touch displays enable<br />
navigation and wayfinding<br />
through real-time displays of<br />
connected Melbourne transit.<br />
C40 UrbanLife: Melbourne <strong>Smart</strong> City<br />
Resources<br />
Multi-language support for<br />
tourists and others built into all<br />
signage.<br />
‘The Net’: public data installation<br />
A layered net of LED lights hangs over a Federation<br />
Square ‘laneway’, displaying civic data in realtime.<br />
Data is derived from energy- and other<br />
resource-related patterns of use, as well as other<br />
urban activities, and visualised as an ethereal and<br />
engaging public art installation.<br />
‘The Net’ can be viewed from a<br />
distance, as a subtle intervention into<br />
the city, as well as interacted with<br />
directly via cellphones.<br />
<strong>Arup</strong> | <strong>Smart</strong> <strong>Cities</strong><br />
Much of the data is drawn direct<br />
from City of Melbourne systems,<br />
as well as offering interactive<br />
wayfinding and events.<br />
Free public wi-fi is available at<br />
all tram- and bus-stops and train<br />
stations as well as on-board<br />
trams, buses, and trains.<br />
Prominent signs are focused on<br />
making core information visible<br />
and legible from a distance<br />
‘The Net’ is capable of being<br />
suspended over laneways, and<br />
comprises a layered lattice of<br />
energy-efficient LED lighting.<br />
Page 29
C40 UrbanLife: Melbourne <strong>Smart</strong> City<br />
Mobility<br />
Urban Activity Monitor<br />
People leave digital ‘traces’ of their activity via their<br />
phones (esp. smartphones) and netbooks/tablets.<br />
These can be simply sensed in real-time, providing<br />
unprecedented level of detail (including individual<br />
patterns of activity, repeat visits &c.). This data can<br />
be used for strategic/design insight, or to drive realtime<br />
services.<br />
Elements of this data — once<br />
anonymised and aggregated to<br />
preserve privacy and security — can<br />
be displayed in situ.<br />
C40 UrbanLife: Melbourne <strong>Smart</strong> City<br />
Productivity<br />
Page 30<br />
Aggregated patterns of activity<br />
give a sense of how the city is<br />
being used in real-time.<br />
Urban activity — such as volumes<br />
of people at a place, drawn from<br />
volumes of cellphone activity — can<br />
be visualised for the city.<br />
‘This Is Your City’ dashboard<br />
A customisable dashboard for City of<br />
Melbourne staff, which sits ‘on top’ of<br />
existing systems and presents a real-time<br />
update on information relevant to them.<br />
Pervasive distribution means that staff get<br />
used to ‘living with data’.<br />
Aggregates existing systems<br />
(i.e. CoM service requests aka<br />
“SRs” and equivalent) into one<br />
overall view.<br />
‘Slower-moving’ data is lower<br />
down the screen.<br />
Individual citizens can be<br />
spotted via their phone’s unique<br />
ID (which is anonymised) such<br />
that repeat visits can be seen.<br />
Customised for each staff<br />
member, by each staff member,<br />
enabling each to configure<br />
what they’re interested in.<br />
Map-based navigation available<br />
for data-sets with location<br />
information.<br />
‘Real-time’ data in fast-moving<br />
newsfeed/ticker, drawing from<br />
business systems, external<br />
websites, buildings, sensors &c.<br />
Dashboard modules are fully<br />
customisable to user, drawn from<br />
constantly updated suite managed<br />
by CIO functions.
About <strong>Arup</strong><br />
<strong>Arup</strong> is the creative force at the heart of many of the world’s most prominent<br />
projects in the built environment and across industry. We offer a broad range of<br />
professional services that combine to make a real difference to our clients and<br />
the communities in which we work.<br />
We are truly global. From 90 offices in 35 countries our 10,000 planners,<br />
designers, engineers and consultants deliver innovative projects across the<br />
world with creativity and passion.<br />
Founded in 1946 with an enduring set of values, our unique trust ownership<br />
fosters a distinctive culture and an intellectual independence that encourages<br />
collaborative working. This is reflected in everything we do, allowing us<br />
to develop meaningful ideas, help shape agendas and deliver results that<br />
frequently surpass the expectations of our clients.<br />
The people at <strong>Arup</strong> are driven to find a better way and to deliver better<br />
solutions for our clients.<br />
We shape a better world.<br />
This report has been published by <strong>Arup</strong>’s IT & Communications Systems team.<br />
©<strong>Arup</strong> 2010
Contacts<br />
Volker Buscher (London)<br />
volker.buscher@arup.com<br />
Léan Doody (London)<br />
lean.doody@arup.com<br />
Michelle Tabet (Sydney)<br />
michelle.tabet@arup.com<br />
Jason McDermott (Sydney)<br />
jason.mcdermott@arup.com<br />
Gareth Ashley (San Francisco)<br />
gareth.ashley@arup.com<br />
Michael Tomordy (Hong Kong)<br />
michael.tomordy@arup.com<br />
‘The Net’ public data sculpture produced for the Melbourne workshop