Newton's law of cooling revisited - Cartan
Newton's law of cooling revisited - Cartan
Newton's law of cooling revisited - Cartan

Create successful ePaper yourself
Turn your PDF publications into a flip-book with our unique Google optimized e-Paper software.
1080 M Vollmer<br />
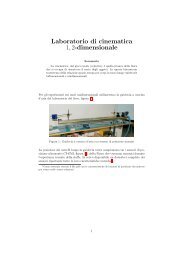
Figure 14. Comparison <strong>of</strong> measured temperatures (experiment) with numerical calculations <strong>of</strong><br />
T(t). Geometry (size 40 mm), �Tinit, and material properties (εav = 0.45) were given, the<br />
only free parameter was the heat transfer coefficient αCon. The best-fit results from a value <strong>of</strong><br />
9Wm −2 K −1 , which lies in the interval for typical values. Experimental values and theory with<br />
9Wm −2 K −1 lie so close to each other that they more or less form a single line in the plot.<br />
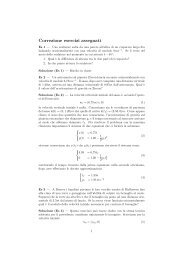
Figure 15. Left: experimental <strong>cooling</strong> curve <strong>of</strong> 30 mm Al metal cubes (thick black line), linear<br />
fit to temperature data �T < 30 K (straight line) and simple exponential fit (dots within black).<br />
Right: deviations between measured values (thick black) and linear fit (straight line) as a function<br />
<strong>of</strong> measured temperature.<br />
In order to point out the deviations from Newton’s <strong>law</strong>, a straight line along the low<br />
temperature data (red broken line) starts to deviate from the measurement already at around<br />
�T = 40 K. The (yellow) dots, which coincide nicely with the measurement, resemble a simple<br />
exponential decay fit (like equation (11) with A2 = 0 and A3 = 0); however, the constant term<br />
T0 which should be zero for Newton’s <strong>law</strong> (since we already plot the temperature difference)<br />
is around 8.8 K. This leads to the curved line in the semi-logarithmic plot, i.e. Newton’s <strong>law</strong> is<br />
not fulfilled. However, quite surprisingly, a simple exponential fit with an additional constant<br />
term provides a good description <strong>of</strong> the <strong>cooling</strong> curve!<br />
The deviations between measured temperatures and a simple fit to the low temperature<br />
data (�T < 30 K) is also shown in figure 15. The absolute values <strong>of</strong> the deviations depend on<br />
the chosen temperature range <strong>of</strong> the fit. The fit would still look fine for �T = 40 K, maybe