- Page 1 and 2:
Abstract Flexibility and domain dyn
- Page 3 and 4:
Flexibility and domain dynamics of
- Page 5 and 6:
Table of Contents Table of figures
- Page 7 and 8:
Can hinges be predicted by a simple
- Page 9 and 10:
FlexOracle (FO1, FO1M, FO) 176 Defi
- Page 11 and 12:
Conclusions 279 References 281 Tabl
- Page 13 and 14:
Table of tables Table 2.1: Amino ac
- Page 15 and 16:
Acknowledgements Committee: Mark Ge
- Page 17 and 18:
Introduction The problem of predict
- Page 19 and 20:
Ab initio methods attempt to model
- Page 21 and 22:
potential for simplification, motio
- Page 23 and 24:
Chapter 1: The molecular motions da
- Page 25 and 26:
MolMovDB is a resource for studying
- Page 27 and 28:
voids in proteins, helix-helix pack
- Page 29 and 30:
A full-feature version of FIRST5 wi
- Page 31 and 32:
gradual transition from the initial
- Page 33 and 34:
energy. Thus the first residue list
- Page 35 and 36:
activity, DNA-directed DNA polymera
- Page 37 and 38:
homology table to an entry in the C
- Page 39 and 40:
Highlight active sites from the CSA
- Page 43 and 44:
Figure 1.3: Conformational change a
- Page 45 and 46:
particular, we found that hinges te
- Page 47 and 48:
and the holo. In this case it is po
- Page 49 and 50:
Our molecular motions database serv
- Page 51 and 52:
We first made a simple GOR(Garnier-
- Page 53 and 54:
The morph trajectory was sterically
- Page 55 and 56:
protein in the Jmol window to his/h
- Page 57 and 58:
of the hinge was otherwise unclear,
- Page 59 and 60:
Catalytic Sites Atlas (nonredundant
- Page 61 and 62:
! ! ! ! ! h c = number of times res
- Page 63 and 64:
! ! ! ! µ h " d c D # H . It is eq
- Page 65 and 66:
As mentioned earlier, the fact that
- Page 67 and 68:
STRIDE[50] recognizes secondary str
- Page 69 and 70:
! ! alignment at this position[24,
- Page 71 and 72:
To test this idea, we decided to ca
- Page 73 and 74:
GOR method is useful for predicting
- Page 75 and 76:
! HI active"site (i) as 0.4 for res
- Page 77 and 78:
lowered, and the area under the cur
- Page 79 and 80:
would be preferable to the other, o
- Page 81 and 82:
Discussion Correlations were found
- Page 83 and 84:
Sequence in the immediate neighborh
- Page 85 and 86:
Figures p-value 0.5 0.25 0 .01 PHE
- Page 87 and 88:
Figure 2.3: Secondary structure Res
- Page 89 and 90:
Figure 2.5: Conservation: full set
- Page 91 and 92:
Figure 2.7: Solvent accessible surf
- Page 93 and 94:
completely random predictor, with a
- Page 95 and 96:
samples 1800 1600 1400 1200 1000 80
- Page 97 and 98:
m = distance from nearest residues
- Page 99 and 100:
Hinge All Hinge Residues residues R
- Page 101 and 102:
in hinge residues HI p-value 1 277
- Page 103 and 104:
Total resid. in Hinge Atlas 54839 H
- Page 105 and 106:
Chi- Computer annotated set Hinge A
- Page 107 and 108:
BMC: Bioinformatics, we present the
- Page 109 and 110:
hinges. Kundu et al. use the lowest
- Page 111 and 112:
Domains can move relative to each o
- Page 113 and 114:
The quantity ! E(i) represents the
- Page 115 and 116: Identification of local minima As w
- Page 117 and 118: compute FoldX_energy (stability of
- Page 119 and 120: energy element of each cluster was
- Page 121 and 122: At least two sets of atomic coordin
- Page 123 and 124: ! FN (false negatives): Number of r
- Page 125 and 126: We observed qualitatively (figures
- Page 127 and 128: pairs of structures used to generat
- Page 129 and 130: coordinate set does not significant
- Page 131 and 132: The LIR family is composed of eight
- Page 133 and 134: CaM is a major calcium-binding prot
- Page 135 and 136: The results of running FlexOracle a
- Page 137 and 138: Figure 3.2: Results for individual
- Page 139 and 140: a. 139
- Page 141 and 142: Figure 3.3: Folylpolyglutamate Synt
- Page 143 and 144: . c. 143
- Page 145 and 146: a. 145
- Page 147 and 148: Figure 3.5: Lir-1 (closed) Morph ID
- Page 149 and 150: . c. 149
- Page 151 and 152: a. 151
- Page 153 and 154: Figure 3.7: Ribose binding protein
- Page 155 and 156: . c. 155
- Page 157 and 158: Tables GNM 157 Single-cut predictor
- Page 159 and 160: Chapter 4: HingeMaster: normal mode
- Page 161 and 162: The problem of hinge prediction is
- Page 163 and 164: Translation Libration Screw Motion
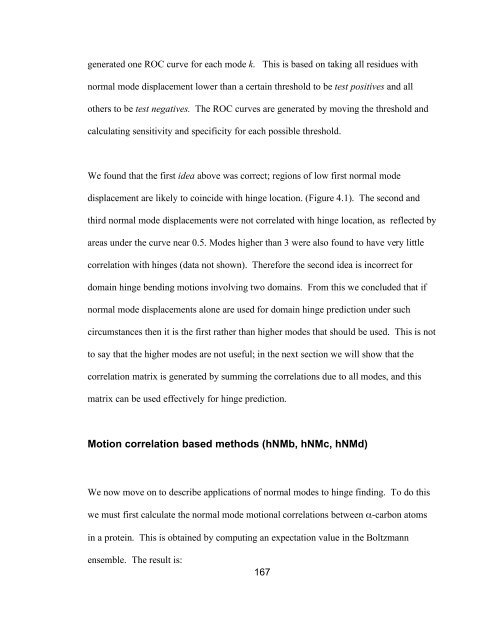
- Page 165: ! [ K] = [ U] " [ ] 2 [ U] T Where
- Page 169 and 170: ! ! 1 (l " k) A(k,l) = 2 % ' $ C(i,
- Page 171 and 172: however, since we found that the Co
- Page 173 and 174: A key part of this analysis involve
- Page 175 and 176: describe its net vibrational displa
- Page 177 and 178: ! Because it cuts the backbone at t
- Page 179 and 180: ! ! x HingeMaster = x" # y . [6] 2
- Page 181 and 182: different values of ! " * and gener
- Page 183 and 184: manually select domains and color p
- Page 185 and 186: E. coli resides in the periplasmic
- Page 187 and 188: The results for this protein are sh
- Page 189 and 190: esidues (62). As is customary we al
- Page 191 and 192: FlexOracle (FO) The FlexOracle algo
- Page 193 and 194: extra breakpoints based on visual i
- Page 195 and 196: hinge, it is usually predicted by a
- Page 197 and 198: Supplementary methods Statistical t
- Page 199 and 200: ! ! ! eigenvector. The resulting re
- Page 201 and 202: TNC induces a conformational change
- Page 203 and 204: possibility that unexpected results
- Page 205 and 206: UDP-N-acetylglucosamine enolpyruvyl
- Page 207 and 208: predicted both hinges, again with m
- Page 209 and 210: Most predictors (including FO, Ston
- Page 211 and 212: FO, hNMb, and hNMd were completely
- Page 213 and 214: HingeMaster makes a strong predicti
- Page 215 and 216: Figure 4.2: ROC curves for HingeMas
- Page 217 and 218:
Figure 4.3: HingeMaster results for
- Page 219 and 220:
d. e. 219
- Page 221 and 222:
221
- Page 223 and 224:
Figure 4.5: Human lactoferrin (open
- Page 225 and 226:
Figure 4.6: Troponin C (TNC) Morph
- Page 227 and 228:
Figure 4.7: Calmodulin, calcium fre
- Page 229 and 230:
229
- Page 231 and 232:
Tables Predictor Basis Max. hinge p
- Page 233 and 234:
test true c positive positive sensi
- Page 235 and 236:
235 Closed Metal bound # of hinge p
- Page 237 and 238:
Chapter 5: The Conformation Explore
- Page 239 and 240:
ending, which involves a rigid regi
- Page 241 and 242:
lengths and angles)[89]. The equili
- Page 243 and 244:
for holo as well as apo forms, but
- Page 245 and 246:
queried using the “?” button. O
- Page 247 and 248:
coordinate. This phenomenon is know
- Page 249 and 250:
! At the end of each equilibration
- Page 251 and 252:
aborted. This marked the correspond
- Page 253 and 254:
sRMSD has a major limitation that m
- Page 255 and 256:
with respect to the starting struct
- Page 257 and 258:
generated structure with respect to
- Page 259 and 260:
Ribose Binding Protein (RBP) As des
- Page 261 and 262:
strikingly similar both to the holo
- Page 263 and 264:
energy minimization. The minimizati
- Page 265 and 266:
Figures Figure 5.1: Assignment of r
- Page 267 and 268:
Figure 5.3: Results for glutamine b
- Page 269 and 270:
Figure 5.4: Results for biotin carb
- Page 271 and 272:
Figure 5.6: Results for Adenylate K
- Page 273 and 274:
close to the holo. The structure wi
- Page 275 and 276:
Table 5.1: MolMovDB ID, PDB ID, fre
- Page 277 and 278:
with sRMSD; however its main utilit
- Page 279 and 280:
morph server, and left confident th
- Page 281 and 282:
9. M Gerstein RJ, T Johnson, J Tsai
- Page 283 and 284:
28. Wriggers W, Schulten K: Protein
- Page 285 and 286:
45. Dumontier M, Yao R, Feldman HJ,
- Page 287 and 288:
62. Thorpe MF, D.J. Jacobs, M.V. Ch
- Page 289 and 290:
81. Winn MD, Isupov MN, Murshudov G
- Page 291 and 292:
98. Morris GM, Goodsell DS, Hallida
- Page 293 and 294:
115. Miyazawa T: Normal Vibrations