
You also want an ePaper? Increase the reach of your titles
YUMPU automatically turns print PDFs into web optimized ePapers that Google loves.
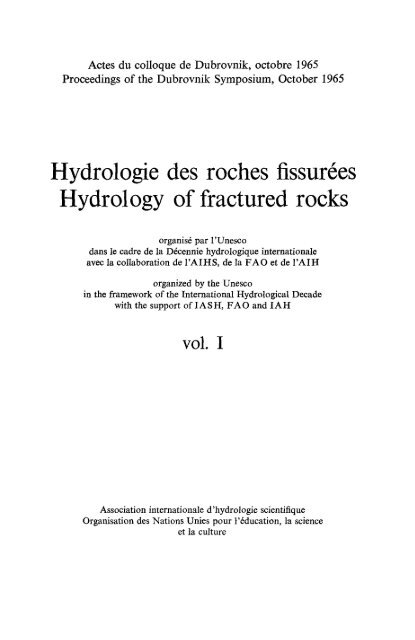
Actes du colloque de Dubrovnik, octobre 1965<br />
Proceedings of the Dubrovnik Symposium, October 1965<br />
Hydrologie des roches fissurées<br />
Hydrology of fractured rocks<br />
organisé par l’Unesco<br />
dans le cadre de la Décennie hydrologique internationale<br />
avec la collaboration de I’AIHS, de la FAO et de I’AIH<br />
organized by the Unesco<br />
in the framework of the International Hydrological Decade<br />
with the support of IASH, FAO and IAH<br />
vol. I<br />
Association internationale d’hydrologie scientifique<br />
Organisation des Nations Unies pour l’éducation, la science<br />
et la culture
Publié en 1967 par 1’Association<br />
internationale d’hydrologie scientifique<br />
et par l’Unesco, place de Fontenoy, ParisJe<br />
Imprimé par Ceuterick, Louvain (Belgique)<br />
Published in 1967 by<br />
the International association<br />
of scientific hydrology and<br />
by the Unesco, place de Fontenoy, Pari~-7~<br />
Printed by Ceuterick, Louvain (Belgium)<br />
0 Unesco i967<br />
Printed in Belgium<br />
SC 67/D52/AF
Actes du colloque de Dubrovnik,<br />
Hydrologie des roches fissurées, I<br />
Proceedings of the Dubrovnik Symposium,<br />
Hydrology of fractured rocks, I
Les volumes I et II des Actes du colloque de Dubrovnik constituent également,<br />
sous couverture spéciale, les publications no* 73 et 74 de l’Association interna-<br />
tionale d’hydrologie scientifique, L. J. Tison, secrétaire, Braamstraat 61, Gent-<br />
briigge (Belgique).<br />
The volumes I and II of the Proceedings of the Dubrovnik Symposium are also,<br />
under special cover, the publications 73 and 74 of the International Association<br />
of Scientific Hydrology, L. J. Tison, Secretary, Braamstraat 61, Gentbrugge.<br />
(Belgium).
TABLE DES MATIÈRES - CONTENTS<br />
TOME I - VOLUME I<br />
Préface.. . . . . . . . . . . . . . . . . . . . . . . . . . . . . . . v<br />
I - EAUX SOUTERRAINES - GROUND WATERS<br />
1. i. THEORIE DE L’ÉCOULEMENT DANS LE KARST<br />
1.1. THEORY OF THE FLOW IN THE KARST<br />
H. SCHOELLER - Hydrodynamique dans le Karst ............. 3<br />
1. S. PAPADOPULOS - Nonsteady Flow to a Well in an infinite anisotropic aquifer 21<br />
M. BORELLI and B. PAVLIN - Approach to the problem of the Underground<br />
Water Leakage from the Storages in Karst Regions. Karst Storages BuSko<br />
Blato, Peruka and KruSEica ..................... 32<br />
Y. BACHMAT - Basic Transport Coefficients as Aquifer Characteristics .... 63<br />
K. F. SAAD -Effect of Impervious Barriers of deep-seated Fractures on Ground<br />
WaterFlow . . . . . . . . . . . . . . . . . . . . . . . . . . . . 76<br />
- Analysis of Pumping Test in fractured Rocks. ........ 81<br />
N. ROFAIL<br />
1.2. CARACTERISTIQUES HYDROLOGIQUES ET HYDRAULIQUES DE L’ÉCOULEMENT DANS LE<br />
KARST - BILAN HYDROLOGIQUE - CARACTERISTIQUES GÉOLOGIQUES<br />
1.2. HYDRAULIC AND HYDROLOGIC CHARACTERISTICS OF THE FLOW IN THE KARST -<br />
HYDROLOGICAL BALANCE - GEOLOGICAL CHARACTERISTICS<br />
H. KESSLER - Water Balance Investigations in the karstic Regions of Hungary 91<br />
T. TETTAMANTI - Hydrological and Hydraulic Characteristics of Waters flowing<br />
from fissured carbonated Rocks into Mines . . . . . . . . . . . . . . 106<br />
S. C. CSALLANY - The hydraulic Properties and Yields of Dolomite and Limestone<br />
Aquifers . . . . . . . . . . . . . . . . . . . . . . . . . . . 120<br />
P. C. SODEMANN and J.E. TYSINGER - Effects of Forest Cover upon hydrologic<br />
Characteristics of a small Watershed in the Limestone Region of East<br />
Tennessee ............................. 139<br />
E. KULLMAN - La circulation des eaux karstiques dans les complexes carbonatés<br />
et son bilan quantitatif . . . . . . . . . . . . . . . . . . . . . . . 152<br />
L. SIQUEIRA - Contribution of Geology to the ,Research of Ground Water<br />
in crystalline Rocks . ........................ 161<br />
G. G. MISTARDIS - Recherches hydrogéologiques dans la région des lacs karsti-<br />
ques béotiens. . . . . . . . . . . . . . . . . . . . . . . . . . . . 162<br />
V
K.F. SAAD - Determination of the vertical and horizontal Permeabilities of<br />
fractured Rocks . . . . . . . . . . . . . . . . . . . . . . . . . . 171<br />
F. JENKO - L’hydrographie du Karst . . . . . . . . . . . . . . . . . . 172<br />
J. MARTIN - Le rôle des failles sur la répartition des dolines d’effondrement<br />
l’exemple d’afennourir, causse moyen atlasique . . . . . . . . . . . . . 183<br />
E. SOBOTHA - Les eaux souterraines à la base des couches dures non stratifiées<br />
et les cavernes de la base. . . . . . . . . . . . . . . . . . . . . . . 184<br />
M. KOMATINA - Sur le problème de la détermination des bassins versants et des<br />
directions de la circulation des eaux souterraines dans le Karst dinarique. . 190<br />
N.L. LLADO - Nappes karstiques et conduits karstiques. . . . . . . . . . 200<br />
D.S. SOKOLOV - Hydrodynamic Zoning of Karst Water . . . . . . . . . . 204<br />
B.I. KOUDELIN and V.P. KARPOVA - The effect of Karst on the Regularities of<br />
Ground Water Flow Formation . . . . . . . . . . . . . . . . . . . 208<br />
5. FORKASIEWICZ et H. PALOC - Le régime de tarissement de la Foux de la Vis -<br />
fitude préliminaire . . . . . . . . . . . . . . . . . . , . . . . . . 213<br />
M.V. RATS and S.N. CHERNYASHOV - Statistical Aspect of the Problem of the<br />
Permeability of the jointy Rocks . . . . . . , . . , . . . . . . . . . 227<br />
L. MOULLARD, B. MIJATOVIC, R. KAREH et B. MASSAAD - Exploitation d’une<br />
nappe karstique captive à exutoires sous-marins. Problèmes posés et solution<br />
adoptée. Côte libanaise . . . . . . . . . . . . . . . . . . . . . . . 237<br />
H.E. LEGRAND and V.T. STRINGFIELD - Development of Permeability and<br />
Storage in the Tertiary Limestones of the Southeastern States, U. S. A. . . . 251<br />
SCHICK - Joints and Stream Channel Patterns . . . . . . . . . . . . . 25 1<br />
1.3. HYDROLOGIES KARSTIQUES REGIONALES<br />
1.3. KARSTIC HYDROLOGY OF REGIONS<br />
F. LEWICKI - The basic hydrologic Characteristics of thekarst River Ljubljanica<br />
F. BIDOVEC - The hydrosystem of karstic Springs in the Timavo Basin . . . .<br />
R. HAZAN et D. LAZAREVITCH - Hydrologie en zone karstique au Maroc.<br />
Sebou-Beth . . . . . . . . . . . . . . . . . . . . . . . . . . . .<br />
A. MORETTI, L. PANNUZI, G. STAMPANONI et N. ZATTINI - Synthèse des<br />
255<br />
263<br />
connaissances géo-hydrologiques des formations calcaires en Italie . . . . 293<br />
D. J. BURDON - Hydrogeology of some karstic Areas of Greece . . . . . . . 308<br />
J. VECCHIOLI - Directional hydraulic Behaviour of a fractured-shale Aquifer<br />
in New Jersey . . . . . . . . . . . . . . . . . . . . . . . . . . . 318<br />
F. MORTIER, T.N. QIJANG et M. SADEK - Hydrogéologie des formations volcaniques<br />
du Nord-Est du Maroc . . . . . . . . . . . . . . . . . . . 327<br />
F. MORTIER et Ch. SAFADI - Phénomènes karstiques dans les gypses de Jezireh<br />
@.-E. de la Syrie) . . . . . . . . . . . . . . . . . . . . . . . . . 334<br />
C. SAENZ GARCIA - Spanish Underground Rivers. An Exposa1 of some characteristic<br />
cases and proposed studies for the hydrologic Decade. . . . . . 339<br />
S. YAMAMOTO - Studies on the Hydrology of fractured Rocks in Japan . . . 340<br />
K. ERGUVANLI - The Groundwater Investigation in the Devonian Limestones,<br />
East of Istanbul, Turkey . . . . . . . . . . . . . . . . . . . . . . 343<br />
VI<br />
275
I.M. EL RAMLY - Contribution to the Hydrogeological Study of Limestone<br />
Terrains in U.A.R. . ........................ 348<br />
A. NAVARRO et A.A. SAMPER - Problèmes de stockage des eaux dans le Sud-Est<br />
espagnol ............................. 378<br />
C. DROGUE - Un bassin-témoin en terrains calcaires. Le bassin de Saugras . . 381<br />
O. L. MARKOVA - The Influence of Karst on the maximum Flow of the Rivers<br />
of the East European Plains ..................... 387<br />
D. H. WOZAB and J. B. WILLIAMS - Flow Problems in Limestone Plains, Jamaica<br />
W.L.. A Progress Report . ...................... 402<br />
J. AVIAS - Sur la recherche des ressources en eaux karstiques sous recouvrement<br />
mio-plio-quaternaire dans le bassin méditerranéen et son importance d’après<br />
quelques expériences récentes dans la région Languedoc-Roussillon (France) 410<br />
G. ZERVOYANNIS et J. BARBEAU - Circulation des eaux souterraines dans les<br />
calcaires karstiques de Kopais .................... 420
Un des objectifs de la Décennie Hydrologique Internationale, lancée en 1965, en<br />
application des redutions adoptées par la Conférence Générale de l’Unesco, lors de sa<br />
13e session, est de .yomouvoir des études coordonnées sur l’Hydrologie des eaux<br />
de surface et des eaux souterraines.<br />
Ainsi le Conseil de Coxdination de la Décennie a-t-il jugé utile de recommander la<br />
réunion, dès la première année, d’un Colloque sur l’Hydrologie des roches fissurées qui<br />
comprendrait trois grandes sections : eaux de surface, eaux souterraines, géochimie.<br />
Le Colloque a été organisé par le Gouvernement yougoslave et l’Unesco, en coliaboration<br />
avec la FAO, l’AI H S et I’AIH. II s’est tenu à Dubrovnik (Yougoslavie) du<br />
7 au 14 octobre 1965. 11 a réuni les participants venant de 30 pays et de la plupart des<br />
organisations internationales intéressées aux problèmes de l’eau.<br />
Les principales communications présentées ont été réunies dans cet ouvrage. Elles<br />
portent surtout sur les formations karstiques du bassin méditerranéen.<br />
Les discussions les plus intéressantes ont eu lieu pour les rubriques suivantes :<br />
1. Eaux souterraines<br />
Théorie de l’écoulement dans le Karst.<br />
Caractéristiques hydrologiques, hydrauliques et géologiques de l’écoulement dans le<br />
Karst.<br />
Bilan hydrologique<br />
Intrusion d’eaux salines dans le Karst.<br />
Hydrologies karstiques régionales.<br />
Recharge naturelle ou artificielle des terrains karstiques.<br />
Hydrologie karstique dans les roches volcaniques.<br />
Exploitation.<br />
Action sur l’écoulement superficiel.<br />
2. Lacs karstiques.<br />
3. Géochimie. Erosion.<br />
La publication des communications présentées à ce colloque, par l’A I H S représente<br />
un premier pas dans une collaboration plus intime entre l’AI H S et l’Unesco, dans le<br />
cadre de la D HI. Nous espérons que ce premier pas sera suivi d’autres au plus grand<br />
bénéfice de la diffusion rapide des rçsultats de la Décennie.<br />
J.A. DA COSTA<br />
Sécrétaire du Conseil<br />
de Coordination de la D. H. I.<br />
(Unesco)
I<br />
EAUX SOUTERRAINES<br />
GROUND WATERS<br />
1.1<br />
Théorie de l’écoulement dans le Karst<br />
Theory of the Flow in the Karst
SUMMARY<br />
HYDRODYNAMIQUE DANS LE KARST<br />
(Écoulement et emmagasinement)<br />
H. SCHOELLER<br />
Hydrodynamics in Karst “flow and storage”.<br />
The rôle of wide channels and fissures, narrow channels and fissures and fine<br />
fissures in underground water movement and the recession curves of spring discharge.<br />
The hydrodynamic regulator. Rôle of the variations in water of retention in seasonal<br />
and annual balances of interconnected nappes. Relations with infiltration. ’<br />
L’hydrodynamique des terrains calcaires est particulièrement bien éclairée par les<br />
études des vidanges, de l’alimentation et des bilans des nappes.<br />
I1 n’est question ici que des nappes en réseaux et en chenaux, ce que l’on appelle<br />
quelquefois les zones noyées. La circulation dans la zone d’aération ne sera<br />
pas envisagée.<br />
LA VIDANGE EN RBGIME NON INFLUENCE<br />
Rappelons auparavant brièvement les équations relatives à cette vidange (Maillet<br />
1905, Schoeller 1948, 1962).<br />
Elles sont pour une nappe perchée à imperméable horizontal, ou pour une nappe<br />
pouvant lui être assimilée,<br />
En régime laminaire :<br />
40 - qP<br />
4-4P = [l +a(t-t0)]2<br />
ou<br />
avec<br />
En régime turbulent :<br />
ou<br />
avec<br />
--- 1<br />
1<br />
= ß(t - to)<br />
J G P Jqo-qp<br />
(1‘)<br />
3
Elles sont pour une nappe soutenue à imperméable horizontal ou incliné, pour<br />
une nappe captive ou une nappe assimilable aux précédentes :<br />
En régime laminaire :<br />
En régime turbulent :<br />
q-qp = (qo-qp) e-ß(t-to) (3)<br />
4 = qo-a(t-to) (4)<br />
q et qo étant les débits aux temps t et to,<br />
qp le débit permanent, CL le coefficient de tarissement.<br />
C’est précisément ce coefficient de tarissement cc qui apporte tous les renseignements<br />
hydrauliques à confronter avec les renseignements géologiques, méthode de travail<br />
propre à l’hydrogéologie.<br />
Rappelons (Maillet 1905, Schoeller 1948 et 1962) que dans les équations 1 et 1’<br />
en mouvement laminaire :<br />
dans les éwuations 2 et 2’ en mouvement turbulent :<br />
dans l’équation (3) en mouvement laminaire :<br />
et dans l’équation 4 en mouvement turbulent :<br />
b KVo<br />
m2 X3<br />
K étant le coefficient de Darcy de perméabilité, rn la porosité dynamique, X la<br />
longueur de la nappe, VO le volume de la nappe au temps to, E l’épaisseur de la<br />
nappe; a et b des constantes qui dépendent des dimensions transversales (largeur)<br />
de la nappe. Si la source est contractée par rapport à la nappe, ce qui est le cas<br />
ordinaire, plus la dimension transversale S de la nappe est grande par rapport à la<br />
surface de sortie s de la source plus a et b sont faibles, a et b étant en fonction<br />
directe de SIS.<br />
Nous voyons donc que la vidange est d’autant plus rapide que CL est plus grand,<br />
autrement dit que la perméabilité K est plus grande, la porosité rn de la roche plus<br />
faible, la longueur de la nappe X plus petite ou que le volume VO ou le débit qo à<br />
l’origine sont plus grands ou que a et b sont grands, c’est-à-dire que la section S de la<br />
nappe est petite, c’est-à-dire que le volume de la nappe est faible.<br />
Inversement, une faible valeur de a, c’est-à-dire un tarissement lent de la source,<br />
indique une perméabilité relativement faible, une grande porosité de la roche (il ne<br />
s’agit pas des dimensions des pores, mais du rapport du volume des vides dans lesquels<br />
l’eau circule, par rapport au volume de la roche); une grande longueur de la nappe,<br />
un,grand volume de la nappe par suite de sa grande largeur en amont et très en amont<br />
de la source, ou un volume YO ou un débit qo faibles au temps 10 considéré.<br />
4
Si nous comparons deux coefficients de tarissement GC, l’un faible, l’autre élevé,<br />
s’appliquant à deux courbes ayant la même valeur de qo au temps to, il est bien évident<br />
que le système à faible coefficient GC livrera plus d’eau que le système à haut coefficient GC,<br />
entre les mêmes temps to et I, puisque la première courbe de tarissement se trouve<br />
au-dessus de la seconde et que les quantités d’eau débitées entre ces deux temps sont<br />
représentées par les surfaces situées sous ces courbes. Cela ressort d’ailleurs du fait<br />
que dc est fonction inverse de la porosité de la longueur de la nappe et de la largeur de<br />
la nappe pour une même largeur de source.<br />
On comprend ainsi que d’une manière générale, ct de l’équation (3) est de l’ordre<br />
de n X lorsqu’il s’agit de sources sortant de terrain calcaire lité où prédomine la<br />
circulation de l’eau dans les joints et diaclases, tandis que dans le cas de terrains<br />
calcaires massifs dans lesquels les chenaux jouent un très grand rôle, ct est de l’ordre<br />
de n X<br />
à n x 10-2, lorsque t est exprimé en jours.<br />
Dans le présent travail, nous n’étudierons que les cas des formules (3) et (4), car<br />
ce sont eux qui se présentent dans les nappes en réseaux à réserves très grandes, ayant<br />
par conséquent de grosses ressources. Mais le même travail peut être fait pour le cas<br />
des nappes perchées.<br />
Dans la zone de saturation, l’eau circule dans les réseaux de fentes (Ph. Renault<br />
1959) de joints et de diaclases peu élargis par dissolution. Ceux-ci sont drainés par des<br />
chenaux, réseaux de conduits (Ph. Renault 1959) se développant de plus en plus vers<br />
l’amont au cours de l’histoire du réseau.<br />
Vers l’aval, ces artères se rejoignent pour aboutir à la source. Cela résulte du fait<br />
que les sources sont contractées et éloignées les unes des autres.<br />
Dans les formations calcaires bien litées, le réseau de joints et diaclases joue un<br />
rôle primordial dans l’hydraulique, tandis que dans les calcaires massifs, ce sont les<br />
branches d’artères.<br />
La vidange des nappes se fait par toutes les fissures et chenaux de l’aquifère.<br />
Les chenaux de gros diamètre et les fissures très larges, dans lesquels le mouvement<br />
de l’eau peut être occasionnellement turbulent.<br />
Les chenaux de faible diamètre, les fissures relativement étroites dans lesquels la<br />
circulation est toujours plus ou moins difficile et en régime laminaire.<br />
Les joints et diaclases, très resserrés, les chenaux très fins, tous de perméabilité<br />
très faible.<br />
I1 est bien évident que l’on a tous les passages d’une catégorie à l’autre.<br />
Depuis le début jusqu’à la fin de la vidange, les eaux de tous ces conduits arrivent<br />
aux chenaux et fissures de toute largeur de la base aval du système aquifère.<br />
Le5 plus gros conduits de la base drainent à peu près toute l’eau. Tant qu’il y a<br />
de gros conduits, cette base du système aquifère ne doit avoir que peu d’influence sur<br />
le régime de la vidange.<br />
Au début de la vidange, c’est-à-dire lorsque les diverses surfaces piézométriques<br />
sont élevées, c’est-à-dire lorsque la masse calcaire est noyée, il y a une vidange de tous<br />
les chenaux et de toutes les fissures larges et étroites, à la fois.<br />
Les gros conduits drainent les plus petits. Mais cela ne veut pas forcément dire<br />
que dans un volume donné d’aquifère le débit propre aux gros conduits soit plus grand<br />
que le débit total des plus petits. Cela dépend de leur nombre respectif. Lë débit total<br />
provenant de la vidange des fissures étroites peut être plus grand que celui de la<br />
vidange des gros chenaux.<br />
Naturellement, les chenaux de gros diamètre et les fissures très larges se vident<br />
rapidement, beaucoup plus rapidement que les fissures fines et à partir d’un certain<br />
temps leur débit devient négligeable par rapport à celui des chenaux de faible diamètre<br />
et des fissures étroites. Ces derniers eux-mêmes finissent par s’épuiser à la longue.<br />
Mais l’eau circulant dans les joints et diaclases très serrés, les chenaux extrêmement<br />
5
fins, tous de perméabilité très faible arrive toujours. Leur débit est relativement constant,<br />
d’un bout de l’année à l’autre, comme I’est le débit dans un terrain aquifère<br />
sableux épais.<br />
Ces diverses manières d’être au cours d’un m ême régime non influencé, doivent se<br />
traduire sur la courbe de vidange qui peut comprendre au moins 4 parties surtout<br />
visibles sur graphique log q-t (fig. 1) : au début de la vidange, une courbe raide, A,<br />
de la somme des 3 débits : débit des gros conduits, débit des petits conduits, débit<br />
Fig. 1 - Diagramme semi-logarithmique de la supeqosition de débits 4-4. 40, qp de<br />
régimes différents, dans la courbe de tarissement d’une source et calcul de la<br />
courbe de tarissement des débits de chacun de ces régimes.<br />
q = débit, f = temps.<br />
permanent des fissures et conduits très fins; vers la fin, une courbe moins raide, D<br />
comportant toujours la somme des 3 débits, mais dans laquelle le débit propre aux<br />
grosses conduites est négligeable par rapport aux autres; entre A et D, il y a une<br />
courbe intermédiaire B-C, pour laquelle la part du D du débit est encore importante;<br />
à la fin de la vidange : une courbe presque horizontale P correspondant à la<br />
prédominance de l’écoulement permanent des joints et diaclases très serrés.<br />
Cet écoulement permanent doit englober un égouttement lent des fissures et<br />
chenaux libérés, égouttement des parois, égouttement de l’eau pelliculaire, de l’eau<br />
cunéiforme, de capillaires suspendus, quelque chose de comparable à l’égouttement<br />
d‘un sable.<br />
I1 s’agit là de la vidange d’un système aquifère simple. Mais il faut aussi envisager<br />
la possibilité d’un apport en provenance d’autres nappes.<br />
Cet apport peut être variable, c’est-à-dire être décroissant ou croissant, pendant<br />
le régime non influencé de la première nappe. Cela troublera la courbe de vidange.<br />
Ou au contraire, cet apport peut être constant. Cela aura pour effet d’accroître<br />
l’écoulement permanent P.<br />
En des travaux antérieurs (Schoeller 1946, 1949), j’avais déjà précisément montré<br />
que dans un massif karstique, il pouvait y avoir au cours d’une même vidange de la<br />
nappe, en régime non influencé, au moins 2 régimes d’écoulement, .les uns dans de<br />
grosses fissures en régime turbulent ou en régime laminaire, les autres dans de”petites<br />
6
fissures et toujours en régime laminaire. Cela a été depuis repris par mes élèves,<br />
MM. Aigrot 1965, Napias 1963, Laura 1964 et Lafosse 1964, et finalement par<br />
M. Drogue 1963 et 1964.<br />
M. Aigrot reprenant tous les graphiques de débits de la Fontaine de Vaucluse,<br />
avec les relevés pluviométriques correspondants, depuis 1875, que j’avais établis,<br />
a montré que (fig. 2) l’on pouvait tracer 5 types principaux de courbes ayant chacune<br />
4 tronçons A, B, C, D rectilignes dans la fonction log q-/(t). Chaque tronçon de<br />
vidange passe au suivant à un débit déterminé : de A en B entre 35 et 50 m3/s, de B en<br />
C à 20-21 m3/s, de C en D à 13 m3/s. Dans certains cas, il existe des courbes inter-<br />
médiaires, ou des courbes à pente plus raide ou plus faible que celle des types 1 à 5.<br />
I \<br />
’ \<br />
1<br />
I ‘<br />
\Al ‘,A0 , , ,<br />
jours<br />
10 20 30 40 50 60 70 80 90 100 150 200<br />
Fig. 2 - Courbes de tarissement de la Fontaine de Vaucluse. Ordonnée débit (q-2)<br />
m3/sec, abcisse, temps t en jours.<br />
J’ai repris l’étude de ces courbes.<br />
Notons tout d’abord que le débit q d’une source est dans le cas de 2 régimes<br />
laminaires A et D.<br />
7
et dans le cas où 4A est en régime turbulent<br />
= qOA - üA(t-tO) + (4OD-qP) e<br />
- d ( t - to)<br />
90~ et qOD sont les débits aux temps to; qp le débit permanent.<br />
Lorsque les 2 régimes sont laminaires qf(t) de A et D sont des droites sur papier<br />
semi-logarithmique.<br />
Comme je l’avais fait pour l’étude de la Source du Kef en 1948, lorsque l’on<br />
examine de plus près le problème de ces courbes d’observation de la Fontainede<br />
Vaucluse, on s’aperçoit qu’il s’agit en réalité de la superposition des 2 courbes<br />
principales de vidange A1 et Do (fig. 1). Chaque courbe A, B, C, D, correspond à la<br />
somme de débits Ai, Do et P.<br />
Il est à remarquer que D est moins influencé par le débit des grosses fissures, car<br />
sous D les valeurs de A1 sont très faibles en régime laminaire et peuvent être nulles<br />
en régime turbulent pour lequel 9 = qo-C(A(t-tO). Par contre, A peut être fortement<br />
influencé par Do, car sous A les débits de Do peuvent être très grands.<br />
Pour l’analyse de ces superpositions, nous avions de longue date employé un procédé<br />
plus complet que celui mentionné par Drogue. Le voici (figs. 1 et 2).<br />
On prolonge D et A, en Do et Ao. On soustrait de D en-dessous de d, les valeurs<br />
de Ao, on obtient alors Di. De A, entre a et b, on soustrait les valeurs de Ai, on obtient<br />
une droite très voisine de Do. Aussi, la plupart du temps, peut-on admettre que Ai<br />
et Do correspondent approximativement aux courbes réelles de débit.<br />
Cela s’applique fort bien au cas où les deux régimes de vidange sont laminaires,<br />
ce qui se reconnaît facilement à ce que D et Ai sont des droites sur papier semilogarithmique.<br />
Lorsque le régime de A est turbulent, il en est autrement. On a en effet :<br />
Lorsque q est très grand, qD l’est aussi et d9/dt se rapproche de la courbe de vidange<br />
en régime laminaire si C(A est petit par rapport à UD.<br />
Lorsque q est très petit, qo l’est aussi et dq/dt se rapproche de dq/dt de la courbe<br />
de vidange en régime turbulent si ED est petit par rapport à C(A.<br />
Le débit en mouvement turbulent peut cesser très tôt. Il ne reste plus que le mouve-<br />
ment laminaire qui peut étre encore très grand. La courbe de vidange forme à ce moment<br />
un angle très brusque (fig. 3). La partie située à droite permet alors facilement de calculer<br />
les caractéristiques du débit en mouvement laminaire et, par conséquent, de calculer<br />
par différence les caractéristiques du mouvement turbulent.<br />
Sur graphique semi-logarithmique (figs. 5, 6), la somme du débit en régime<br />
laminaire et du débit en régime turbulent donnera une première partie de courbe<br />
convexe vers l’extérieur, lorsque les conduits en régime turbulent se vident beaucoup<br />
plus rapidement que ceux en régime laminaire, ce qui est le cas le plus ordinaire.<br />
Très rapidement qA devient nul et la courbe passe à une droite de qD.<br />
Lorsque, au contraire, (fig. 7) l’eau en régime turbulent se vide beaucoup plus<br />
lentement, la courbe est concave vers l’extérieur au sommet, et convexe vers l’extérieur<br />
à la base pour finalement se terminer par une droite, lorsque 4~ devient nul. Ce cas<br />
ne doit d’ailleurs exister que lors d’une karstification extrême, car cela suppose une<br />
capacité du régime laminaire très faible par rapport au régime turbulent.<br />
Pour calculer le débit du régime turbulent on procède de la meme manière que<br />
précédemment. II suffit de prolonger D en DO. I1 n’y a pas ici de correction à faire.<br />
On obtient Ai par difference. Si Ai est bien en régime turbulent, la courbe Ai doit<br />
être convexe et devenir verticale vers le bas et sur papier arithmétique tout le tracé<br />
de Ai doit être une droite.<br />
8
Pour la Fontaine de Vaucluse, nous obtenons ainsi pour les valeurs de u ~z et w o ,<br />
en partant d'un débit q = 100 m3/sec à t = to. M. Aigrot donne d'apres ses calculs<br />
qop = 2 m.s.<br />
Unités<br />
m3/s t en jours t en secondes<br />
qOA-4P qOD-qP aAz aDo aA2 aD0<br />
Courbes 1<br />
2<br />
3<br />
4<br />
72<br />
68<br />
65<br />
75<br />
28<br />
32<br />
35<br />
25<br />
0,0767 0,0091<br />
0,0836 0,0094<br />
0,0733 0,0096<br />
0,107 0,0100<br />
838 x 10-7<br />
9,78 x 10⁻⁷<br />
8,48 x 10⁻⁷<br />
13,55x10⁻⁷<br />
1,05 x lo-'<br />
I,W x IO-'<br />
I ,I i x<br />
1,16~10-~<br />
5 77 23 0,1025 0,0095 11,86x 10⁻⁷ JJOX<br />
Fig. 3 - Superposition q = QQfqD de débits qQ = 100 e-Onolt et qó = 100-t, q en<br />
ma(sec en t en pours.<br />
9
La vidange 40 varie peu. a reste voisin de 0,095. Elle correspond au système de<br />
régularisation par les petites fissures. La vidange de qA, celle des grosses fissures, est<br />
tout à fait irrégulière, a est variable. Elle évacue les grosses alimentations par les pluies<br />
et les orages. L'alimentation peut se faire par des parties differentes du massif dans<br />
lequel les variations des caractéristiques hydrauliques des grandes fissures sont suscep-<br />
tibles d'être différentes d'un point à un autre, ce qui explique les écarts de a~2.<br />
o 500<br />
Fig. 4 - Superposition q = qa+qb de débits qa = 100 et qb = 100-0,l t, q en<br />
m3/sec et r en jours.<br />
Si maintenant pour la Fontaine de Vaucluse, on construit une courbe représentant<br />
la somme des deux débits q = qDO+qAl en fonction du temps, on constate qu'elle se<br />
superpose à peu de chose pr&s à la courbe des débits observés, les angles b, c et d<br />
doivent être simplement un peu arrondis.<br />
Pour la même Fontaine de Vaucluse, nous avons essayé de trouver la superposition<br />
de 3 régimes : un régime turbulent pour les plus gros débits de crue, 2 régimes<br />
laminaires se succédant. O n a alors :<br />
10
Fig. 5 - Superposition q = qa+qb de débits qo = 100 e-O,OOLt et 46 = 100-0,5 t,<br />
q en ms/sec et i en jours.<br />
Fig. 6 - Superposition q = qa+qb de débits qa = 100 et qb = 100-0,5 t, q en<br />
m3/sec et t en jours.<br />
11
Nous avons alors obtenu les régultats suivants en partant d'un débit q = 100 m3/s<br />
a t = Is (voir tableau page suivante); fa, le nombre de jours à partir duquel le régime<br />
turbulent est devenu nul t-to = qOA/C(A. avec q = 100 m3/s est :<br />
Courbes: 1 2 3 4 5<br />
Jours : 12% 13 15 15 12 '/2<br />
Cette solution est convenable.<br />
En ce qui concerne la Fontaine de Vaucluse, on pourrait appliquer la formule :<br />
-- 1 1<br />
J G G P Jqo-qp<br />
= ß(t - to)<br />
avec 90 = io0 m3/s qp = 2 m3/s, qm3/s et t jours.<br />
Fig. 7 - Superpos$ion q = 9a+4b de débits qa = 100 eo,o1t et qb = 100-0,l t, q en<br />
ma/sec et t en jours.<br />
On aurait pour la courbe 1, @ = 0,0018 et la courbe 5, ,B = 0,0023. Maillet donnait<br />
pour la période 1882-1903, ,B = 0,00223. Mais si aux bas débits la courbe des débits<br />
calculés est très voisine des débits observés, par contre, dans les sections A et E elle<br />
donne des valeurs trop élevees.<br />
12
13<br />
3<br />
I<br />
3 P<br />
mv,r-m<br />
m m m<br />
3<br />
8<br />
8
En appliquant cette formule unique ou une autre d’ailleurs, on ne considérait<br />
qu’un ensemble homogkne ayant partout dans le détail les mêmes propriétés<br />
hydrauliques. Or, les courbes de récession varient d’une année à l’autre. Cela traduit<br />
des inégalités dans la répartition des éléments du système hydraulique. C’est la raison<br />
pour laquelle s’additionnant à l’aspect géologique du problème, nous préférons la<br />
solution que nous avons de longue date adoptée, de superposition de systèmes ayant<br />
des coefficients de tarissement différents.<br />
C’est pourquoi je ne me rallie pas à la règle de Maillet (1905, p. 22) : «La détermination<br />
de la courbe de debits d’une source en fonction du temps dans la période<br />
de non-influence ou de régime propre peut s’obtenir par la superposition des courbes<br />
de débits de plusieurs années)), d’autant plus qu’en raison du manque d’homogénéité<br />
du massif c’est. tantôt telle ou telle partie de la nappe qui se trouve plus alimentée<br />
que les autres et se vide avec son propre coefficient de tarissement.<br />
Les volumes d’eau Vo- V écoulés au bout du temps r, à partir des réseaux A et<br />
des réseaux D, tous les 2 fonctionnant en régime laminaire, sont donnés par l’une<br />
des 2 formules :<br />
vo-J,’ - 40-4 . vo-J,‘ = & [1-e-Q(t-b) 1<br />
a CI<br />
VO étant le volume de la nappe au temps to, lorsque celle-ci débite le débit qo, Vet<br />
q se rapportant au temps t.<br />
On obtient alors les valeurs suivantes par les courbes 1 et 5 dans le cas de la somme<br />
de 2 régimes laminaires.<br />
Courbe I<br />
q = (qOA-qp) e-aA(t-*o) + (qOD-qp) e-QD(t-to) + qP<br />
qo =<br />
-<br />
íûûm3/s<br />
qoA-qp = 72 m3/sec a = 8,88 x<br />
qoD-qp 28 m3/sec a = i,o5 x 10-7<br />
10 6,92 x 10⁷ 2,32 x 10⁷ 9,24 x 10⁷ 0,335<br />
50 7,93 x 10⁷ 9,73 x 10⁷ 17,66 x lo7 1,23<br />
1 O0 s,o7 x 107 is,9 xi07 23,97 >: IO7 1,97<br />
150 s,ii x 107 19,85 X lo7 27,96 x lo7 2,4S<br />
200 8,ii x 107 22,32 lo7 30,43 x 1 O7 2,lS<br />
s,ii x i07 26,65 Y, lo7 34.76 x lo7 3,28<br />
Courbe 5<br />
14<br />
q,, = 100 m3/sec<br />
qOA - q p = 77 m’/sec CI = 11,86 x lo-’<br />
qOD-qp = 23 m3/sec a = 1,10~10-~
t jours ( VOA- VA) m3 (VOD- VD) m3<br />
Total VOD- VD<br />
(Vo- V) m3 VOA- VA<br />
10 4,i3 x 107 1,92x10⁷ 6,05 X 1 O7 0,465<br />
50 6,41 X IO7 7,go Y 107 14~1 x 10⁷ 1,23<br />
1 O0 6,45 x 10' 12,8 X10' 19,25X lo7 1,98<br />
150 6,45 x 10⁷ 15,86x lo7 22,3 1 X lb7 2,46<br />
200 6,45 x 10⁷ 17,76 x 10⁷ 24,21 x 10⁷ 2,751<br />
Co 6.45 x 10⁷ 20,9 x 10⁷ 27,~ x 107 3,24<br />
Le tableau suivant se rapporte aux cas 1 et 5 dans lesquels A est en régime<br />
laminaire, B et D sont en régime turbulent.<br />
q = qOA - aA(î-to) + (qOB-qp) e-"B('-'O)+ (qoD-qp) e-aD"-'o'<br />
Pour le régime turbulent, on a :<br />
Courbe I<br />
qo = íûûm3/s<br />
qOA - qp = 25 m '1s qOB-qp = 47 m3/s qon-qp = 2g3m/s<br />
= 2,32 x 10⁻⁵ aB = 7~ = i,o5 x 10-~<br />
t jours (VOA- VA) m3 (VOB- VB) m3 (IOD- VD) m3 Total m3<br />
10 i,08 x 107 3,04 x 10⁷ 2~2x10⁷ 04 x 107<br />
50 1,35 x 10⁷ 6,45 X IO7 9,73 Y 107 17,53 x lo7<br />
1 O0 i,35 x 107 6,70 x 10⁷ 15,9 Xi07 23,95 x lo7<br />
150 1 3 x 10⁷ 6,72 X 10⁷ 19,85 x lo7 21,92 x 1 O7<br />
200 i,35x 107 6,72 x 10⁷ 22,32 X lo7 30,39 >( IO7<br />
1 3 x 10⁷ 6,72 x 10⁷ 26,65 X lo7 34,~ Y 107<br />
Courbe 5<br />
qo = 1û0m3/s<br />
qOA-qp = 46 m3/s qoB-qp = 31 m3/s qoD-qp = 23 m3/s<br />
= 4,30 x 10⁻⁵ ag = 7.02 x a, = 1,ioX 10-7<br />
15
t jours (VOA- VA) m3 (VOS- F’B) m3 (YOD- VD) m3 Total m3<br />
10 1,887 x lo7 1,387 x lo7 i ,92 x 107 5,19 x10⁷<br />
50 2,484 X lo7 4,20 x 10⁷ 7,90 x 10⁷ 14,58 X10⁷<br />
100 2,484 X lo7 4,33 xi07 12,~ xi07 19,61 x10⁷<br />
150 2,484 X lo7 4,419 x 107 15,s xi07 22,703 x lo7<br />
200 2,484 x lo7 4,42 x 10⁷ 17,~ x 107 24,60 x 10⁷<br />
2,484 X lo7 4,42 xi07 20,9 x 10⁷ 213 x 107<br />
INDEPENDANCE RELATIVE DES D~BITS DES DIVERS SYSTEMES D’ÉCOULEMENT ET CIRCULATION<br />
DE L’EAU DANS LE SYSTEME AQUIFERE<br />
I1 ressort de l’examen des courbes de vidange qu’il doit y avoir une certaine<br />
indépendance entre le débit 4.4 des chenaux et larges fissures, d’une part, et le débit 90<br />
des fissures étroites, d’autre part.<br />
S’il y avait une dépendance complète, chenaux et fissures travailleraient sous la<br />
mème charge h.<br />
En régime laminaire, on aurait :<br />
K étant les coefficients de Darcy, S les sections, I, les trajets d’où :<br />
qA=qD<br />
KD SD ZA<br />
KA --_<br />
SA lD - constante<br />
Or 4.4/qD diminue lorsque la vidange s’accentue. II n’y a donc pas dépendance.<br />
De mème, admettant que q.4 soit en régime turbulent, c’est-à-dire que<br />
on aurait<br />
gA = KATA SA Jk -<br />
____--- qA -KA SA ZD 1 _- C<br />
qD KD SD ,/u Jh J‘K<br />
Dans ce cas qA/qD s’accroîtrait lorsque la vidange s’accentue, c’est-à-dire lorsque<br />
h diminue. C’est exactement l’inverse qui se produit.<br />
Il faut donc bien admettre une certaine indépendance générale.<br />
Cela n’empêche pas les considérations suivantes : le rôle des chenaux dans un<br />
système karstique est très différent suivant les hauteurs auxquelles ils sont placés.<br />
Les chenaux du haut, au-dessus du niveau piézométrique d’étiage, conduisent toutes<br />
les eaux de crue. Leur vidange est rapide, entraînant avec elle les eaux des fissures.<br />
Et là, on a bien la somme des deux systèmes de vidange avec des coefficients de<br />
tarissement M différents.<br />
Les chenaux du bas situés sous le niveau piézométrique d’étiage conduisent toutes<br />
les eaux de décrue. Mais le débit de l’eau qui coule dans ces chenaux est essentiellement<br />
16
églé par le débit de l’eau des fissures. En conséquence, il ne reste plus que la courbe<br />
d’écoulement des fissures, la courbe d’écoulement des chenaux cesse. Ce sont les<br />
petites fissures qui font fonction de facteur de contrôle de l’écoulement.<br />
En période de crue, lorsque les sources correspondent à un réseau d’infiltration,<br />
c’est-à-dire à un réseau situé dans la zone d’aération, dans la zone de ruissellement<br />
par exemple, toute vague importante d’eau d’infiltration arrive immédiatement a la<br />
source, apportant directement l’eau de pluie.<br />
Mais lorsqu’il s’agit de vraies sources débitant l’eau d’une nappe occupant un<br />
réseau aquifère, l’eau d’infiltration augmente la charge de la nappe par élévation de<br />
sa surface piézométrique. Cette augmentation de charge détermine immédiatement<br />
une augmentation de débit de la source. Le délai est faible par suite du manque de<br />
compressibilité des calcaires. Seule entre en jeu la compressibilité de l’eau.<br />
Lors des premibres crues de la nappe, l’eau ainsi chassée est de l’eau d’étiage,<br />
circulant lentement et dans les parties basses du réseau. Cette eau a eu le temps de se<br />
mettre thermiquement en équilibre avec le terrain. Elle a donc une température relativement<br />
élevée. Ce n’est que plus tard que la température s’abaissera par l’arrivée des<br />
eaux froides d’infiltration. C’est en particulier ce que l’on observe à la Fontaine de<br />
Vaucluse (Schoelier 1949 b.p. 132 et 146-147). Ce n’est qu’un mois après la crue, que<br />
la température de l’eau s’abaisse de 13 à 15” à 8”. Le délai est grand en raison de<br />
J’importance du réservoir. L’étude comparée des débits et des températures doit pouvoir<br />
permettre des calculs d’alimentation et de réserve.<br />
En période d’alimentation, le niveau de la nappe peut donc monter rapidement<br />
par l’arrivée brusque de l’eau par les chenaux. Partant des chenaux et larges fissures,<br />
l’eau pénètre latéralement dans les fissures étroites. On peut s’attendre à ce qu’au<br />
début la remontée soit locale, mais elle ne le reste que peu de temps, en raison de la<br />
grande conductibilité de ces chenaux.<br />
L’eau infiltrée par les fissures arrivant en retard provoque une remontée plus<br />
générale du niveau de la nappe, en raison de leur plus grande extension. L’eau monte<br />
dans la nappe tant que l’alimentation est plus grande que les sorties. Cette montée<br />
est toujours de durée plus ou moins courte.<br />
Ce tableau peut évidemment varier suivant le degré de karstification.<br />
En période de décrue, le volant hydrodynamique des gros conduits, chenaux ou<br />
fissures, est réduit, surtout lorsque la karstification est peu avancée. Leur volume total<br />
est bien moindre que celui des fissures étroites et leur grande largeur permet une<br />
évacuation rapide.<br />
Même dans une karstification relativement avancée, le volume des gros chenaux<br />
n’atteint pas celui des fissures étroites. Ainsi, j’avais établi (Schoelier 1948) que dans<br />
les calcaires éocènes alimentant la Source du Kef en Tunisie, pour un volume total<br />
des fissures de 844 à 895.000 m3, le volume des grosses fissures n’est que de 174.200<br />
à 225.000 m3 contre un volume de 670.000 m3 des petites fissures. Le volume des<br />
grosses fissures n’est que le 1/5 à 114, et celui des petites fissures est des 415 à 314 de<br />
celui de la nappe. C’est-à-dire encore que le volume des grosses fissures n’est que le<br />
1/4 ou le 113 du volume des petites fissures.<br />
Dans le présent cas de la Fontaine de Vaucluse, le rapport du volume des grosses<br />
fissures aux petites est de :<br />
‘”l m3 = 0,308, soit 1/3,3<br />
26,65 x 10’ m3<br />
Pour la Source du Lez, alimentan,t Montpellier, le rapport calculé par une crue de<br />
novembre est de<br />
2,lS x lo6 m3 -- = 0,243<br />
8.95 x lo6 m3<br />
17
soit 1/4 environ (Drogue 1964), ce qui est semblable B ce que j’avais calculé pour<br />
la Source du Kef.<br />
Le volant des fissures étroites est donc beaucoup plus grand que celui des conduits<br />
larges, d’autant plus grand que leur perméabilité est faible. C’est ce qui explique le<br />
fait constaté que très rapidement ce sont les fissures étroites qui joueront le rôle<br />
principal dans la vidange.<br />
Cependant, au début, la charge étant élevée, le débit des gros conduits est grand,<br />
quoique le plus souvent moindre que celui des conduits étroits. C’est ce débit des grosses<br />
fissures et chenaux qui aura surtout tendance à faire baisser la surface de la nappe et<br />
à provoquer vers elle un drainage des petits chenaux et fissures.<br />
A un stade avancé de décrue, le niveau de la nappe est bas, la charge sur les<br />
grosses fissures peu importante, la quantité d’eau qui passe par les gros chenaux<br />
provient en totalité du drainage des fissures étroites et qui de ce fait règle le débit<br />
de la source.<br />
LE BILAN DANS UN MASSIF CALCAIRE<br />
Dans un massif calcaire, tout comme dans un massif sableux, lorsque l’on examine<br />
l’aspect saisonnier ou simplement l’aspect d’une averse, il n’est pas correct, comme<br />
on le fait trop souvent, d’utiliser l’équation simple du bilan :<br />
mais on doit prendre la relation :<br />
P = E+Ks+I<br />
P=E+l+Rs~d,+dl/, .<br />
dans le cas d’un Systeme aquifère hydrogéologiquernent isolé, équations dans lesquelles<br />
P est la hauteur de pluie, E ,l’évapotranspiration, R, le ruissellement superficiel,<br />
I l’infiltration alimentant la nappe, &A, le déficit ou l’excès d’eau de rétention dans<br />
le sol et &id V, l’excès ou le déficit d’eau retenue à la surface du sol, ce dernier pouvant<br />
être en gros compris dans Ar; tous ces éléments sont exprimés en hauteurs d’eau,<br />
m ou mm. E englobe l’évaporation à la surface du sol, l’évaporation dii sol, la transpiration<br />
par les plantes, soit au total l’évapotranspiration’, E peut également comprendre<br />
I’kvaporation à l’intérieur du réseau souterrain, vritisemblablement très peu important<br />
en comparaison du reste.<br />
En effet, l’humidité de l’air des fissures et chenaux est de 100% en général. Elle<br />
n’est que légèrement abaissée lorsqu’il y a ventilation. Et celle-ci n’a quelque valeur<br />
que dans le cas de différence importante de niveau entre les entrées et sorties de l’air.<br />
+LIr comprend le déficit ou l’excès de rétention dans le sol. C’est un terme à part<br />
qui correspond à l’acquisition d’un état antérieur à celui présent considéré.<br />
II comprend tous les déficits qui doivent être comblés pout que l’eau d’infiltration<br />
puisse gagner la nappe.<br />
Il comprend donc l’interception proprement dite par la végétation, par la surface<br />
du sol, c’est-’à-dire toute I’eáu que les surfaces retiennent par adiorption.<br />
I1 comprend le déficit d’eau de re‘teniion du sol et des fissurek dans le domaine de<br />
la zone d’évaporation situé à la partie supérieure de la zone d’aération et qui peut être<br />
plus profonde que dans un terrain à perméabilith d’interstice. I1 correspond ainsi au<br />
remplissage des fissures fines qui s’étaient egouttées au cours de la descente du niveau<br />
de la nappe, ç’pt.$dire des fissures .qui s’étaient auparavant remplies d’eau par les<br />
pluies précedentes Ou par la montée du niveau de la nappe.<br />
-Ar correspond aux phénomènes inverses., Mais tous n’ont pas la même valeur.<br />
L’excès d’interception par la végétation n’est que fugitif. L’excès d’interception par la<br />
’ ’<br />
surface du sol peut déjà durer quelques heures.<br />
18
Certainement, l’excès le plus important en volume et en durée est celui de l’eau de<br />
rétention du sol et des fissures, excès provenant de l’infiltration de la pluie, excès d’eau<br />
montée lors d’une ascension du niveau de la nappe. II donne naissance à un égouttement.<br />
Ainsi A, prend une valeur positive de plus en plus grande au cours de la saison<br />
sèche, de telle sorte que pour des valeurs de P et I considérées à un même moment,<br />
compte tenu du retard de vidange, le rapport ZIP diminue. Ce rapport est minimum<br />
à la fin d’une longue sécheresse. Je l’avais déjà indiqué pour la Source du Kef en<br />
Tunisie (Schoeller 1948). I/P n’est que 20,0% en moyenne (de 16,s à 25,i) contre une<br />
moyenne annuelle de 70,5%.<br />
Au contraire dl prend une valeur négative de plus en plus grande en valeur absolue<br />
au cours d’une période d‘alimentation sans pouvoir dépasser un certain taux, a<br />
l’exception de fonte des neiges. I/P s’accroît. Pour la Source du Kef, il est en moyenne<br />
de 86,5% (77,4-91,6).<br />
Dans les montagnes calcaires de Hongrie (Kessler 1957), l/P est de 156 en<br />
septembre; 12,3% en octobre contre 51,3 en décembre; 50,2 en janvier; 73,3 en février<br />
et 123,6 en mars (fonte des neiges). Drogue (1964) donne I/PxS = 18,5 pour la<br />
première crue du 15 octobre de la Source du Liron près de Montpellier, contre des<br />
moyennes annuelles de 39,2 et pour la Source Lez I/P x S de 8 (moyenne de 2 crues<br />
d’automne), contre 63 (moyenne de 7 crues d’hiver) et de 69 de 1 an (S = la surface<br />
d’alimentation).<br />
Lafosse, 1964, pour la grand Font de l’anticlinal de Saintonge calcule I/P = 9,8%<br />
en étiage, 49,4 en crue et 21,5% annuel.<br />
Dans le massif des Arbailles (B. Pyrénées) Napias, 1963, nous donne :<br />
Source de Behorleguy<br />
Source d’&pii<br />
Source d’Aussurucq<br />
Source de Patia<br />
Source de Miramont<br />
Source de Latarge<br />
Source de Camou<br />
Ériage Crue Année<br />
% % %<br />
0,05<br />
60<br />
42 80<br />
59<br />
7 90 ’<br />
55<br />
12 80<br />
60<br />
19 88<br />
49<br />
34 72<br />
43<br />
28 .‘84<br />
70<br />
L’égouttement proprement dit, qui a lieu pendant la décrue, participe au débit<br />
de vidange des petites fissures au moment où celles-ci prennent une part prédominante<br />
sur celle des grandes fissures, c’est-à-dire au moment où les petites fissures jouent le<br />
rôle de facteur de contrôle sur le phénomène de la vidange. La fraction égouttement<br />
se &pare de la fraction vidange en admettant que cet Bgouttement est presque constant,<br />
par l’examen de la portion finale de la courbe qui est quasi horizontale.<br />
RELATIONS AVEC L’INFILTRATION<br />
Tout d’abord, l’alimentation par la pluie est différente suivant la présence OU<br />
l’absence d’une couverture végétale, c’est-à-dire aussi d’un sol recouvrant le calcaire.<br />
C’est en effet de beaucoup plus I’évapotranspiration que le manque de précipitations<br />
qui est la cause du régime non inñuencé en période estivale.<br />
Si évidemment le massif calcaire est recouvert d’une bonne couche de sol et d’une<br />
épaisse couverture végétale, le fort déficit d’eau de rétention du sol et le grand pouvoir<br />
d’interception de la végétation diminuent fortement et même annulent le plus souvent<br />
l’infiltration, la courbe de récession sera régulière. ne présentera pas ou très peu de<br />
remontée. O n s’approchera de la courbe parfaite.
Par contre, lorsque le calcaire est à nu, ou lorsque étant plus ou moins couvert,<br />
il présente de larges zones d’absorption, l’effet de I’évapotranspiration sera réduit.<br />
L’évapotranspiration n’annulera l’infiltration que pour les pluies de faible intensité<br />
et de courte durée. Mais toute pluie tant soit peu importante descendra dans les fissures,<br />
sera vite à l’abri de l’évapotranspiration et gagnera la nappe. La courbe de récession<br />
présentera alors de nombreuses remontées, suivies de nouvelles rkessions. Pendant<br />
cette période estivale, le quotient apport par la pluie/pluie se trouve plus faible qu’en<br />
période d’alimentation générale. Cet apport par la pluie est facile à calculer puisqu’il<br />
est compris entre la courbe de récession avant la pluie et la nouvelle courbe de récession<br />
après la pluie.<br />
II est facile de saisir sur les courbes de vidange le moment OU l’évapotranspiration<br />
commence à être effective et le moment OU elle a cessé de jouer son rôle et ces deux<br />
dates peuvent etre comparées à celles de la courbe d’intensité de I’évapotranspiration.<br />
Ainsi le coefficient d’alimentation, c’est-à-dire aussi l’eau retenue pour combler<br />
les déficits d’eau de rétention provoqués par évapotranspiration varie au cours d’une<br />
meme année, de même qu’il varie d’une année à l’autre. II est minimum pendant la<br />
période sèche, à l’étiage.<br />
Malgré cela, l’alimentation en période sèche existe contrairement à ce qui a lieu<br />
pour les nappes d’interstices qui, à ce moment, ont une alimentation nulle.<br />
D’ailleurs, d’une manibre générale, l’alimentation des nappes des massifs calcaires,<br />
surtout des massifs calcaires dénudés, est bien supérieure à celle des nappes des<br />
terrains à perméabilité d’interstices.<br />
Lorsque le massif calcaire est étendu, les pluies orageuses peuvent tomber une fois<br />
sur un point, une autre fois sur un autre. Ainsi, pour une même intensité de pluie,<br />
ayant une même durée, le délai d’action et l’importance de cette action sur la source<br />
peuvent être différents. Pour un même gros débit de crue de la source, la courbe de<br />
récession peut être différente suivant que la pluie est tombée en un endroit ou un autre<br />
du massif, c’est-à-dire a suivi des chenaux et fissures de caractéristiques hydrodynami-<br />
ques le long de trajets différents. C’est en particulier net pour la Fontaine de Vaucluse,<br />
OU l’on voit a4 varier d’une décrue de chenaux à une autre.<br />
NAPPE CALCAIRE DRAINANTE<br />
Des réseaux aquifères de calcaire peuvent être recouverts de formations sableuses,<br />
par exemple :<br />
C’est le cas des calcaires du Crétacé supérieur de Dordogne et du Lot-et-Garonne,<br />
recouvert de sables du sidérolithique ou de sables du Périgord. Les affleurements<br />
calcaires ne se trouvent généralement que dans les vallées. De ce fait, l’alimentation<br />
par les affleurements calcaires est rare. Les réseaux calcaires reçoivent essentiellement<br />
l’eau qui traverse les sables du Sidérolithique ou ceux du Périgord.<br />
Les calcaires agissent donc comme un drain.<br />
Le débit de la nappe du calcaire est celui des sables, constant d’un bout de l’année<br />
à l’autre, en raison du grand volant de la nappe des sables. Les vagues hivernales<br />
d’infiltration séparées par les périodes d’évapotranspiration, s’amortissent rapidement<br />
et d’autant mieux que la zone d’infiltration du sable est épaisse. Elles ne sont plus gukre<br />
sensibles aux sources, même si le réseau calcaire comprend de très larges chenaux.<br />
20
ABSTRACT<br />
NONSTEADY FLOW TO A WELL<br />
IN AN INFINITE ANISOTROPIC AQUIFER<br />
Istavros S. PAPADOPULOS (1)<br />
U.S. Geological Survey, Washington, D.C.<br />
Well flow equations presently used in the analysis of pumping tests and the<br />
prediction of water levels have been derived under the assumption that aquifers are<br />
isotropic. These existing equations are not applicable to anisotropic aquifers such as<br />
fractured rocks.<br />
in this paper, an equation is derived for the drawdown distribution around a<br />
well discharging at a constant rate from an infinite anisotropic aquifer. Drawdowns<br />
computed by this equation are compared and found to be in good agreement with<br />
those observed in an electric-analog model constructed for this purpose. It is shown<br />
that pumping test data from a minimum of three observation wells can be analyzed<br />
to obtain the components of the transmissibility tensor along an arbitrarily chosen, set<br />
of axes, and that these components, in turn, can,be used to determine the principal<br />
transmissibilities and the orientation of the principal axes. The method is illustrated<br />
with an example.<br />
RESUME<br />
Ecoulement irrégulier en direction d’un puits dans une nappe anisotrope iilimirée<br />
Les équations d’écoulement des puits actuellement utilisées pour l’analyse des<br />
tests de pompage et les prévisions des niveaux d’eau ont été établies sur le postulat<br />
que les aquifAres sont isotropes. Ces équations ne peuvent être appliquées aux<br />
aquifères anisotropes que sont les roches fissurées.<br />
L’auteur de cet article établit une équation donnant la répartition du rabattement<br />
de la nappe autour d’un puits au débit constant, foré dans une nappe anisotrope<br />
illimitée. Si l’on compare les rabattements calculés d’après cette équation à ceux que<br />
l’on observe sur un modèle électrique analogique construit à cette intention, on<br />
constate que les uns et les autres concordent. L’auteur montre aussi qu’en analysant<br />
les données des tests de pompage effectués sur un minimum de trois puits d’obser-<br />
vation, on peut obtenir les composants du tenseur de transmissivité pour un ensemble<br />
d’axes arbitrairement choisis. Ces composants peuvent eux-mêmes être utilisés pour<br />
déterminer les transmissivités principales et l’orientation des axes principaux.<br />
La méthode est illustrée par un exemple.<br />
INTRODUCTION<br />
Equations presently used in analyses of pumping tests and predictions of water<br />
levels have been derived under the assumption that the aquifers are isotropic. These<br />
existing equations are not applicable to anisotropic aquifers such as some fractured<br />
rocks in which joint patterns cause variations of the permeability in different directions.<br />
This paper derives an equation for the nonsteady drawdown distribution around<br />
a well discharging at a constant rate from an homogeneous anisotropic aquifer of<br />
infinite areal extent.<br />
The flow of ground water in aquifers follows Darcy’s law which states that the<br />
velocity is proportional to the negative gradient of the hydraulic head. In vectorial<br />
form this can be written as<br />
Y = -K grad h<br />
where V is the velocity vector, the constant of proportionality K the permeability<br />
(hydraulic conductivity) of the aquifer, and h the hydraulic head.<br />
(l) Present address: Deut. of Geol. and Geophys., Univ. of Minnesota, Minnea-<br />
polis, Minn.<br />
21
In anisotropic aquifers the velocity vector and the hydraulic gradient vector are<br />
generally not parallel. The constant of proportionality K is then a symmetric tensor<br />
of the second rank (Ferrandon, 1948; Scheidegger, 1954; Liakopoulos, 1962), usually<br />
referred to as the “permeability tensor”, which transforms the components of the<br />
hydraulic gradient into those of the velocity. The velocity and the hydraulic gradient<br />
have the same direction only along one of three orthogonal axes called the “principal<br />
axes” of the permeability tensor. The anisotropy of an aquifer can be defined by the<br />
orientation of the principal axes and the magnitudes of the components of permeability<br />
along them.<br />
For the two-dimensional flow problem treated in this paper use of the “trans-<br />
missibility tensor” T, which is the product of the two-dimensional permeability tensor<br />
and the thickness of the aquifer, is convenient. In matrix notation the two-dimensional<br />
symmetric transmissibility tensor can be written as<br />
where x and y are an arbitrary set of orthogonal axes. For the principal axes E and q<br />
the above equation reduces to<br />
Ttc and Tnn being the maximum and minimum transmissibilities, respectively.<br />
ANALYSIS<br />
The distribution of drawdown around a well of constant discharge which fully<br />
penetrates an infinite anisotropic artesian aquifer is described by the following boundary<br />
value problem<br />
s(x, +a, t) = o<br />
where s is the drawdown, T,,, T,, and T,, the components of the transmissibility<br />
tensor, S the storage coefficient, Q the discharge of the well, 6 the Dirac delta function,<br />
x and y the coordinates of an arbitrary set of orthogonal axes with origin at the well,<br />
and t the time since the flow started.<br />
The theory of integral transforms is used in solving the problem. By using the<br />
Laplace transformation with respect to r and initial condition 2 the problem can be<br />
exuressed as<br />
a2s a2J: a2J: Q<br />
Trx - 4- 2Txy - + TYy2 + - 6(~) 6(y) = SpS (5)<br />
22<br />
dX2 axôy ay P
where s is the Laplace transform of s, and p the parameter of the transformation<br />
Application of the complex Fourier transform with respect to x to the above equations<br />
results in<br />
aw a2w Q<br />
- T,,CI~W - 2 UT,, - + T,, - + 6(y) = SPW<br />
ay ay2 d2np<br />
w(a, Im, Pl = 0 (9)<br />
where w is the transform of i, c( the parameter of the transformation and i = %’-i.<br />
Transforming once more through use of the complex Fourier transform with respect to<br />
y yields an explicit expression for the transform of the solution<br />
z=- Q 1<br />
2np Txxu2 + 2 Txymp<br />
+ Ty,Pz + Sp<br />
(8)<br />
(10)<br />
where z is the transform of w and the parameter of the transformation.<br />
Equation 10 is obtained irrespective of the order that the three transformations<br />
are made. Consequently, the order of inversion is irrelevant and can be chosen for<br />
convenience. Taking first the inverse Fourier transform with respect to y, one obtains<br />
Then, taking the inverse Laplace transform through use of the convolution integral<br />
results in<br />
where L-l denotes the inverse Laplace transform of w. Finally, taking the inverse<br />
Fourier transform with respect to x, and after some mathematical manipulation we<br />
obtain the formal solution<br />
where W(u) is the negative exponential integral, known in the field of hydrology as<br />
the “well function”, defined as<br />
and in which<br />
S T,,y2 + TYyx2<br />
u, = -( -<br />
4t LT,, - T;<br />
- 2 T,,xY<br />
If the coordinate axes x and y coincide with the principal axes g and rj of the<br />
transmissibility tensor, equation 13 reduces to<br />
23
where T,+y and Tvv are the "principal transmissibilities" and<br />
Equation i5 is similar to one given by Collins [1961].<br />
For small values of its argument, that is for u < 0.02, the well function appearing<br />
in equations 13 and 15 can be closely approximated [Cooper and Jacob, 19461 by<br />
W(U) = -.5772 - 2.25<br />
log, U = 2.303 loglo -<br />
4u<br />
Substituting this approximation in equations 13 and 15 one obtains solutions for<br />
relatively large values of time as<br />
s = --<br />
2.303 Q 2.23 t Tx, Ty - Tx:, )] (17)<br />
4 .nJ T,, Tyy - Tx", lofho [s T,,y2 + Tyy~' - 2 T,,xY<br />
for an arbitrary set of axes, and<br />
(<br />
for the principal axes.<br />
As an examination of the drawdown equations indicates, for a given time, lines<br />
of equal drawdown around a weil pumping from an anisotropic aquifer have the form<br />
of concentric ellipses (fig. 1) with transverse axes along the maximum transmissibility<br />
axis 6 and conjugate axes along the minimum transmissibility axis 7.<br />
L<br />
24<br />
DATA: T[t=12crn2/sec T,,o=3crn2/se~<br />
"t S=O.OOOl Q=5.46Iiters/sei<br />
Fig. 1
ANALOG MODEL RESULTS<br />
The analytical solution obtained in the previous pages was verified by an electric<br />
analog model consisting of a rectangular resistance-capacitance network. The model<br />
was designed for an aquifer havingprincipal transmissibilities Tee and T,, of 37 cmZ/sec.<br />
and 1 1 cm2/sec and a storage coefficient of 0.048. The weil discharged at a rate of<br />
6.67 liters/sec. A node spacing corresponding to a 50 meter orthogonal grid was chosen.<br />
One quadrant of the infinite space bounded by the 5 and 7 axes was modeled. To<br />
similate an infinite aquifer the model was extended in both directions beyond the<br />
limits that would be reached by the effect of pumping within the period of measurement.<br />
t 250 0.0<br />
zoo - 0;l<br />
0. I<br />
- 150 . - 0;9<br />
: o. 7<br />
- E<br />
4.9<br />
100 - .<br />
5.0<br />
i<br />
50<br />
-<br />
24.0<br />
26.0<br />
Well<br />
o - .<br />
0;o<br />
0.0<br />
0.1<br />
o=/<br />
0;o<br />
0.0<br />
0;l<br />
0.0<br />
.<br />
0.0<br />
;o<br />
0.0<br />
0:o<br />
.<br />
I<br />
(cm)<br />
0.8 Measured drawdown<br />
o;o Node point<br />
0.9 Computed drawdown<br />
0.0<br />
0;s<br />
0.6<br />
0:5<br />
0.5<br />
0.3<br />
of3<br />
0.2<br />
ofI<br />
0.1<br />
li<br />
0;O<br />
0.0<br />
.<br />
4.2 2.8 1;4 0;7 0.3 Oil 0.0 .<br />
4.4 3.0 1.7 0.8 0.3 0.1 0.0<br />
50.0 23.0 9.5 02 1.5 0.4 0.1 OQ<br />
53.0 2:0 ;3 3.6 I82 (4 0:l 0.0<br />
I l I I I I I I I I<br />
O 50 100 150 ZOO 250 300 350 400<br />
( (metarst<br />
Fig. 2<br />
Measured and computed drawdowns at each node point, for IO5 seconds of<br />
pumping, are shown on figure 2. Variation of the computed and observed drawdown<br />
with time at i? = 100 meters and 7 = 100 meters is shown on figure 3. The curve<br />
representing the observed drawdown was traced from a photograph of the oscilloscope<br />
screen. The measured and computed values in the two figures agree closely, the slight<br />
differences being due to instrumental error.<br />
APPLICATION TO PUMPING TESTS<br />
The use of analytical solutions in quantitative hydrologic studies requires that<br />
the transmissibility and storage coefficient of the aquifers be determined or estimated<br />
by some means. These formation constants are usually determined from analyses of<br />
pumping tests, which consist of relating observed drawdowns to theoretical drawdown<br />
equations for the flow system under consideration. For anisotropic aquifers the<br />
25
appropriate theoretical equations are equations 13 or 17 if the principal axes are not<br />
known, and equations 15 or 18 if the principal axes arc known. Thc method of analysis<br />
is essentially the “ type-curve” or, if applicable, the “straight-line” method, both of<br />
which are weil known to hydrologists from their use in the anaiyses of tests of<br />
isotropic aquifers. The observed drawdown s is plotted against time t or reciprocal<br />
of time l/t for each observation well. Because of the absence of radial symmetry, the<br />
composite drawdown graph (s against r2/t, where r is the radial distance) and the<br />
distance-drawdown (s against r) plots which are used in tests of isotropic aquifers,<br />
O 2d04 4x10⁴ 6x10⁴ 8x104 zX1o5<br />
TIME t (sec)<br />
Fig. 3<br />
cannot be used in tests of anisotropic aquifers. Also, since there are four constants to<br />
be determined (the three transmissibility components Tzz, Tyy and Tzy and the storage<br />
coefficient S) a minimum of three observation wells at different distances and different<br />
directions from the pumping well are necessary.<br />
Both the type-curve and the straight-line methods of analysis for anisotropic<br />
aquifers are outlined below for the case where only three observation wells exist and<br />
the directions of the principal axes are not known. When data from more than three<br />
observation wells are available the same approach can be used by grouping them into<br />
sets of three.<br />
Type-cwve method<br />
1. Choose a convenient rectangular coordinate system with the origin at the<br />
pumping well and record the x and y coordinates of each observation well.<br />
26
2. From tables of the well function W(u) [Wenzel, 19421 prepare a type curve of<br />
W(uz,) against uxu on logarithmic paper. The curve so obtained is known as the<br />
type curve.<br />
3. Plot observed values of the drawdown s against reciprocal time ljt for eachof<br />
the three observation wells on logarithmic paper to the same scale as the type curve.<br />
4. Superpose the observed data plot on the type curve and, keeping the coordinate<br />
axes of the two plots parallel, find, for each well, the best fit of the data on the type<br />
curve. Choose a match point for each well and record the dual coordinates W(uz,),<br />
s, uzy and l/t of each match point.<br />
5. Substitute the values of W(uzu) and s from each match point into equation 13<br />
and solve for (T,,Tvy-T,2v). All three match points should yield the same, or<br />
approximately the same, value for (TxxTuu- TXzu). If they do not, judgement must<br />
be used to obtain an “average” value.<br />
6. Substitute the values of uzu and 1/t from each match point and the value of<br />
[TzXTuV- Tz2,) obtained in step 5 into equation 14 and, using the coordinates of the<br />
observation well corresponding to each match point, solve the resulting three equations<br />
for the products ST,,, ST,, and STxv.<br />
7. Solve these products for Tzz, Tuu and Txu in terms of S and, substituting these<br />
into the expression (T,,TuV-T&,) whose value is known from step 5, obtain S.<br />
8. Having found S, calculate Txx, Tu, and Txu from the products obtained in step 6.<br />
Sraight-line method<br />
The straight-line method of analysis can be used only if all or the latter part of<br />
the observed drawdown data for all three observation wells falls within the range of<br />
time for which equation 17 is applicable.<br />
1. Same as step 1 of type-curve method.<br />
2. Plot observed values of drawdown s in each observation well against time t<br />
on semilogarithmic paper with t on the logarithmic scale. If the latter data plot as a<br />
straight line equation 17 probably applies.<br />
3. For each well draw a straight line through those points that plot as a straight<br />
line. An examination of equation 17 shows that this straight line has a slope (As per<br />
log cycle) given by<br />
and a t-intercept to given by<br />
Txxy2 + TYyx2<br />
to = -<br />
2.25<br />
- 2 Txy<br />
Txx Ty y - q y<br />
4. Find the intercept to and the slope ds/cycle of each line. All three lines should<br />
have the same, or approximately the same, slope. If differences exist obtain an<br />
average value.<br />
5. Substitute the slope in equation 19 and calculate (TxxTuu-TXzu).<br />
6. Substitute the intercept to of each line and the value of (TXxTu2,- Tzu) obtained<br />
in step 5 into equation 20 and, using the coordinates of the observation well corresponding<br />
to each intercept, solve the resulting three equations for the products ST,,,<br />
STuu and STx,.<br />
7. Follow the same procedure as in steps 7 and 8 of the type curve method to<br />
calculate S, Tzz, Tu, and Tzu.<br />
27
After the components Tzz, Tyy and Tzy of the transmissibility tensor are obtained<br />
from the type-curve or the straight-line method, the principal transmissibilities Te6<br />
and Tvn and the orientation of the principal axes can be determined by making use<br />
of tensor properties. The following relations, obtained from the invariants and the rules<br />
of transformation of tensors, apply for all symmetric tensors of the second rank:<br />
û = arctan TEE;yTxx)<br />
(<br />
where O is the angle between the x and the 5 axis, positive in a counterclockwise<br />
direction from the x-axis, and restricted for convenience to the interval O< 13 < n.<br />
ILLUSTRATIVE EXAMPLE<br />
A 12-hour pumping test was conducted to determine the hydraulic properties of<br />
an anisotropic aquifer. The well PW was pumped at a rate of 12.57 liters/sec. and the<br />
drawdown was observed at three observation wells O W-1, O W-2 and O W-3 located<br />
as shown on figure 4. The drawdown data are given on table 1. The problem is to<br />
find the storage coefficient and principal transmissibilities of the aquifer and the<br />
direction of the principal axes.<br />
-i<br />
9.ûm4 í IV-2<br />
0-<br />
3<br />
28<br />
Fig. 4<br />
5m
Solution<br />
The coordinate axes are chosen with the x-axis passing through OW-1 and the<br />
coordinates of the observation wells are determined as<br />
O<br />
1<br />
I<br />
Y<br />
*<br />
E2<br />
E<br />
O o<br />
f<br />
z3<br />
4<br />
5<br />
OW/i- x = 28.3 in; y = O<br />
OW/2- x = 9.0 m; y = 33.5 m<br />
OW/3- x = - 19.3 m; y = - 5.2 m<br />
.2 .5 1 2 5 IO 20 50 100 200 500 1000<br />
TIME t [minutes)<br />
Fig. 5<br />
A semilogarithmic plot of the data (fig. 5) shows that the straightline method of<br />
analysis is applicable. The slope of the lines drawn through the latter part of the data<br />
is the same for all three lines and has the value of 1.15 meters per log cycle. The<br />
t-intercepts are:<br />
(lo)1 = 0.37 niin.<br />
= 0.72 min.<br />
(t& = 0.24 min.<br />
From equation 19 we obtain<br />
2.303 x 12.57 liters/sec. '<br />
(KxTy- I =<br />
= 4 x m4/sec '.<br />
4n x 1.15 m x 1000 liter/m3<br />
(26)<br />
1<br />
29
Substituting from (24), (25) and (26) into equation 20 we find<br />
(28.3)' STY, = 2.00 x m4/sec.<br />
(33.5)' ST,, + (9.0)' ST,, - 2(33.5) (9.0) ST,, = 3.89 x<br />
(5.2)' ST,, + (19.3)' ST, - 2(5.2) (19.3) ST,, = 1.39 x<br />
Solving these three equations simultaneously we obtain<br />
2.5 x 1 0-~<br />
T,, = __-<br />
S<br />
TY =<br />
Substituting from (27) into (26) gives<br />
or<br />
2.5 x m2/sec.<br />
S<br />
6.25 x 10⁻¹⁴-2.25 x<br />
S2<br />
s = 10-4<br />
Finally, by substituting from (28) into (27) we have<br />
T,, = 2.5 x<br />
Tyy = 2.5 x<br />
Txy = - 1.5 x<br />
= 4x<br />
m'/sec. = 25 cm2/sec.<br />
m'/sec. = 25 cm'lsec.<br />
m2/sec. = - 15 cm2/sec.<br />
m4/sec.<br />
m4/sec.<br />
With the components of the transmissibility tensor now known, the principal<br />
transmissibilities are obtained from equation 21 and 22 as<br />
Ttr = 3 ((25 +25) + [4 x (- 15)2]*} = 40 cm'lsec.<br />
T,, = + {(25 +25) - [4 x (- i5)2]*} = 10 cm'lsec.<br />
The angle 8 between x and 5 axis is found from equation 23 to be<br />
y-3<br />
û = arctan -<br />
= arctaii (- 1)<br />
= 135O<br />
30
TABLE 1<br />
Drawdown data from observations well O W-1, O W-2, and O W-3<br />
Time t since pumping Drawdown s (meters)<br />
started minutes) ow-1 ow-2 0hr-3<br />
0.5 0.335 O. I 53 0.492<br />
1 0.591 0.343 0.762<br />
2 0.911 0.61 1 1 .O89<br />
3 1 .O82 0.762 1.284<br />
4 1.21 5 0.91 1 1.419<br />
6 1.405 1 .O89 1.609<br />
8 1.549 1.225 1.757<br />
10 1.653 1.329 1.853<br />
15 1.853 1.531 2.071<br />
20 2.019 i ,677 2.210<br />
30 2.203 1.853 2.416<br />
40 2.344 2.019 2.555<br />
50 2.450 2.123 2.670<br />
60 2.541 2.210 2.750<br />
90 2.750 2.416 2.963<br />
1 20 2.901 2.555 3.118<br />
150 2.998 2.670 3.218<br />
180 3.075 2.750 3.310<br />
240 3.235 2.901 3.455<br />
300 3.351 2.998 3.565<br />
360 3.438 3.118 3.649<br />
480 3.587 3.247 3.802<br />
720 3.784 3.455 3.996<br />
REFERENCES<br />
COLLINS, R.E. 1961. Flow of Jluids through porous materiais. New York, Reinhold<br />
Publishing Corp. p. 115.<br />
COOPER, H.H. Jr. and JACOB, C.E. 1946. A generalized graphical method for evaluating<br />
formation constants and summarizing wellfield history. Trans. Am. Geophys. Union,<br />
vol. 27, no. IV, pp. 526-534.<br />
FERRANDON, J. 1948. Les lois de l’écoulement de filtration. Génie civil, vol. 125, no. 2,<br />
pp. 24-28.<br />
LIAKOPOULOS, A. 1962. On the tensor concept of the hydraulic conductivity. Reoiew of<br />
Engineering, Am. Univ. of Beirut, no. 4, pp. 35-42.<br />
SCHEIDEGGER, A.E. 1954. Directional permeability of porous media to homogeneous<br />
fluids. GeoJisica Pura e Applicata, vol. 28, pp. 75-90.<br />
WENZEL, L. K. 1942. Methods of determining permeability of waterbearing materials,<br />
192 p. (U.S. Geol. Survey Water-Supply Paper 887.)<br />
-<br />
31
SUMMARY<br />
APPROACH TO THE PROBLEM<br />
OF THE UNDERGROUND WATER LEAKAGE<br />
FROM THE STORAGES IN KARST REGIONS.<br />
KARST STORAGES BUSK0 BLATO, PERUCA<br />
AND KRUSCICA<br />
Mladen BORELLI<br />
et<br />
Boris PAVLIN<br />
Three reservoirs in Karstic regions of Yugoslavia, one of them (PeruCa) already<br />
constructed, the second (KrusCica) in construction and the third (BuSko Biato) in<br />
design stage, with very complete field data, have been utilised by the authors to conduct<br />
a quantitative study on water losses in karstic reservo~rs, which is of paramount<br />
importance for the economic design of watertight curtain and other similar measures<br />
concerning preventing of water losses.<br />
Hydrogeologic and technical conditions were investigated, at first, by which the<br />
bedrock of the reservoir may be defined as a porous medium of a definite type; field<br />
investigations were analysed subsequently, especially the data on permeability and on<br />
water table in order to obtain the necessary .. parameters to define the bedrock as a<br />
porous medium.<br />
The first stage of field investigations, which is at the same time the starting point<br />
of the schematisation of the bedrock, is the determination of the zones where the<br />
permeability is so high that it can be considered (in point of view of storage reservoir)<br />
as zones of practically infinite permeability.<br />
If these zones can be located, they can later on be isolated by means of dams or<br />
by watertight curtains, permitting the quantitative definition of the permeability of<br />
the remaining zones of bedrock. The zones of undetermined permeability will define<br />
the boundary conditions only.<br />
The statistical analysis of permeability is based essentially on the hypothesis of<br />
correlation between the general conditions of fissured rock and the existence of individual<br />
large caverns end channels (a relation which normally exists, by there may be<br />
exeptions, too). This analysis is very useful for the determination of the zones of<br />
undetermined high permeability and of the relative variance of permeability with<br />
depth, or for derivation of a relation between the permeability of particular regions.<br />
For fissured rock, however, and especially in carstic regions, the statistical analysis<br />
can lead to very rough information, only, on the average value of bedrock permeability<br />
as a whole, or of different parts of bedrock. This data are, however, necessary for the<br />
calculation of water losses from storage.<br />
Water table observations will give far more reliable informations on this matter.<br />
Great attention was attached consequently to the analysis of piezometric data, and<br />
their use.<br />
At the end the effect of impermeable soils was considered as it usually covers the<br />
limostone bedrock in the carstic valleys of Yugoslavia.<br />
RESUME<br />
Contribuiion à ì‘étudedes eaux souterraines en uue de la conitruction de réseruoirs dans les<br />
régions karstiques (d’après les cas des réseruoirs de BuSko Biato de Perufa et Peruda)<br />
Trois réservoirs situés dans des régions karstiques, de Yougoslavie, dont le premier<br />
(PeruCa) est construit, le second (KruZfcica) est en construction et le troisième (BuHko<br />
Blato) est à l’état de projet, et des observations trks complètes effectuées sur le terrain<br />
ont été utilisées par les auteurs pour procéder à une étude quantitative des pertes d’eau<br />
dans les réservoirs construits en région karstique. Cette étude est d’une extrême<br />
importance pour l’établissement de murs d’étanchéité et l’adoption d’autres mesures<br />
du même genre, visant à arrêter ces pertes.<br />
32
Les auteurs ont commencé par étudier les conditions hydrogéologiques et techniques<br />
qui permettent de définir la roche en place du réservoir comme un milieu poreux<br />
d’un type déterminé; ils ont ensuite analysé les observations faites sur le terrain, en<br />
particulier les données relatives ii la perméabilité et au niveau de la nappe, afin<br />
d’obtenir les paramètres nécessaires pour définir la roche en piace comme un milieu<br />
poreux.<br />
La première étape des études sur le terrain, qui constitue en même temps le point<br />
de départ de la schématisation de la roche en place, consiste à déterminer les zones<br />
OU la perméabilité est si forte qu’elles peuvent être considérées (du point de vue de<br />
la réserve d’eau) comme des zones de perméabilité pratiquement illimitées.<br />
Si ces zones peuvent être localisées, elles pourront ultérieurement être isolées au<br />
moyen de barrages ou de murs d’étanchéité, ce qui permettra de déterminer quanti-<br />
tativement la perméabilité de la zone restante de la roche en place. Les zones de<br />
perméabilité non déterminée ne définiront que les conditions marginales.<br />
L’analyse statistique de la perméabilité repose essentiellement sur l’hypothèse de<br />
la corrélation entre les caractères généraux des roches fissurées et l’existence de vastes<br />
cavernes et chenaux (relation qui existe normalement, mais qui n’est pas sans<br />
exceptions). Cette analyse est très utile pour la détermination des zones de forte<br />
perméabilité non déterminée, pour la détermination des variations de la perméabilité<br />
avec la profondeur et pour la détermination d’un rapport entre les différentes perméa-<br />
bilités de régions particulières. Mais dans le cas de roches fissurées, notamment en<br />
région karstique, il se peut que l’analyse statistique ne fournisse que des données très<br />
approximatives sur la valeur moyenne de la perméabilité de l’ensemble ou de diverses<br />
parties de la roche en place. Ces données sont cependant nécessaires pour le calcul<br />
des pertes en eau d’un réservoir.<br />
Les observations du niveau de la nappe donneront à ce sujet des informations<br />
beaucoup plus sûres. Par conséquent, on a apporté une grande attention à l’analyse<br />
des données piezométriques et à leur utilisation.<br />
Les auteurs étudient enfin le rôle des sols imperméables, qui recouvrent d’ordinaire<br />
le fond rocheux calcaire des vallées karstiques de Yougoslavie.<br />
1. INTRODUCTION<br />
Abundant research works accompanying the designing of karst storage basins<br />
render useful data about the characteristics of karst rocks underlying these reservoirs.<br />
Particular attention should be paid to the observation of the karst storage basins<br />
already completed, especially to these which were designed in accordance to the<br />
numerous research works. This article deals with the results yielded by the research<br />
works and observations of three Yugoslav karst reservoirs, the one of which-PeruCa-<br />
has been exploited for five years. The data presented here wil probably contribute to<br />
the general knowledge of the karst terrains, though the aim of the article is restricted<br />
to the problem of leakage from karst reservoirs. This should be mentioned since the<br />
data and information necessary of the estimation and calculation of the water leakage<br />
from reservoirs are specific, differing from the other technical problems in karst,<br />
particularly from the probiem of water capture of the influence of backing to the<br />
inflow of underground water into karst storage basins. The differences among these<br />
problems will be pointed out in the further text.<br />
The main characteristic of the fissure porosity in general and particularly of karst<br />
rocks in the existence of preferential channel ways. In natural circumstances these<br />
ways offen in general almost illimited transport possibilities, as to the formation of<br />
reservoirs at least. The realisation of a karst reservoir implicates the necessity to cut<br />
off main water drains in order to impede the water leakage. Consequently, the estimation<br />
ofwater leakage is reduced to the determination of the water loss through the remaining<br />
fissured rock mass.<br />
There are two ways of calculating the leakage of water as well as the analytic<br />
treatment of flows in general:<br />
a) To observe only the preferential ways applying the equations valid for tubes and<br />
canals. This way of calculating can be used if the size of preferential ways, faults,<br />
tubes and canals are known:<br />
33
) To observe the entire rock mass performing the calculation in accordance with<br />
the scheme of continuum and schematizing the bedrock of reservoir as a porous<br />
medium through which the water flows at a discharge velocity V. In this case the<br />
rock mass is defined, from the standpoint of water flow, by some of the parameters<br />
determining the permeability. Such is, for example, Darcy’s coefficient of filtration.<br />
According to our opinion the research works may render more precise information<br />
only on the biggest canals which should be cut off in any case in order to perform a<br />
karst reservoir, so that the characteristics of these canals are not particularly interesting<br />
in that sense. Under these conditions the only possible method of the leakage estimate<br />
is: the calculation after the continuum scheme. Since there are many difficulties<br />
appearing in karst when applying the continuum scheme of the rock mass, it is<br />
necessary to explain such a scheme. It is a particular question whether and under<br />
which conditions the permeability of the rock mass, necessary for the estimate<br />
of leakage according to the continuum scheme, can be obtained by means of<br />
research works.<br />
2. POSSIBILITIES OF SCHEMATIZING THE RESERVOIR BEDROCK AS CONTINUUM<br />
More water can pass through a karst channel of larger dimensions than through<br />
thousands, or even million cubic meters of the surrounding fissured rock mass.<br />
Naturally, under such conditions it is not logical to use the continuum scheme including<br />
the inactive rock masses undetermined in size which practically do not take part in<br />
flow. Taking into account the new rock mass when determining the discharge velocity<br />
provokes the apparent reduction of this velocity. In such a way these velocities become<br />
entirely arbitrarily. This is the reason why the problem of observing the reservoir<br />
bedrock as a continuum scheme does not seem convenient or, at least, it requires a<br />
special treatment. We would like to remind of this fact that in a basically homogenous<br />
porous granular mass there are determined unhomogeneities requiring the medium<br />
coeîñcient of permeability to be determined on the basis of more tests and to cover,<br />
by investigating the permeability, a certain not too small size of terrain (Labye, 1960).<br />
By rock mass, even if regularly and uniformly fissured, the investigated size of terrain<br />
may be larger. The number of specimens must also be greater according to the statistic<br />
rules because the standard deviation here is far more greater than by granular mass.<br />
Karst terrains are substantially an extreme example of the mentioned phenomenon.<br />
Generally, they can be treated in the same way as the granular material, but in<br />
a considerably larger scale, ofen in the regional framework. In consequence, the<br />
difference between granular masses and karst is just a question of scale.<br />
The possibility of schematizing limestone as a permeable medium is facilitated by<br />
such an interpretation. This point of view also explains why rock mass with karst<br />
phenomenon near a water capture should not be considered as a continuum. In the<br />
first place we are interested in the preferential channel ways, i.e. the localities of the<br />
rock mass, essential for this phenomenon, and which are different from the mass as<br />
a whole. Furthermore, the regime of ground water flow is distinct from the flow in<br />
natural condition only in the close vicinity of water capture in a very limited volume<br />
of rock mass. Both aforesaid moments prove that the application of discharge<br />
velocities is not justified in the case of capturing the underground water in karst.<br />
The method of schematizing the bedrock of reservoir, at least of the big one, as<br />
a continuum for the determination of leakage offers the following advantages:<br />
- for the reservoirs in karst it is necessary to cut off the principal preferential<br />
passages i.e. those parts of rocks which represent basic singularities, different from<br />
the remaining rock mass;<br />
34
- in the case of big karst reservoir the water flows through millions of cubic meters<br />
of rock, after the main preferential passages were cut off. Than we may consider<br />
that the flow becomes in a certain way uniform.<br />
The closing of main waterways can be achieved by filling the caves by a grout<br />
curtain or by the cutoff embankment separating those parts of reservoir area where<br />
the karst phenomena are especially developed. The degree of cutting off the preferential<br />
passages depends on hydrogeological conditions, sufficiency of research works and<br />
economic moments. If the zones of the exceptionally high permeability are distributed<br />
in height and space in such a way as to justify their separation and cutoff, the remaining<br />
rock mass may be considered as a continuum and the water losses may be estimated<br />
accordingly. Whether a mass may be considered as a continuum or not depends not<br />
only on the hydrogeological conditions but also on technical-economic moments.<br />
The exact calculation after the scheme is conditioned by the same moments.<br />
It is to be emphasized that the reservoir bedrock as a continuum does not<br />
necessarily mean a hypothesis of homogeneity or isotropy of rock, so far as the<br />
permeability is concerned. If the research works are sufficient the differences in permea-<br />
bility of separate sections, even anisotropy of the rock mass, can be taken into account.<br />
The law of flow has not been dealt with in this article since it is not essential in this<br />
stage of the discussion on the possibility of schematization of the reservoir bedrock.<br />
Once the schematization has been done (or the researche works utilized for the deter-<br />
mination of the corresponding permeability coefficients) a certain regime of flow<br />
(laminar, turbulent, transitional) should be accepted in order to enable the estimate of<br />
leakage.<br />
This complex problem has been left aside in the present article. According to our<br />
opinion the problem of leakage through bedrock, after cutting off the preferential<br />
waterways, the laminar regime (*)-in accordance with Darcy’s filtration coefficient<br />
-can be accepted. It exaggerates the leakage (although not in an exceptionally large<br />
scale).<br />
The karst valleys are often covered by relatively less permeable material but which<br />
is never entirely continuous or impermeable. The role of the cover as a water tightening<br />
bed is treated in laboratory (Babac 1965) and in situ. It has been proved that this<br />
cover should not be considered as a basic element for water tightening. This fact<br />
increases the interest in the possibilities to calculate the leakage through the<br />
reservoir bedrock.<br />
3. SOME REMARKS ABOUT WATER PERMEABILITY TESTS AND PIEZOMETRIC DATA<br />
In this article two kinds of investigation works: water permeability tests and the<br />
analysis of the ground water levels will only be considered. They are partly described<br />
hereinafter and partly in the following chapters (BuSko Blato, Perda, KruSEica).<br />
Before we start a detailed analysis it should be mentioned that the importance of<br />
research works is greater in cases when the geological results offer wide possibilities<br />
of interpretation, leaving the flow conditions insufficiently defined. The authors of<br />
the article wil be glad if this study contributes to the knowledge of the water<br />
permeability survey and the analysis of the ground water table. The Statistics and other<br />
data introduced in the article are only the auxiliary means for solving these problems.<br />
In the final interpretation of the results it is necessary to bear in mind all the moments<br />
determining the permeabiìity of the fissured rock mass.<br />
The permeability of rocks is determined by water permeability tests (WPT) and is<br />
expressed by means of Lugeons. One of the problems to be faced is the relation<br />
between the WPT expressed in Lugeon units and the permeability coefficient.<br />
(*) Physical models for any type of flow can be utilized, as shown by Ollös, 1961.<br />
35
For the laminar flow of the underground water we can accept(*)<br />
1 Lugeon = 0,07-0,15 m/day<br />
This relation can be easily established by taking common diameters of drillholes<br />
of two extreme cases:<br />
a) Entirely homogenous environment;<br />
b) Premise of pervious strata situated between two impervious strata.<br />
Obviously 1 Lugeon is a rather small permeability unit; even 100 Lugeon is not<br />
disastrous for water leakage if the permeability would really correspond to this value<br />
and if it would not increase due to scouring of fissures. The WPT technique cannot<br />
often achieve 100 Lugeon. It is obvious that the technical instruments offer rather<br />
limited possibilities in determination of WPT. There are numerous cases when the<br />
water escaped without pressure, i.e. the WPT value was undefined(**), which is the<br />
result of the insufficient capacity of the WPT equipment. This is the first important<br />
problem to be faced when analysing the results of water permeability tests; under<br />
certain conditions it is simply impossible to give any interpretation of the WF'T data.<br />
Naturally, whenever a horizon with the undefined high permeability occurs there<br />
cannot be determined the average values of WPT of the observed drillhole.<br />
Since the horizons of the undefined high permeability also occur the data of WPT<br />
have to be classified into two parts: into determined and undetermined high perme-<br />
ability. The latter is marked P = 03. If an exceptionally high permeability with P = 03<br />
is really assumed to occur in certain zones they should be obligatorily be cut by a<br />
grout curtain. As we shall see later in the case of PeruCa, such a point of view should<br />
be corrected, but we accept it for the present. When schematizing the storage bedrock<br />
as a continuum for the laminar flow, the zones of unlimited permeability can be consid-<br />
ered as equipiezometric lines. In another words, the losses of piezometric levels by<br />
flowing of water through these zones can be neglected. This standpoint obviously<br />
speaks in favour of security, since at any rate, even in the zones of undefined high<br />
permeability, the corresponding resistance appears.<br />
Let us suppose that the zones of undefined high permeability were limited in space<br />
and height and that they could be cut off by dikes or grout curtains. Now a question<br />
emerges whether the permeability coefficients of the remaining rock mass could be<br />
determined from the WPT data. The essential difficulty for this transition does not<br />
seem to be either the flow regime or the scheme utilized for the calculation of<br />
permeability (from the WPT data), but the very physical aspect of the phenomenon.<br />
Larger faults and karst channels are comparatively scarce, i.e. there is little probability<br />
of their registration.<br />
According to the aforesaid we may finally conclude that the WPT data cannot<br />
convey directly the permeability value of the reservoir bedrock, which wil be<br />
illustrated by the example of BuBko Blato, where the difference between the<br />
permeability value obtained by the analyses of WPT and the logical average value<br />
will be clearly manifested.<br />
Although the water permeability tests fail in this case, they are still very precious.<br />
The WPT data could be very useful to determine the relations in permeability among<br />
different parts of a storage basin, as well as for the relative decrease of permeability<br />
corresponding to depth.<br />
For this purpose it is convenient to use the method of cumulative frequency<br />
(*) See: I1 Giornale del Genio Civile II. 1962.<br />
(**) Certain cases of the undefined high permeability occurred due to the water<br />
escape around packer.<br />
36
epresented in galtons scale: logarithmus values of the WPT versus frequency, which<br />
is used in all the further examples (BuSko Blato, PeruCa, KruSEica).<br />
The fact that the permeability decrease, almost as a rule with the depth enables the<br />
introduction of the conception of “effective depth” by which the analytical treatment<br />
of losses is considerably alleviated. Let us consider a certain level having the<br />
permeability K = KO. Let us assume arbitrarily for this level that 2 = 20 = O. If the<br />
permeability decreases with a depth more rapidly, than l/Z, what is almost a rule,<br />
then the “effective depth” .Zopf may be defined as the depth of a layer through which<br />
at the same gradient the same discharge would be filtered in the horizontal direction<br />
through the layer of homogenous permeability KO, as through a given porous medium.<br />
If we assume that the exponential law of permeability decrease according to depth<br />
then the effective depth .Zerr<br />
K = KO e(-Z) (2)<br />
1<br />
Zeff = -<br />
B is a characteristic exponent of permeability decrease. The value of this exponent<br />
is calculated in the analysed examples.<br />
The piezometric levels integrate in certain sense the conditions of a larger part of<br />
the rock mass, at least in comparison with the WPT, and that is why they are precious.<br />
The piezometric observations are not free of the local properties of the rock mass,<br />
so that these data should be studied simultaneously with the WPT data. The level of<br />
the underground water registered in the piezometer corresponds to the level of the<br />
ground water around the piezometer provided that the area containing ground water<br />
is sufficiently pervious.<br />
If the active part of piezometer is not separated, the piezometer gives a kind of<br />
the average piezometric level of all strata within the influence of ‘he piezometric<br />
drillhole. If the dissimilar piezometric levels prevail in different strata the water flows<br />
from one stratum to another. The piezometers could be filled through inclined faults.<br />
As the upper parts of rocks, where the piezometer is located, has the considerably<br />
higher permeability than lower parts, the piezometer is taster filled than discharged.<br />
Therefore the piezometer generally shows higher levels than the real ones. This is<br />
particularly characteristic of the minimum water levels.<br />
The way of use of piezometric data, as applied in the storage basins described in<br />
the article, will be explained by the example of BuSko Blato. Here we would like to<br />
stress the following two moments:<br />
- It is often considered that minimum underground water levels correspond to the<br />
elevation of impervious stratum. This can be true only under exceptional conditions,<br />
i.e. if a stratum of very high permeability (collector) overlies the inclined impervious<br />
stratum. In such a case the water level diagram shows in its declination position a<br />
clear change into the horizontal direction. In the minimum level of the ground water<br />
is the level to which the water table drops before the new precipitation water comes<br />
(the end of the dry season).<br />
- Under the adequate conditions (if the approximate boundary of the rock mass<br />
through which the water filtrates can be determined) and other favourable possi-<br />
bilities, the average values of the rock permeability couid be obtained from<br />
piezometric data. It is a very important fact which we tried in vain to get by<br />
means of WPT.<br />
In the following text we shall dwell on the description of the three Yugoslav karst<br />
storage basins (BuGko Blato, PeruCa, KruSCica), starting with BuSko Blato for which<br />
the project design is being made. The abundant investigation works have been performed<br />
in ail these reservoirs.<br />
ß<br />
(3)<br />
37
4. THE BUSK, ßLATO STORAGE BASIN<br />
The BuSko Blato Storage Basin (figs. 1, 2) is situated at the south east part of<br />
Livanjsko Polje over the surface of 50 km2. The storage basin is separated from<br />
Livanjsko Polje by a natural dike called Kraljicin Nasip. The other flanks of BuSko<br />
Blato are rocky. To the west, Busk0 Blato, the bottom of which is between<br />
700-710 meter elevation ad., borders upon the slopers of the Dinara mountain (fig. i)<br />
which separates if from Sinjsko Polje (300 meters elevation). Southward there is ArZano<br />
valley which at the distance of 3-5 km descends to the elevation 600 m, forming<br />
Ariansko Polje and ViniEko Polje. To the east two mountains, Grahovica and TuSnica,<br />
separate BuSko Blato from the higher situated Duvanjsko Polje (850 m elevation).<br />
In its natural condition BuSko Blato is a periodical lake which draws water springs<br />
in its eastern part. The most important water discharge comes from the RiEina River<br />
spring. The RiEina is the only surface flow in the polje having Qmed = 12 cu.m/sec.<br />
During summer there is practically no inflow into the polje.<br />
The drainage channels of BuSko Blato are the karst sinkholes on the west and<br />
south-west part of the polje. The largest one is Stara Mlinica, into which the RiEina<br />
River sinks, then Sinjski Ponor and the sinkhole Proidrikoza. A programme of closing<br />
the sinkholes and other cutoff measures has been made, including the strengthening<br />
of the dike KraljiEin Nasip (or alternatively the erection of a new one) in order lo level<br />
the water utilizing then the waterfall of 400 meters to Sinjsko Polje and downstream<br />
to the Split hydroelectric power station. In such a way a reservoir could be formed<br />
with the useful capacity of water retain equal to 8OO,ûûO,OOO cu.m approximately at<br />
the water elevation of 716.4 meters.<br />
The geological explorations of BuSko Blato have shown that in its bottom there<br />
is a cover of diluvial age, mostly 10 to 20 m thick, which wedges out toward the border.<br />
In most part the cover is impermeable, being composed of clay, but it has many weak<br />
points since the lenses of sand and even gravel appear on a considerable surface,<br />
especially on its northern and eastern edge. The western border of the cover is damaged<br />
by a series of mostly small sinkholes, distanced even up to 500 m (the example of the<br />
hole near the limestone elevation MatkovaEa). The northern edge of the polje, as well<br />
as the part of the bedrock on which the cover is situated in this part of the polje, is<br />
composed of the impermeable tertiary marl deposits. A certain portion of the bedrock<br />
is composed of the Promina conglomerates and breccias. However, the biggest part<br />
of the bedrock is formed of the limestone layers from the Upper and Middle<br />
Cretaceous, in which the dolomite appear in the form of lenses and thin layers.<br />
The dolomites are more intensely represented in the background of the eastern<br />
group of periodical springs (MukiHnica, Agino Vrelo, Kuielj, and others) where they<br />
appear intermittantly with limestone in two anticlines with a syncline between them<br />
passing by the village Korito (“The Korito Syncline”). The eastern part of the<br />
syncline is covered by Tertiary deposits, mostly by Promina breccias, so that it cannot<br />
be clarified if the syncline closes toward the catchment area of Imotsko Polje.<br />
To the south of BuSko Blato, on the line from Ariano to Sinjsko Polje, we can<br />
find outcrops of Mesozoic, Cretaceous-Jurassic limestones and dolomites and besides<br />
this line, the outcrops of Werfen slate appear very near to Sinjsko Polje. This complex<br />
of deposits represent a barrier impermeable to water.<br />
The terrain of BuSko Blato is strongly folded with a series of microfaults. One of<br />
the micro faults is good expressed. Situated at the south-eastern part of the polje,<br />
this fault passes through the area of the drillholes No. P-19 B and P-3 B. Especially<br />
in this area a deep karstification is possible.<br />
The underground flows which connect BuSko Blato with the other karst poljes<br />
were stated by means of colour tests. Thus, it was shown that the RiEina water comes<br />
by underground ways from Duvanjsko Polje but on the way a certain quantity of water<br />
40
is deflected, which is in so much greater, expressed in percentage, as the RiEina discharge<br />
decreases. The water which does not appear in BuSko Blato flows, as it seems as we<br />
shall see further, only in the surface part of the bedrock, immediately below the<br />
alluvial cover.<br />
The colour tests in the sinkholes Proidri Koza, Sinjski Ponor and Stara Mlinica<br />
have shown that the water from these sinkholes flows subterraneously to a group of<br />
karst springs Grab and Ruda in Sinjsko Polje, about 20 km far from BuSko Blato.<br />
The water from BuSko Blato travels in this direction, which is iiot the shortest, just<br />
because of the mentioned barrier composed of the dolomite from Lower Cretaceous<br />
and Jurassic limestones and partly of Werfen slates.<br />
Fig. 2 - Situation Map of BuSko Blato Showing Performed. Observation Boreholes-<br />
Piezometers.<br />
41
From the standpoint of the design, the principal condition for the formation of the<br />
Buiko Blato Storage Basin was to find the answer to the question whether it was<br />
possible or not to reduce the runoff by economically safe measures. Bisides, it was<br />
important to establish the eventual necessity of separating by dike the south-east<br />
part of the polje from the rest of the reservoir.<br />
Jn answer to these questions it was necessary to perform numerous investigation<br />
works: structural core drilling, water permeability tests as well as the year-long<br />
observations of ground water levels. The obtained analyses wil be presented hereinafter.<br />
The analysis of the water permeability(*) was done according to the principles<br />
emphasized in the chapter 2. First, the zones of the undefined high permeability,<br />
with P = m, were found out. The frequency of the piezometric stage, with P := m,<br />
in subordination to elevations, is represented in figure 3.<br />
700<br />
650<br />
600<br />
550<br />
a BOREHOLES IN FIELD<br />
BOREHOLES IN<br />
THE SOUTHWEST SIDE<br />
BOREHOLES IN<br />
THE WEST SIOE<br />
Fig. 3 - BuBko Blato. The Frequency of Stages with Undefined High Permeability<br />
in Relation to the Elevation Point.<br />
It can be seen that the zone of the undefined high permeability is limited to the<br />
relatively narrow belt of the reservoir bedrock above the elevation 640 meters.<br />
In the statistic elaboration of the cumulative frequency of maximum WPT, the<br />
frequency “P” is expressed after Hazen p = (m-O,5)/N where ‘‘in’’ is the ordinal<br />
number of phenomena classified according to the size, and “ N’’-the total number<br />
of phenomena. The results are represented in Galton’scale: logarithms-frequency.<br />
Since the real aim of the data analysis was to determine the degree of water permea-<br />
bility decrease in relation to the depth, the data concerning the stages 650-600 meters<br />
and 600-550 meters were separately observed. The diagram in figure 4, clearly shows a<br />
(*) The data of the permeability and the ground water levels have been given by<br />
Prof. Dr. Nouveiller and Mr. NikoliC, C. E. from the Geoistraliivanja enterprise who<br />
were studying the BuSko Blato Reservoir. Results of investigation works directed by<br />
Electroprojekt, Zagreb, also have been used.<br />
42
decrease of WPT in relation to depth. The factor of the permeability decrease p,<br />
detìned by the equations 3, is:<br />
The effective depth would be:<br />
5<br />
4<br />
3<br />
VI<br />
c z<br />
O s<br />
oi<br />
a<br />
4<br />
1 O0<br />
9 .? 8<br />
.2 7<br />
Q<br />
o 6<br />
* 5<br />
F c<br />
9<br />
t 3<br />
2<br />
10<br />
9<br />
a<br />
7<br />
6<br />
5<br />
I<br />
3<br />
2<br />
1<br />
p = - 111 1.3 = 0,0052<br />
50<br />
1<br />
2 =- = 192m<br />
ß<br />
1<br />
0,l 0.2 0.5 I 2 5 10 20 30 60 50 60 70 80 90 95 98 99 99599A 99.9<br />
Cumulative frequency x<br />
Fig. 4 - BuHko Blato. Cumulative Frequency of the Maximum WPT:<br />
- for the Stage 650-600 meters ad.;<br />
- for the Stage 600-550 meters a.s.1.<br />
43
The average value of the maximum WPT for the stage 600-550 meters, would<br />
amount to 9,2 Lugeons units which corresponds to Darcy’s coefficient of permeability of:<br />
0.1 -0.2 m day<br />
This permeability is very low and in case it really exist, the artificial reduce of losses<br />
from the reservoir would be meaningless. In fact, as further piezometric data analyses<br />
wil show, the real permeability is much higher even in the zone below the elevation<br />
600 meters a.s.1.<br />
Another goal of the WPT data analysis was the establishment of the relation<br />
between the water permeability Pi of the southwest edge of the polje and the<br />
permeability of the remaining part of the western edge. The results obtained are<br />
represented in figure 5, from which we could derive<br />
The south-west sector, although more permeable, is not characterized by extremely<br />
high permeability which could justify its separation by a dike from the rest of the<br />
reservoir. This conclusion will be checked up by the analysis of the ground water levels.<br />
The analysis of underground water lecels. The year-long observations on a series<br />
of piezometers enabled to establish some laws concerning the underground levels.<br />
The main characteristics of the piezometric data are represented in table 1, shortly<br />
to be commented. It should be mentioned that the piezometric data in case of BuSko<br />
Blato have been used for a qualitatively higher stage of elaboration, i.e. for the<br />
determining the approx. value of the mean permeability coefficient of the western and<br />
southwestern edge.<br />
The analysis of the piezometric data proved the existence of a kind of stabilized<br />
level of the ground water close to the maximum water level, characteristic of overflowing.<br />
All observed piezometers do not have this stabilized level (the cases when the<br />
stabilized levels are not clearly defined are marked in the table by an asterisk). The<br />
stabilized underground level indicates the existence of a very karsty and permeable<br />
zone permitting the outfiow of water with low charge. The piezometers with registered<br />
stabilized maximum water levels are situated along the west and south-west edge of<br />
the polje. In principle, there is no wonder that the stabilized levels appear because<br />
sinkholes act as overflows. More interesting is the fact that the stabilized levels occur<br />
even below the elevation of the polje which points at the existence of a very permeable<br />
surface zone of the reservoir bedrock.<br />
The stabiliied maximum levels never drop below the elevation 660 meters. This,<br />
or somewhat lower elevation, could be considered as the presupposition for any more<br />
complex cutoff of the BuSko Blato Reservoir bedrock.<br />
It is necessary to emphasize that this conclusion is completely conformed to the<br />
results obtained by WPT test according to which the zones of undefined high<br />
permeability were stated above the elevation 640-650 meters.<br />
In table 1 we have given the absolute maximum levels (column 2.2.) which for certain<br />
piezometers only slightly differ from the stabilized maximum ground water levels.<br />
In the column 6 of table 1 there is a fact of the maximum velocity of the level diagram<br />
rise, VmaY Provided that only the vertical flow existed V , would be Zma/rz, where<br />
I, maximum intensity of infiltration is equal to “vi”, and where “r]” is the infiltration<br />
coefficient, “i” the intensity of precipitation, and “n” the coefficent of effective porosity.<br />
According to the rainfall measurement data for the given conditions, we could take<br />
i = 0.1 m/day and since the rise of level occurs in the rainy season the approximate<br />
value of r] could be 7 = 0.8. Regarding the data from the table we could consider<br />
‘‘n” of approx. value of 0.01 i.e. 1 /,. Such a little permeability coefficient is completely<br />
44
conformed to the some data which can be found in literature. Thus for instance Plotnikov<br />
(1957) considers that for the karst terrains “n” is 0.05-0.01 and for less karstified<br />
terrains it is 0.01-0.005. Since the permeability decreases with the depth for the upper<br />
stages “n” should he: n > 0.01 and in lower stages it is the same or even less. The<br />
next important item of the piezometric observations is the data of the minimum<br />
P:<br />
3 Cumulative frequency 7.<br />
Fig. 5 - BuSko Blato. Cumulative Frequency of the MaximumJWPT:<br />
A. South-Western Border Zone;<br />
B. Western Border Zone.<br />
water levels. This piezometric level shows the general drop in the west and south-west<br />
directions (same as the maximum and medium levels). However, the decrease in these<br />
directions is not monotonous. Obviously the terrain where the piezometers are situated<br />
is not homogenous and the collecting zone can be below the mesured ground water<br />
minimum levels in most piezometers. The absolute maximum levels in each section<br />
45
TABLE 1<br />
Characteristic piezometric datu of Buiko Blato<br />
1 2 3 4 5 6<br />
1.1. I 1.2.<br />
2.1. I 2.2.<br />
Observation well Maximum Miniwater<br />
level mum<br />
water<br />
Eleva-<br />
Maximum level<br />
;ion of Stabi- in<br />
No. :round lized observed<br />
urface<br />
period<br />
E- 1<br />
E- 4<br />
E- 5<br />
E- 6<br />
E- 7<br />
E- 8<br />
E -13<br />
E - II<br />
E - 14<br />
E - 29<br />
E - 19<br />
E -26<br />
E -28<br />
E - 10<br />
E-I2<br />
E -27<br />
E -17<br />
E -22<br />
E -24<br />
E - 20<br />
E -21<br />
E -23<br />
P -13<br />
P -14<br />
P -15<br />
P- 3<br />
P- 4<br />
P- 5<br />
P -16<br />
P - 17<br />
P -18<br />
P -19<br />
B -la<br />
B -2a<br />
B - 3a<br />
E -25<br />
K- 3<br />
K- 4<br />
P- 8<br />
P - 10<br />
P - 11<br />
P -22<br />
P -12<br />
P -20<br />
P -21<br />
P- 7<br />
m<br />
706,7<br />
707,7<br />
703,4<br />
71 I ,9<br />
740,O<br />
767,9<br />
762,3<br />
782,8<br />
743>4<br />
854,O<br />
757,9<br />
755,O<br />
848,O<br />
768,6<br />
714,2<br />
858,O<br />
738,2<br />
763,8<br />
751,3<br />
753,6<br />
778,3<br />
769,8<br />
-<br />
722,9<br />
730,3<br />
723,2<br />
71 7,2<br />
717,7<br />
735,O<br />
715,5<br />
736,7<br />
722,8<br />
700,O<br />
700,O<br />
699,9<br />
729,3<br />
70?,5<br />
700,9<br />
717,9<br />
704,4<br />
716,4<br />
695,6<br />
707,2<br />
697,4<br />
803,5<br />
707,9<br />
m<br />
705,O<br />
704,O<br />
702,O<br />
700,O<br />
700,O<br />
708,O<br />
704,O<br />
704,O<br />
710,O<br />
760,O<br />
734,O<br />
705,O<br />
-<br />
726,O<br />
700,O<br />
-<br />
704,O<br />
750,O<br />
740,O<br />
710,O<br />
746,O<br />
690,O<br />
700,O<br />
698,O<br />
696,O<br />
665,O<br />
660,O<br />
668,O<br />
696,O<br />
680,O<br />
674,O<br />
678,O<br />
700,O<br />
700,O<br />
700,O<br />
680,O<br />
702,O<br />
700.0<br />
682,O<br />
660,O<br />
680,O<br />
682,O<br />
680,O<br />
696,O<br />
690,O<br />
670,O<br />
m<br />
706,O<br />
708,O<br />
704,O<br />
704,O<br />
712,O<br />
730,O<br />
724,O<br />
736,O<br />
740,O<br />
808,O<br />
740,O<br />
728,O<br />
748,O<br />
730,O<br />
704,O<br />
740,O<br />
714,O<br />
760,O<br />
746,O<br />
740,O<br />
754,O<br />
700,O<br />
702,O<br />
700,O<br />
702,O<br />
674,O<br />
665,O<br />
770,O<br />
700,O<br />
696,O<br />
688,O<br />
690,O<br />
-<br />
702,O<br />
683,O<br />
-<br />
702,O<br />
704,O<br />
692,O<br />
684,O<br />
700,O<br />
728,O<br />
702,O<br />
708,O<br />
m<br />
680,O<br />
656,O<br />
624,O<br />
636,O<br />
645,O<br />
648,O<br />
685,O<br />
650,O<br />
638,O<br />
750,O<br />
684,O<br />
620.0<br />
686,O<br />
71 5,O<br />
654,O<br />
695,O<br />
630,O<br />
660,O<br />
660,O<br />
604,O<br />
626,O<br />
630,O<br />
622,O<br />
618,O<br />
652,O<br />
623,O<br />
628,O<br />
628,O<br />
624,O<br />
624,O<br />
632,O<br />
628,O<br />
631,O<br />
614,O<br />
610,O<br />
610,O<br />
700,O<br />
700,O<br />
618,O<br />
664,O<br />
624,O<br />
636,O<br />
660,O<br />
4.1. I 4.2. Lowering<br />
,mpiitude of wate<br />
level fluctuations<br />
2.1.-3.) :2.2.-3.]<br />
m<br />
25,O<br />
48,O<br />
78,O<br />
64,O<br />
55,O<br />
60,O<br />
19,O<br />
54,O<br />
72,O<br />
10,o<br />
50,O<br />
85,O<br />
2<br />
1 l,o<br />
46,O<br />
-<br />
74,O<br />
90,O<br />
80,O<br />
106,O<br />
120,o<br />
60,O<br />
78,O<br />
80,O<br />
44,O<br />
42,O<br />
32,O<br />
40,O<br />
72,O<br />
56,O<br />
42,O<br />
50,O<br />
69,O<br />
86,O<br />
90,O<br />
70,O<br />
2,o<br />
070<br />
64,O<br />
-<br />
m<br />
26,O<br />
50.0<br />
80,O<br />
68,O<br />
67,O<br />
82,O<br />
39,O<br />
86,O<br />
102,o<br />
58,O<br />
56,O<br />
108,O<br />
62,O<br />
15,O<br />
50,O<br />
45,O<br />
84,O<br />
100,o<br />
86,O<br />
136,O<br />
128,O<br />
70,O<br />
80,O<br />
82,O<br />
50,O<br />
57,O<br />
37,O<br />
42,O<br />
76,O<br />
72,O<br />
56,O<br />
72,O<br />
-<br />
92,O<br />
73,O<br />
-<br />
-<br />
84,O<br />
40,O<br />
666,O 24,O 36,O<br />
630,O 40.0 78,O<br />
- -<br />
Cases where the stabiliseted maximum level is not well defined.<br />
-<br />
56,C<br />
46,O<br />
20,o<br />
-<br />
68,O<br />
48,O<br />
40,O<br />
-<br />
-<br />
of water<br />
:vel durini<br />
the last<br />
month of<br />
recession<br />
period<br />
m/month<br />
daximum<br />
rate of<br />
water<br />
level rise<br />
337<br />
10,o<br />
I<br />
-<br />
11,o<br />
-<br />
12,5<br />
18,O<br />
15,O<br />
10,5<br />
19,O<br />
20,o<br />
10,o<br />
935<br />
15,O<br />
11,o<br />
5,7<br />
3,3<br />
17,O<br />
7,3
are of special interest because the other higher levels could be considered as a sort of<br />
the suspended water table. The existence of some irregularities in the piezometric level<br />
do not compromise the afore stated regularity of the level drop related to the depth,<br />
but it shows that this regularity should be comprised as a general tendency admitting<br />
some local exceptions. As far as the leakage from the BuSko Blato Reservoir is<br />
concerned, it, is interesting to consider the fact of relatively low water levels in the<br />
piezometers of the Korito Syncline which indicates the possibility of the eventual<br />
leakage in this direction.<br />
As emphasized in item 3, the minimum levels do not correspond to the situation<br />
of impervious strata. The minimum level position is a function of a series of<br />
parameters. Since the phenomena of the level drop from the maximum to the minimum<br />
are very complicated due to the fact that the water level passes through zones of<br />
different permeability and undergoes the influence of precipitation, we shall analyze<br />
only the phenomena near the minimum water levels where it is much simpler. For this<br />
purpose we have taken from the level diagram the value of the ground water level<br />
drop in course of one month, marked by AH (table 1, column 6). As it can be seen<br />
AH varies between 2-14 m. Hence we can obtain the mean permeability of the rock<br />
mass by means of the equations of the unsteady filtration and presuming the<br />
corresponding scheme of flow. We have accepted the scheme of the runoff of the<br />
mass without infiltration or inflow figure 6.<br />
Fig. 6 - Scheme for a Water Level Drop Estimate:<br />
- the Area of Undefined High Permeability;<br />
- the Area of Defined Permeability;<br />
- the Free Surface Line.<br />
It is supposed that in the initial moment the level of outflow is horizontal and that<br />
the rock mass empties in consequence of a sudden drop in level of the surface water.<br />
In this case the drop of the ground water level is the function of parameter<br />
HO the initial depth,<br />
t time,<br />
K coefficient of filtration,<br />
n porosity.<br />
After Polubarinova-Kocina (1 952) the interdependence HIHO can be represented<br />
by the integral<br />
Where<br />
H -=JFo<br />
HO<br />
47
The value of the above integral of the random processes can be found in mathematical<br />
and technical handbooks.<br />
For further calculation we have taken the coefficient of prosity n = 0.01.<br />
Regarding the distance x (the boundary of the porous massive) it is certain that x<br />
is smaller than the distance between the sinkhole edge of BuSko Blato and the eastern<br />
edge of Sinjsko Polje (20 km approx.) because the existence of big springs on the<br />
flank of Sinjsko Polje which shows that the fissure porosity of the rock mass must at<br />
a certain moment turn into higher porosity. On the other hand, this boundary cannot<br />
be in the vicinity of the polje. This can be concluded from the regularity of decrease<br />
of most piezometric levels, from the fact that the permeability in the zone of reservoir<br />
decreases very rapidly with the depth, from that the sinkholls through which the lake<br />
empties from time to time, have outstanding hozirontal outlets etc. It has been consid-<br />
ered that the reasonable border x should he between 5 and 10 km. Having the supposed<br />
values x and n the further calculation do not pose any difficulty. From the equation 6<br />
we have<br />
where AH is the ground water level drop in an accepted time interval, in our case one<br />
month, given in the column 6 table 1, and vi, and q~ are the values of parameter q,<br />
given in the equation 5, in the moments ti and f2, its interval being one month.<br />
For the calculation we accepted tl = 60 and tz = 90 days. The calculation was<br />
done in such a way that the distance x was established for a series of values AH, for<br />
several depths Ho, as well as for three values of the permeability coefficient, K =0.01,<br />
K = 0.1, K = 1 m/day. The results are represented in a diagram (fig. 7). As indicated<br />
in the diagram, only the permeability of about KT 1 m/day conveys reasonable<br />
values of the distance x. Accordingly, the values of permeability coefficient of a porous<br />
mass in the area i.e. below the minimum levels, should be approximately the same.<br />
It can be seen, as well, that the depth of a water bearing layer should be at least some<br />
200 meters. Just to remind that when determining the average maximum WPT in the<br />
zone of minimum water levels we obtained K = 0.1 m/day. The real values, as seen<br />
in the diagram, are considerably higher. Although the above calculations are not<br />
precise, because of many introduced presumptions, we consider that the result<br />
(obtained by the analysis of the piezometric data) is much closer to reality than the<br />
WPT data. Hence the conclusion which does not speak in favour of WPT data because<br />
it is often impossible to find from these data the approximate values of the average<br />
permeability of the rock mass.<br />
In order to establish the difference between the permeability Pi of the south-west<br />
sector and the permeability PZ of the remaining part of the western edge of the polje,<br />
we have first calculated the mean values AH. For the south-west edge AH = 6 m and<br />
for the rest of the western flank it amounts LI to N = 3.3 m/month.<br />
By using this fact îor the supposed Ho = 300 m, the permeability relation<br />
KlIK2 = 1.30 was obtained. This value, which corresponds to the one obtained by<br />
the WPT analysis, shows that on the south-west part a greater leakage could be<br />
expected, but still of the same approximate values as on the south-west edge. It is<br />
up to a detailed calculation and economic estimate to decide whether this sector<br />
should be separated or not.<br />
The presented calculation was done by one of the authors but the results of the<br />
calculation as well as some problems in connection with the grout curtain have not<br />
been given regarding the character of the article.<br />
The limestone bedrock of the BuSko Blato Storage Basin is reaching to a practically<br />
limitless depth. This bedrock mass suffered from orogenetic movements owing to<br />
which a certain extent of fissuration occurred. The rate of fissuration however is<br />
48
decreasing with the depth. The ground water percolation is also decreasing with the<br />
depth, owing to the fact that in greater depths hydraulic gradients are smaller and the<br />
conditions are therefore less convenient for the development of a natural karst drainage<br />
under the corrosive influence of the percolation waters there, than in the zone with<br />
higher hydraulic gradients. Here in the zone of more moderate hydraulic gradients<br />
with very slow percolation effects much better conditions are existing for sedimentation<br />
of terra rossa, i.e. for the filling of fissures through which the ground water made its way.<br />
Data obtained by investigations in BuSko Blato are in accordance with this<br />
explanation.<br />
Fig. 7 - Correlation between H (Water Level Drop During the‘last Month of the<br />
Recession Period), between the Permeability Coefficient K”, between the<br />
Calculative Distance to the Edge Zone of the Porous Rock Mass X, and the<br />
Staring Depth HO of the Water table calculated by Means of equation 8.<br />
. . . . . HO = 700 meters.<br />
.-.-.-. HO = 500 meters.<br />
----_ HO = 300 meters.<br />
HO = 200 meters.<br />
The relative inclination between Bubko Blato and the karst springs in Sinjsko<br />
Polje (the latter are in fact just discharge outlets of the natural under-ground drainage<br />
flows by which waters are flowing off the BuSko Blato karst Field), is comparatively<br />
small and amounts to 4 per cent only. The high permeability zone in BuSko Blato is<br />
reachinginto the bedrock-according to data available now-some 50 to 60 meters only.<br />
Water percolation in vertical direction-with a high gradient consequently-is<br />
occurring during low waters in the zone of this high permeability, starting from the<br />
surface and downwards to the ground water table.<br />
49
The more the ground water table rises, the more the height of the zone of such a<br />
percolation decreases and gives place to a drainage with relatively low gradients, which<br />
the area formed according to conditions of the flow with the continuous groundwater<br />
table through fissure systems and karst natural drains of this permeable superficial<br />
STABILISED MAXIMUM WATER LEVEL<br />
Fig. 8 - BuSko Blato. Correlation between the Maximum Stabilized Love1 and the<br />
Terrian Elevation.<br />
karst zone of bedrock and of its further karst channels towards Sinjsko Polje. This<br />
direction of the ground water drainage is predominant in this area and therefore the<br />
main karst drainage channels are developed here in this direction, both the sinkhole<br />
channels and the spring channels.<br />
Although the zone under observation has been strongly karstified and the sinkholes<br />
are of a great capacity indeed, it is out of question that the underground flow-ways have<br />
not developed to Such an extent, as to make possible an unhindered water Row.<br />
The following facts point to this:<br />
u) During high waters BuSko Blato is inundated;<br />
b) A certain correlation exists between the terrain surface level and the maximum<br />
stabilized water levels (the latter are shown on fig. 8);<br />
50
c) In the subsoil of the Dinara Mountains, in the area of the karst sinkhole drains<br />
from BuSko Blato, during the raining season comparatively high ground waters<br />
are formed, and they put a limit to the draining capacity of the BuSko Blato<br />
sinkholes. During low waters there is no such draining limitation, and then there<br />
are more convenient conditions for the ground water flow-off from BuSko Blato<br />
towards Sinjsko Polje.<br />
5. THE PERUCA WATER STORAGE BASIN<br />
The Peruta Water Storage Basin (fig. 9) is extending 20 kilometers in ienght and<br />
is situated in the karst area of the Upper Cetina Valley. With a waterhead of 60 meters<br />
this reservoir accumulates 540 million cubic meters, this being some 30 per cent of<br />
the average annual Cetina River water discharge at this particular profile. This water<br />
storage has been formed to accumulate water for the Split Hydro-Electric Power<br />
Station in the lower course of the Cetina River (fig. i).<br />
The geological and technical problems confronting the formation of this water<br />
storage and the technical solution chosen for the task (which was subsequently<br />
accomplished) have been described by one of the authors at two International<br />
Congresses on Large Dams in 1955 and in 1961, (see the attached List of References)<br />
and therefore in this report just a summarized description wil be given. Supplementing<br />
data concerning leakage, which have been recorded over a period of five years since<br />
the utilization of this reservoir, and the interpretation of WPT statistical data by the<br />
method explained above, both are now providing new information, and this should<br />
help to throw further light on the problem of water storages in karst areas generally.<br />
The bed of the PeruCa water storage is situated in an area of cretaceous limestones<br />
along syncline (shown on fig. 9). This limestone section is in its flanks and in its bottom<br />
impounded by concordantly lying lower cretaceous dolomites. At the upstream and<br />
at the downstream and it is impounded by tectonic outcrops of werfen slates. This<br />
means that water cannot be lost either to another catchment area or to the sea. The<br />
only other possibility would be that the water would bypass the dam (this dam is<br />
constructed on the same limestone bedrock), but it must appear again in any case<br />
before the aforementioned geological barrier. This makes it possible that all the<br />
waters of the Cetina River, including therefore the leakage from the Peruca water<br />
storage also. are completely utilized in the Split Hydro-Electric Power Station further<br />
downstream, and just for the requirements of this Station the Perda reservoir has<br />
been principally formed.<br />
During investigation works two possibilities of water leakage from the water<br />
storage have been considered. The first possibility of water leakage could occur by<br />
flowing-off through the net of karst underground channels, of which the upstream<br />
ones feed the strong springs which are coming under hydrostatic pressure of the 35 meter<br />
high water of the storage, and the rest of them are feeding the other strong springs<br />
located downstream of the dam site. The second possibility is water percolation through<br />
the fissured limestone area at the dam site profile.<br />
By means of watercoloration tests the spot was determined at which the ground<br />
water flows of these karst springs are branching. Placed piezometric boreholes have<br />
shown that ground water levels do not fall there below the foreseen maximum waterhead<br />
of this water storage. Consequently through this net of karst channels water cannot<br />
be lost from the Peruta artificial lake.<br />
The position and size of the grout curtain for the cout-o8 of the dam area has been<br />
determined by investigations. Some eighty drillholes in a total length of more than<br />
14,000 meters have been made, core samples were taken and water permeability tests<br />
performed. Later these drillholes were used to take records about the height and about<br />
variations of the ground water table.<br />
51
500 7<br />
400<br />
300 -<br />
200-<br />
1 O0<br />
52
53<br />
1
Cumulative frequency of the maximum WPT of PeruCa is shown in the attached<br />
diagrams (fig. 10, fig. 11 and fig. 12), separately for the central part of the reservoir<br />
bedrock at the dam profile, and separately for the left and for the right flank. Data<br />
are grouped into stages of 50 meter each. As we can see, the percentage of the boreholes<br />
with an undetermined intense permeability: P = rm is relatively considerable. P = cci<br />
5<br />
4<br />
3<br />
u)<br />
g 2<br />
&<br />
4<br />
.- 4 I00<br />
.b .Y<br />
: 8<br />
2 7<br />
e 6<br />
$ 5<br />
$ 4<br />
t 3<br />
2<br />
10<br />
8<br />
7<br />
6<br />
5<br />
c<br />
3<br />
2<br />
1 , 1 , , , , , , , , , , I 1 , , . , , , , , , , , , , . , I , , , I , , , , , , , , , I , , , , , I , I<br />
0.1 0.2 OS 1 2 5 10 20 30 40 50 60 70 80 90 95 98 99 99599.899.9<br />
Cumdative frequency y.<br />
Fig. 10 - PeruCa. Cumulative Frequency of the Maximum WPT. Observation<br />
Boreholes in the Central Area.<br />
appears for the boreholes at the left flank and in the central part including the stage<br />
250-200 meters of depth, and on the right one even deeper (stage 200-150 meters).<br />
At the left flank there exists a distinctive collector zone at the elevation 250-200,<br />
which is the most permeable of all the stages of 50 meters at the dam site. The perme-<br />
ability at the deeper stages decreases with the depth. The decrease exponent (equation<br />
54
no. 3) is 0.0158 which gives an actual depth of the permeable stratum of 62 meters.<br />
At the central part the decrease of permeability is in relation to the depth very distinctively<br />
below the stage 250-200, and therefore the effective depth in relation to the mean<br />
height of the stage 250-200, i.e. for the elevation 225: Zef = 45 meters. At the right<br />
flank the decrease of permeability with the depth could also be observed (here also<br />
Fig. 11 - Peruta. Cumulative Frequency of the<br />
Boreholes in the Left Side Flank.<br />
i) Cumulative frequency *i.<br />
Maximum WPT. Observation<br />
below the stage 250-200), but here it is less distinctive due to the different course of<br />
the cumulative frequency curve of the individual stages of 50 meters. Concerning this<br />
analysis of the WPT data we would like to point out an important feature in connection<br />
with the left flank at the stage 300-250, for which there are practically only excep-<br />
tionally high and very low permeabilities, i.e. for which there is no proper correlation<br />
55
etween the high and the low permeability. From which one may conclude that in<br />
karst even in a comparatively flat mass without fissures, considerable canals may be<br />
found. This is directly allowed in a number of cases by boring the tunnels in karst.<br />
According to the principle mentioned earlier, the grout curtain should cut through<br />
all the sectors of the undefined high permeability, and this would mean that the grout<br />
+ Cumulative frequency Y.<br />
Fig. 12 - Peruta. Cumulative Frequency of the Maximum WPT. Observation<br />
Boreholes in the Right Side Flank.<br />
curtain should be laid across the whole bedrock beyond the elevation 200 (and at the<br />
right flank even below this elevation). Such a criterion however would hardly be<br />
acceptable here for economic reasons. Hydrologic conditions make it possible to<br />
disregard this serious criterion owing to the following reasons: In the given conditions<br />
water flows which formed the channel network in the karst could appear-owing to<br />
56
the direction of the flow-in general only perpendicularly to the valley, because in<br />
this direction only a stronger piezometric runoff gradient was occurring. However,<br />
from the aspect of the water leakage around the dam the ground water channels parallel<br />
with the valley are much more important.<br />
I<br />
1<br />
-<br />
l<br />
I -<br />
2 3<br />
DISCHARGE mysec.<br />
Fig. 13 - Spring Discharge along the Cetina River downstream of the PeruCa D am<br />
for the Following Profiles:<br />
Profile B. is immediately downstream of the dam;<br />
Profile Z. is 100 meters downstream of the dam;<br />
Profile ZZ. is 200 meters downstream .of the dam;<br />
Profile ZII. is 750 meters downstream of the dam;<br />
Profile IV. is 1500 meters downstream of the dam.<br />
5
4000-<br />
900-<br />
800 -<br />
700-<br />
600-<br />
500 -<br />
58<br />
Velebit Mountain<br />
4
Fig. 14 - KrubCica Water storage:<br />
1. Drillhole;<br />
2. Ground Water Level:<br />
u) Maximum,<br />
b) Minimum;<br />
3. Sinkhole;<br />
4. Underground karst Water W ay tested by Colouring.<br />
59
This possibility to avoid to cut off all these drains in the zone of undefined high<br />
permeability on the left flank has been confirmed by colour tests and by piezometric<br />
data as well, which have-as mentioned earlier-pointed to the fact that the ground<br />
water drains branch at an elevation which is higher than the maximum waterhead in<br />
the reservoir, and also to the fact that along this flank there is in existence even a natural<br />
barrier of ground water, and therefore the grout curtain was executed to lean against<br />
this water barrier.<br />
The curtain was formed 1800 meters in length and from 150 to 250 meters deep,<br />
as shown on plate 9.<br />
Since the PeruCa reservoir was put into operation it was found that all the waters<br />
lost from the water storage are returning into the Cetina River bed downstream of<br />
the dam by means of permanent springs which are to be found predominantly on the<br />
left bank of the river. Systematic ground water level measurements have been started<br />
during the period of researce works, but have been continued ever since, and new<br />
measurements were undertaken after the reservoir formation in order to collect data<br />
concerning the quantity of water leakage. The main difficulty for determination of the<br />
actual water leakage quantity was encountered in connection with the proper assess-<br />
ment of the original water discharge of these springs to the exclusion of water<br />
quantities due to water leakage in the reservoir. Owing to the fact that these water<br />
springs are dispersed along the Cetina river bed, their discharge could not be measured<br />
but after the dam was constructed and the reservoir formed. But then the influence of<br />
water leakage during the high waterhead in the reservoir appeared in the water springs.<br />
The original discharge values of these springs along the Cetina River bed are being<br />
assessed by hydrologic interpretation of the correspondent of the discharge data of the<br />
Mali Rumin Spring. This was made possible owing to the fact that this spring received<br />
its water from the same karst hydrologic system as all the other considered springs, and<br />
on the other hand it was possible to bring forth ample proof that the leakage waters<br />
from the PeruLa reservoir do not mix with the original water of the Mali Rumin Spring.<br />
In figure 13 results of water discharge measurements of the aforementioned springs<br />
along the Cetina River downstream of the PeruCa Dam have been shown and placed<br />
into correlation to the elevation of the water level in the reservoir in the moment of<br />
measurement. The first curve with the indication mark “B” indicates the springs<br />
discharge immediately along the dam, and each of the curves marked I, II, III and IV<br />
indicate the total spring discharge up to 100, 200, 750 and 1500 meters downstream of<br />
the dam. Measurement points ZZZ and ZV indicate that all the water leakage from the<br />
reservoir returns into the Cetina River bed not further than at the profile III, i.e.<br />
within the sector of up to 750 meters downstream of the dam. Further downstream of<br />
the profile ZII no water leakage return could be evidenced.<br />
As aforesaid for determining suitable unbacked discharge the spring Mali Rumin<br />
was used. Its discharge is indicated as R in figure 13. If its discharge is really represen-<br />
tative the reservoir losses should be given by a bunch of lines each of which would<br />
correspond to its constant discharge. According to a small number of date it was not<br />
possible to draw the bunch of curves. In figure 13 only two curves are drawn from<br />
which the full one corresponds to the most logical correlation at less discharges of<br />
the Mali Rumin spring, and the dobted one corresponds to the discharge Q = O of<br />
the Mali Rumin spring only at low discharges. The latter may be considered as the<br />
correlative dependence which gives the upper limits of losses. They amount to<br />
Qmax = 1,7 m3/sec and an average annuel discharge of 1,20 cubic meter per second,<br />
what represented about 2,O per cent of the annual water discharge of the Cetine River<br />
at the PeruCa Dams.<br />
Water discharge data which in figure 13 fall to the right of the curve for the<br />
profiles ZII and IV have a much higher natural original discharge than the data<br />
according to which this curve has been formed what can be seen from the indicated<br />
60
water discharges for the Mali Rumin Spring. It is therefore quite natural that these<br />
are data deviating so much from the curve mentioned.<br />
An analysis of the produced data confirm the correctness of the conception which<br />
has been chosen within the design, that under certain conditions it is both possible<br />
and necessary to recede from the mentioned principle that all the zones with undefined<br />
high results of water leakage tests should be cut through. Such decisions must be made<br />
very carefully and they must rely on very through hydrogeological studies.<br />
6. THE KRU~CICA WATER STORAGE<br />
The KruStica Reservoir (fig. 14) is being built on the Lika River whose waters are<br />
utilized together with the waters of the Gacka River (having a waterhead of 432 meters)<br />
in the Senj Hydro-Electric Power Station.<br />
Cumulative frequency %<br />
Fig. 15 - KruSEica Water Storage. Cumulative Frequency of the Maximum WPT.<br />
61
The reservoir wil take in 240 million cubic meters of water at a waterhead of<br />
80 meters, and this amount to some 22 per cent of the average annual water discharge<br />
of the Lika River.<br />
The river bed of the KruSfica Storage Basin is Located in a rocky ground consisting<br />
of eocene-Oligocene breccia and limestone. These strata are lying atratigraphically<br />
discordant over a substratum consisting of cretaceous and jurassic limestones with<br />
dolomites. The triassic series, following the next ones and consisting of thick strata of<br />
dolomites and slates, form along the Velebit Mountain ridge a high impervious<br />
barrier, which is impounding the Lika River Valley towards the sea (fig. 14:, and<br />
therefore in the area of the KruSfica water storage area there are no sinkholes. This<br />
barrier in the Velehit Mountain declines lower than the Lika River level as far as<br />
some10 kilometers downstream of the KruEica Dam, and there we encounter sinkholes,<br />
whose karst ground channels convey the water to the sea. The KruSEica dam site on<br />
the Lika River is far enough upstream from this sinkhole area.<br />
In order to obtain necessary information on bedrock of this water storage and on<br />
prevajling hydrogeological conditions, some fifty drillholes have been made with<br />
coring and water permeability tests, in total length of 9000 meters. Later on all the<br />
drillholes have been used for piezometers. The largest part of these drillholes has been<br />
made in the area ofthe downstream zone of this reservoir and in its flanks far into the<br />
background (fig. 14). Data obtained by these drillholes and by colour tests of the underground<br />
flows in the water storage flanks have shown that the Lika River Valley in the<br />
area of the KruSGca Reservoir and of the immediate downstream zone is in fact the<br />
lowest draining recepient of this area. We come to the conclusion therefore that water<br />
leakage losses from the water storage KruSEica will return into the Lika River and wil<br />
be utilized in the Senj Hydro-Electric Power Station.<br />
Due to aforementioned statements no demand has been imposed to the effect that the<br />
water storage should he completely watertight, but only that the water leakage losses<br />
should be reduced to a reasonable rate, similarly to the case of the PeruCa Reservoir.<br />
The interpretation of the maximum WPT statistica1 data, as it can he seen for three<br />
stages of 50 meters each in figure 15, is showing that here the zones of undefined high<br />
permeability appear in the upper 100 meter region. Here the permeability decreas<br />
with the depth more obviously than in the other two water storages. The exponent of<br />
permeability decrease with the depth is here 0.032, and this gives an actual depth<br />
of 31 meters.<br />
In the case of the KruSEica Water Storage the size of the grout curtain has been<br />
determined by applying the same principle as in the case of the Peruta Water Storage,<br />
owing to the mutually corresponding facts, but most of all owing to the fact that any<br />
waters by-passing the dam will return into the water flow upstream of the Senj<br />
Hydro-Electric Power Station, for the sake of which the water storage is being<br />
formed. The grout curtain, as adopted in the design, wil he 700 meters long and<br />
100 meters deep.<br />
LIST OF REFERENCES<br />
D. BABAC, Sur l’influence de la couche superficielle peu perméable sur pertes d’eau<br />
des retenues (Etude en cours).<br />
Y. LABYE, Étude statistique du coefficient Kz de filtration verticale dans une zone<br />
pédologiquement homogène; Vfe Journées de l’Hydraulique, Nancy, 1960.<br />
G. OLLÖS, Possibilities of model investigations into water movement occurring in<br />
fissured rocks, Ninth Coni>enfion of IAHR, Dubrovnik, 1961.<br />
B. PAVLIN, L. MLADINEO, V. STUBIEAN and E. NONVEILLER, Bassin d’accumulation<br />
de PeruCa dans le Karst Dinarique, (Q 18, R22), Ve Congrès des grunds barrages,<br />
Paris 1955.<br />
B. PAVLIN, Réalisation du bassin d’accumulation de PeruCa, (Q25, R85), Vffe Congrès<br />
des grands barrages, Rome 1961.<br />
N. J. PLOTNIKOV, M.V. SIROVATKO, and D. J. SHEGOLEV, Podzemnie vodi rudnih<br />
mestoroidenia, Moskva 1957.<br />
P. XA, Polubariiiova Kochina. Teorija dviienia gruntovih vod, Moskva 1952.<br />
62
SYNOPSIS<br />
BASIC TRANSPORT COEFFICIENTS<br />
AS AQUIFER CHARACTERISTICS<br />
Y. BACHMAT (*)<br />
A general approach to laminar steady flow of an incompressible homogeneous<br />
liquid through an inert and stable porous medium is presented. The analysis is carried<br />
out using some probability concepts. It is shown that the mass flow is governed by<br />
an algebric equation of second order with respect to the average specific discharge.<br />
The averaged medium parameters, which appear in this equation, are functions of the<br />
statistical distributions of the medium’s geometric properties in the neighbourhood<br />
of a point in space. The physical meaning of these parameters is discussed, ways to<br />
measure them and to use them as means for classification of aquifers are indicated.<br />
RESUME<br />
Le coeficieiit de circulation de base comme caractéristique des aquifères<br />
Le mouvement d’un liquide à travers un milieu poreux inerte et stable dépend<br />
principalement de la géométrie interne des espaces vides de ce milieu. Bien qu’il soit<br />
très difficile de définir cette géométrie dans un aquifère naturel, on peut cependant<br />
définir les valeurs moyennes mesurahles de la circulation de l’eau et les utiliser comme<br />
bases pour.la description des aquifères et la solution des problèmes d’écoulement.<br />
Cet arQcie tend à définir ces valeurs et à mettre en lumière leur signification<br />
physique. A cette fin, le milieu poreux est considéré comme un ensemble de canaux<br />
reliés les uns aux autres (canaux élémentaires), dont le diamètre, la forme et la direction<br />
varient au hasard, bien qu’ils soient plus ou moins uniformément répartis dans l’espace.<br />
On détermine tout d’abord les équations locales qui régissent la circulation d’un<br />
système liquide incompressible ou d’une partie de celui-ci dans un seul canai. Puis,<br />
par la théorie des probabilités, on fait une moyenne de ces équations sur un volume<br />
élémentaire statistiquement représentatif du milieu poreux (VER) réparti tout autour<br />
d’un point de l’espace choisi comme centre. Les équations moyennes de circulation<br />
auxquelles on aboutit s’expriment par des valeurs moyennes de variables qui, avec<br />
les équations, sont définies pour n’importe quel point de l’espace-temps.<br />
Les équations moyennes font apparaître trois caractéristiques communes de la<br />
circulation de l’eau pour un milieu poreux en un point donné : ce sont la perméabilité,<br />
le pouvoir de dispersion et le pouvoir de diffusion. La perméabilité montre comment<br />
le milieu poreux transforme les forces de poussée externes qui s’exercent sur un volume<br />
de liquide à l’intérieur d’un VER en un débit moyen spécifique. Le pouvoir de dispersion<br />
montre comment le milieu poreux disperse une masse d’eau donnée pendant son passage<br />
à travers un VER. Le pouvoir de diffusion montre les effets du système poreux sur les<br />
phénomènes de diffusion qui se déroulent dans son sein. Tous les coefficients mentionnés<br />
ci-dessus sont tensoriels et correspondent aux moyennes statistiques des propriétés<br />
géométriques de base du milieu. L’auteur étudie enfin les corrélations existant entre<br />
les coefficients mentionnés ci-dessus et indique les moyens de les mesurer dans<br />
la pratique.<br />
1. INTRODUCTION<br />
The transport of a liquid through a porous medium is intrinsically related to the<br />
microscopic geometry of the void space and to the flow regime within it. The porous<br />
media considered in the present paper are natural aquifers in which the flow regime is<br />
usually laminar. The objective of this work is to show that although it is practically<br />
impossible to define the microscopic geometry of a natural aquifer, some measurable<br />
(*) Hydfologist, Water Planning for Israel (TAHAL Ltd.) Tel-Aviv. Prepared for<br />
the Symposium on Hydrology of Fractured Rocks.<br />
63
averaged transport coefficients can still be derived and used as a basis for classification<br />
of aquifers and solution of flow problems.<br />
2. DEFINITIONS AND ASSUMPTIONS<br />
For the purpose of the present work, a porous medium wil be defined by the<br />
following properties (Bear, Zaslavsky and Irmay, 1963):<br />
(i) It is a portion of space occupied by a heterogeneous matter. At least, one of the<br />
phases comprising this matter is solid;<br />
(ii) The solid phase, called porous matrix (solid matrix, porous material) should be<br />
more or less evenly distributed throughout the space;<br />
(iii) Referring to the portion of space not occupied by the solid matrix as voids (pores,<br />
void space), the voids, except some isolated portions of it, must be interconnected;<br />
any two points in the void space may be connected by a path completely lying<br />
within the void space. It is also required that the same two points be connected<br />
by more than two possible pathes with an arbitrary minimum distance between<br />
any two such pathes.<br />
This definition is by no means a complete one, however, it satisfactorily indicates<br />
the type of materials under consideration.<br />
For the purpose of the present work the following assumptions wil be made:<br />
(a) The solid matrix is geometrically stable;<br />
(b) The interconnected voids are completely filled with a single phase incompressible,<br />
viscous, homogeneous and Newtonian liquid: no chemical reactions occur in the<br />
liquid; the temperature of the liquid is constant in time and space;<br />
(c) Surface phenomena or chemical interactions at the interface between liquid and<br />
solid are excluded;<br />
(d) The flow is caused only by gravity and pressure differences;<br />
(e) The flow of the liquid is laminar;<br />
(f) The resistance to flow is due to viscous friction. This resistance is proportional to<br />
the magnitude of the velocity at each point and in opposite direction.<br />
In order to develop a theory of flow through a porous medium, one must start<br />
by constructing either a simpliñed model of the medium, or a specific type of the<br />
analytical approach, or both. In the present work, a porous medium wil be visualized<br />
as an assemblage of interconnected passages (elementary channels), of gradually<br />
varying length, cross-section and orientation. Each passage, bounded by a stable<br />
solid surface, serves as a conduit and defines a fixed streamtube in space. It wil be<br />
assumed that the curved continuous surfaces which are normal to the streamlines in<br />
each conduit may be approximated by plane surfaces and that an axis in the form of<br />
a smooth curve may be defined along each conduit by connecting the centroids of<br />
these normal cross-sections. The orientation of a conduits axis at each point is defined<br />
by the slope of its elementary length AZ at that point. It wil also be assumed that the<br />
portion of space where conduits meet each other (junctions) is much smaller than the<br />
volume of space occupied by the conduits themselves. However, the dimensions and<br />
shape of a junction are such, that the laminar regime of flow in a junction is still<br />
preserved and the passage of liquid through it is accompanied by losses of energy<br />
which are negligible compared with the losses in the surrounding passages. The<br />
microscopic flow pattern within each passage is constant, although the direction of<br />
flow along the streamlines may be reversed.<br />
The motion of a liquid particle through the porous medium model described<br />
above takes place through a particular system of conduits (passages). Although, the<br />
64
law of motion is known, the local geometric properties of the medium and the local<br />
pressure drop which are incorporated in this law are unknown. As these variables are<br />
practically nondeterminable, they must be treated as if they were random variables<br />
(Scheidegger 1960). On the other hand, the local values of variables at each point are<br />
of no practical value, because all measurements yield average values over small volumes<br />
of space containing in general ensembles of passages or of their sections rather than<br />
single ones. Therefore, the flow of a liquid through a porous medium is to be treated<br />
by a statistical approach, i.e. at first the stochastic equations governing theinstantaneous<br />
motion of a single liquid particle through a porous medium wil be derived; then,<br />
making some general assumptions about the correlations of the variables involved,<br />
the above equations wil be averaged for an ensemble of particles which occupy at<br />
a given time a statistically representative elementary volume (REV) of the medium<br />
around any point in space-its centroid. The resulting macroscopic transport equations<br />
contain averaged variables and medium parameters, which are assumed to be<br />
nonrandom and arc assigned to the centroid of the REV.<br />
As this procedure is applicable to any point in space, the actual medium is replaced<br />
by a fictitious medium which is continuous with respect to the average variables and<br />
parameters.<br />
3. POROSITY AND REPRESENTATIVE ELEMENTARY VOLUME (REV)<br />
A basic concept in the approach outlined in the proceding section is the concept<br />
of the representative elementary volume of space (REV) over which the transport<br />
equations of single particles have to be averaged. Since the averaged variables are<br />
assigned to the centroid of the REV, it is required that the dimensions of the largest<br />
REV have to be much smaller than the dimensions of the flow region. On the other<br />
hand, the REV must be suiñciently large to contain a representative group of samples<br />
of the void space in the neighbourhood of the point.<br />
In fluid mechanics a physical point is determined through the definition of density<br />
(Prandtl and Tietjens 1957). In the present work the REV is determined in a similar<br />
way through the definition of porosity, as follows (Bear and Bachmat 1965).<br />
Let a geometrical point P within a porous medium be surrounded by a surface<br />
enclosing a small portion of the medium of volume A U with Pas centroid. The quotient<br />
dUv/dU, where AU,, is the volume of voids within AU, defines the mean volumetric<br />
porosity II of A U,<br />
n(AU) = AUJAU<br />
By gradually reducing the volume BU with P remaining its centroid, a series of<br />
values ni (A Ui) wil be obtained<br />
When AU is large, it may include zones each having a specific distribution of pore<br />
sizes. As AUi is reduced, enclosing each time a different proportion of the various<br />
zones, the values ni (A Ui) may fluctuate considerably. Below some d U, depending<br />
on the position of P with respect to the zone boundaries, the fluctuations in ni wil<br />
tend to cease. Within this region, the variability of pore size and arrangement is only<br />
randomal. However, by further reducing A Us to values below some LI Wo, fluctuations<br />
in ni wil increase again; this wil occur when the size of BU is of the order of<br />
magnitude of a single passage. Finally, as AU-tO, n will attain the value of 1 or O<br />
according to whether P is in the solid matrix or inside a void.<br />
65
The porosity n(P) of the medium at P is defined as the mean porosity corresponding<br />
to the value AUo mentioned above. This may formally be written as<br />
(3.3)<br />
The volume U,( P) may be considered as a representative elementury volume (REV)<br />
of the medium at P. In the following paragraphs, this volume wil be referred to as<br />
the physical point representing the geometrical point P. By the above definition, the<br />
size of a physical point is such that adding to it or subtracting from it one or several<br />
passages has a negligible effect on the value of n. Assuming that in the vicinity of a<br />
point, AU, and AU,, both vary gradually, we obtain also<br />
n(P') = lim n(P)<br />
P-p'<br />
(3.4)<br />
where P and P' are two close points. This means that n is a continuous function at P.<br />
In a similar manner to the definition of (volumelric) porosity considered above,<br />
we may define areal porosity. However, in this case the areal porosity is associated<br />
with the orientation of the area. Let us consider a plane normal to the direction j<br />
passing through a point P within the medium. Let P be the centroid of a series of<br />
areas (AAjjt (i = 1, 2, ..., ) of various sizes within this plane. Let (AAj,,)i denote the<br />
void area within the íAAj)i. Then<br />
is the (oriented areal porosity of A(Aj)i at P. lf we gradually reduce the area (AAj)i,<br />
IZA^,^ wil vary with ever decreasing fluctuations. At a certain limiting value of (AAj)i,<br />
these fluctuations wil tend to cease. We shall refer to the smallest area LIA^)^, which<br />
still satisfies this condition as a representative elementary aren (REA) at P in the<br />
direction .i. The ailerage areal porosity at P corresponding to the direction j will be<br />
defined as<br />
nA,j = lim nAj,i = lini (ALI~,~)J(AA~)~ (3.6)<br />
(LIAj)r+(LIAj)o (dAj);'(dAj)o<br />
As for the volumetric porosity, we assume also here that<br />
iim ~I~,~(P') = lim nA,j(P) (3.7)<br />
In order to establish the relationship between n(P) and nA,j(P), let us construct around<br />
P as centroid an REV of cylindrical form with (dAj)o as cross-sectional area normal<br />
to the direction j. For this REV, the mean value EA,^ of nA,j is<br />
Since n(P) is independent of direction, the value &,j must also be independent of<br />
direction. Thus, the mean areal porosity EA in any direction is equal to the volumetric<br />
porosity.<br />
4. LOCAL TRANSPORT EQUATIONS<br />
The local transport equations are based on the principle of consercution and on<br />
the momentum theorem. If G(L, t) is some property of a liquid, then (prager 1961,<br />
66<br />
P'+P
Sec. III 4),<br />
Vis the velocity vector and dg = dS. !ti where & is a unit vector in the direction of<br />
&e outward normal to the element of area dS; dldt is the substantial<br />
s<br />
rate of change<br />
(or the hydrodynamic deriuatiue). The left hand side of (4.1) describes the instantaneous<br />
rate of change of G for the liquid within U. If G is such that GdU = const, then<br />
( U)<br />
we have<br />
-du= - GV.dS<br />
- -<br />
(4.2)<br />
i.e., the total rate of change of G over a finite volume of space U equals the net flux<br />
of G through the surface S bounding U.<br />
Case 1. Conservation of volume (incompressibility): If G = 1, (4.2) becomes<br />
n<br />
JI,- -<br />
V.dS =O<br />
(4.3)<br />
i.e., the total volumetric flux through S vanishes (outflow = inflow). This is equivalent<br />
to stating that the liquid is incompressible. By Gauss Theorem, (4.3) becomes<br />
Since (4.4) is valid for any U,<br />
avj.jaxj = o (4.5)<br />
Here, and in what follows, the double index summation convention is used, i.e., any<br />
index which appears twice in the same expression represents a sum of terms in which<br />
the repeated index obtains successively values 1,2, 3.<br />
Case 2. Continuity equation (conservation of mass). If G = e, where e is the<br />
liquid's density, (4.2) yields the mass-conservation equatiolz (continuity equation)<br />
(4.6)<br />
As in this case, the net mass flux for noncompressible liquid is zero, (4.6) reduces to<br />
Case 3. Equation of motion. Let G = (momentum) in (4.1), By the momentum<br />
theorem<br />
where zE is the resultant of the external forces acting upon the liquid within U.<br />
67
Since (4.8) is valid for any U and due to continuity (see 4.71, (4.8) can be rewritten as<br />
(4.9) is the equation of motion of a liquid particle. fd and fr are the driving and<br />
resistive forces per unit volume of liquid, respectively. The driving force is given by:<br />
- -<br />
fd - = - grad p - pg . - 1, = -pg . grad cp (4.10)<br />
cp=-+z P (4.11)<br />
PS<br />
where p is pressure, g is gravitational acceleration and I is height above any datum<br />
level. is directed upward, is the so-called piezometric head.<br />
The resistive force results from viscous friction. According to the assumptions of<br />
Sec. 2, for a particle moving through a porous mediumLT can be presented in the form<br />
f,=--v P<br />
- B-<br />
(4.12)<br />
where ,u is dynamic viscosity and B is the conductance of the passage at the considered<br />
point. B has dimensions of L2, it is a some function of the cross-section's area and<br />
shape and of position on the cross-section. (For a straight circular tube of uniform<br />
radius a, B = (a2-r2)/4 where r is distance from the axis of the tube). Insertion of<br />
(4.10) and (4.12) into (4.9) yields:<br />
-pg . grad cp - p/BV - = pdV/dt - (4.13)<br />
In OUI porous medium model the particle moves through elementary passages with<br />
fixed pathiines. Denoting the orientation of the pathline at any point by the unit<br />
vector 11 = IV, the tangential component of (4.13) becomes<br />
Ii = IV1 (4.14)<br />
-<br />
Since Il is variable in space, (4.14) wil be related to a fixed cartesian coordinate<br />
system xi(i = 1,2,3). The projections of (4.14) on the axes of such a system yield<br />
(4.15)<br />
where LY~ = dxt/dl is the cosine of the angle between the positive direction of the xt<br />
axis and the unit vector '2(=1 v), and u = ,u/@ is kinematic viscosity. Now:<br />
Also, by the definition of the substantial derivative d/dt (see 4.1)<br />
68<br />
dv av ai; - <strong>+v</strong>dt<br />
at dl<br />
(4.16)<br />
(4.17)
On the other hand, by incompressibility (see 4.5)<br />
Hence:<br />
(4.18)<br />
where div (11) is the divergence of the oriented pathlines.<br />
Introducing (4.18) into (4.17) and substituting (4.16) and (4.17) into (4.15), the later<br />
becomes:<br />
B(-div i!)<br />
B<br />
vi+<br />
V1/. = -- 9 -&.a. av - - - av, (4.19)<br />
J L<br />
V v axj<br />
v at<br />
(i = 1,2, 3)<br />
(due to the stability of the medium delût = O).<br />
Equation (4.19) represents three scalar local equations of saturated motion of a<br />
homogeneous incompressible liquid through a stable porous medium due to the action<br />
of mechanical forces only at isotermic conditions. Here B, osi and dacj/&q are rando m<br />
functions of position. ¿%p/8xj is a random function of space and time, and hence,<br />
also Vi is so. Therefore, (4.19) has to be regarded as a set of three stochastic equations<br />
of motion. It is noteworthy that B, criai and dajlaxj are medium properties<br />
characterizing its geometry. Denoting<br />
Equation (4.19) obtains the form<br />
5. AVERAGES<br />
a.&. J = T.. CJ (4.20)<br />
(4.21)<br />
The local transport equations derived in Sec. 4, have to be averaged over an<br />
ensemble of particles occupying instantaneously an REV around any point in the flow<br />
domain. The variables involved will be considered as random ones. The probability<br />
averages of these variables are assumed to be constant over the REV and representing<br />
their actual values over the REV. The following concepts from probability theory<br />
will be useful (Feller, 1961):<br />
Any random variable a can be presented in the form:<br />
where is the probability average of a (regarded also as the spatial average over an<br />
REV) and a is a deviation from the average. By definition<br />
-<br />
å=o<br />
69
The average of a product of two random variables n and b can be written as<br />
-<br />
- UT = ab + aS = áb + cov (a, b) (5.3)<br />
O 0<br />
where ab is the covariance or moment of correlation between a and b. The condition<br />
-<br />
O 0<br />
ab = O (5.4)<br />
means that the two considered random variables are noncorrelated. For statistically<br />
independent variables condition (5.4) is always fulfilled.<br />
In the special case of n = b, (5.4) becomes<br />
-<br />
(a)’<br />
For three random variables a, 6, c:<br />
= Var u (5.5)<br />
-<br />
- - - - _<br />
ou oc O00<br />
ab: = abc + hac + abc N ÜaC + 6;: (5.6)<br />
In (5.6) the average of the product of three deviations was assumed to be negligible,<br />
relative to the remaining terms.<br />
For a as a random function, the following assumptions wil be made:<br />
6. HOMOGENEITY AND ISOTROPY<br />
(ûapx,) = oü/ax,<br />
(5.7)<br />
(5.8)<br />
A porous medium is called homogeneous at a point P with respect to any average<br />
property cof the medium, (e.g., n, zj) if G remains constant in the vicinity of the<br />
point, i.e.,<br />
G = const. or aG/dx, = O (6.1)<br />
If (6.1) holds for all points of a region, this region is said to be homogeneous<br />
with respect to G.<br />
If at a point within a porous medium, G varies with direction, the medium at<br />
that point is said to be anisotropic with respect to G. If does not vary with direction,<br />
the medium is isotropic with respect to G.<br />
The local equations of motion (see 4.22) contain a medium property BTtj which<br />
expresses a transformation imposed by the medium on the external driving force in<br />
-<br />
order to yield the components of the particle’s velocity along a channel. The variable<br />
BTi5 is the average of this transformation. It shows how the average driving force<br />
acting upon the liquid volume within an REV is transformed into the average velocity<br />
of flow. By (5.3):<br />
-<br />
BTj = BTij<br />
-<br />
r ,<br />
-<br />
BTij represents a set of nine numbers - --<br />
__ (Ba: &a, Bal@,)<br />
70<br />
f B1ij (6.2)<br />
-- -<br />
BTj = BCC,U~ Bu; Ba2a3<br />
---<br />
BU,~, Ba,a, Ba:<br />
(6.3)
-<br />
In general, a porous medium is anisotropic with respect to the transformation STij i.e. ,<br />
the direction of the average velocity of flow (at average steady flow) at any point of the<br />
medium differs from the direction of the average driving force due to the existence of<br />
preferred channel orientations. Eventhough, since the matrix (6.3) is symmetric, it<br />
can be shown that there always exists a unique set of three mutually orthogonal directions,<br />
so-called principal - directions oJ the anisotropic medium, respective to which the<br />
transformation BTij can be presented in the form<br />
Any driving force which acts in the principal direction causes average flow in the<br />
same direction.<br />
There is only one ideal case of a medium for which each direction is a principal<br />
one, i.e., the average velocity of flow at a point is always coincident with the direction<br />
of the driving force whatever it should be. This case appears in media where the<br />
channel conductance B is independent of channel orientation and the distribution of<br />
the later in space is uniform, i.e.,<br />
where<br />
and<br />
1 for i =j<br />
O for i #.i.<br />
In the following discussion, a medium which satisfies (6.4) at any point wil be called<br />
isotropic.<br />
7. AVERAGED EQUATION OF MOTION<br />
The average of (4.21) yields<br />
In order to express averages of products through products of averages, the following<br />
assumptions wil be made
i.e., there is no correlation between the driving force and the local geometry of<br />
a passage.<br />
(b) IB(- dk - i,)¡ Y = o (7.3)<br />
(4 IJ(a$at) = o (7.4)<br />
With these assumptions and neglecting averages of three deviations, (7.1) becomes<br />
- 9<br />
~+B(-divl,)V/v~= -- -Bq,-- a?--- B - avi<br />
-<br />
v axj<br />
v ôt<br />
- 9 a?---<br />
For steady average flow (7.5) reduces to<br />
Denoting<br />
(7.6) can be rewritten as<br />
Vi + B(- div II) 5/v = - - - BTj,<br />
v axj<br />
-<br />
Bqj = kij/n<br />
B(- div - íl) = d<br />
-<br />
For an isotropic medium BTij is represented by (6.4) and (7.9) reduces to<br />
where<br />
- dV-<br />
8. AVERAGE SPECIFIC DISCHARGE<br />
(7.5)<br />
v. +-v.= --k- 9 aG (7.10)<br />
V vn ax,<br />
k = k,, = k,, = k33.<br />
The concept of specific discharge is related to the concept of REA (representative<br />
elementary area) defined in Sec. 3. Let (dAj)o denote an REA normal to the direction<br />
1 at a point P within the medium. If Qj is the total discharge through the<br />
specific discharge qj in the direction j is defined by<br />
qj(P) = Qj(P)/(dAj), (no summation on j) (8.1)<br />
Taking an REV with P as its centroid and as its cross-section, the average<br />
value of qj over the REV will be (Bear and Bachmat 1965):<br />
Insertion of (8.2) into (7.9) yields<br />
where are components of the specific discharge vector and 4 is its absolute value.<br />
72
9. AVERAGED TRANSPORT COEFFICIENTS AS AQUIFER CHARACTERISTICS<br />
In (8.3) the average specific discharge is shown to be governed by three medium<br />
characteristics kij, d and n. kij is the medium’s permeability which measures the<br />
ability of the medium to convey a fluid. ki:, are elements of a symmetric second order<br />
matrix, i.e.,<br />
k.. LI = k.. 11 (9.1)<br />
It follows that for a porous medium which is anisotropic and nonhomogeneous with<br />
respect to permeability, ki5 is represented by a set of six different numbers which<br />
may vary from point to point. This seems to be the usual case in aquifers consisting<br />
of fractured rocks. However, if one chooses a coordinate system which coincides<br />
with the principal directions of kif, the later can be characterized through three numbers<br />
only (kii, kzz, kd.<br />
In the ideal case of a medium which is isotropic<br />
1<br />
with respect to k6j (see Sec. 7)<br />
1 for i =j<br />
k.. 11 = ka,, ; bij =<br />
(9.2)<br />
O for i # j<br />
where<br />
k = k,, = k22 = k,,<br />
Such a presentation of permeability as a scalar, is often used in the hydrology of<br />
aquifers consisting of clastic porous material.<br />
The ratio kijln = mj represents the average directional conductance of the<br />
porous medium at a point.<br />
On the other hand, the averaged parameter d = B(- div 11) characterizes the<br />
average variation of the conductance due to the variations of the channel geometry.<br />
Other medium properties governing dispersion and diffusion phenomena in a porous<br />
medium are discussed in a recent work of Bear and Bachmat (1965) and are beyond<br />
the scope of this paper.<br />
Returning to equation (8.3) two extreme types of aquifers may be considered:<br />
(i) Aquifers, where the average flow satisfies the condition<br />
In this case (8.3) can be approximated by:<br />
which is Darcy’s law. As was evidenced by experience, this law is valid for most<br />
aquifers consisting of porous clastic material where the passages are the hollow<br />
spaces between graines.<br />
For an isotropic medium (9.4) becomes<br />
gk<br />
¿j = - (grad cpI<br />
Y<br />
73
Insertion of (9.6) into (9.3) yields<br />
In this case (8.3) can be approximated as follows<br />
(9.7)<br />
(9.9)<br />
which is the quadratic law of average specific discharge. This law is valid for flows<br />
through fractured rocks where the average interia forces can not be neglected.<br />
Repeating the same procedure as in the foregoing case yields the inequality<br />
10. CONCLUSIONS<br />
(9.10)<br />
(i) The vector of average specific discharge (components ;i) of a homogeneous<br />
incompressible liquid during average steady laminar flow through a stable porous<br />
medium is governed by the “mixed” type equation<br />
or in vector notation<br />
-( n:> v<br />
q 1+- =-?kgradq<br />
=<br />
(10.1)<br />
(10.2)<br />
(ii) The nondimensional quantity q(d(/iiv is a Reynolds number for mass flow<br />
through a porous medium. qld(/nv < 1 implies validity of Darcy’s law which is specific<br />
for most aquifers consisting of porous clastic material. ?ldl/nv p 1 implies validity<br />
of the quadratic law which is specific for aquifers consisting of fractured rocks.<br />
(i$ The inequalities of (ii) can be replaced by the inequalities<br />
- kldl < v2<br />
n 9 g ¡grad ‘PI<br />
Thus kldl/n is a combined medium parameter which can be used as a basis for<br />
classification of aquifers.<br />
(iv) The medium parameters k~j/t7 and Id/ in the neighborhood of a point can be<br />
found by means of pumping from a well at different steady dicharges and measuring<br />
the corresponding steady drawdowns in several observation wells located at different<br />
directions with respect to the pumping well. The method of establishing the parameters<br />
has to be based on equation (10.1).<br />
74
(v) For quantitative hydrology of groundwater in fractured rocks it is important<br />
to develop total head meters which should take into account the velocity head at<br />
a point.<br />
(vi) A further extension of the approach outlined in this paper to the phenomenon<br />
of dispersion of tracers in a porous medium can provide additional parameters for<br />
improved classification of aquifers.<br />
REFERENCES<br />
(1) BEAR, J., ZASLAVSKY, D., and IRMAY, S., 1963. Principles ofpercolation and seepage,<br />
manuscript under preparation for UNESCO, Haifa.<br />
(2) BEAR, J. and BACHMAT, Y., 1965. A unified approach to transport phenomena in<br />
porous media, Haifa, Israel, Technion - Israel Institute of Technology.<br />
(3) FELL ER,,^., 1961. An introduction to probability theory, Vol. 1, 2nd ed. N.Y.<br />
John Wiley and Sons Inc.<br />
W., 1961. Introduction to mechanics of continua, N.Y., Ginn and Co.<br />
L.D. and TIETJENS, O.G., 1957. Fundamentals of Hydro- and Aeromechanics,<br />
N. Y., Dover Pubi., p. 7-10.<br />
A.!., 1960. The physics of flow tlrrorrgli porous media, revised ed.<br />
Toronto, University of Toronto Press.<br />
(4) PRAGER,<br />
(5) PRANDTL,<br />
(6) SCHEIDEGGER,<br />
75
ABSTRACT<br />
EFFECT OF IMPERVIOUS BARRIERS<br />
OF DEEP-SEATED FRACTURES<br />
ON GROUND WATER FLOW<br />
Doctor Eng. Kamal F. SAAD(*)<br />
Desert Institute, Mataria, Cairo, U.A.R.<br />
Among the causes of deep seated fractures in permeable rock are the faults.These<br />
may be either fully preventing the ground water flow or partially opposing its passage.<br />
If a well is fully penetrating the main aquifer which is opposed partially by an<br />
impervious bed, the flow will thus be different from that if the aquifer is either infinit<br />
in extent or if it is fully opposed by the fault. The purpose of this work is to determine<br />
the hydraulic properties of the aquifer that is partially opposed by a barrier. The<br />
procedure is based upon the theory of the nonsteady radial flow and the use of the<br />
theory of images. The method of analysis adopted is that of the inflection point.<br />
It has been assumed that the displacement of the fault is known.<br />
RESUME<br />
Effel des barrières imperméables créés par les fractures profondes sur I‘éeouìement des<br />
eaux souterraines<br />
Les failles figurent parmi les causes des fractures profondes des roches perméables.<br />
Elles peuvent avoir pour effet d’empêcher complètement ou partiellement l’écoulement<br />
des eaux souterraines. L’écoulement de l’eau diffèrera selon que le puit pénètre dans<br />
une nappe aquifère principale partiellement limitée par une couche imperméable,<br />
ou dans une nappe qui n’est nullement limitée, ou dans une nappe complètement<br />
isolée par la faille. L’auteur se propose de déterminer les propriétés hydrauliques des<br />
nappes aquifères partiellement limitée par une barrière. La méthode employée se<br />
fonde sur la théorie de l’écoulement radial irrégulier et sur la théorie des images. La<br />
méthode d’analyse adoptée est celie du point d’inflexion. On a considéré comme<br />
connu le déplacement de la faille.<br />
SUMMARY<br />
A method of analysis is outlined for determining the hydraulic properties of an<br />
aquifer which is partially opposed by a barrier. This hydrologic situation can be<br />
represented in nature by a fractured aquifer of different opening sizes. The procedure<br />
is based on the nonsteady radiai flow using the theory of images.<br />
i. INTRODUCTION<br />
Among the causes of deep-seated fractures in permeable rock are the faults. These<br />
may be either fully preventing the ground water flow or partially opposing its passage.<br />
If a well is fully penetrating the main aquifer which is opposed partially by an<br />
impervious bed, the flow will thus be different from that if it is fully opposed by the<br />
fault or if the aquifer is infinite in extent.<br />
In nature, this hydrologic situation may occur as a result of a fault displacement<br />
which brings up or down a part of the impervious bed opposite to the water bearing<br />
(*) UNESCO Expert to the Republic of Mali, “Direction de l’Hydraulique,<br />
Bamako ”.<br />
76
formation. The case may also be a result of the earth stresses which form adjacent<br />
tabular water bodies of varying thicknesses.<br />
In both cases, the boundary conditions are similar apd the problem can be<br />
considered as tabular fractures of different thicknesses or a partial barrier opposing<br />
the aquifer.<br />
Analysis of the data of the pumping test, may give erroneous results if the aquifer<br />
is considered homogeneous in areal extent, while the pumped well is near to the<br />
partial barrier, or, if the difference in the fractures thickness is considerable.<br />
The purpose of this work is to determine the hydraulic properties, namely, the<br />
transmissivity T and the storativity S, of two adjacent water bearing fractures of<br />
different thicknesses. It is assumed that these thicknesses are known, or in the cases<br />
of the fault, the displacement should be known.<br />
The procedure is based on the theory of the nonsteady radial flow toward a well<br />
of constant discharge using the theory of images.<br />
2. THEORY<br />
The nonsteady flow toward B well located near a fault which partially opposes the<br />
ground water flow or fully penetrating an opening fracture adjacent to another of<br />
different thickness, figure I, can be expressed in the following form, using the theory<br />
of images, Ferris (1949);<br />
47cT<br />
Where T = Kb and TO = Kbo,<br />
bo fault displacement,<br />
b- bo difference in fracture thickness.<br />
If r' is very large or if bo =O, equation (I) will reduce to the well function given<br />
by Theis (1935).<br />
Putting B = r'/r and A = b/bo, equation (1) will be:<br />
s=- [W(u) + n'(ut)]<br />
47cT<br />
II II<br />
II /<br />
Il II b<br />
Ø<br />
. --- i/<br />
i<br />
Il<br />
PUMPED<br />
ll<br />
Il<br />
Il<br />
II<br />
ll<br />
FRACTURED ROCK II II .<br />
II II ' // / / / ,//<br />
/ //A// / / // // / / / /<br />
IMPERVIOUS BED<br />
Fig. I<br />
I<br />
77
Where<br />
Differentiating s in equation (2) with respect to In t:<br />
The theoretical curve of the slopes VI versus the time r on semilogarithmic paper,<br />
has an inflection point. The inflection point can be found as follows:<br />
i) Differentiating m in equation (3) with respect to In t<br />
ii) Differentiating m' in equation (4) with respect to In r<br />
iii) For the inflection point, equation (5) is equated to zero and solving for iii<br />
1 + B ~ e-ui(BZA-U A<br />
Ili = 1 + ( ~ 2 ~ ,-ui(BZA- 1 2 1)<br />
For solving equation (6) for different values of B-A, it may be put in the following<br />
form:<br />
1-ui<br />
e-ui(B2A-l) = _-<br />
(B'A)' ui - B'A<br />
(7)<br />
3. SOLUTION OF THE FUNCTION<br />
The values of u$ appearing in equation (6) or (7) can be determined by knowing<br />
B2A and the use of figure 2. Figure 2 has been constructed by choosing different<br />
values of B2A and solving equation (7) by the method of try and error. However,<br />
figure 2 can be used with enough accuracy for values of Be A ranging between 10 and<br />
IWû. Accurate values of ut for any value of B2A can be found by tabulating<br />
equation (6) or (7) using an electronic computer.<br />
4. APPLICATION<br />
For applying the above theory for determining the hydraulic properties T and S<br />
from the data of the pumping test, the procedure is as follows:<br />
i) Construct the timedrawdown curve on semi-log paper, with the time being on<br />
the log scale, i.e. (s-log t curve);<br />
78<br />
(6)
ii) Choose some points on the curve and measure the slope (m) at each point per<br />
cycle. The selected points should be enough to construct an image of the s-lOg<br />
t curve;<br />
iii) Draw the measured slopes (m, versus each corresponding time on semi-log Papery<br />
with the time on the log scale, i.e. (m-log 2);<br />
2 3 1 5 6 7 8 9<br />
2 3 1 5 6 7 8<br />
11 0.w u,<br />
Fig. 2<br />
iv) Since the inflection point usually lies on the straight portion of the rn-log i curve,<br />
then the slope of that straight portion can be measured (m’t);<br />
v) Determine the value of ui from known value of B2A and figure 2;<br />
vi) Using equation (4) with known values of m’i and ui, determine the value of T;<br />
vii) From equation (3) and known values of B2A, IQ and T, determine the value of mi;<br />
viii) From the m-log t curve and known value of mc determine the value of ti;<br />
ix) Knowing r, T, ti and ni, calculate the value of S, using the relationship<br />
u. -<br />
- r 2 S/4Tti.<br />
5. APPENDIX - NOTATION<br />
A<br />
B<br />
b, bo<br />
rn<br />
m’<br />
rn’i<br />
P<br />
r<br />
r’<br />
relation b/bo,<br />
relation r’/r,<br />
thickness of aquifer or tabular fracture,<br />
slope at any point on the drawdown-time curve,<br />
slope at any point on the drawdown slope-time curve,<br />
slope at the inflection point on the drawdown slope-time curve,<br />
constant weil discharge,<br />
distance between the pumped well and observation well,<br />
distance between the image well and observation well,<br />
79
S storage coefficient or storativity,<br />
s drawdown of piezometric surface at any time and at any point in the aquifer,<br />
T transmissivity of the aquifer or tabular fractures,<br />
ti time at the inflection point on the drawdown slope-time curve,<br />
u relation r2Sj4 Tt,<br />
ut the value of u at the inflection point,<br />
W(u) ~ ~ e - dx ~ / = x well function of u, tabulated by Wenzel (1942).
ANALYSIS OF PUMPING TEST IN FRACTURED ROCKS<br />
ABSTRACT<br />
Doctor Eng. Nabil ROFAIL<br />
Desert Institute, Cairo, UAR<br />
The formation constants of the feasured rock are determined, namely the<br />
transmissivity (T), the piezometric diffusivity (x) and a new specific coefficient<br />
characterizing the size of feacures (7). The procedure is based upon the radial flow<br />
equation derived by Kotchina. It has been assumed that the feasured rock consists<br />
of separated blocks, therefore the flow can be considered through a medium of a<br />
double porosity, that is, porosity of blocks and that of feasures. The formation<br />
constants have been determined by using the type curve method. As the function of<br />
the drawdown distribution was not previously available in tabular form, enough<br />
tabulation for small values of time is presented.<br />
RESUME<br />
Analyse des tests de pompuge efectués dans les roches fissurées<br />
L’auteur détermine les constantes de formation des roches fissurées, c’est-à-dire :<br />
la transmissibilité (T), la diffusion piézométrique (x) et un nouveau coefficient spécifique<br />
qui caractérise les fissures (11). La méthode employée est fondée sur l’équation de<br />
l’écoulement radial établie par-Kotchina. On admet que les roches fissurées sont<br />
constituées de blocs séparés ; par conséquent, on peut considérer que l’écoulement<br />
s’effectue dans un milieu à double porosité : d’une part, la porosité des blocs<br />
eux-mêmes, et d’autre part celle des fissures. On détermine les constantes de<br />
formation par la méthode des courbes types. Comme le tableau des courbes de rebassement<br />
de la surface piézométrique n’avait pas encore été dressé, l’auteur en donne<br />
suffisamment de tableaux pour de faibles valeurs de temps.<br />
1. INTRODUCTION<br />
The flow through feasured rocks is different from that through porous<br />
medium. The current practice is to consider that the feasured pattern is regular<br />
and homogenous. In this work, it has been assumed that the feasured rock consists<br />
of separated blocks which are considered as a porous medium. Therefore two flow<br />
systems within the rock may exist; i.e. flow through the feasures and flow through<br />
the blocks themselves where each flow has its specific pressure.<br />
The differential equation that governs the nonsteady flow though feasured rocks<br />
can be written in the following form (I);<br />
The new coefficient x appearing in equation (I) indicates the character of the<br />
feasures, and is known as the piezometric diffussivity of feasures in the rock. The<br />
coefficient is proportional to the coefficient of permeability of the system of feasures<br />
and can be put in the following form;<br />
81
Also the new specific coefficient 11 in equation (1) Characterizing the size of feasures<br />
and its value ranges from few cm2 to i0 cm2. It cap be written in this form;<br />
As the coefficient q tends to zero, i.e. the size of feasures is minimized, equation (i)<br />
takes the usual form for the pressure in porous medium.<br />
The flow through feasured rocks can be considered as a flow through a medium<br />
of double porosity; the porosity of feasures and that of the blocks themselves.<br />
2. THE RADIAL FLOW TOWARDS A WELL<br />
When pumping at a constant rate (Qcì from a well fully penetrating feasured rock<br />
aquifer, the differential equation can be written in this form (considering that the<br />
intensity of infiltration W = O),<br />
where P the pressure of Ruid in the feasures.<br />
The boundary value problem<br />
P1(r, O) = P (5)<br />
The solution of this equation as derived by Kotchina(1) can be put in the<br />
following form:<br />
where<br />
=[ome[í<br />
F(O),O -exp(*t)~v] 1 -i- v2q (74<br />
i( r<br />
O=-t and i=--<br />
il &¡<br />
The values of F(8, 5) for 8 1 1 were tabulated by the use of the electronic digital<br />
computer at the computing centre of the Akademy of Science of USSR.<br />
For 8 1
Consequently by using equation (S), equation (7a) will reduce to;<br />
Solving each integral appearing in equation (9) by using the integral tables;<br />
Gradshtine and Rigi~(~);<br />
and the second integral<br />
Fig. i<br />
83
2 3<br />
U<br />
Fig. 2<br />
Fig. 3<br />
1.6 2 3 4<br />
5<br />
-3<br />
e
and the third integral<br />
JO<br />
JO (vr)<br />
3!v (íyr'q)3<br />
x3t3<br />
av =-<br />
6q3<br />
5x3t3r - - 724%<br />
Equation (9) can be put in the following form;<br />
F(8, t) = -<br />
- KO (5) + - x2t2r K+l (5)<br />
x t KO (L)<br />
f<br />
rl<br />
(A)<br />
Jy 2v2 8 Y*<br />
x3t3 5x3t3r x3t3rZ<br />
6q3 - -- 72qS ""(6%) -k KO($$ (13)<br />
+-KO<br />
Using equation (7b) will reduce to the following form;<br />
~+ rg 8 - u)<br />
72 K.,( 10 the flow<br />
though feasured rocks can be considered the same as that through porous medium<br />
Table 1 has been illustrated graphically as in figures 1-4 that is:<br />
I. Curves 1, 2 and 3 are plotted between F(8, 6) and 6, i/E and log [ respectively<br />
for different values of 8 which give the shape of drawdown against the values, their<br />
reverses and logs of the different values of time.<br />
II. Curve 4 between F(8, 6) and 8 for different values of 6d8 which gives the shape<br />
of drawdown against the time at different distances from the pumped well.<br />
For solving this equation<br />
s=- Q xt x2t2 ++-)KO($+<br />
x3t3 x3t3r2<br />
2~7'[(F-q 6q lMv4<br />
x2t2r 5x3t3r)] K+1 (;?> -7<br />
(16)<br />
Three unknowns exist in this equation;<br />
85
1<br />
2<br />
-7<br />
am<br />
o; r<br />
rc<br />
I<br />
J<br />
TABLE 1<br />
1<br />
F(0, E)<br />
1 0,2 0,3 0,4 0,5 1,0 1,5 2,O 3,O<br />
0.05 0,302 0,269 0,220 0,198 0,157 0,137 0,123 0,115 0,080 0,062 0,049 0,033<br />
-<br />
4,o<br />
-<br />
0,024<br />
0.1 0,559 0,493 0,412 0,341; 0,277 0,237 0,209 0,189 0,120 0,092 0,070 0,043 0,028<br />
0.2 1,005 0,880 0,717 0,590 0,464 0,390 0,343 0,299 0,189 0,128 0,091 0,049 0,028<br />
0.3 1,389 1,219 0,973 0,794 0,616 0,509 0,440 0,384 0,228 0,148 0,103 0,049, 0,025<br />
0.5 2,027 1,781 1,408 1,119 0,845 0,690 0,582 0,503 0,278 0,166 0,104 0,044 0,017<br />
1.0 3,203 2,741 2,131 1,672 1,222 0,966 0,792 0,663 0,317 0,169 0,094 0,032 0,011<br />
-<br />
86<br />
Fig. 4
3. The methods of analysis of the pumping test data.<br />
The procedure for using above solution can be outlined as follows:<br />
I. If the data are collected from piezometers at different distances from the<br />
pumped well and at the same ray from the well:<br />
a) Construct the drawdown-distance curve at any specific time of the same size as<br />
for the curve i;<br />
6) The observed data curve is superimposed on the curve 1, keeping the coordinate<br />
axis of the two curves parallel, and adjusted until a position is found by trial when<br />
the most of the plotted points of the observed data full on segment on one Of<br />
the curves;<br />
r) An arbitary point is selected on the coincident segment and the coordinates of the<br />
matching point are recorded;<br />
d) By knowing the values of 0, 6, F(0, E), thus determined T, 1/17 and x/t/<br />
1 x<br />
T , - and -<br />
- 1 =- pt<br />
x 1'2<br />
-*<br />
- x --<br />
? t<br />
11. If the data are collected from one piezometer, therefore construct drawdown-<br />
time curve and use the same steps as in case I but with the type curve 4.<br />
The equation of drawdown for a radial flow in feasured rocks is used, in conjunction<br />
with data collected during a pumping test, to outline graphical methods for determining<br />
the parameters of such aquifers. Aside from using the type curves, the method of<br />
solution is more dependable.<br />
Lisr OF SYMBOLS<br />
x piezometric diffusivity of feasures in the rocks,<br />
Ki coefficient of permeability for the system of feasures,<br />
b thickness of the aquifer,<br />
T transmissivity of the aquifer = k1. b,<br />
,u viscosity of flowing water,<br />
B coefficient of compressibility of water,<br />
BOZ coefficient characterizing the size of feasures,<br />
ML porosity of feasured rock which indicates the relation between the volume of<br />
feasures to the whole volume of the rock,<br />
?no porosity of separate block which indicates the relation between the volume of<br />
pores to the volume of the block,<br />
Pi the mean pressure in the feasures,<br />
P2 the mean pressures in the pores,<br />
W intensity of infiltration,<br />
r radial distance from the centre of the pumping well,<br />
87
C<br />
2<br />
Qc<br />
S<br />
e<br />
E<br />
JO<br />
radius of the pumping well,<br />
time since pumping started,<br />
discharge of the well,<br />
the drawdown in the pumping well,<br />
XIS . t.<br />
rl+t,<br />
zero order of Bessel function of the first kind,<br />
K,Kl zero and first order modified of Bessel function of the second kind.<br />
REFERENCES<br />
(l) BARENPLATT, G.E., GILTOV, E.P. and KOTCHINA, E.N., 1960, Flow through<br />
feasured rocks. P.M.M., Moscow, Tome =IV, part 5. (in Russian).<br />
(2) ROFAIL, N.H., 1963, The Hydrological Conditions, Resources and Reserves of the<br />
Ground Wter in the Nile Delta and in the Adjacent Area El-Tahrir. Thesis deposited<br />
at Moscow State University. (in Russian).<br />
(3) GRADSHTINE, E.S.. and RIGIC, E.M., 1962, Tables of Integral Transforms. F.M.,<br />
Moscow. (in Russian).<br />
(4) POLUBARINOVA-KOTCHINA, P.I., 1952, Theory of Flow of Ground Water. Moscow.<br />
(in Russian).<br />
88
1.2<br />
Caractéristiques hydrologiques et hydrauliques de<br />
l’écoulement dans le Karst - Bilan hydrologique -<br />
Caractéristiques géologiques<br />
Characteristics Hydraulic and Hydrologic of the Flow in<br />
thekKarst - Hydrological Balance - Geological characteristics
SUMMARY<br />
WATER BALANCE LNVESTJGATIONS IN THE<br />
KARSTIC REGIONS OF HUNGARY<br />
Dr. H. KESSLER<br />
Research institute for Water Resources Development,<br />
Budapest, Hungary<br />
The majority of raw material sites as well as of related industrial establishments,<br />
settlements and towns in Hungary is located in karstic regions or in their immediate<br />
vicinify, Their water supply, for the most part, is assured by karstic-water exploited<br />
by dnllings or shafts. In the interest of safe operation of the waterworks, the preservation<br />
of the ground-water balance is of primary importance. That is the cause why<br />
the particular object of karstic hydrological investigations in Hungary is concerned<br />
with the problem of the natural recharge of karstic water, the dynamic karstic water<br />
supply.<br />
In determining the natural recharge of karstic water it is of primary importance to<br />
know not only the quantity of annual precipitation but also its distribution, since this<br />
delenius the ercentage of annual infiltration. The annual infiltration percentage may<br />
vary within tie same area and with the same annual precipitation quantity between 7<br />
and 70 per cent; it is this a function of the annual distribution of the precipitation. The<br />
specific karstic water-recharge amounts on a multi-annual average, depend on the<br />
precipitation conditions characteristic of the karstic regions in the Hungarian Middle<br />
Mountain and range from 7-11 lit/sec.sq.km.<br />
Giuen the knowledge of the regularity laws, it is possible to compute the size of the<br />
catchment area on the basis of the annual yields of springs and, in general, the dynamic<br />
karstic water suppZy.<br />
In regions where there are no artificial water intakes a large-scale karstic water<br />
observation network has been developed to measure and record systematically waterlevel<br />
variations caused by the accumulation and depletion of the dynamic water supply.<br />
It became obvious from the data that the significant increase of the karstic water level,<br />
and, in consequence, the accumulation of the dynamic supply takes place always in the<br />
first four months of the year, after snow-melt and before the start of the vigorous vegetation<br />
growth. Subsequent precipitation has hardly any significance from the water<br />
balance point of view. The latter was verified by the investigations conducted for several<br />
years in caves where the variations of dripping intensity as well as its relationship with<br />
precipitation have been observed.<br />
To observe water levels, observation drillings have also been located in areas subject<br />
to artificial interventions, primarily mining, to explore the formation and extent of<br />
the depression caused in the karstic water level. The effect of mine-water production<br />
extends to distances of more than 20 km. Knowing the regularity law of water level<br />
decline, it can be estimated which springs wil run dry and at which water supply works<br />
disturbances can be expected.<br />
Flow velocities (50-150 m/hour) observed in the course of experiments to demonstrate<br />
the relationship between swallers and karstic springs, are in agreement with the<br />
values published in the international literature. Expriments to determine infiltration<br />
velocities were also carried out. An infiltration velocity of 2.4-4.7 m/hour has been measured<br />
in the Upper Eocene limestone, and one of 6.7-9. l m/hour in the Middle Triassic<br />
limestone.<br />
RESUME<br />
Recherches sur l’équilibre byùrique des régions karstiqires de Hongrie<br />
En Hongrie, la plupart des gisements de matières premières et des établissements<br />
industriels et des agglomérations ou villes qui les exploitent sont situés dans des régions<br />
karstiques ou dans leur voisinage immédiat. L’eau nécessaire à ces exploitations est<br />
fournie principalement par des nappes karstiques, atteintes par des puits ou des forages.<br />
Pour assurer le bon fonctionnement des usines de distribution d’eau, le maintien du<br />
bilan hydrique des nappes souterraines revêt donc une importance capitale. C’est pour-<br />
quoi l’objectif principal des études relatives à l’hydrologie karstique est constitué dans<br />
ce pays par le problème de l’alimentation naturelle des réservoirs karstiques, c’est-a-<br />
dire par le probibme de l’apport dynamique d’eau dans les karst.<br />
91
Pour évaluer la quantité d’eau nécessaire à l’alimentation naturelle des aquifères<br />
karstiques, il est indispensab1e.de connaître non seulement le volume des précipitations<br />
annuelles, mais aussi la répartition de celles-ci, puisque le pourcentage des infiltrations<br />
annuelles en dépend. Ce pourcentage peut varier pour une même région et pour un<br />
même volume annuel de précipitations de 7 à 70%; il est donc fonction de la réparti-<br />
tion annuelle des pluies. D’après une moyenne calculée sur plusieurs années, la quantité<br />
d’eau qui va alimenter les aquifères karstiques, quantité qui dépend du régime des pré-<br />
cipitations tombant sur les régions karstiques du Massif central hongrois, varie de 7<br />
à 11 litres par seconde par kilomètre carré.<br />
Los lois de régularité étant connues, il est possible de calculer l’étendue de l’aire<br />
de captage sur la base du débit annuel des sources et, de façon générale, d’évaluer l’ap-<br />
port dynamique d’eau dans les karsts.<br />
Dans les régions OU il n’y a pas de recharge artificielle, tout un réseau de stations<br />
d’étude des eaux karstiques a été installé pour mesurer et enregistrer systématiquement<br />
les variations du niveau de la nappe causées par l’accélération ou le ralentissement de<br />
l’approvisionnement dynamique en eau. Les observations ont mis en évidence qu’une<br />
montée significative du niveau de la nappe karstique et, par conséquent, qu’une accé-<br />
lération de l’apport dynamique en eau a toujours lieu dans les quatre premiers mois de<br />
l’année, après la fonte des neiges et avant la reprise vigoureuse de la poussée végétale.<br />
Les précipitations qui suivent n’ont à peu près aucune influence du point de vue de<br />
l’équilibre hydrique. Cette observation a été vérifiée par des recherches poursuivies<br />
pendant plusieurs années dans des cavernes où les variations de l’intensité du suinte-<br />
ment et son rapport avec les précipitations ont été étudiés.<br />
Pour l’étude de niveau de la nappe, des forages d’observation ont été effectués dans<br />
les zones exposées à des interventions humaines, notamment par le creusement de<br />
mines, en vue de déterminer la formation et l’étendue de la dépression causée dans le<br />
niveau de la nappe karstique. Les effets de la production d’eau minière se font sentir à<br />
des distances supérieures à 20 km. Connaissant la loi de régularité de l’abaissement du<br />
niveau de la nappe, on peut prévoir quelles sources seront taries et quelles installations<br />
de distribution d’eau éprouveront des difficultés.<br />
La vitesse d’écoulement (SO à 150 m/heure) observée au cours d’expériences faites<br />
pour montrer le rapport existant entre une perte et une résurgence, concorde avec les<br />
valeurs données dans les ouvrages étrangers spécialisés. Des exprériences tendant à<br />
déterminer les vitesses d’infiltration ont aussi été faites. On a mesuré une vitesse d’in-<br />
filtration de 2,4 m à 4,7 m par heure dans un calcaire de 1’Eocène supérieur et une<br />
vitesse de 6,7 m à 9,l m par heure dans un calcaire du milieu du trias.<br />
In Hungary, the greatest part of the raw material occurrences, as well as theadjoin-<br />
ing industrial establishments and housing estates, settlements and towns are situated<br />
in karstic regions or in their vicinity. Consequently, their water supply had to be secured<br />
-first of all-from karstic waters, by using natural springs, or by artificial develop-<br />
ment, i.e. driving boreholes or sinking vertical shafts. In the interest of water manage-<br />
ment (water economy) it is ofvital importance to become acquainted with the conditions<br />
of the subterranean water bahnce, and with the possibilities of determining the<br />
so-called dynamical water resources. That is the reason why in Hungary special concern<br />
is given to karst-hydrological research work.<br />
In this study published on the occasion of the Toronto Meeting of the I. A. S. H. in<br />
1957 (I) the author discussed in detail the method applied for the estimation of dynam-<br />
ical sub-surface water resources in karstic regions, as well as for the determination<br />
of the rate of percolation in the karstland. Consequently he intends to treat these pro-<br />
blems here only in broad outline.<br />
The essence of this method is based on the recognition that considering the measure-<br />
ments made for decades it appeared that infiltration varied in the same area between<br />
7 and 70 per cent with the same annual precipitation.<br />
Consequently, it has been established that the percentage of infiltration of precipi-<br />
tation, viz. the karstic water recharge, does not depend mainly on the annual precipi-<br />
tation but on the annual distribution of precipitation and on the water consumption<br />
of the plants. Accordingly, the amount of precipitation falling in the first four months<br />
of the year, viz. preceding the development of the vegetation, and prior to the large<br />
losses due to evaporation is determinative. Rainfalls at the end of the year, viz. autumn<br />
92
and winter precipitation, recharges the channelways and narrow capillaries, thus, in a<br />
certain way preparing the conditions for the development of infiltration in the first<br />
of part the next year.<br />
The relation of the precipitation of the first four months to that of the total year,<br />
expressed in percentage, is termed the determinative precipitation rate. This determina-<br />
tive precipitation rate, however, must still be corrected by a contant value (“k”) depen-<br />
ding on the conditions of precipitation in the last four months of the previous year. The<br />
constant “k” can be obtained by determining the rate of the difference between the<br />
precipitation of the last four months (September-December) of the preceding year and<br />
the long term average precipitation of the same four months. The value obtained is ter-<br />
med the corrective precipitation rate (x). The relation of the corrective precipitation<br />
rate to the correcting constant is shown by the following imperical table. As a matter<br />
of course, it must be also be considered whether the precipitation measured is more or<br />
less than the perennial average amount, according to which the constant value wil be<br />
taken into account with a positive or negative sign.<br />
Corrective precipitation<br />
rate (x) in per cent<br />
0-5<br />
6-15<br />
16-25<br />
26-35<br />
36-45<br />
46-55<br />
56-60<br />
61 -65<br />
66 - 70<br />
> 70<br />
Values of the correcting<br />
constant (k)<br />
The percolation rates belong into the determinative precipitation rates corrected by<br />
the correcting constant can be read off from curve shown in figure 1, plotted on the<br />
base of empirical data obtained by a series of measurements made over a period of<br />
nearly thirty years.<br />
The curve has been checked from year to year; its exactness has been found to com-<br />
ply with practical requirements.<br />
The long term averages percolating (infiltration) rates of each month, based upon<br />
the data obtained and published in the above-mentioned study have also been examined.<br />
On the base of data recently available these values have been subjected to mod~cations<br />
of smaller extent. The values modified in this way are as follows:<br />
O<br />
1<br />
2<br />
3<br />
4<br />
5<br />
7<br />
10<br />
13<br />
15<br />
January 43.4% July 20.7%<br />
February 77.5% August 17.6%<br />
March 113.0% September 14.6%<br />
April 60.0% October 12.8%<br />
May 44.6% November 22.5%<br />
June 33.9% December 49.7%<br />
It is to be noted that the value for March exceeds 100 per cent (presenting a seeming<br />
contradiction) due to the melting of the snow which constitutes an accumulated precip-<br />
itation. (See fig. 2).<br />
93
It must be stressed that the above statements-as a matter of course-are valid<br />
only for the Hungarian mountains of medium height ranging in elevation from cca<br />
500 to 800 metres above sea level. D.J. Burdon dealing with the determination of the<br />
karstic water resources of Greece checked our computation method according to which<br />
P.C. 70<br />
60<br />
a 50<br />
-ic<br />
C<br />
2 40<br />
d<br />
JO<br />
c<br />
.o<br />
.=<br />
0 10<br />
$ f0<br />
O ff 10 20 30 40 50 6Op.C<br />
Determinative prec@itation rafe<br />
Fig. 1 - Curve representing the relationship between percolation rate and determi-<br />
native precipitation rate.<br />
94<br />
O<br />
Fig. 2 - The average monthly percolation percentage in a karstic region.
50.7 per cent of the precipitation falling on the area percolated into the ground<br />
and returned in the yield of the springs, on an area of cca 100 sq. km extension where<br />
annual data on rainfall and spring yields were available on the bases of measurements<br />
made over several years. The measurement carried out actually has shown that 51.6<br />
per cent of precipitation percolated into the ground. According to D. J. Burdon: “The<br />
results are in surprisingly good harmony ”. (3)<br />
The fact that the volume of the dynamical karstic water resources does not depend<br />
on the annual precipitation, but on the monthly distribution of the precipitation,<br />
explains the seeming contradictions presenting themselves when the annual spring<br />
yields are compared with the annual precipitation. If the values obtained in this way<br />
were plotted in the form of a graph-the curve representing the precipitation was parallel<br />
to the curve of spring yields in the rarest cases. Approximately parallel curves wil<br />
be obtained only in those cases when the percolation rate computed by means of the<br />
suggested method is compared with the yields of karstic springs.<br />
In this connexion attention is drawn to another valuable study published also by<br />
D. J. Burdon (4) viz. to a seeming contradiction in this study, where the author had not<br />
yet considered the percolation rates of each month. In this study the author publishes<br />
the monthly yields of the Aghia Eleousa Spring (Greece) on a graph in which the monthly<br />
precipitation curves are also plotted. Between the precipitation peak and the peak<br />
of the spring yields a difference of cca. four months can be observed, from which the<br />
conclusion has been drawn by the author that this is the period of time necessary for<br />
the water to find its way under ground from the drainage area to the spring. If, however,<br />
instead of the precipitation that feil on the area the precipitation percolated into the<br />
ground is plotted on the bass of considering the percolation rates of each month, then<br />
the curve obtained wil be in a better harmony with that representing the spring yields<br />
and the peaks of both curves wil be also much closer to one another, a fact supporting<br />
the relationships! In figure 3, the spring yields and precipitation rates involved in the<br />
study are plotted and in addition to these the curve representing the rate of theprecipitation<br />
percolated into the ground is drawn (by a dotted line).<br />
Fig. 3 - Example for the postponement of the quantities of precipitation falling on the<br />
ground and percolated into the ground, in connexion with the yield of Aghia Ele-<br />
ousa Spring.<br />
F:<br />
F<br />
95
We notice also that as results of the estimations (checked by measurements) of the<br />
karstic water resources in Hungary we obtained for the natural replacement of supplies<br />
(replenishment) values ranging from 6.0 to 11.0 Iitreslsec. per square kilometre (as a<br />
long-term annual average).<br />
This value also includes the replenishment of deep karstic supplies from the surface.<br />
Attempts have been made to determine the static water resources stored in deep<br />
karstic strata. The greatest difficulties encountered here were offered by the determi-<br />
nation of the voids volume, the execution of which seemed to be impossible from a prac-<br />
tical point of view in the exceptionally inhomogeneous limestone. However, the porosity<br />
(percentage of voids) of the dolomite of capillary structure was determined by means<br />
of the cone shaped draw-downs caused by artificial development (tapping) of the water<br />
supplies, on the one hand, and with the aid of the rise of karstic water levels subsequent<br />
to rainfall (precipitation). In this respect a void ratio ranging from 1 to 7 per cent was<br />
established depending on the depth and the tectonical conditions.<br />
Possibilities for the forecasting of the natural replacement (replenishmerit) of karstic<br />
water resources.<br />
On the base of investigations carried out in connexion with the natural replacement<br />
of karstic water supplies and discussed briefly in the foregoing, it appeared that the<br />
recharge in karstic area (consequently the yield of karstic springs) depends mainly on<br />
the precipitation of the first four months of the year, which falls prior to surface vege-<br />
tation and nearly all of which percolates into the karstic area and into the channelways<br />
of the karstic springs. Rainfalls of the following period add only slightly to the yield<br />
of karstic springs. However, as we have noticed in the foregoing, the autumn precipi-<br />
tation is also of considerable importance since it prepares in a certain way the conditions<br />
for the development of infiltration in the first part of the next year.<br />
All this offers an adequate possibility for the forecasting as early as Aprii, of the<br />
extent of natural replacement (replenishment) of karstic water resources to be expected<br />
in the course of the coming year. For this procedure a routine method has been devel-<br />
oped on the base of which in the first days of May of each year important prognostics<br />
of great significance from the viewpoint of the menagement of water works sited on<br />
karstic springs or on artificial karstic water developments can be given.<br />
The very essence of this procedure is that first of all the probable annual preci-<br />
pitation wil be computed by adding the average amount of precipitation of the other<br />
months of the year to the precipitation of the first four months (already known).<br />
Subsequent to this, it wil be determined what percentage of the assumed annual<br />
quantity of precipitation the quantity of precipitation of the first four months con-<br />
stitates. This value wil be corrected in the above described way by the corrective<br />
value, depending on the precipitation conditions of the last four months of the pre-<br />
vios year, following which the relevant percolation rate belonging to this value wil<br />
be read off from the empirical curve; by multiplying it whith the assumed annual<br />
quantity of precipitation the percolated annual precipitation will be obtained. If we<br />
compare this value with the annual average value-it can be established by what per-<br />
centage percolated precipitation can be expected to be above or below the perennial<br />
average in the year being examined.<br />
An uncertainty encountered in this method is caused by the lack of knowledge regar-<br />
ding the quantity of precipitaQon be expected from May to the end of Decemb-r of the<br />
year being examined, due to which the perennial average value wil be applied. In view<br />
of the fact, however, that in these months the rate of percolation (infiltration) related<br />
to the year being examined is relatively low, the error involved wil be insignificant,<br />
which gives results satisfying practical requirements, as experience has already shown it.<br />
96
The Hungarian Research Institute for Water Resourses Development has issued<br />
such tentative forecasts since 1950. Later, from 1960 onwards, regular forecasts have<br />
been published. Regarding a karstic area (“Mecsek”-Mountains) the precipitation<br />
data and the spring yields which have been duly recorded through the last decades as<br />
part of experiment, the natural replacement of karstic water resources had been determ-<br />
ined on the base of the known precipitation data of the first four months of each year.<br />
Then the values obtained in this way were checked on the base of the known spring<br />
yields. These “forecasts” nave been computed for the last 29 years and the following<br />
errors were fonud:<br />
in 15 cases the error varied from O to 10 per cent<br />
in 6 cases the error varied from 11 to 20 per cent<br />
in 3 cases the error varied from 21 to 30 per cent<br />
in 3 cases the error varied from 31 to 40 per cent<br />
in 2 cases the error was in excess of 40 per cent<br />
Accordingly in 52 per cent of the cases the error of forecasting was less than 10 per<br />
cent and only in 7 per cent of the cases errors not complying with practical requirements<br />
were obtained. It is expected, however, that the rate of error can be further decreased<br />
in the future. Subsequent developments in estimating the period from May to Decem-<br />
ber the values forecast by the meteorological institutes on the base of periodicity<br />
research or of other progressive methods wil be considered instead of the long term<br />
average precipitation.<br />
A comparison of the forecasts computed for the above-mentioned years with the<br />
actual values is shown in figure 4, illustrating clearly the favourable relationships. Sig-<br />
nificant deviations are revealed only in the years 1940, 1955 and 1960. Regarding the<br />
years 1944 and 1956 no dependable series of measurements are available, consequently<br />
these years have been omitted.<br />
It goes without saying that checking can be carried out with the necessary exactitude<br />
only in areas which can be adequately confined from a geological point of view and<br />
where very precise and regular measurements are made of the quantity of precipitation<br />
and the yield of the springs. It is a well known fact that areas of this kind are very low<br />
in number, but the significant practical interests associated with forecasting require that<br />
on the base of an international collaboration the highest possible number of experi-<br />
mental areas of this nature be developed in order to be able to check and improve fur-<br />
ther the method of forecasting.<br />
INVESTIGATIONS IN CONNEXION WITH THE FLUCTUATIONS IN KARSTIC WATER LEVEL AND<br />
THE EFFECTS OF ARTIFICAL DEVELOPMENT<br />
For the purpose of observing and acquiring knowledge regarding the laws of fluc-<br />
tuations in the karstic water level owing to natural and artificial effect viz. influences,<br />
numerous water level observation boreholes were driven down in the karstic regions of<br />
the country, the greatest part of which reached the deep karst.<br />
One set of boreholes was sunk in areas where the influence of artificial karstic water<br />
production could not have been felt, where the variations in karstic water level were<br />
due only to natural influences (as precipitation). An area of this type is the karstic region<br />
built up of dolomite of the upper Triassic period situated north of lake Balaton. The<br />
water level measurements effected regularly since 1953 resulted in the conclusion-other-<br />
wise easy to understand on the bases of methods discussed in the previous chapter-<br />
that a considerable rise in the water table takes place almost always in March and April<br />
when the percolation (infiltration) rate is the highest and the water consuming effect<br />
of the surface vegetation is not significant. Subsequent to this period, in the course of<br />
97
Fig. 4 -The forecast precipitation (dotted line) and the precipitation actually infil-<br />
trated into the ground (continuous line) in the Mountains Mecsek.<br />
the year, the karstic water level gradually decreasing independently of the precipi-<br />
tation, until the beginning of the next year when a new rise can be experienced.<br />
The greatest rate of variation in the karstic water level observed so far reached<br />
eight metres within one year in this area subjected only to natural influences.<br />
98
The greatest part of the karstic water observation boreholes were sunk-as a matter<br />
of course-in karstic areas where the water level has been affected by artificial influenas<br />
-first of all-by water production associated with mining.<br />
These boreholes have clearly shown the depression caused by water production of<br />
mines in the karstic water table and also explained the phenomena that abundant karstic<br />
springs situated at a great distance from mining districts dried up. The data obtained<br />
from the boreholes sunk at Tatabánya are especially instructive, since it could be poin-<br />
ted out that even as far as 14 kms from the centre of this mining district the influence<br />
of mining water production was clearly observed.<br />
Fig.5 -Variations in karstic water !eve1 influenced by nearby mining activities (Tata,<br />
Obarok) and on areas free of artificial influence (Nemesvámos)<br />
The fluctuations in karstic water level due to natural and artifical influences are<br />
illustrated in figure 5 where data collected at the borehole 14 kmnorth-westofthemin-<br />
ing centre of Tatabánya, as well as at the borehole 9 km south-east of the mining<br />
centre, at Obarok, are plotted. It can be clearly seen from this figure that the karstic water<br />
lecel has sunk by more thaii 10 metres since 1959. The fact that this phenomenon cannot<br />
be attributed to unfavourable precipitation conditions is demonstrated by the karstic<br />
water level ofNemesvámos indicated on the drawing by a dotted line, i.e. in an area of<br />
the Balaton Highlands where no mining activities are taking place. In this region the<br />
water level has raised cca 7 metres since the beginning of the exploration work. The<br />
rising water levels in the first months of the year are closely shown on the curve. The<br />
significant rise in 1963 is especially striking. In this year only average precipitation fell<br />
on the area, but the distribution of the precipitation during the year was especially<br />
favourable from the viewpoint of dynamical karstic water replacement (replenishment)<br />
and infiltration. The annual distribution was so favourable that it temporarily stopped<br />
the depression even in the area of the mining district, and brought about a certain rise<br />
in the karstic water level.<br />
99
For the sake of completriess, in the colums illustrated in the figure mining water<br />
production is also shown, which reveals a growing tendency. We notice here that the<br />
adverse effect of water production upon the water balance appeared in 1961 at such a<br />
rate that water production surpassed the natural recharge of 56 cubic m per minute<br />
computed with the aid of the method described in the introductory part of the present<br />
study.<br />
As a very instructive example of the upsetting of water balance in the following we<br />
are going to describe a case observed recently:<br />
In 1964 in Miskolc (a Hungarian country city) for the purpose of thermal water<br />
production a borehole of 600 m depth was sunk into karstic limestone. The borehole<br />
was especially abundant in thermal water, its yield amounted to 5,000 litres per minute.<br />
Within two weeks subsequent to opening the borehole the thermal springs of similar<br />
deep karstic origin sited at the spa (health resort) at a distance of 6.5 km from Miskolc<br />
dried up. Subsequent to shutting off, viz, discontinuing the operation of the newly estab-<br />
lished borehole-the natural springs continued to deliver water and their yield reched<br />
the original value.<br />
Several experiments were carried out for the purpose of clearing up the relationship<br />
between the well and the springs. These experiments have proved that opening of the<br />
well can be detected within 20 minutes at the springs with the aid of precise measuring<br />
instruments. Such a quick reaction can be naturally expected only in well developed<br />
karstic (cavernous) limestone, whilst in the case of boreholes driven down in dolomite<br />
due to the narrower, finer water delivering cracks and veins the deeper depression<br />
takes shape first in the immediate vicinity of the shaft and extends to greater distances<br />
only later on.<br />
These establishments viz. conclusions call attention to the fact that within an inte-<br />
gral (uniform, homogeneous) karstic region artifical devebpment should take place<br />
with the greatest possible care and with due consideration of thenatural water replen-<br />
Photo No. 1 - Instrument room of the subsurface (underground) observatory of Buda-<br />
pest (Photo Csekó A.)<br />
I O0
ishment (recharge), otherwise the upset of water balance may result in very harmful<br />
consequences. As a matter of course, however, for the equalization of varying precipi-<br />
tation conditions the static water resources may be utilized temporarily but only to such<br />
an extent that the quantity of water drawn off in total must not rise above the replenish-<br />
ment of the dynamical water resources as computed in the annual average value.<br />
For the purpose of protecting the thermal karstic medicinal springs of Budapest,<br />
as well as for the systematic supervision andchecking of the karstic water level and other<br />
hydrological characteristics-in Budapest, in one of the caves of the Gellért Mount an<br />
underground observatory was installed where variations taking place in the thermal<br />
karstic water level and in other factors are automatically registered (recorded) (Photo<br />
No. I).<br />
Investigations in connexion with kurstic springs<br />
For the purpose of satisfying demands in potable water supply in general the natural<br />
springs are developed first. From among the natural springs the karstic springs with<br />
their abundance in water surpass by far other springs-but due to the special nature of<br />
channelways of karstic springs the disadvantage is encountered that their water yield<br />
is subjected to significant fluctuations and owing to limited possibilities of natural filtration-the<br />
bacteriological conditions cannot be regarded as satisfactory. That is the<br />
reason why in Hungary the systematic investigation of the springs, especially of the<br />
karstic springs had become necessary which has made it possible to develop and introduce<br />
a certain classification of dependability on the base of measurements effected in<br />
the course of a longer period of time.<br />
The classification of dependability is based on the three most important characteristic<br />
features of the spring. The first is the water yield, the second is the temperature and<br />
the third is the chemical composition. The more constant these three factors are-the<br />
more dependable the spring is. The methods by which water yield and temperature<br />
measurements are effectuated-are well known. For the purpose of characterizing chemical<br />
composition the so-called electrical resistance measurement has been introduced<br />
which makes it possible that with the aid of a single numerical value, the specific resistance<br />
depending on the ion-concentration-the chemical composition of the spring<br />
water can be characterized. This examination may take place at the site and can be<br />
carried out by a less qualified staff.<br />
On the base of measurements performed in the course of several years the fluctuation<br />
ratios of the yield of the springs (e), of the spring water temperature (t) and those<br />
in electrical resistance (R) have been developed (Qmax: Qmin, tmax: tmin and Rmax: Rmin<br />
on the base of which the so-called dependability indices (pQ, ,ut, pì?). On the basis of<br />
examinations and practical experience collected through decades the dependability<br />
classification included in the following table has been introduced:<br />
Water yield Temperature Electr. Resistance<br />
1.0- 3.0 6 1.00- 1.15 6 1.00- 1.05 6<br />
3.1- 5.0 5 1.16- 1.25 5 1 .O6 - 1.10 5<br />
5.1- 10.0 4 1.26- 1.35 4 1.11-1.15 4<br />
10.1- 20.0 3 1.36 - 1.45 3 1.16- 1.25 3<br />
20.1-100.0 2 1.46- 1.55 2 1.26 - 1.35 2<br />
>100.0 1 >1.55 1 >1.35 1<br />
The dependability indices have to be evaluated as follows: 6 = excellent; 5 = very<br />
good; 4 = good; 3 = satisfactory; 2 = poor; 1 = very poor.<br />
101
It has been proved that the dependability indices depend strictly on the geological<br />
conditions of the watershed and the riverine. In mountains built up of dolomite the<br />
conditions are much more favourable than in lime rock. In areas subjected to strong<br />
tectonic effects the channelways are of greater dimensions -consequently the perco-<br />
lated precipitation finds its way to the spring within a much shorter time, without fric-<br />
tional resistance, which results in great fluctuations rendering the karstic spring un-<br />
reliable. On the other hand, narrow channelways-especially in dolomitic karst-are<br />
impeding quick underground i.e. subsurface flow, thus making it possible that a great<br />
part of the percolated precipitation wil be stored inside the mountain and in this way<br />
an adequate equalization wil be brought about at the spring. The slower subsurface<br />
flow-as a matter of fact-promotes also equalization of the temperature and of the<br />
dissolved solids (electrical resistance) due to which the reliability of the three hydrologi-<br />
cal factors of the spring will be significantly improved. As experience indicates-even<br />
bacteriological conditions of a given spring are satisfactory if the above-mentioned<br />
three factors viz. the respective indices are favourable.<br />
If long measurement series are lacking, adequate evidence regarding the depend-<br />
ability of the karstic spring is offered by the ratio Ca: Mg. A higher Mg content indicates<br />
dolomitic strata on the base of which conclusions can be drawn regarding channelways<br />
Photo No. 2 - Dripping registration device in the stalactite cave of Aggtelek. (Photo:<br />
Radai 6.)<br />
102
of smaller dimensions resulting in a higher degree of dependability. On the other hand,<br />
a higher Ca content refers to easily soluble limestone, promoting the development of<br />
wide, cavernous channelways, enabling the quick runoff of precipitation water without<br />
banking-up, and in this way resulting in the diminishing of the dependability of the<br />
spring.<br />
[NVESTIGATION CARRIED OUT IN CONNEXION WITH PERCOLATION (INFILTRATION)<br />
For the purpose of directly studying the precolation (infiltration) conditions in<br />
karstic regions-in a number of caves drip-metering devices were set up under the sta-<br />
lactites. These devices were developed in such a way that at places difficult to get at<br />
automatic registrations of the water quantity dripped off took place (see Photo No. 2),<br />
whilst at other places the collected amount of water was measured daily in measuring<br />
cylinders.<br />
The purpose of the measurements was to establish the effect exerted by the precip-<br />
itation upon the rate of dripping in the caves in the course of the different months Of<br />
the year and to find a possible relationship between the percolation rates and laws<br />
revealed in other ways.<br />
In the course ofinvestigations carried out in the last four years the drippingintensity<br />
(i.e. the amount of water dripping down in an hour expressed in ccm-s) was measured<br />
at different characteristic points. Subsequently it was examined how many cm-s of<br />
precipitation fell upon the ground surface above the given case within five days pre-<br />
ceding the increase, in those cases where the dripping intensity was strikingly high. The<br />
increase in dripping intensity due to one mm of precipitation is called the specific in-<br />
crease of dripping intensity. It has been found that the precipitation falling in the differ-<br />
ent months of the year affects in different ways the specific increase in dripping inten-<br />
sity. In the course of these investigations the winter periods when the melting snow<br />
might influence the rate of dripping had to be eliminated and only those data were<br />
considered when the change in dripping rate was due to rainfalls actually falling upon<br />
the area being examined. As a ha1 result with the aid of this method it has been estab-<br />
lished that the precipitation falling in vegetation free months percolates into the ground<br />
at a much higher rate and feeds karstic water than precipitation of those months where<br />
water consumption of surface vegetation and evaporation is much higher. In the follow-<br />
ing the average values of increase in dripping intensity due to one mm precipitation<br />
in the different months of the year have been summarized:<br />
January<br />
February<br />
March<br />
April<br />
May<br />
June<br />
July<br />
August<br />
September<br />
October<br />
November<br />
December<br />
i i .3 ccm per hour/mm<br />
12.4 ccm per hour/mm<br />
13.1 ccm per hour/mm<br />
10.0 ccm per hour/mm<br />
7.7 ccm per hour/mm<br />
2.4 ccm per hour/mm<br />
0.2 ccm per hour/mm<br />
0.8 ccm per hour/mm<br />
0.5 ccm per hour/mm<br />
4.1 ccm per hour/mm<br />
9.6 ccm per hour/mm<br />
14.9 ccm per hour/mm<br />
The data are plotted graphically op figure 6. In spite of the fact that only few data<br />
were available the similarity between this curve and the curve No. 2, representing the<br />
percolation rates of the different months of the year is striking. As a matter of course<br />
103
due consideration has to be given to the fact that the diagram drawn up on the base of<br />
spring yields was prepared viz. supported by data of measurements effectuated in three<br />
decades. However, the great similarity permits the conclusion to be drawn that there<br />
are great variations in the percolation conditions during the year and these variations<br />
are taking place according to certain laws, in the different seasons of the year.<br />
Fig. 6 - Specific increase in dropping intensity caused by one mm precipitation.<br />
Investigations were also carried for the purpose of establishing the velocity of infil-<br />
tration. One of the series of these investigations was executed in the limestone moun-<br />
tains of Medium Triassic Period situated above the famous stalactite cave of Aggtelek.<br />
Above one of the larger rooms of the stalactite cave of Aggtelek on the karstic ground<br />
surface artificial precipitation was produced by means of the water drawn off from the<br />
cave rivulet. The water sprayed upon the ground surface was salted with common sait<br />
weighing several metric centners. The artificial water spraying corresponded to a 85 mm<br />
precipitation. In this case at several dripping points measuring cylinders were set up,<br />
the content of which was metered every quarter of an hour, and the water received by<br />
the cylinder was subjected to chemical analysis and its electrical resistance was also<br />
determined. The thickness of rock strata above the cave ceiling reached cca 83 metres.<br />
The arrival of the artificial precipitation at the cave could be easily established by<br />
the increase in dripping intensity and the appearance of cl content. As the final result of<br />
the investigations it has been stated that the infiltration velocity ranges from 7.0 io<br />
9.1 metre per hour.<br />
We have to notice it here that there were no swallow holes in the ground surface,<br />
consequently the water could disappear only through the fine haircracks oftheiime rock,<br />
consequently, the water reached the cave by infiltration and not by turbulent flow. No<br />
surface runoff was experienced.<br />
Similar experiments were carried out in Budapest, on the surface of the ground<br />
above the cave of Pálvölgy. The rock consisted here of nummulitic limestone of the<br />
104
Upper Eocene epoch. It has been found that the velocities occurring here varied from<br />
2.7 to 4.7 metres per hour.<br />
The slower rate of percolation (infiltration) velocity experienced here can be explain-<br />
ed-in all probabilities-by the lower karst formation tendency of the rock.<br />
It has been observed on both areas being investigated that the dripping intensity<br />
rapidly increases then slowly diminishes to its original value, which is also characteristic<br />
of the changes in the yield experienced in karstic springs.<br />
At those places where the origin of a subsurface rivulet could be determined with<br />
the aid of an open swallow hole-the velocity of flow of karstic waters could also be<br />
determined with the aid of using colouring agents or salt. On the base of several experi-<br />
ments it has been found that the velocity of flow ranges from 40 to 110 metresper hour<br />
which shows good harmony with the values published in the international literature.<br />
It is interesting to mention that there was an experiment repeated with tenfold water<br />
yield of the spring whilst the velocity of flow was hardly redoubled. From this the con-<br />
clusion may be drawn that at the first measurement the water had not fully filled up the<br />
channelway of the karstic spring but it flowed directly into the wide cave where in addi-<br />
tion to the increased yield it could augment its cross sectional area. Accordingly the<br />
increase in velocity was not proportional to the rise of the yield. Later on, this cave was<br />
found by speleologists. From the form of appearance of the coloured or salted water<br />
also conclusions can be drawn regarding the character of channelways. If the marked<br />
water appears at once in a concentrated form-it means that it flows in narrow channel-<br />
ways under pressure. On the other hand, if the marked water traces appear over a<br />
longer period of time it indicates that the water meets broader sections, possibly small<br />
lakes, on its way to the spring.<br />
(l) KESSLER<br />
(2) KESSLER<br />
LITERATURE<br />
H. (1957). Estimation of Subsurface Water Resources in Karstic Regions.<br />
IASH tome II. pp 199-206. Toronto Meeting.<br />
H. (1955). Der Versickerungsbeiwert in Karstgebieten. Wasserwirtshaft-<br />
Wasser technik (Berlin) 1955.12, pp 392-395.<br />
(3) BURDON J.D (1961). Methods of Investigating the Ground Water Resources of the<br />
Parnassos-Ghiona L.imestones. IASH Athens Meeting, 1961. Publ. No. 57, pp 143-<br />
159.<br />
(4) ARONIS G. and BURDON I. D. (1961). Development of a Karst Limestone Spring in<br />
Greece. IASH Athens Meeting, 1961. Publ. No. 57, pp. 564-585.<br />
105
HYDROLOGICAL AND HYDRAULIC CHARACTERISTICS<br />
OF WATERS FLOWING FROM FISSURED<br />
CARBONATED ROCKS INTO MINES<br />
SUMMARY<br />
T. TETTAMANTI<br />
M. Eng., Chief of Department,<br />
Dorog Coal Mining Trust, Hungary<br />
A major part of the coal production, as well as all the bauxite and manganese pro-<br />
duction in the People’s Republic of Hungary are bound to the Transdanubian Central<br />
Range area. Mineral deposits cover aquiferous carbonated fractured substrata of<br />
Superior Triassic Age. Mining operations are carried out almost exclusively under the<br />
level of stable water and, as a consequence, the prevailing conditions can be considered<br />
as utmost hazardous on an international level too.<br />
In giving a short account of the tectonic and hydrogeologic characteristics for com-<br />
mercial mineral deposits, as well as some statistical data on specific indices relating<br />
to the volumes of water to be pumped, it is aimed at offering a picture of the mining<br />
operations carried out in difficult water conditions.<br />
It wil be reported on the relations between mining activities and water inrushes<br />
of primary and secondary character. Well interpreted field observations and experiences<br />
gained for several decades, as well as hydrological and hydraulic investigations, help to<br />
gain better knowledges on the causes and frequency of water inrushes and clarify many<br />
of the relevant problems.<br />
An investigation into anticipated rates of water flow and the causes of their changes<br />
in function of the time, using scientific methods, contribute more and more to find<br />
proper solutions for problems encountered during production.<br />
Methods of protection against water look back to a longer past. It wil be reported<br />
on the methods developed hitherto, i.e. on preventive, passive and active ones and a<br />
summary of their principles, their fields of application and the obtained results is given.<br />
Finally, major problems to be solved in the future are indicated.<br />
Caractéristiques hydrologiques et hydrauliques des eaux s’écoulant des roches fissurées<br />
sur des chantiers<br />
RESUME<br />
Une partie considérable de la production charbonnière et, en plus, toute la produc-<br />
tion de bauxite et de manganèse proviennent, dans la République Populaire de Hongrie,<br />
du Massif Central de Transdanubie. Les gisements minéraux ont été formés sur une roche<br />
originaire carbonatée, fracturée, aquifère d’âge triasique supérieur. Les opérations<br />
minières sont exécutées, presque exclusivement, au-dessous du niveau aquifère et, par<br />
conséquent, le danger des venues d’eau est considérable.<br />
En caractérisant brièvement les propriétés tectoniques et hydrogéologiques des<br />
gisements minéraux commerciaux et en indiquant quelques données statistiques sur les<br />
volumes des venues d’eau et sur certains indices spécifiques relatifs, on se propose de<br />
brosser un tableau des travaux miniers exécutés dans des conditions extrêmement hasar-<br />
deuses lors des venues d’eau.<br />
Les relations entre opérations minières et venues d’eau forment l’objet de cette<br />
étude. Les venues d’eau peuvent être de caractère primaire et secondaire. Les investiga-<br />
tions hydrologiques et hydrauliques sur celles-ci donnent, combinées avec des obser-<br />
vations et informations recueillies sur le terrain et bien interprétées, un précieux appui<br />
pour l’étude des causes et de la fréquence des venues d’eau.<br />
L’examen de la question des débits d’eau à prévoir et de leur modification, en fonc-<br />
tion du temps, contribue de plus en plus, en se servant des méthodes scientifiques, à<br />
trouver une solution pour les problèmes de production.<br />
La protection contre les venues d’eau conserve de belles traditions. Les méthodes<br />
préventives, passives et actives, mises au point, sont décrites en indiquant brièvement<br />
leurs caractéristiques essentielles, leurs possibilités d’application et les résultats obte-<br />
nus. Enfin, sont esquissés les problèmes les plus importantes à résoudre dans l’avenir.<br />
106
A major part of collieries, as well as all the bauxite and manganese mines in the<br />
People’s Republic of Hungary are to be found in the Transdanubian Central Range<br />
area and, due to the permanent danger of water, can be considered as utmost hazard-<br />
ous. Mining, started in the past century and made mainly during the two last decades<br />
a big development, required for problems of water accumulated in fissured carbonated<br />
strata to be studied theoretically as weil as practically on an intensive way.<br />
In the followings, a short account of the relevant mining activities and their results<br />
will be given without, however, striving for completeness, that, considering the given<br />
time limits, would not even be possible.<br />
1. MINING OPERATIONS IN THE AREA OF CARBONATED SUBSTRATUM<br />
1.1 TECTONIC AND HYDROLOGIC CHARACTERISTICS FOR THE TRANSDANUBIAN CENTRAL<br />
RANGE<br />
Sediments in the Central Range had been formed at areas of SW-NE strike ~ 0 1 1 ~ -<br />
ling sediments of metamorphosed crystalline masses. Carbonated rocks, containing<br />
considerable amount of water, were formed during the Lower Mesosoic. The main dolo-<br />
mite, as well as, Dachstein and Lias limestone measures have been explored at an area<br />
extending over 5,000 km2, forming, as they do, directly or indirectly the underlying<br />
strata for coal, bauxite and manganese occurrences. Numrnulionous limestone strata Of<br />
Eocene Age to be found locally in the roof of the seams have equally accumulated water.<br />
Lines of longitudinal fracture are running in the same direction as the strike of the Cen-<br />
tral Range. Formation of cracks, perpendicular or nearly perpendicular thereto, gave<br />
rise to considerable vertical displacements, whereas horizontally they are much less<br />
marked.<br />
The degree of fracturation of carbonated strata, displaced under the effect of oro-<br />
genic forces, is varying in broad limits in function of the depth. As a consequence, all<br />
variants of carst rock types are to be found in the Central Range. Some characteristics<br />
of the reservoir, designed as main carst consisting of carbonated strata and containing<br />
a coherent body of water in great amount named main carst water, are shown in figure 1.<br />
Cracks in carbonated strata, and the water contained in them respectively, form a<br />
coherent hydraulic system under varying pressure that locally is as high as 40 to 50 atm.<br />
The dynamical water level corresponds to the varying heads of pressure influenced.<br />
among other things, by natural and artifical water drainage. Artifical dewatering must<br />
be carried out, before all, on account of feeders due to mining operations. The level of<br />
stored water varies between + 270 and 4- 110 m above sea level.<br />
1.2 MINING OPERATIONS IN HAZARDOUS HYDROLOGICAL CONDITIONS<br />
Coal, bauxite and manganese deposits now extracted cover the carbonated sub-<br />
stratum. To the North there are Dorog, Tatabánya and Oroszlány coal fields, at the<br />
centre the Middle-Transdanubian coal and bauxite occurrences and southward coal,<br />
bauxite and manganese deposits at Ajka.<br />
The degree of hazard, due to the presence of water, is variable. Frequency and inten-<br />
sity of water intrusions, pressure of the accumulated water and the depth of mining<br />
are, all, varying. In addition, tectonic conditions and the age of different occurrences<br />
are divergent. As to characterize them, schematic geological sections from Dorog and<br />
Tatabánya coal fields as weil as from Iszkaszentgyörgy bauxite occurrence will be<br />
shown in figures 2, 3 and 4.<br />
The rate of water flow in Dorog coal field has continuously increased due to the<br />
fact that mining had been extended over areas characterized by more and more less<br />
107
108<br />
Fig. 1 - Map of the Transdanubian Central Range with characteristics for the main<br />
carst system.<br />
‘ I<br />
”‘<br />
E ~<br />
I<br />
T
Dacbdeh hmesfone<br />
E3 Lower Emm brown coa/<br />
Fig. 2 - Geological section for Dorog coal field.<br />
o 46 I 2 krn<br />
NW SE<br />
'4 ~achstem //mestone<br />
Upper Fiassic dolomite<br />
Lower Eocene brown c00l<br />
Fig. 3 - Geological section for Tatabánya coal field.<br />
sw NL<br />
o-, m m<br />
1 Pleistocene 2 Eocene hmestone and marl<br />
3 Lower Eocene mari 4 Cretaceous bauxite<br />
5 Upper Piassic dalmite<br />
Fig. 4 - Iszkaszentgyörgy bauxite deposit.<br />
109
favourable mining conditions and in this respect further increase is to be anticipated.<br />
In Tatabánya coal field extracting operations, carried out in marginal areas, have dou-<br />
bled the amount of water pumped for some years. A further increase is foreseen there<br />
too.<br />
In the roof and floor of Middle-Transdanubian coal seams there are carbonated<br />
fractured strata presenting, by this way, a permanent hazard of water intrusions from<br />
two directions. The situation is, however, more favourable in this case than for the two<br />
former fields.<br />
Equally better hydrogeological conditions prevail at Várpalota and Oroszlány fields,<br />
where main carst water body is only indirectly drained.<br />
Most of bauxite and manganese occurrences in Hungary are sedimented directly<br />
onto the dolomitic substratum. Mining, carried out now at relatively shallow depth,<br />
progresses gradually toward greater depth. The volume of inrushed water is increasing<br />
also at this place.<br />
It is to be noted that using the actual hydrological protective methods, only 25 % of<br />
the reserves in Dorog coal field can be extracted. 73.7 % of the bauxite reserves are under<br />
water level.<br />
1.3 WATER PUMPING IN MINING<br />
For mining operations the volume of water to be raised, the depth of extraction<br />
together with the connected pumping heights and not least the volume of water cm3)<br />
per unity of production (I t) are of prime importance.<br />
Volumes of water lifted vs head of pumping are shown in figure 5.<br />
0<br />
depth rn<br />
l<br />
i<br />
!O0<br />
200<br />
300<br />
#O<br />
Fig. 5 - Distribution of waters pumped in Hungarian mines.<br />
As to characterize water pumping conditions data indicated above are presented<br />
on a national level in a summarized form in Table 1 corresponding to the situation in<br />
1964.<br />
Increase in production due to the fact that hydro-geologically less favourable dis-<br />
tricts have been extracted too, indicates, in the following Table 2 vs time the problems<br />
solved and to be solved on account of feeders.<br />
110
Coal mining<br />
TABLE 1<br />
Summarized data on the volumes of water<br />
raised in the mines of Hungary<br />
Volume of Mean pump- Specific<br />
Field or Trust water ing head value<br />
ms/rnin rn m3/t<br />
Komló T. 2.25 376 0.872<br />
Pécs T. 5.60 417 2.110<br />
Dorog T. 111.86 21 8 26.780<br />
Pilis V. 0.55 98 0.591<br />
Tatabánya T. 106.74 133 14.500<br />
Oroszlány V. 3.30 183 1.165<br />
Borsod T. 51.70 85 5.900<br />
Középdunántul T. 66.81 155 4.764<br />
Nógrád T. 10.10 152 1.411<br />
Ozdvidék T. 11.35 145 4.534<br />
Mátravidék T. 3.90 35.4 0.794<br />
Várpalota 10.15 120 2.253<br />
Hidas V. 0.30 87 0,540<br />
Coal mining total 384.61 166.2 5.740<br />
Ore mining total 4.40 156<br />
Bauxite mining total 90.30 87 42.20<br />
Mining in Hungary<br />
total 479.31 159.1 -<br />
Fighting against water hazard looks back to the longest period in Dorog coal field.<br />
As to give a general idea about it, data on water lifting and changes in water level for<br />
the past nearly four decades are presented in figure 6.<br />
As it is to be seen, despite artificial drainage operations carried out intensively, no<br />
marked drop in wster level regionally is observed.<br />
TABLE 2<br />
Percentual change in indices .for water pumping in coal<br />
mines between 1938 and 1964. (Basic year is 1938)<br />
1938 1961 1962 1963 1964<br />
Coal production (t) 100 305 311 328 342<br />
Feeders (m3/min) 100 443 556 603 661<br />
Specific water raising (m3jt) 100 143 176 174 189<br />
Mean lifting head (m) 100 157 167 163 165<br />
111
By presenting the above data it was aimed at documenting that Hungarian mining<br />
has effectively to fight against a permanent hazard of water inrushees of incomparable<br />
severity.<br />
1927 1930 fQ35 IQ47 1945 1950 f955 1960 1964<br />
Fig. 6 - Changes in water level as against drainage in Dorog coal field.<br />
2. TNTERDEPENDENCE OF MINING OPERATIONS AND FEEDERS<br />
90% of the volume of water accumulated in the Centrai Range i.e. 420 maimin are<br />
tapped by mining operations partly accidentally, also unintentionally, partly with a<br />
view of carrying out the planned drop in water level.<br />
Research and practical men in great number have studied for some decades problems<br />
relating to hydro-geologic and recently hydraulic characteristics for fractured reservoir<br />
systems as weil as their interdependence.<br />
Since hydraulic questions and characteristics of water flowing form the subject of<br />
another paper, here they will be only shortly discussed aiming at indicating primarly<br />
other correlations.<br />
2.1 FACTORS BEARING UPON WATER INRUSHES<br />
2.1.1 Hydrodynamic conditions<br />
In addition to determine locally the mean volume of interstices in carbonated rocks,<br />
it is important to know the degree of changes in crack system vs depth. For both open<br />
and closed water levels hydrostatic pressure is increased with depth. The volume of<br />
flowing water is a function of this latter and of the section at disposal for flowing.<br />
Knowing the changes in the îorm of a depression cone produced during artificial<br />
draining, the volume of interstices in the concerned area can be approximated. Its<br />
112
knowledge promotes the districts, where the degree of hazard is diminished by drainage,<br />
to be extracted and an artificial dropping in water level to be performed. The volume of<br />
water drained artificially can, in the course of water inrush, be computed from the so<br />
called relation for the equivalent section of flowing F = &/1/2gH, once the amount of<br />
water depending upon pressure and the depth are known. Hereby all the effects of losses<br />
due to friction and contractions produced during flowing have been considered. Computing<br />
the dimensions of this section for different levels, using the data for known cases<br />
of inrushes, it can be concluded upon their changes vs depth. As a consequence, volumes<br />
of water related to levels choked at will and approaching effective conditions can<br />
be computed. The amount of water originating from the substratum and its changes<br />
vs time are determined by the equivalent section of flowing (F) characteristic of the<br />
water inrush and the section of lines (f) leading to the mining cavities in question. Starting<br />
from the above relations it will be possible for the rates of flow so important for<br />
mining operations to be predetermined by approximations.<br />
Determinating the parametres for water flow and through them establishing the<br />
laws governing water movements as well as the further study of correlations and extension<br />
of their field of application, all, are subjects for further investigations.<br />
2.1.2 TECTONIC CONSIDERATIONS<br />
Rate and frequency of water inrushes are dependent upon tectonic and protective<br />
layer conditions as well. A critical evaluation of data relating to areas already extracted<br />
or under extraction gives the possibility of making some statements and drawing up<br />
conclusions valid also for areas to be opened up.<br />
Statements based on studying several hundreds of practical feeder cases support the<br />
opinion according to which for 70 to 80 per cent of inrushes at the Northern part of the<br />
Central Range directly faults and for 15 to 20 per cent fractured zones in faults are res-<br />
ponsible. Location of breaks or secondary zones of movement and those characterized<br />
by very carsted conditions is, for an effective protection against water hazard, indispen-<br />
sable.<br />
It could also be stated that fractures causing greater or lesser throws were equally<br />
hazardous. Zones of greater throw do not present, by all means, increased hazard.<br />
In marginal areas of the fields the degree of hazard is increased as proved by inrushes<br />
of higher rate.<br />
Throws, as well as hydrostatic pressure, are only of secondary importance, the sec-<br />
tion of water channels playing a decisive role.<br />
Investigations could also clarify that the inferior line of intersection was more hazar-<br />
dous than the superior. At longitudinal and transversal main systems of fracture, trans-<br />
versal compressive and tensile stresses, respectively can be initiated. According to gener-<br />
al geomechanical considerations these two directions are tectonically not equivalent.<br />
It can be concluded therefrom that along longitudinal breaks the substratum is com-<br />
pressed, whereas transversally extended. Extended, carsted channels formed conse-<br />
quently along transversal breaks. Classification and analyse of more than 800 interpre-<br />
table feeder cases in Tatabánya and Dorog coal fields led, however, to the conclusion<br />
that 75 per cent of the specific water discharge related to 1 m length of fracture to the<br />
strike was not originated from transversal breaks. Longitudinal, compressed breaks are<br />
also equivalent with transversal ones and this in spite of the presumed choking effects.<br />
It is interesting to note that in the two fields the major part of inrushes did not occur<br />
at the same main fracture line direction. Geomechanic systems for main fracture lines<br />
can be, also only within the same field, considered as similar.<br />
Investigations into the relations between feeders and geological structure indicated<br />
several factors influencing the degree of water hazard as well as the method to be choi-<br />
ced for protection.<br />
113
2.1.3 Rale of protective layer<br />
Impermeable floor stratum, the so called protective layer between substratum and<br />
mineral deposit has to prevent stored water, by resisting to its hydrostatic pressure, to<br />
break into the mine. Pressure of water is dependent upon depth under piezometric level<br />
and resistance of protective layer upon its proper thickness, impermeability and the<br />
position of breakage planes interrupting their continuity. Therefore, the specific thick-<br />
ness of protective layer i.e. that related to 1 atm hydrostatic pressure is more important.<br />
Thickness and material of the protective layer vary in each field, the latter consists<br />
mainly from clay, sandy clay and shaly m.ar1 of Eocene age.<br />
At the major part of bauxite occurrences now extracted no protective layers are pre-<br />
sent or they are insignificant. Observations made during mining operations carried out<br />
for several decades at very watered areas revealed that inrushes in 74 to 85 per cent<br />
were due to protective layers with a thickness inferior to 1 m/atm yielding no proper<br />
protection against water. Only layers of more than 1.5 m/atm can be considered as<br />
sufficient for protection. These statements, are, however, only for relatively undisturbed<br />
tabular geological structure valid. Faults are, in general, to be taken for presenting<br />
potential water hazard. Therefore, examining the question of liability for protective<br />
layers, tectonic conditions are to be considered too.<br />
When the thickness of inconsistent strata is relatively small, the specific thickness<br />
of protective layer can be computed by subtracting the former from the absolute value<br />
of thickness for protective layer. Values presented above are valid for this case. in<br />
cases where protective layers consist of inconsistent or partly consistent beds of great<br />
thickness, filtering factor for each layer is to be computed as to be able to reduce the<br />
value of the thickness for absolute protective layer by taking them into account for<br />
further computations.<br />
2.1.4 Extension of the extracted area<br />
Among others, the rate of water flow originated from the substratum is dependent<br />
on the extension of the extracted area. Computation of the rate of water flow to be antic-<br />
ipated as well as the refinement of relations known hitherto are tested to be made by<br />
establishing functional relations.<br />
2.2 CHARACTERISTJCS OF WATER INRUSHES<br />
From technical point of view the knowledge of the conditions for feeders and of the<br />
change in water flow rate are not indifferent since these factors have a bearing on the<br />
taking of protective measures.<br />
2.2.1 Primary inrushes<br />
They are produced directly by attacking the carbonated reservoir rock and their<br />
fissures respectively, mainly in cases where mineral deposits are sedimented without any<br />
protective bed onto aquiferous strata. Though water can break into the mine through<br />
protective beds once they show up breakages and fault? opening up of wich by mining<br />
operations makes contact between the body of water accumulated under high pressure<br />
in the substratum and the opened mining cavity. In this case the “suffocating” effect of<br />
protective beds is not at all or hardly observable.<br />
2.2.2 Secondary inrushes<br />
These are retarded and generally characterized by marked change in flow rate. Re-<br />
tardation can be caused by several factors:<br />
114
(a) Water inrushes due to strata movements<br />
They are normally due, to not sufficient thickness of protective layers in cases, where<br />
the state of equilibrium of freed roof strata surfaces of lesser or greater extent is, to the<br />
effect of mining operations, broken and they can resist to the hydrostatic pressure of<br />
water only for a given time. At first, slow or quick floor lift is to be observed, followed<br />
by inrush of water. When extracting is carried out in several slices using hydraulic<br />
stowing, no inrush occurs during extraction of the first slice, but only in the course of<br />
that for the second and third ones.<br />
(b) Feeders coming from worked out zones<br />
They do not present directly during mining operations, but after ending them. At<br />
these occasions secondary feeders are produced when working superior seam groups.<br />
Their reason lies in the fact that roof strata, weakened in the course of primary opera-<br />
tions, are unable, on account of further strata movements due to secondary mining<br />
operations, to withstand the pressure of water. As a consequence, new inrushes occur<br />
or the flow rate of existing ones will be increased. For operations carried out at the same<br />
level, secondary inrushes can equally be produced when old workings are attacked or<br />
approached.<br />
2.2.3 Water coming from the roof<br />
In some coal fields and bauxite occurrences deposits are covered by aquiferous car-<br />
bonated fissured strata of Eocene age. They give rise, as a rule, to inrushes of varying<br />
rate when carsted rocks are opened or closed, since the rate of flow wil rapidly be<br />
increased after rainfalls.<br />
2.2.4 Changes in the rate of water flow<br />
The rate of water flow for both primary and secondary feeders can be modified<br />
and a classification made according to this criterium too. Changes in rate have an effect<br />
on the face advance and the means of drainage respectively.<br />
2.2.4.1 Inrushes of constant rate are produced when the cross section of channels<br />
(fi leading to the mine is smaller than the resulting one (F) formed in the basic rock.<br />
If there is no gravitational discharge, then the flow rate is controlled by resulting cross<br />
section in function of the water pressure. The volume of water will, however, be less<br />
than the value determined by the hydrostatic pressure and the resulting cross section.<br />
Iff 2 F, then the volume of water remains constant and equals the volume determined<br />
by the pressure and the resulting cross section.<br />
2.2.4.2 Feeders of varying rate can be of decreasing, increasing and irregular character.<br />
For decrease in rate the initial high value is gradually diminishing up to reach a<br />
constant one. It can observed when f > F on the one hand and extended cracks or<br />
caverns above the extracting level are tapped by mining operations. At first, the volume<br />
to be discharged gravitationally is drained, then the rate of inrushing water will be<br />
constant with a lesser volume, according to the cross section F.<br />
Decrease in rate can take longer time (fig. 7, curve 1). The reason of this laying in<br />
the fact that strata and within them protective beds are, after ending extraction in the<br />
zone, gradually compressed, consequently a chocking effect, resulting in this decrease,<br />
is produced out of the basic rock. It can be, however, brought about within the cracks<br />
of sub-stratum too, when flowing fills them up by detrital materials making the cross<br />
section narrower.<br />
Feeders with increasing rate offlow show up gradual or sudden increase in rate that,<br />
finally, wil be of constant rate of high value. (fig. 7, curves 2 and 3). This is observable<br />
115
when seams without sufficient protective bed are extracted, since, in this case, protec-<br />
tive beds become gradually lockered and the water under pressure is widening gradually<br />
the cross sectionfz Fmaking possible, at given hydrostatic pressure to reach the maxi-<br />
mum rate of flow. As it is shown by curve8 constructed from data obtained by field<br />
observations, reaching the maximum rate of water flow can last a longer time.<br />
Fig. 7 - Feeders of varying rate.<br />
Inrushes of varying rate are characterized by irregular changes in their volumes.<br />
Their reason lies in the changes produced initially in cross section of the flow channel,<br />
changes which, later on, are stopped. This can be, however, explained also by other<br />
factors when it occurs in the basic rock or in roof strata and old workings respectively.<br />
3. PROTECTION AGAINST WATER HAZARD<br />
Finally a short description of the preventive, passive and active methods of protec-<br />
tion will be given as they were developed, for fighting against water hazard.<br />
3.1 Precentiue method aims at excluding or retarding water inrushes or decreasing their<br />
intensity. Stratifications of relatively undisturbed character and a specific thickness of<br />
more than 1 miatm for protective beds can be considered as preliminary conditions for<br />
the use of this method. Characteristics of tectonics and protective beds have, however,<br />
to be detected when protective measures are taken. For main faults, protective pillars,<br />
the dimensions of which are determined by computations, are to be left. Panels are to<br />
be extracted in order of the degree of hazard presented by them taking into account<br />
weil established mining methods fixed by Mining Regulations, in addition to supplying<br />
the required capacity for water pumping.<br />
3.2 Objective of the pnssive method is to perform an ulterior shut down of the feeder.<br />
This is carried out on the one hand by damming endangered zones, on the other hand<br />
by sealing the system of fracture through bore holes bored from the surface. Sealing or<br />
cementing can be performed in stable, streaming or dammed water the first yielding the<br />
best results in so far success in 75 per cent of the cases is full and only 6 per cent of<br />
them remains unsuccessful.<br />
Surface cementing equipments are shown in figure 8.<br />
Before sealing is made, the system of fracture for the substratum must be widened<br />
by hydrochloric acid in order to increase its absorbing capacity. Principle of this method<br />
is illustrated in figure 9.<br />
116
Volume and absorbing capacity of cavities traversed by borehole varied between<br />
1,000 and 2,000 and 240,000 m3. In Dorog coal field alone, over 800,000 m3 sealing<br />
material, 15,000 m3 cement and nearly 300,000 1 hydrochloric acid were used for sealing<br />
feeders during the past 40 years.<br />
f. Sad 2. Water gun 3. first seave c Rpeh<br />
5-6. Seaves Z Feeder caw 8. Bore hole<br />
Fig. 8 - Layout for cementing equipments.<br />
Technology for constructing sealing dams in shafts or panels for rocks of relatively<br />
low strength is both theoretically and practically weil established. Figure 10 shows a<br />
dam type built in marl with 80 to 120 kp/cmL breaking strength of Inferior Eocene Age.<br />
Fig. 9 -Widening the system of fracture using hydrochlorid acid.<br />
In the coal fields of Hungary, thickness of the specific protective bed is, in 65 per<br />
cent of the cases, over 1 m/atm. For this reason, preventive and passive methods of<br />
Protection can succesfully be applied.<br />
3.3 Active method of protection is based on dropping the water level or decreasing the<br />
water pressure. Its appiication is limited to tectonically strongly disturbed zones, or<br />
deposits with insufficient, or without any protective beds. Primarly, as a locally efficient<br />
117
method, it is used in extracting bauxite deposits. But it looks back also in coal mining<br />
to a past of nearly three decades, though there, possibilities for its applications were<br />
more limited.<br />
Protection by dropping water level is coming in prominence on account of the grad-<br />
uai mining of districts of more advantageous conditions. A further increase in the<br />
amount of water to be raised is, consequently, to be reckoned with. Drainage to a large<br />
extent and increase in the volume of water to be pumped respectively necessitate for<br />
the production to be concentrated.<br />
Cabíes<br />
u-a Section<br />
In/ecting bore holes Curve40 Xi<br />
f4<br />
f3--i ,I<br />
Fig. 10 - Water dam sized to withstand pressure up to 20 atm.<br />
3.4 FUTURE PROBLEMS<br />
This schematic description, offered without striving for completeness, indicates the<br />
fact that many complex problems must be solved in the future.<br />
Some of the more important ones are: gaining additional knowledge of the relations<br />
between tectonic conditions and feeders, determination of the volume of water stored<br />
118
in fractureä strata for helping mining operatiom to be carried out successfully, clearing<br />
up of hydraulic conditions and extending the practical use of the obtained knowledge,<br />
computing hydrologic, hydraulic and technical-economical parameters in order to<br />
extend the use of active protecting method, extension of the limits for the economical<br />
use of pumping methods, designing and establishing efficient protective beds.<br />
If anywhere then for mining in hazardous water conditions it is valid that theoretical<br />
investigations and practice are interdependent.<br />
119
ABSTRACT<br />
THE HYDRAULIC PROPERTIES AND YIELDS<br />
OF DOLOMITE AND LIMESTONE AQUIFERS<br />
Sandor C. CSALLANY<br />
Hydrologist, Illinois State Water Survey, Urbana, Illinois, U. S. A.<br />
In Illinois large quantities of groundwater are withdrawn from wells in dolomite<br />
and limestone wells of Mississippian, Silurian, and Ordovician age. About 1,250 well-<br />
production tests were made on more than 1,000 wells penetrating the dolomite or<br />
limestone formations. It is observed that during aquifer tests interference between<br />
wells spaced more than one-half mile apart was measurable, indicating that water-yield<br />
openings in rocks extend for considerable distances. The conformable piezometric<br />
surface also seems to indicate that the dolomite and limestone contains numerous<br />
interconncected fractures and crevices. It is concluded that the controlled pumping<br />
test method may describe the hydraulic properties of the dolomite and limestone on<br />
an areal basis, but does not accurately describe the drawdown in the immediate vicinity<br />
of a pumped well. It is also concluded that the statistical analysis of adjusted specific<br />
capacity data is probably the best and most practical method to determine the yields of<br />
wells on an individual and regional basis because of the interconnexion of fractures<br />
and inconsistency in yields. Rough estimates of the coefficients of transmissibility of<br />
the shallow dolomite (based on average specific capacity data) average about<br />
100,000 gpd/ft. in Du Page Co,unty, 52,000 gpd/ft. in Cook.County, 24,000 p d/ft.<br />
in Wil County, 14,000 gpd/ft. in Kane and McHenry Counties, and 9,000 gpd/gft. !n<br />
Lake County. The probable ranges in yields of dolomite and limestone wells in<br />
undeveloped areas are estimated from specific capacity frequency graphs, aquifer<br />
thickness and areal geology maps, and water level data.<br />
RESUME<br />
Propriétés hydrauliques et débit des aquifères situés dans les couches dolomitiques<br />
et calcaires<br />
En Illinois, de grandes quantités d’eaux souterraines sont tirées des puits forés<br />
dans les formations dolomitiques ou calcaires d’âge mississipien, pennsylvanien,<br />
silurien et ordovicien. Environ 1250 contrôles de débit ont été effectués sur plus de<br />
1000 puits forés dans les formations calcaires ou dolomitiques. Pendant ces contrôles<br />
de débit des aquifères, une interférence entre des puits espacés de plus d’un 1/2 mile<br />
a été mesurée, ce qui indiquait l’existence dans la roche d’un réseaudecavités s’étendant<br />
sur des distances considérables. La surface piézométrique concordante semble indiquer<br />
aussi que les dolomites présentent de nombreuses cassures et crevasses reliées entre<br />
elles. On en conclut que la méthode des pompages contrôlés peut permettre d’élucider<br />
les propriétés hydrauliques des dolomites d’une certaine zone, mais qu’elle ne peut<br />
pas faire connaître de façon précise le rabattement de la nappe au voisinage immédiat<br />
d’un puits en cours de pompage. On en conclut aussi que l’analyse statistique des<br />
données corrigées de capacité spécifi ue est probablement la méthode la meilleure et<br />
la plus pratique pour déterminer le &bit d’un puits ou des puits d’une région, étant<br />
donné les communications existant entre les cassures et les variations de chaque débit.<br />
Les estimations approximatives des coefficients de transmissibilité des dolomites peu<br />
profondes (d’apri% des données moyennes de capacité spécifique sont de l’ordre de<br />
380.000 litres par pied et par jour dans le comté Du Page, de 200.000 litres par pied<br />
et par jour dans le comté Cook, de 91.000 litres par pied et par jour dans le comté<br />
Will, de 53.000 litres par pied et par jour dans les comtés Kane et McHenry et de<br />
34.000 litres par pied et par jour dans le comté Lake. L’estimation probable du débit<br />
des puits creusés dans les dolomies et le calcaire, dans les régions non développées,<br />
est calculée en se fondant sur les diagrammes de fréquences et de capacités spécifiques,<br />
l’épaisseur des horizons aquifères, des cartes géologiques de la région et des données<br />
concernant le niveau de l’eau.<br />
120
INTRODUCTION<br />
In Illinois several hundred municipal and industrial wells and thousands of<br />
farm and domestic wells obtain large quantities of groundwater from bedrock of<br />
Mississippian, Silurian, and Ordovician age. These rocks are encountered at depths<br />
ranging from a few to several hundred feet. Silurian rocks range in thickness from<br />
a few feet to more that 450 feet; and the thickness of the Galena-Platteville Dolomite<br />
(Ordovician) exceeds 350 feet in northern Illinois. The maximum known thickness of<br />
the Mississippian rocks is 3,400 feet.<br />
The results of well-production tests made on more than a thousand wells provide<br />
important information on the parameters and yields of the limestone and dolomite<br />
aquifers.<br />
This paper summarizes the results of studies made to date on the hydraulic properties<br />
and yields of wells in limestone and dolomite aquifers in Illinois.<br />
GEOLOGY<br />
Bedrock wells in Illinois may penetrate rocks of Pennsylvanian, Mississippian,<br />
Devonian, Silurian, Ordovician, and Cambrian age (fig. i). This paper is concerned<br />
primarily with bedrock wells penetrating Mississippian, Silurian, and the Galena-<br />
Platteville Formation of Ordovician age. The following brief summary of published<br />
information concerning the geology is presented to serve as a background for<br />
interpretation of the records.<br />
Ordovician rocks<br />
The Galena-Platteville Dolomite is dense to porous, partially argillaceous and<br />
cherty, and has shale partings and sandy dolomite beds. Interbedded dolomite limestone<br />
and calcareous dolomite grade into one another at places. The unit is the uppermost<br />
bedrock formation in many counties in northern Illinois.<br />
Silurian rocks<br />
The bedrock surface in the eastern one-third and the western one-fourth of northern<br />
Illinois is formed by Silurian rocks (fig. i). In the southern part of northern Illinois<br />
the rocks are overlain by rocks of Devonian, Mississippian, and Pensylvanian age.<br />
The Silurian rocks are mainly dolomites and are silty at the base.<br />
Mississippian rocks<br />
Mississippian rocks form the bedrock surface along the Mississippi and Illinois<br />
Rivers as shown in figure 1. In a large part of western, east-central and southern<br />
Illinois the Mississippian rocks are overlain by Pennsylvanian rocks. The Mississippian<br />
rocks are mainly composed of limestone, sandstone and shale.<br />
HYDRAULIC PROPERTIES<br />
The water-yielding properties of limestone and dolomite formations of Mississippian,<br />
Silurian and Ordovician age influence the productivity of wells. As the size and/or<br />
number of openings in the formations increase, yields of wells increase. The hydraulic<br />
properties of these aquifers are commonly expressed mathematically by the coefficients<br />
12 1
of transmissibility, T, or permeability, P, and storage, S. The hydraulic property of<br />
a confining bed (deposits overlying aquifers and retarding vertical movement of water<br />
into aquifers) influencing the productivity of a well is the coefficient of vertical<br />
permeability, P'. The coefficient of transmissibility is defined as the rate of flow of<br />
water in gallons per day through a vertical strip of the aquifer 1 foot wide and extending<br />
the full saturated thickness of the aquifer under a hydraulic gradient of 100 per cent<br />
(one foot per foot) and at the prevailing temperature of the groundwater. The coefficient<br />
of permeability is defined as the rate of flow of water in gallons per day, through a<br />
cross-sectional area of 1 square foot of the aquifer under a hydraulic gradient of one<br />
foot per foot at the prevailing temperature of the groundwater (fig. 2). P = T/m or<br />
T = Prn where m is the saturated thickness of the aquifer. The storage properties of<br />
OBSERVATION<br />
WELLS<br />
UNIT ,DELIN€<br />
Fig. 2 - Coefficients of permeability, P, (A), transmissibility, T, (B), vertical<br />
permeability, P, (C), and storage, (S), of confined (D) and unconfined (E) aquifers.<br />
ft<br />
123
an aquifer are expressed by the coefficient of storage, which is defined as the volume<br />
of water in cubic feet released from or taken into storage per square foot of surface<br />
area of the aquifer per foot change in the component of head normal to that surface.<br />
The coefficient of vertical permeability of a confining bed is defined as the rate of flow<br />
of water in gallons per day through a horizontal cross-sectional area of one square<br />
foot of the confining bed under a hydraulic gradient of 1 foot per foot at the prevailing<br />
temperature of the groundwater. The leakage coefficient is (P'im') where m' is the<br />
saturated thickness of the confining bed through which leakage occurs in feet.<br />
AQUIFER TESTS<br />
The hydraulic properties of aquifers and confining beds may be determined by<br />
means of aquifer tests wherein the effect of pumping a well at a known constant rate<br />
is measured in the pumped well and in observation wells penetrating the aquifer.<br />
Graphs of drawdown versus time after pumping started, and/or of drawdown versus<br />
distance from the pumped well, are used to solve formulas which express the relation<br />
between the hydraulic properties of an aquifer and its confining bed, if present, and<br />
the lowering of water levels in the vicinity of a pumped well.<br />
The data collected during aquifer tests can often be analysed by means of the leaky<br />
artesian formula (Hantush and Jacob, 1955).<br />
where:<br />
s = (114.6 Q/T) W(u, r/B) (1)<br />
u = 2693 r2S/Tt<br />
and ___r/B<br />
= rlJT/(P'/m'><br />
Ko(r/B) Modified Bessel function of the second kind and zero order;<br />
Io((r/B) Modified Bessel function of the first kind and zero order;<br />
S Drawdown in observation well, in feet;<br />
r<br />
Q<br />
Distance from pumped well to observation well, in feet;<br />
Discharge, in gpm;<br />
1 Time after pumping started, in minutes;<br />
T Coefficient of transmissibility, in gpd/ft;<br />
S<br />
P'<br />
Coefficient of storage of aquifer;<br />
Coefficient of vertical permeability of confining bed, in gpd/sq.ft;<br />
ni' Thickness of confining bed through which leakage occurs, in ft;<br />
Two controlled aquifer tests were made using shallow dolomite wells, see Zeizel,<br />
et al. (1962). Hydraulic properties computed with aquifer test data are as follows:<br />
1. Test at City of Wheaton-coefficient of transmissibility, 61,000 gpd/ft ; coefficient<br />
of storage, fraction, 3.5 ><<br />
2. Test at Argonne National Laboratory-coefficient of transmissibility, 44,000 gpd/ft;<br />
coefficient of storage, fraction, 9.0 x lop5; leakage coefficient, 1.0~ gpd/cu ft.<br />
The following is the detailed description of the method used in the evaluation of the<br />
well-production test at the city of Wheaton.<br />
A pumping test was made by the State Water Survey on 2 and 3 May 1960. Wells<br />
(fig. 3) located within the corporate limits of thesity of Wheaton were used. The effects<br />
of pumping well DUP39NlOE-16.6 cl were measured in the pumped well and in<br />
observation well DUP39NiOE-16.6 c. Pumping was started at 6.00 p.m. on 2 May<br />
124<br />
leakage coefficient, 6.5 x 10⁻³ gpd/cu ft;<br />
(3)
and was continued for a period of 24 hours at a constant rate of 830 gpm until 6.00 p.m.<br />
on 3 May. The closest centre of uncontrolled pumping was well 39NIOE-15.1 b,<br />
about 8,200 feet east of the pumped well.<br />
T<br />
39<br />
N<br />
--7<br />
WHEATON<br />
21<br />
r - - -- ---<br />
I<br />
P 10E<br />
Fig. 3 - Location of wells used in pumping test 1.<br />
Drawdowns in the pumped and observation wells were determined by comparing<br />
the extrapolated graphs of water levels measured before pumping started with the<br />
graphs of water levels measured during pumping (see fig. 4). Observed drawdowns<br />
were adjusted for interference from well 39NlOE-15.lb. Adjusted drawdowns in the<br />
pumped well were plotted against time on semi-logarithmic paper, and adjusted<br />
drawdowns in the observation well were plotted against time on logarithmic paper.<br />
The time-drawdown field data graph for the observation well is given as an example<br />
in figure 5.<br />
As pumping started water levels declined at an initial rate influenced only by the<br />
hydraulic properties of the aquifer. After about 15 minutes of pumping, the time-rate<br />
of drawdown decreased as vertical leakage became measurable. After about 55 minutes<br />
of pumping, water levels were appreciably affected by the operation of the pump in<br />
well 39NlOE-15.lb as shown in figure 4.<br />
The analysis of the interference data for the Wheaton test suggests that the fractures<br />
and crevices in the dolomite are interconnected for large distances. A straight line was<br />
matched to the time-drawdown graph for the pumped well. The straight-line method<br />
described by Cooper and Jacob (1946) and the slope of the time-drawdown graph<br />
were used to compute a coefficient of transmissibility of 63,000 gpd/ft. The coefficient<br />
of storage cannot be determined from available data because water levels in the<br />
pumped well are affected by well loss.<br />
The time-drawdown field data graph for the observation well was superposed on<br />
the family of nonsteady-state leaky artesian type curves (Walton, 1960). By interpolation,<br />
an (r/B) = 0.03 type curve was selected as analogous to the time-drawdown<br />
field data curve. Equations 1, 2 and 3 were used to compute coefficients of transmissibility<br />
and storage of the aquifer, and the leakage coefficient, P’/m’ (Hantush, 19561,<br />
125
of the confining bed. Computations are given in figure 5. The average coefficients of<br />
transmissibility, storage and leakage computed from the test results are 61,000 gpdlft,<br />
0.00035 and 6.5 x gpd/cu ft, respectively.<br />
;<br />
a O<br />
35<br />
40<br />
45<br />
i- 70<br />
w W<br />
LL<br />
75<br />
r<br />
44<br />
c<br />
39N IOE-16.6~1<br />
í PULlDEC WELL j<br />
39N IOE - 16.6~<br />
(IBSERV4TION WELL..<br />
O 46<br />
-<br />
48 .<br />
50<br />
5 ~1000<br />
-5 500<br />
W Z<br />
;cc 0<br />
:i400<br />
gm<br />
-z 700<br />
CO<br />
I 3 --1 J o<br />
aa<br />
39N IOE-16.6cl<br />
39NIOE-[C.lb<br />
5/2/60 5/3/60<br />
Fig. 4 - Water levels and pumpage during pumping test 1.<br />
The exact nature and thickness of the confining bed are not known. It is certain,<br />
however, that leakage greatly affects the cone of depression created by pumping this<br />
well in the Silurian cíolomite aquifer.<br />
Rough estimates of the coefficient of. transmissibility of the shallow dolomite<br />
aquifer were made. Based on average specific capacity data, the coefficient of trans-<br />
missibility of the shallow dolomite averages about:<br />
Cook County 52,000 gpd/ft<br />
Du Page County 100,000 gpd/ft<br />
Kane County 14,000 gpd/ft<br />
Lake County 9,000 gpd/ft<br />
McKenry County 14,000 gpd/ft<br />
Wil County 24,000 gpd/ft<br />
126
Where leakage was not measurable during the aquifer tests or only well-production<br />
tests are available of pumped wells, the modified nonleaky artesian formula (Cooper<br />
and Jacob, 1946) was used to analyse aquifer-test data for dolomite and limestone<br />
rocks:<br />
T=- 264 Q<br />
As<br />
where:<br />
T Coefficient of transmissibility, in gpd/ft;<br />
S Coefficient of storage, fraction;<br />
Q Discharge, in gpm;<br />
A s Drawdown difference per log cycle, in ft;<br />
r Distance from pumped well to observation well, in ft;<br />
to Intersection of straight-line slope with zero-drawdown axis, in min.<br />
i<br />
g IO<br />
a<br />
4<br />
n<br />
I<br />
1 , / I l<br />
Q = 830 gpm<br />
r=9'jft<br />
IO 100 I<br />
TIME. IN MINUTES AFTER PUMPING STARTEC<br />
Fig. 5 - Time-drawdown graph for well 16.6 c, pumping test 1.<br />
Values of drawdown during the pumping periods are plotted against the logarithms<br />
of time after pumping started on semilogarithmic paper. The time-drawdown field<br />
data graph will yield a straight-line graph. The slope of the straight line is used to<br />
determine the coefficient of transmissibility. The straight line is extrapolated to its<br />
intersection with the zero-drawdown acis. The zero-drawdown intercept and the<br />
computed value of T are used to calculate the coefficient of storage.<br />
The coefficient of transmissibility of Mississippian rocks was determined at several<br />
sites by analyses of data for production wells. The coefficient of storage cannot be<br />
determined with any degree of accuracy from data for the pumped well, because the<br />
127
effective radius of the pumped well is seldom known and drawdowns in the pumped<br />
well are often affected by well losses which cannot be determined precisely. Coefficients<br />
of transmissibility of the Mississippian rocks range from 270 to 12,000 gpd/ft.<br />
SPECIFIC-CAPACITY DATA<br />
YIELDS OF DOLOMITE AND LIMESTONE AQUIFERS<br />
The yield of a well may be expressed in terms of its specific capacity, which is<br />
commonly defined as the yield of the weil in gallons per minute per foot of drawdown<br />
(gpm/ft) for a stated pumping period and rate. The specific capacity is influenced by<br />
the hydraulic properties of the aquifer and confining bed, thickness of the confining<br />
bed, radius of the well and pumping period.<br />
When leakage through a confining bed is not measurable the theoretical specific<br />
capacity, Q/s, of a well discharging at a constant rate in a homogeneous, isotropic,<br />
artesian aquifer infinite in areal extent, is from the non-equilibrium formula (Theis,<br />
1935) given by the following equation:<br />
Q/s = T/[264 log,, (Ttll.87 rw 2s) - 65.53<br />
where:<br />
Q Discharge of pumped well, in gpm;<br />
s Drawdown, in ft;<br />
T Coefficient of transmissibility? in gpd/ft;<br />
S Coefficient of storage, fraction;<br />
rw Nominal radius of well, in ft;<br />
t Time after pumping started, in days.<br />
Equation 6 was derived by assuming that (1) the well completely penetrates the<br />
aquifer, (2) well loss is negligible, and (3) the effective radius of the well has not been<br />
affected by the drilling and development of the well and is equal to the nominal radius<br />
of the well.<br />
From equation 6 the theoretical specific capacity of a well depends in part upon<br />
the radius of the well and the pumping period. The relationships between theoretical<br />
specific capacity and the radius of a well and the pumping period are shown in<br />
figure 6. Diagram .4 indicates that a 24-inch diameter well has a specific capacity<br />
about 12 per cent larger than that of an 8-inch diameter well. It is evident that large<br />
increases in the radius of a well are accompanied by comparatively small increases in<br />
specific capacity. Diagram B shows that the specific capacity decreases with the length<br />
of the pumping period as the cone of depression deepens and expands.<br />
In addition to the drawdown in equation 6 there is generally a head loss or<br />
drawdown (well loss) in the pumped well due to the turbulent flow of water as it<br />
enters the well itself and flows upward through the well bore. Well loss can often be<br />
determined from the results of “step-drawdown tests”. During a step-drawdown<br />
test the well is operated during three successive periods of the same duration at<br />
constant fractions of full capacity.<br />
DESCRIPTION OF SPECIFIC-CAPACITY DATA<br />
During the period 1920 to 1963 weil-production tesis were made by the State<br />
Water Survey on more than 1 ,o00 dolomite and limestone wells in Illinois. The well-<br />
128
production tests consisted of pumping a well at a constant rate and frequently<br />
measuring the drawdown in the pumped well.<br />
Values of weil loss were estimated for ail wells from the results of step-drawdown<br />
tests, well-construction data, and pumping-rate data. Well losses were substracted<br />
from observed drawdowns, and specific capacities adjusted for well losses were<br />
computed.<br />
O I I l<br />
2- A -<br />
4-<br />
6-<br />
J: 500 gpd/fl<br />
8 - 5 0.0001<br />
-<br />
I : 240 min<br />
_1<br />
P 10-<br />
-<br />
a<br />
2 I2<br />
I l 0.5<br />
o. I 0.2 0.3 0.4 0.5<br />
SPECIFIC CAPACITY, IN GPM/FT<br />
T: 500 gpd/ft<br />
-<br />
O 2 3 4<br />
PUMPING PERIOD, IN D&YS<br />
Fig. 6 -Theoretical relation between specific capacity and radius of a well (A) and the<br />
pumping period (B).<br />
Specific capacities adjusted for well losses were then further adjusted to a common<br />
radius and pumping period. The average radius 0.5 foot, and pumping period, 12 hours,<br />
calculated from well-production and well-construction data were used as bases.<br />
Actual and adjusted specific capacities were divided by the total depths of penetration<br />
below the top of the shallow dolomite aquifer to determine actual and adjusted<br />
specific capacities per foot of drawdown per foot of penetration.<br />
No great accuracy is inferred for the adjusted specific capacities because they are<br />
based on estimated well-loss constants and on an average coefficient of storage and<br />
leakage coefficient. However, they come much closer to describing the relative<br />
productivity of aquifers than do the observed specific capacities based on pumping<br />
rates, pumping periods, and radii which vary from well to well.<br />
-<br />
129
The yields of wells are affected by many man-made factors such as partial clogging<br />
of the weil bore, partial penetration of formations, poor well construction, and acid<br />
treatment, in addition to natural conditions. All of these factors must be taken into<br />
consideration in appraising the relative, local and regional productivity of the<br />
formations and aquifers.<br />
Fig. 7 - Relation between specific capacities of wells in Silurian and Ordovician<br />
rocks overlain by glacial drift.<br />
ANALYSIS OF SPECIFIC-CAPACITY DATA<br />
Ordovician rocks<br />
Many shallow dolomite wells in northern Illinois tap more than one bedrock<br />
unit or shallow dolomite aquifer and are multiaquifer wells. The specific capacity of<br />
130
the multiaquifer well is the numeric sum of the specific capacities of the individual<br />
units or aquifers. The yields of individuai units or aquifers can be ascertained by<br />
studying the specific capacities of multiaquifer wells.<br />
$<br />
2<br />
I .o<br />
LJq<br />
LE<br />
2%<br />
“pl<br />
5 ~ 0.1<br />
@k<br />
$2<br />
i$<br />
3<br />
s<br />
L. O<br />
hQ<br />
LI*<br />
32<br />
JQ<br />
8 .o1<br />
sh.<br />
$8<br />
%<<br />
B<br />
2<br />
DATA FOR WELLS OPEN ONLY TO.<br />
GALENA-PLATTEVILLE<br />
DOLOMITE IN NORTHERN<br />
SILURIAN ROCKS IN<br />
NORTHWESTERN ILLINOIS<br />
.o01<br />
0.01 0.1 I 2 5 IO 20 3040506070 80 90 95 9899 99.99<br />
PERCENT OF WELLS<br />
Fig. 8 - Relation between specific capacities of wells in Silurian and Ordovician rocks<br />
overlain by bedrock.<br />
Specific capacities per foot of penetration for wells were tabulated in order of<br />
magnitude, and frequencies were computed by the Kimball (1946) method. Values<br />
of specific capacity per foot of penetration were then plotted against per cent of wells<br />
on logarithmic probability paper.<br />
Available specific-capacity data for wells in the Galena-Platteville Dolomite in<br />
northern Illinois were segregated into two categories: (I) wells in areas where the<br />
Galena-Platteville Dolomite is the uppermost bedrock and (2) wells in areas where the<br />
Galena-Platteville Dolomite is overlain by the Maquoketa Formation. A specific-<br />
131
capacity frequency graph for the case where the Galena-Platteville Dolomite is the<br />
uppermost bedrock is given in figure 7.<br />
A specific-capacity frequency graph for the case where the Galena-Platteville<br />
Dolomite is overlain by the Maquoketa Formation is given in figure 8. A comparison<br />
of figures 7 and 8 indicates that the productivity of the Galena-Platteville Dolomite is<br />
much lower in areas where the aquifer is overlain by bedrock than it is in areas where<br />
the aquifer directly underlies the glacial drift.<br />
PERCENT OF WELLS<br />
Fig. 9 - Relation between specific capacity and character of deposits of overlying<br />
Silurian rocks in northern Illinois.<br />
Silurian rocks<br />
Shallow dolomite wells penetrating silurian rocks in northern Illinois were<br />
segregated into two catagories, Niagaran and Alexandrian Series, depending upon<br />
the uppermost unit beneath the glacial drift at well sites. Specific-capacity frequency<br />
132
graphs were constructed as shown in figure 7. The graphs indicate that the Niagara<br />
and Alexandrian Series have about the same productivity in areas where the rocks<br />
immediately underlie the glacial drift.<br />
Average specific-capacity frequency graphs for the two cases (1) where Silurian<br />
rocks immediately underlie the glacial drift and (2) where Silurian rocks are overlain<br />
by bedrock are shown in figure 9. The graphs indicate that, in northern Illinois, the<br />
Silurian rocks yield much more water to wells in areas where the Silurian rocks are<br />
the uppermost bedrock than they do in areas where Silurian rocks underlie bedrock.<br />
PERCENT OF WELLS<br />
Fig. i0 - Specific-capacity frequency graphs for wells in north-eastern Illinois.<br />
Specific capacities for wells penetrating Silurian rocks in north-eastern Illinois were<br />
segregated into 10 areas (Lake County, McHenry-Lake Counties, northern, central<br />
and southern Cook County, Du Page County, Kane County, eastern and western<br />
Wil County and Kankakee County). Specific-capacity frequency graphs for the<br />
i0 categories are shown in figure 10.<br />
133
Mississippian rocks<br />
Wells in the Mississippian rocks were segregated into four categories: (1) wells in<br />
western Illinois uncased in the Keokuk-Burlington Formation ; (2) wells in southern<br />
Illinois uncased in the Keokuk-Burlington Formation; (3) wells in western Illinois<br />
uncased in the St. Genevieve-St. Louis-Salem-Warsaw Formations ; and (4) wells<br />
uncased in the Chester Formation in western south-central and southern Illinois.<br />
PERCENT OF WELLS<br />
Fig. 11 - Specific-capacity frequency graphs for wells in Mississippian rocks.<br />
A few wells in the second category were also uncased in the St. Genevieve-St. Louis-<br />
Salem-Warsaw Formations. The St. Genevieve-St. Louis-Salem-Warsaw Formations<br />
were thin in the above cases and did not contribute significantly to yields of the wells.<br />
The specific-capacity frequency graphs for the four categories are shown in figure 11.<br />
134
A summary of specific-capacity frequency graphs for wells open only to<br />
(Pennsylvanian) Mississippian, Silurian and Ordovician (Galena-Platteville Dolomite,<br />
Maquoketa Formation) are shown in figure 12. The graphs indicate the productivity<br />
of these rocks and show their yields relative to each other.<br />
PERCENT OF WELLS<br />
Fig. 12 - Specific-capacity frequency graphs for Pennsylvanian, Mississippian,<br />
Silurian and Ordovician rocks in Illinois.<br />
PROBABLE YIELDS OF WELLS<br />
The productivity of the limestone and dolomite aquifers are very inconsistent, and<br />
it is impossible to predict with a high degree of accuracy the yield of a well before<br />
drilling at any location in undeveloped areas. However, the probable yields of wells<br />
135
can be estimated from specific-capacity frequency graphs, aquifer thickness and areal<br />
geology maps, and water-level data.<br />
Probable yields of shallow dolomite wells were estimated from computed specific<br />
capacities and water-level data. Computed specific capacities were multiplied by<br />
available drawdowns to determine yields of wells. Pumping levels were limited to<br />
depths below the top of the dolomite equal to about one-third of the thickness of the<br />
aquifer. Under such conditions the most productive water-yielding openings in the<br />
dolomite will be discharging freely into the well, and maximum use of upper openings<br />
I----! ,i<br />
I_---, I---/-<br />
L---<br />
SCME OF MILES<br />
O 10 20 30 40 50<br />
-------.<br />
Fig. 13 - Estimated yields of shallow dolomite wells in northern Illinois.<br />
is attained. Additional discharge with pumping levels much below the upper one-third<br />
of the aquifer will be accompanied by rapidly declining specific capacities and yields<br />
of wells.<br />
The probable range of yields of shallow dolomite wells in northern Illinois is shown<br />
in figure 13.<br />
The specific capacities used to compute probable yields were adjusted to a well<br />
radius of 0.5 foot and pumping period of 12 hours; therefore, the probable yields of<br />
wells given in figure 13 are valid only for these conditions.<br />
136
For design purposes, one may wish to base the computation of the probable yield<br />
of a well on the specific capacity with a particular frequency other than 50 per cent.<br />
In this event, the probable yield indicated in figure 13 is multiplied by the ratio of the<br />
specific capacity with the selected frequency (see figs. 7-12) and the specific capacity<br />
with a 50 per cent frequency to obtain the probable yield of the well based on the<br />
selected frequency.<br />
Highest yielding wells will probably be located in areas where possibilities for<br />
occurrence of sand and gravel is best and in bedrock upland areas.<br />
Fig. 14 - Specific capacities of selected wells in Mississippian rocks.<br />
137
The statistical analyses of specific-capacity data for wells in Mississippian rocks<br />
indicate that the chances of obtaining a well in Mississippian rocks with a yield<br />
exceeding 30 gpm are poor in most areas (fig. 14).<br />
SUMMARY<br />
Groundwater in the dolomite and limestone formations of the Mississippian,<br />
Silurian and Ordovician (Galena-Platteville) rocks occurs in joints, fissures, solution<br />
cavities and other openings. The water-yielding openings are irregularly distributed<br />
both vertically and horizontally. However, controlled pumping tests indicate that the<br />
openings in the silurian dolomite aquifer are interconnected over considerable<br />
distances. This observation is further supported by the fact that many wells have high<br />
yields, and conformable piezometric surface maps could be constructed from wells<br />
in dolomite aquifers. Since an interconnexion of openings exists, it is believed that<br />
the leaky artesian formula used in the controlled pumping tests describes the drawdown<br />
on an areal basis but it does not give account of drawdowns in and around the pumped<br />
well. The water flows directly into wells through crevices and fractures and the flow<br />
system assumes at least some of the characteristics of a linear channel in the immediate<br />
vicinity of a pumped well where the flow departs from laminar. Although controlled<br />
pumping tests are not frequently available, short-term tests of pumped wells are<br />
usually numerous. The calculation and utilization of specific-capacity data for estimates<br />
of the coefficients of transmissibility and for statistical analysis, which in turn could<br />
be used to estimate the probable yields are probably the most important facts considered<br />
here. Statistical analysis of specific-capacity data provides numerical values for planning<br />
purposes as well as a basis for judging whether or not significant relationships exist<br />
between the yields of limestone and dolomite wells and geohydrologic controls.<br />
Specific-capacity frequency graphs also shed much light on the rôle of individual<br />
aquifer units uncapped in wells.<br />
It is recognized that exact prediction of yields of wells in undeveloped areas is<br />
almost impossible. However, estimated probable yields of wells that will be useful<br />
for many planning purposes can be obtained by using the results of controlled pumping<br />
tests, estimated coefficients of transmissibility from specific capacities, specific-capacity<br />
frequency graphs, and other known geohydrologic data.<br />
REFERENCES<br />
COOPER, H.H., and JACOB, C.E. 1946. A Generalized Graphical Method for Evaluating<br />
Formation Constants and Summarizing Well-field History. Am. Geophys. Union<br />
Trans., Vol. 21, No. 4, pp. 526-534.<br />
CSALLANY, S. 1965. YieIds of Wells in PennsyZvanian and Mississippian r0ck.s in Ifìinois.<br />
(Ill. State Water Survey, Report of Investigation, in print),<br />
CSALLANY, S., and WALTON, W. C. 1963. Yields of Shallow Dolomite Wells in Northern<br />
Zllinois, 43 p. (Ill. State Water Survey, Report of Investigation 46).<br />
HANTUSH, M.S. 1956. Analysis of Data from Pumping Tests in Leaky Aquifers. Am.<br />
Geophys. Union Trans., Vol. 31, No. 6., pp. 102-114.<br />
HANTUSH, M.S.,and JACOB, C.E. 1955. Non-Steady Radial Flow in an Infinite Leaky<br />
Aquifer. Am. Geophys. Union Trans., Vol. 36, No. 1, pp. 95-100.<br />
KIMBALL. B.F. 1946. Assignment of Frequencies to a Completely Ordered Set of<br />
Sample Sata. Am. Geophys. Union Trans., Vol. 21, No. 6, pp. 843-846.<br />
THETS, C.V. 1935. The Relation Between the Lowering of the Piezometric Surface and<br />
the Rate and Duration of Discharge of a Well Using Ground-water Storage. Am.<br />
Geopkys. Union Trans., 16th Annual Meeting, pt. 2 (Vol. 16, No. 2) pp. 519-524.<br />
WALTON, W.C. 1960. Leaky Artesian Aquifer Conditions in Illinois. 21 p. (III. State<br />
Water Survey, Report of Investigation 39).<br />
ZEIZEL, A. J., WALTON, W. C., SASMAN, R.T., and PRICKETT, T.A. 1962. Ground- Water<br />
Resources ofDupage County, Illinois. 103 p. (111. State Water Survey and III. State<br />
Geological Survey, Cooperative Ground-water Report 2).<br />
138
ABSTRACT<br />
EFFECTS OF FOREST COVER<br />
UPON HYDROLOGIC CHARACTERISTICS<br />
OF A SMALL WATERSHED<br />
IN THE LIMESTONE REGION<br />
OF EAST TENNESSEE<br />
Paul C. SODEMANN and Jones E. TYSZNGER<br />
Tennessee Valley Authority Knoxville, Tennessee<br />
White Hollow watershed with a drainage area of 2.68 square miles is located<br />
in eastern Tennessee and lies in the Valley and Ridge physiographic province.<br />
The area is underlain by Knox dolomite and is typical of many Appalachian Valley<br />
watersheds.The watershed had been under various levels of cultivation for about 150<br />
years until 1934, when it was acquired by the Tennessee Valley Authority and placed<br />
under forest protection and management. Streamflow, rainfall, and sediment collection<br />
stations were established to study the effects upon runoff and soil erosion of changes<br />
in the vegetal cover of a watershed taken out of cultivation. The most significant<br />
hydrologic changes to occur during the 30-year period of record were the reduction of<br />
summer peak discharges, a change in the time distribution of surface runoff, and a<br />
reduction of total sediment loads. No appreciable change has occurred in the water<br />
yield from the watershed and there has been no change in the volume of either surface<br />
runoff or ground-water runoff. Future plans for the watershed include continued<br />
hydrologic observations while the forest undergoes selective cutting consistent with<br />
the promotion of wildlife habitat.<br />
RES UM^<br />
Effœts d’une couverture forestière sur les caractdristiques hydroligiques d’un petit bassin<br />
hydrographique de la zone calcaire du Tennessee oriental<br />
Le bassin hydrographique de White Hollow, dont l’aire d’alimentation couvre<br />
6,94 kma, se trouve dans le Tennessee orientai et dans la province physiographique<br />
Valley and Ridge. I1 repose sur des dolomies de Knox et est typique de nombreux<br />
bassins hydrographiques du sillon appalachien. En 1934, il était cultivé plus ou moins<br />
depuis 150 ans environ. La Tennessee Valley Authority en fit alors l’acquisition et. le<br />
confia au service de la protection et de l’aménagement des forêts. Des stations pluvio-<br />
métriques et des stations pour recueillir les sédiments et pour mesurer le débit des cours<br />
d’eau y furent installées en vue d’étudier les effets que les modifications de la couverture<br />
vtgétale d’un bassin qui avait cessé d’être cultivé produisaient sur le ruissellement et<br />
sur l’érosion des sois. Les changements hydrologiques les plus importants qui se sont<br />
produits en trente années d’observation sont les suivants : abaissement du débit<br />
maximum d’été, modification de la répartition dans le temps du ruissellement super-<br />
ficiel et diminution de la masse totale des sédiments transportés. Aucun changement<br />
appréciable n’est intervenu dans le débit global du bassin et aucun changement n’a<br />
été noté ni dans le volume du ruissellement superficiel, ni dans l’écoulement des eaux<br />
souterraines. On projette de poursuivre dans ce bassin les observations hydrologiques<br />
de façon continue, tandis que la forêt subira des coupes sélectives compatibles avec<br />
le développement de la faune.<br />
INTRODUCTION<br />
In 1934 much of the area within the Appalachian Valley consisted of small, badly<br />
eroded farms which produced only a marginal income for the farmer. The best use for<br />
most of the area seemed to be timber production.<br />
139
The Tennessee Valley Authority needed information on how the change in vegetal<br />
cover from eroded, partially cultivated land to forest would affect the hydrology of<br />
a watershed. The TVA land acquisition program for Norris Reservoir provided the<br />
opportunity for such a study. Much of this land was under cultivation, and when people<br />
began moving out of the purchased area an excellent opportunity was provided for<br />
research into the effect of changes in land cover upon runoff and soil erosion. The<br />
headwater area of White Creek, known locally as White Hollow, was selected for<br />
study and the project began in late 1934.<br />
THE WHITE HOLLOW WATERSHED<br />
Location. The general location of the White Hollow watershed is shown in figure 1.<br />
It is situated in the eastern part of the Tennessee Valley in the northern portion of<br />
Union County, Tennessee, and lies between the Powell and Clinch River arms of<br />
Norris Reservoir. White Creek, a tributary of the Clinch River, has a total drainage<br />
Fig. 1 - Location Map of White Hollow Watershed in Tennessee Valley Region.<br />
area of approximately 7 square miles. The area under investigation includes only the<br />
upper 1715 acres or 2.68 square miles of the White Creek drainage area. This area had<br />
been settled for about 150 years with most of it under cultivation at one time or the<br />
other.<br />
Topography. Figure 2 is a topographic map of the watershed. The topography is<br />
fairly typical of the Valley and Ridge physiographic province which lies between the<br />
Appalachian Mountain region on the southeast and the Cumberland Plateau on the<br />
northwest.<br />
The watershed ranges in elevation from 1,680 feet in the northeast corner to 1,080<br />
feet at the lower end of the watershed. The elevation of the major portion of the rim<br />
is above 1,500 feet. The fall of 500 to 600 feet from ridge to valley averages 300 or more<br />
feet per mile. The side slopes of the small tributary hollows are very steep. The average<br />
slope on the watershed is approximately 30 percent. Outcrops of limestone are widely<br />
scattered on the hillsides and in the stream beds. A number of sinkholes are located<br />
along the upper periphery of the watershed.<br />
140
The area is drained by White Creek, its principal tributary, Roe Branch, and a half<br />
dozen other tributaries to these streams. The tributary hollows are dry much of the<br />
time.<br />
~ . ~ ~ , d ~ ~ ,<br />
a *cord", n11s.m 'il'<br />
SilUI IOOP Iomlr/r<br />
c-.------=-<br />
Fig. 2 - Topographic Map of White Hollow Watershed.<br />
Geology. The Valley and Ridge physiographic province represents the eastern<br />
margin of the Paleozoic interior sea. Upon emerging from the sea the newer surface<br />
was divided into two physiographic provinces by the crumpling of its eastern margin,<br />
while the beds farther west and north were upraised in almost horizontal position.<br />
The eastern margin became the Folded Appalachian or Valley and Ridge province<br />
and the remainder is the Appalachian Plateau province (Fenneman, 1938). Within the<br />
White Hollow region the underlying rocks range in age from Lower Ordovician to<br />
Upper Cambrian and are generally of the Knox dolomite group. Extensive geologic<br />
work on the dolomitic phases of the Knox has resulted in its subdivision into numerous<br />
formations of which two, the Chepultepec dolomite and Copper Ridge dolomite, are<br />
the predominant formations of the White Hollow watershed as shown in figure 3.<br />
The ridges are generally underlain by Chepultepec dolomite which consists of 700<br />
to 750 feet of light-colored, well bedded, fine- to medium-grained dolomite including<br />
occasional layers of silty dolomite and dark dolomite. Weathering of the formation<br />
produces a clay containing a porous, locally massive, light-colored and fine-grained<br />
chert of dull luster. The Copper Ridge dolomite which underlies the valleys consists of<br />
900 to 1000 feet of dark crystalline, knotty dolomite interbedded with light-gray<br />
fine-grained dolomite. Dark chert nodules and thin layers of oolitic chert are diagnostic<br />
of the upper portion of the formation. Weathering produces a reddish orange to dark<br />
red clay residuum that contains much dark jagged, rough chert (DeBuchananne and<br />
Richardson, 1956).<br />
Ground water in the watershed is confined to fractures, cavities, and other channels.<br />
There are fifty-two springs located within the watershed, and estimated discharges<br />
range from less than one gallon per minute up to 200 gallons per minute. A number of<br />
wells were drilled in the area to depths which reached around 30 feet without obtaining<br />
water.<br />
141
Soils. Soils in the White Hollow watershed were classified by the U. S. Department<br />
of Agriculture in 1937-39 (USDA 1953). Soil classifications range from one to five<br />
and express the relative degree of suitability of the soils for agriculture as commonly<br />
practiced in the region. The first-, second-, and third-class soils are suitable for agriculture,<br />
while fourth-class soils are satisfactory for pasture or forest and fifth-class<br />
soils are suitable only for forest production.<br />
Fig. 3 - Geologic Map of White Hollow Watershed. Adapted from geologic map<br />
of White Hollow Quadrangle, Tennessee, by C. Pratt Finlayson, Tennessee Depart-<br />
ment of Conservation, Division of Geology.<br />
There are no first-class soils in the White Hollow watershed. The soils on 5.6 percen.<br />
of the area are classified as second class and 14.7 percent of the area as third classt<br />
Fourth-class soils cover 7.2 percent of the area. The greatest part, 72.5 percent, of the<br />
watershed is covered by soils rated as fifth-class.<br />
The soils are generally shallow with moderate to rapid internal drainage and range<br />
from silty loams to cherty silt loams.<br />
Climafe. The climate in the White Hollow region is temperate. Mean temperature<br />
in the summer is about 75 degrees and in winter is about 38 degrees. The average<br />
frost-free period is about 175 days. Annual precipitation during the 30-year period of<br />
study averaged 46.96 inches, and ranged from 35.57 to 63.57 inches. Rainfall of high<br />
intensity occurs frequently during the summer months.<br />
Cooer. Forestry is the best type of land use for the greater part of the White Hollow<br />
watershed. However, nearly all of the watershed had been cleared and under cultivation<br />
some time during the 150 or more years of settlement. In 1936, a survey of the cover<br />
conditions showed forest 66 percent, cultivated 4 percent, abandoned land 26 percent,<br />
and grass land 4 percent. The 30 years of protection and management on this watershed<br />
have greatly improved cover conditions. Presently, less than one acre along the inside<br />
edge of the watershed is under cultivation and the rest of the watershed is classified<br />
as forest.<br />
142
WATERSHED PROTECTION AND TREATMENT<br />
Since 1934 the area has been under management which has included over-all<br />
protection, erosion-control work, reforestation, and management for natural regen-<br />
eration and improvement of natural vegetal cover.<br />
Erosion-Contro[ Work. Because of the treatment to which the White Hollow land<br />
has been subjected during the period of human occupancy, considerable erosion<br />
existed when the investigation began. Gullies had formed in nearly every hollow and<br />
there was evidence that sheet erosion had removed much of the topsoil from the<br />
cleared land.<br />
During the period September 1934 to February 1935, extensive erosion-control<br />
work was carried out. The work included building check dams, bank protection, brush<br />
paving, and tree planting. By 1950 practically no erosion was occurring in the treated<br />
areas and even the steepest gullies had become stabilized.<br />
Tree Planting. Extensive reforestation of the White Hollow watershed was initiated<br />
in 1938. During 1938 through 1942 a total of 588 acres were planted converting practi-<br />
cally all of the originally cleared land to forest. The principal species planted were<br />
shortleaf pine, white pine, and yellow poplar.<br />
Notural Reproduction. The most rapid period of cover change occurred during<br />
1936 and 1937 when the formerly cultivated and abandoned land became covered with<br />
a wide variety of herbaceous and woody species. The initial weed growth has been<br />
gradually replaced by forest cover, and the protective cover of the watershed has con-<br />
tinued to improve with each year.<br />
Protection and Maintenance. Despite the protection provided since the beginning<br />
of the project, several fires burned on the area between 1936 and 1946. The most severe<br />
burn took place in April 1946; fires covered approximately 150 acres in the north and<br />
west portions of the area.<br />
In 1947, an infestation of the southern pine bark beetle killed shortleaf pine saw-<br />
timber on approximately 25 acres, making it necessary to log 300,000 feet of timber.<br />
The operation was carefully managed and no appreciable erosion occurred.<br />
INSTRUMENTATION<br />
Precipitation in the watershed is measured by a single recording gage.<br />
A stream gage was established at the lower end of the study area in November<br />
1934. The installation consists of a continuous recorder in a concrete gage house on<br />
the right bank of White Creek. The control is a modification of the Albany weir<br />
developed by the U. S. Geological Survey, and is located about 12 feet downstream from<br />
the gage house.<br />
From July 1935 to August 1949, suspended sediment was measured by samples<br />
taken by an observer living near the watershed. This arrangement proved unsatis-<br />
factory and in August 1949 a continuous sediment sampler was placed in operation.<br />
This sampler was developed by the TVA and was designed to take a continuous sample<br />
of the total stream discharge and store this in a concrete tank downstream.<br />
In March 1964 in anticipation of needs for future studies, a hygrothermograph to<br />
measure air temperatures and relative humidity and a water-temperature recorder<br />
were installed in the watershed.<br />
143
EFFECT OF IMPROVED COVER UPON HYDROLOGY OF THE WATERSHED<br />
.The effects of improved forest cover upon the hydrology of the White Hollow<br />
watershed were analyzed by studying in detail the water yield from the watershed and<br />
the changes in the storm hydrograph. Sediment loads were also studied because these<br />
and peak discharges are the hydrologic factors most responsive to watershed nianage-<br />
ment.<br />
WATER YIELD<br />
Annual Precipitation and Runoff. Annual runoff from the watershed varied from<br />
6.84 to 30.03 inches during the 30-year period and averaged 18.09 inches, This is about<br />
40 percent of the average annual rainfall of 46.96 inches over the same period. The<br />
average loss of 29 inches, measured as the difference between rainfall and runoff,<br />
agrees very well with similar losses from other watersheds in the Tennessee Valley.<br />
This is an indication that there are no unusually large amounts of runoff by-passing<br />
the gaging station. The average loss in the eastern part of the Tennessee Valley, of<br />
which the White Hollow watershed is a part, is about 27.5 inches.<br />
Table 1 compares the average annual precipitation and total, surface, and groundwater<br />
runoff for the 5-year period 1957-1961 with the 30-year period 1935-1964. Total<br />
precipitation and runoff during the 5-year period was about equal to the average, for<br />
the total period. The division of surface and ground-water components is somewhat<br />
different, but it is slight and is not considered significant. It is clear that the basic<br />
relationships between precipitation and runoff have not been greatly altered.<br />
TABLE 1<br />
Auerage annual precipitation and runoff’<br />
All values are in inches<br />
Runoff<br />
Period Precipitation Total Surface G round-Water<br />
1935- 1964 46.96 18.09 6.07 12.02<br />
1957-1961 47.04 18.11 5.40 12.71<br />
Precipitation und Total Runoff Summarized by Seasons. As would be expected,<br />
seasonal precipitation and runoff varied considerably from year to year. However,<br />
the average precipitation during the winter season was greatest, about 15 inches,<br />
while during the remaining three seasons precipitation averaged between 10 and 1 i<br />
inches. Runoff was also greatest during the winter season when about half the annual<br />
total occurred. Runoff decreased during the spring season to a minimum during the<br />
summer months, with a slight recovery in the last or fall quarter of the year.<br />
There has been no marked change in the seasonal runoff pattern during the period<br />
of record. For example, during the third or summer quarter of the year which is<br />
generally the season of lowest runoff, total values have about the same order of magni-<br />
tude in the early portion of the project as in latest years.<br />
Accuniuluted Precipitation, Runoff, und Eiiupotranspirutian plus Other Losses.<br />
Accumulated precipitation, runoff, and evapotranspiration plus other losses plotted<br />
against time for the 30-year period are shown in figure 4. These curves reflect the years<br />
144
of deficient precipitation such as 1940-1942 and the years of excess such as 1950-1951<br />
and 1961-1962. The average slope for the first five years of record, 47.3 inches per<br />
year, is about the same as the slope for the 5-year period 1957-1961, 47.0 inches per<br />
year, indicating similarity in average rate of precipitation in the two 5-year periods.<br />
Fig. 4 - Accumulated Precipitation, Runoff, and Evapotranspiration Plus Losses,<br />
1935-1964.<br />
The slope of the runoff curve for the corresponding periods, 18.7 and 18.1 inches per<br />
year, indicates no significant change in the over-all water yield. The curve of accu-<br />
mulated evapotranspiration plus other losses is the difference between precipitation<br />
and total runoff. This factor averages 28.6 inches per year during the first 5-year<br />
period, compared with 28.9 inches per year during the latter 5-year period, 1957-1961,<br />
and an average for the entire period of 28.9 inches per year. This indicates that no<br />
detectable change has occurred in the water use of the watershed.<br />
Double Mass Curves. Figure 5 represents the relationship between precipitation<br />
and total runoff and its components of surface and ground-water runoff for the period<br />
of study through 1964. Each curve exhibits the same general relationship with similar<br />
slopes in the early and latter portions of the record. Variations in the slope are noted<br />
for years of deficient and excessive precipitation.<br />
From this relationship there is no indication that interchange has taken place<br />
between the runoff components; that is, there is no increase in ground-water runoff<br />
with a corresponding decrease in surface runoff or vice versa.<br />
145
The double mass curve of precipitation and evapotranspiration was also investi-<br />
gated. Except for seasonal variation this curve had a constant slope throughout the<br />
period of record.<br />
ACCUMULATED RUNOFF IN H.ICIvS<br />
Fig. 5 - Double Mass Curves of Precipitation and Runoff.<br />
Accumulated Precipitation and Runof by Seasons. Although there was no apparent<br />
change in annual runoff, the possibility existed of balancing changes between winter<br />
and summer seasons. To investigate this, the data were divided into 6-month periods<br />
approximating summer and winter seasons and representative periods accumulated.<br />
Total precipitation and runoff for two periods in the record are compared in table 2.<br />
TABLE 2<br />
Accumulared precipitation and runoff by seasons<br />
All values are in inches<br />
Summer Season Winter Season<br />
~~ ~~<br />
1935-1939 1957-1961 1935-1939 1957-1961<br />
Precipitation 104.71 108.40 131.80 126.83<br />
Runoff 32.82 36. I3 60.72 54.45<br />
From this comparison there is a suggestion of reduced winter and increased summer<br />
yield, but again it is slight and not significant.<br />
146
THE STORM HYDROGRAPH<br />
Storm Precipitation and Runoff. Storm runoff characteristics of the watershed were<br />
studied for more than 500 individual storms selected from the 30-year period of record.<br />
To determine whether any change in the relationship between storm precipitation and<br />
runoff occurred during the period, a simple correlation of storm runoff and storm<br />
precipitation was made. A second independent variable, season, was accounted for to<br />
a certain extent by dividing the data into winter and summer groups of six months<br />
each. A third independent variable, soil moisture condition, was based upon initial<br />
stream discharge (TVA 1961). By considering these three independent variables the<br />
relationship was developed. Winter and summer season storm runoff volumes for<br />
representative storm precipitation amounts and moisture indexes are given in table B.<br />
TABLE 3<br />
Storm runoff for representative precipitation amounts<br />
All values are in inches<br />
Storm Runoff in Inches<br />
Precipitation Winter Summer<br />
Amount Index 1 Index 2 Index 3 Index 1 Index 2 Index 3<br />
1 .o 0.20 0.11 0.02 0.07 0.02 0.01<br />
2.0 0.80 0.46 0.11 0.40 0.08 0.02<br />
3.0 1.83 0.87 0.31 0.23 0.05<br />
The data were studied by year of occurrence, and deviations of individual points<br />
from the index lines were plotted against time. These studies indicated no significant<br />
correlation of runoff with respect to time. This is in agreement with the water-yield<br />
studies previously discussed.<br />
Storm runoff from White Hollow watershed is only a small portion of the precipi-<br />
tation for storms ordinarily experienced. The greatest summer storm, with precipi-<br />
tation of 5.1 inches, which occurred during intermediate moisture conditions produced<br />
only 0.69 inch of runoff. The greatest winter storm, with precipitation of 4.91 inches,<br />
also occurring under intermediate conditions of moisture, resulted in 2.69 inches of<br />
storm runoff.<br />
Frequency of Peak Discharges. Large reductions in peak discharges were experienced<br />
during the period of study, particularly in the summer season. As shown in figure 6<br />
most of the reduction occurred during the first two years of record, showing the effect<br />
of the early erosion control work. After 1937 small reductions continued until 1958;<br />
after this time, little further change has taken place. Relatively large peak discharges<br />
can still occur during the summer season under extreme conditions of antecedent<br />
moisture and rainfall intensities. However, the largest summer peak discharge<br />
experienced after 1937 was 82 cubic feet per second in 1943, and the largest since 1958<br />
was 33.8 cubic feet per second in the summer of 1963. Both of these peaks were con-<br />
siderably lower than the highest three peaks in the summer of 1935.<br />
Reductions were also experienced in the winter-season peak discharge frequency<br />
but to a considerably less degree.<br />
147
Peak Discharge Rates. Peak discharge rates were reduced most notably in the sum-<br />
mer season and during the first few years of the study. Figure 7 shows the most striking<br />
reduction in summer season peak discharges occurred between the initial status of<br />
cover represented by the years 1935-1936 and the succeeding period 1937-1938. During<br />
these years the first cover gf weeds became established on previously cultivated and<br />
grazed areas. Changes sulisequent to 1937 were comparatively small as the forest<br />
ANNUAL FREQUENCY-EQUALCD OR EXCEEDED<br />
Fig. 6 - Frequency of Peak Discharges, Summer Season.<br />
stands were left undisturbed and the cover on open land gradually changed to her-<br />
baceous growth and finally to young forest cover. Greater reductions were achieved<br />
under conditions of wet than of dry soil, and under conditions of high-intensity rain-<br />
fall. For wet soil conditions, peak discharge rates continued to decline until about<br />
1950; after this time there has been no appreciable change. Under dry soil conditions<br />
all reduction in peak rates occurred before 1942. At the present time peak discharges<br />
do not increase greatly with intensity as they did in the initiai years.<br />
148
When comparing the relation between summer peak discharges for the initial<br />
watershed conditions represented by the years 1935-1936 and the latest period 1950-<br />
1964, for initially dry soil and rainfall intensity of 0.4 to 1.0 inch per hour, the reduc-<br />
tions in peak discharge have been from 73 to 92 percent. Total reductions for initially<br />
wet coil conditions range from 92 to 95 percent.<br />
Fig. 7 - Rainfall Intensity versus Peak Discharge, Summer Season.<br />
Winter season peak discharge reduction was accomplished by 1950 similar to the<br />
summer season. These reductions amounted to nearly 30 percent for storms with higher<br />
storm runoff volumes.<br />
Ground- Water Recession. No detectable difference was found in the rates of ground-<br />
water recession during the 30-year period. The average rate of recession over the range<br />
of ground-water discharge, expressed as a ratio of discharge to discharge 24 hours<br />
earlier, is 0.925. There were several occasions during the 30-year record in which no<br />
rainfall occurred for as much as 30 days, yet base flows continued at a relatively high<br />
rate. During these long recession periods, the rate of depletion was very low. Recession<br />
factors ranged from 0.97 to 0.99. This seems to indicate a large source area for base<br />
flow such as is usually associated with deep soils rather than the shallow soils found<br />
in the White Hollow watershed.<br />
Storm Hydrograph. A separate study has been made (Snyder, 1955) of the hydro-<br />
graphs of selected winter storms occurring between 1937 and 1950. This study was<br />
made to eliminate the effect of varying rainfall duration and intensity pattern so that<br />
approximate hydrographs of short defined duration could be obtained from complex<br />
storms. This study showed a reduction in peak discharge in the magnitude of 50 percent<br />
for storms in the later years compared with those prior to 1940. The time for 25 percent<br />
149
of storm runoff to occur increased from 4 to 8 hours, and the time for 50 percent moff<br />
increased from 9 to 15 hours.<br />
EFFECT OF IMPROVED COVER UPON SEDIMENT<br />
Although continuous records of suspended sediment loads were not available, it<br />
was possible to compare total sediment loads for a two-year period early in the record,<br />
1935-1937. with a period of comparable rainfall late in the period, 1957-1958. Total<br />
sediment during the early period was about 1,300 tons, while during the two years<br />
1957-1958, the total suspended sediment passing the gaging station was 100 tons,<br />
a reduction of more than 90 percent.<br />
SUMMARY<br />
Water Yield. The foregoing studies indicate that the relationship between precipitation<br />
and total runoff in the White Hollow watershed has not changed significantly<br />
during the 30-year study period. In a recent 5-year period when average annual rainfall<br />
was equal to the average for the 30-year period, the corresponding runoff was also<br />
equal to the 30-year average. Although the division of surface and ground-water runoff<br />
was somewhat different during these periods, the difference is slight and is not considered<br />
significant. Runoff correlates closely with the observed precipitation throughout<br />
the 30 years. No interchange of runoff between months or seasons has been observed,<br />
and no measurable change has taken place in the total quantity of evapotranspiration<br />
plus other losses.<br />
Although the mass curve analysis made in this study showed no significant change<br />
in water yield, an independent study did show a slight reduction in yield. This unpublished<br />
study utilized a water yield model developed by W.M. Snyder (1963). The<br />
reduction indicated was small, but it does show a possible trend toward less water yield.<br />
Storm Hydrograph. The studies show that the principal hydrologic effect of land-use<br />
changes has been to retard the surface runoff. This effect has been far more pronounced<br />
during the summer than during the winter season. Striking reductions in rates of peak<br />
discharge occurred during the initial years of the study period, and further but less<br />
reductions have continued. Summer peak discharges now range from 5 to 27 percent<br />
as high as those initially observed. Not only are peak discharges lower in the summer<br />
but also the entire hydrograph has been modified; storm discharges at present are<br />
occurring at lower rates and for longer periods.<br />
Peak discharges in the winter season have also been reduced and the shape of the<br />
hydrograph has been changed by the delay of runoff. However, these changes have been<br />
much less striking than similar changes in the hydrographs of summer storms.<br />
The changes in land use have not had a measurable effect upon the volumes of<br />
surface and ground-water runoff during either the winter or the summer season.<br />
Ground-water outflow rates are unchanged.<br />
Suspended Sediment. The annual suspended sediment load from the White Hollow<br />
watershed has been reduced as a result of the substantial improvement in forest cover.<br />
A two-year period late in the 30-year record produced less than 10 percent as much<br />
suspended sediment load as a similar period with comparable rainfall early in the period<br />
of record. The greatest reduction in sediment rate occurred in the early years. Incremen-<br />
tal reduction has become gradually less so that additional reductions in the most<br />
recent years are very small.<br />
150
CONCLUSIONS<br />
A change in forest cover on a watershed is usually associated with a change in<br />
water yield. Eschner and Satterlund (1965), for instance, noted a decrease in water<br />
yield with an increase in forest cover over a 39-year period. Hewlett and Hibbert (1961),<br />
Reinhart and Trimble (1962), and others have shown increases in water yield after<br />
forest cutting. In the White Hollow watershed study no significant change was noted<br />
in water yield. This may be attributed to the relationship between the watershed surface<br />
and soil characteristics and the underlying limestone. The water in the soil which is<br />
available for evapotranspiration apparently has not changed as a result of the increase<br />
in forest cover. The increasing density of vegetal cover with consequent litter and<br />
humus over the watershed retards the overland flow and allows it to infiltrate through<br />
the relatively shallow soils and into the fractures and channels of the underlying<br />
limestone. Here it becomes unavailable for evapotranspiration. Water from these<br />
fractures and channels emerges again as springs in and near the stream channels. Thus<br />
the only effect of the increase in forest cover is to retard the runoff with no measurable<br />
change in water yield.<br />
High base flows are not usually associated with shallow soils such as are found in<br />
the White Hollow watershed. The structure of the underlying limestone may be a<br />
factor in the sustained flow experienced during the low flow months of the year, and<br />
the extended drought periods. The dip of the bedding planes of the rock structure<br />
underlying the general area of the watershed is such that it is quite possible for water<br />
from outside the surface boundaries of the watershed to enter the limestone fractures<br />
and emerge in the streams of White Hollow.<br />
It is significant that the improved forest cover and resulting watershed protection<br />
was not at the expense of the over-all water yield from the White Hollow watershed.<br />
REFERENCES<br />
DEBUCHANANNE, G. B., and RICHARDSON, R. M., Ground-water Resources of East<br />
Tennessee, Tennessee Department of Conservation, Division of Geology Bulletin,<br />
Part 1, 1956.<br />
ESCHNER, Arthur R., and SATTERLUND, Donald R., Forest Protection and Streamflow<br />
from an Adirondack Watershed, Presented at the Forty-sixth Annual Meeting<br />
of the A G U, 1965.<br />
FENNEMAN, N. W., Physiography of Eastern United States, McGraw-Hill, New York, 1938.<br />
HEWLETT, John D., and HIBBERT, Alden R., Increases in Water Yield after Several<br />
Types of Forest Cutting. Quarterly BuIIetin, IASH, Louvain, Belgium, Sept. 1961.<br />
REINHART, Kenneth G., and TRIMBLE, George R., Jr., Forest Cutting and Increased<br />
Water Yield. Journal American Water Works Association, Vol. 54, No. 12, Dec.<br />
1962.<br />
SNYDER, Willard M., Hydrograph Analysis by the Method of Least Squares, ASCE<br />
Proceedings Separate, No. 793, September 1955.<br />
SNYDER, Willard M., A Water Yield Model Derived from Monthly Runoff Data.<br />
Publication No. 63 of the IASH Symposium Surface Water, 1963.<br />
Tennessee Valley Authority, Division of Water Control Planning, Hydraulic Data<br />
Branch, Forest Cover Improvement Influences upon Hydrologic Characteristics<br />
of White Hollow Watershed, 1935-1958, May 1961.<br />
United States Department of Agriculture, Soil Conservation Service, Soil Survey<br />
of the Norris Area, Tennessee, Series 1939, No. 19, issued August 1953.<br />
151
RÉSUMÉ<br />
LA CIRCULATION DES EAUX KARSTIQUES<br />
DANS LES COMPLEXES CARBONATES ET<br />
SON BlLAN QUANTITATIF<br />
Eugen KULLMAN<br />
(Tchécolovaquie)<br />
L’auteur analyse les phénomènes de réalimentation et d’épuisement des réserves<br />
d’eaux karstiques et présente une méthode particulière de bilan utilisée pour l’évalua-<br />
tion quantitative des eaux triassiques des Carpates Occidentales et pour l’évaluation<br />
de leur passage aux complexes voisins dans les conditions tectoniques très compliquées.<br />
Dans les Carpates Occidentales, le problème de la réalimentation des complexes<br />
carbonatés par des eaux karstiques et celui de leur épuisement par rapport aux pré-<br />
cipitations présente toute une série de phénomènes hydrogéologiques très importants.<br />
Une évaluation complète du bilan hydrogéologique des zones choisies permet d’expli-<br />
quer les phénomènes plus généraux de la réalimentation des réserves en eaux karstiques<br />
des Carpates Occidentales dont l’importance est primordiale durant la période janvier-<br />
avril.<br />
L’évaluation du bilan des eaux karstiques des Carpates Occidentales est basée sur<br />
une méthode particulière fondée sur la connaissance des écoulements souterrains<br />
spécifiques des différents complexes carbonatés. Par analogie, on évalue quantitative-<br />
ment le volume des eaux karstiques et leur passage aux complexes voisins dans les<br />
conditions tectoniques très compliquées d’après la connaissance des écoulements<br />
spécifiques des eaux karstiques dans des conditions tectoniques très simples offrant<br />
la possibilité de déterminer avec précision le total de leur écoulement spécifique.<br />
Au cours des dernières années on a beaucoup travaillé à la solution des’problèmes<br />
des écoulements spécifiques des eaux karstiques et de leurs changements par rapport<br />
aux conditions géologiques, climatiques et en vue d’établir leur bilan. Cette méthode<br />
était appliquée à l’évaluation quantitative du passage des eaux karstiques aux couches<br />
voisines dans toute la série de montagnes des Carpates Occidentales. Comme exemple,<br />
on peut citer les Petites Carpates et l’application de cette méthode à la solution du<br />
problème du passage caché des eaux karstiques du complexe carbonaté situé sous les<br />
sédiments tertiaires et quaternaires de la plaine voisine Záhorská nEina par analogie<br />
avec les complexes voisins dont l’écoulement spécifique souterrain est connu. Nous<br />
avons évalué que 40-50% des eaux souterraines du complexe carbonaté passent sous<br />
les couches géologiques de la plaine voisine. L’évaluation du bilan de cette plaine a<br />
confirmé ces résultats.<br />
La solution minutieuse du problème des écoulements spécifiques des eaux karstiques<br />
dans les différentes conditions géologiques, tectoniques et climatiques des Carpates<br />
Occidentales ont permis d’effectuer un calcul grossier de la circulation supposée des<br />
eaux karstiques des Carpates Occidentales ou le complexe calcaire occupe une étendue<br />
de 3.280 km2. D’autre part, la connaissance des écoulements spécifiques des eaux<br />
karstiques permet d’étudier par analogie le régime des eaux karstiques dans les condi-<br />
tions géologiques très compliquées. Ce qui permet d’en connaître les éléments princi-<br />
paux et de les utiliser pour l’explication de ces eaux dans les différentes régions.<br />
SUMMARY<br />
The circulation of karstic conter in carcareous complexes and its quantitatiue baìance<br />
The author examines the phenomena of the recharge and exhaustion of karstic<br />
water reserves and describes a special method of water balance calculation used for<br />
the quantitative estimation of the Triassic water resources of the western Carpathians<br />
and for quantifying their technically very complicated migrations into the neighbouring<br />
complexes.<br />
In the western Carpathians, the problem of the recharge of the calcareous complexes<br />
by karstic water and of their exhaustion relatively to the precipitations involves a<br />
whole series of extremely important hydrogeological phenomena. A full evaluation<br />
of the hydrogeology of the water balances of the selected zones makes it possible to<br />
explain the more general phenomena of the replenishment of reserve by karst water<br />
from the western Carpathians, of crucial importance during the period January-April.<br />
152
For evaluation of the karst water balance of the western Carpathians a special<br />
method is relied on, which starts from knowledge of specific underground flow in the<br />
different calcareous complexes. The volume of karstic waters and their passage into<br />
neighbouring complexes in extremely complicated tectonic conditions are estimated<br />
analogically from the specific flow valves in very simple tectonic conditions when the<br />
accurate determination of the totals is possible. Over the last few years much work<br />
has been done on the problems of karst water balances and specific flow and the latter’s<br />
changes according to geological and climatic conditions. This method was used for<br />
evaluating the amounts of karst water migrating to neighbouring beds throughout all<br />
mountain systems of the western Carpathians, e. g. in the Little Carpathians, by analogy<br />
with the neighbouring complexes of known specific flow, to settle the problem of the<br />
concealed passage of the karst water of the limestone complex lying below the tertiary<br />
and quaternary sediments of the neighbouring Záhorská Níiina plain. We worked it<br />
out that between 40 and 50 per cent of the underground water of the calcareous complex<br />
passed below the geological strata of the plain and the evaluation of this plain’s water<br />
balance has confirmed these figures.<br />
The detailed resolution of the question of karst water specific flow values in the<br />
various geological, tectonic and climatic conditions found in the western Carpathians<br />
has enabled an approximate estimate to be made of the putative circulation of the<br />
karst waters of the western Carpathians where calcareous rocks occupy an area<br />
extending to 3,280 square kilometres. In addition, this knowledge of karst water<br />
specific flow values makes it possible to study karst water regimens in highly complex<br />
geological conditions by analogy, so that the main features of their supplies can be<br />
determined and the knowledge used for the development of the various areas’ waters.<br />
Une grosse partie des eaux souterraines des Carpathes occidentales est formée par<br />
des eaux karstiques. Elles sont liées surtout aux complexes calcaréo-dolomitiques<br />
aquifères occupant environ 3.280 km2.<br />
Dans cette contribution, je présente les résultats des études que j’ai poursuivies<br />
pendant plusieurs années en évaluant le bilan des écoulements souterrains spécifiques<br />
des complexes calcaréo-dolomitiques, mais aussi la solution du problème concernant<br />
le rapport des précipitations avec la recharge des réserves d’eaux karstiques.<br />
Les conditions géologiques très compliquées des complexes carbonatés des Carpathes<br />
occidentales conjointement avec la difficulté et souvent l’impossibilité de<br />
déterminer plus précisément quelques-uns des membres de l’équation de bilan (surtout<br />
I’évapotranspiration) ont conduit l’auteur à la décision de proposer une méthode<br />
particulière de bilan pour l’évaluation des eaux karstiques. Cette évaluation de bilan<br />
utilise l’édifice tectonique favorable des Carpathes occidentales. Elle est basée sur les<br />
écoulements souterrains spécifiques des eaux karstiques et sur leurs variations dans<br />
les complexes carbonatés à l’édification tectonique très simple, laquelle rend possible<br />
leur détermination assez précise. En appliquant la méthode d’analogie aux complexes<br />
carbonatés voisins à l’édifice tectonique très compliqué et à la circulation approfondie<br />
ou passant aux sédiments plus récents sous les conditions géologiques, géomorphologiques<br />
et climatiques semblables ou identiques, il est possible de dresser un bilan<br />
quantitatif du passage approfondi des eaux karstiques, éventuellement celui de leur<br />
passage aux assises plus récentes des plaines et bassins voisins.<br />
ECOULEMENTS SOUTERRAINS SPECIFIQUES DES COMPLEXES CARBONATES DES CARPATHES<br />
OCCIDENTALES<br />
Pour établir l’évaluation du bilan, nous avons déterminé les écoulements spéci-<br />
fiques des eaux karstiques de toute la série de complexes carbonatés déposés favorable-<br />
ment sous forme de lambeaux dans les Carpathes occidentales. Nous avons évalué les<br />
complexes calcaréo-dolomitiques et les régions à prédominance absolue des dolomies<br />
dans plusieurs montagnes (Petites Carpathes, StráZovská hornatina, Vel’ká Fatra et<br />
Inovec).<br />
153
Dans les Petites Carpathes (la partie occidentale des Carpathes occidentales),<br />
il y a une région favorable pour déterminer les écoulements souterrains spécifiques,<br />
située entre les villages Logonec et Kuchyiia. Cette région est formée par des calcaires<br />
et des dolomies SUT l’étendue de 20,6 km2. I1 s’agit de l’assise carbonatée à inclinaison<br />
abrupte vers la profondeur. Ses sous-jacent et sus-jacent sont constitués par des couches<br />
imperméables (plus en détail chez Kullman 1964). Cette région est drainée par des<br />
sources et en partie aussi par des eaux souterraines passant directement aux cours<br />
d’eaux de surface traversant le complexe carbonaté. Le passage aux profondeurs,<br />
éventuellement l’infiltration non enregistrée vers les assises voisines, est peu probable.<br />
Des mesures systématiques des sources du complexe, exécutkes par l’Institut hydro-<br />
météorologique durant la période 1957-1963, et des mesures périodiques, mais non<br />
systématiques, des cours d’eau de surface sous différentes conditions climatiques ont<br />
rendu possible de chiffrer l’écoulement souterrain spécifique et ses variations durant<br />
les différentes périodes (voir fig. lu). Durant la période 1957-1963, les écoulements<br />
souterrains spécifiques annuels variaient entre 7-9 I/s/km2, l’écoulement spécifique<br />
minimal était au-dessus de 5 l/s/km2, le maximal de 12-15 I/s/km2 avec des précipi-<br />
tations moyennes annuelles de 626-768 mm et une moyenne thermique annuelle<br />
de 8-10 “C en différentes années hydrogéologiques.<br />
Dans la montagne Stráiovská hornatina, située dans la partie centrale des Carpathes<br />
occidentales, nous avons évalué le lambeau calcaréo-dolomitique de Zihlavník. 11<br />
s’étend au sud-est des bains Trenrianske Teplice parmi les villages de Dolná Poruba,<br />
Slatinka et OmSenie. La région propre de ce lambeau occupe l’étendue de 28,8 km2.<br />
Elle repose sur le substratum imperméable constitué par des assises du Crétacé<br />
affleurant à la périphérie du lambeau carbonaté (en détail chez Kullman 1961). Elle<br />
est drainée par des sources karstiques concentrées, pratiquement sans l’écoulement<br />
superficiel. Durant la période des mesures systématiques de XI.1954 à X.1962, les<br />
écoulements souterrains spécifiques atteignaient les valeurs minimales d’environ<br />
3,4-4, O I/s/km* et les maximales de 30 I/s/km2. Durant les différentes années hydrogéologiques,<br />
l’écoulement souterrain spécifique annuel moyen était de 9,2-14,2 l/s/km2<br />
avec précipitations annuelles moyennes entre 695-909 mm. L’écoulement souterrain,<br />
évalué en pourcentage, variait de 32,9 à 66,7% par rapport aux précipitations annuelles<br />
totales.<br />
Pour dresser le bilan d’écoulement souterrain des complexes carbonatés de la<br />
Haute Tatra (située à l’est de StráZovská hornatina), nous avons évalué le synclinal<br />
partiel entre Harmanec et CremoSné. I1 constitue une partie du vaste lambeau carbonate<br />
(a prédominance dolomitique) reposant sur le complexe sous-jacent imperméable.<br />
En 1963, l’écoulement souterrain spécifique moyen de cette région était de<br />
i4,9 l/s/km2 avec un ruissellement superficiel partiel (les valeurs ne sont pas exactes<br />
parce que les mesures systématiques de toutes les sorties d’eaux karstiques n’étaient<br />
pas assurées).<br />
Le complexe trks favorable aux mesures de l’écoulement souterrain spécifique,<br />
est représenté par le lambeau dolomitique riche en eau, déposé sous forme de synclinal<br />
près de Závada, dans la montagne Inovec (au sud-ouest des Carpathes occidentales)<br />
sur l’étendue de 12,8 km2.<br />
En 1959, 1960, 1962, l’écoulement souterrain spécifique de ce lambeau variait<br />
de 5,88 à 8,l l/s/km2, avec une prédominance de 6 à 8 I/s/km2, l’écoulement superficiel<br />
spécifique atteignait la valeur de 0,6 à 1 I/s/km2 et le total des précipitations n’était<br />
au maximum que de 889 mm durant l’année hydrogéologique 1959.<br />
Les connaissances sur l’écoulement souterrain spécifique des différentes montagnes<br />
des CaIpathes occidentales rendent possible de dresser le bilan des eaux karstiques<br />
et, étant donné qu’on les avait rassemblées dans les conditions climatiques assez<br />
différentes, elles mettent en évidence l’écoulement souterrain spécifique moyen des<br />
Carpathes occidentales.<br />
155
BILAN DE LA CIRCULATION DES EAUX SOUTERRAINES DES COMPLEXES CALCAREO-DOLO-<br />
MITIQUES DANS LES MONTAGNES INOVEC ET PETITES CARPATHES<br />
En vertu de la méthode de bilan esquissée plus haut et sur la base de l’évaluation<br />
des écoulements souterrains spécifiques, nous avons dressé le bilan des réserves dyna-<br />
miques en eaux souterraines dans les régions calcaréo-dolomitiques (à prédominance<br />
de dolomies, éventuellement en équilibre avec des calcaires) de certaines montagnes,<br />
ainsi que de leurs parties. Nous apportons les résultats de l’application de cette méthode<br />
aux complexes carbonatés à prédominance de dolomies au sud de la montagne<br />
Povaiski Inovec et aussi aux complexes calcaréo-dolomitiques des Petites Carpathes.<br />
La partie méridionale de la montagne PovaZskj. Jnovec (étendue de 250 km2) est<br />
constituée par un nombre de complexes dolomitiques séparés les uns des autres,<br />
souvent semblables, parfois identiques, de même caractère pétrographique, de condi-<br />
tions géomorphologiques peu différentes, avec précipitations semblables en moyenne<br />
de 650-800 mm (voir tab. i), de couverture végétale identique. C’est pourquoi on peut<br />
y appliquer la méthode proposée par l’auteur.<br />
TOTAL DES PRECIPITATIONS MESUREES DANS LES STATIONS PLWIOMETRIQUES<br />
Date des<br />
mesures<br />
TABLEAU 1<br />
Stations pluviométriques des différents<br />
complexes dolomitiques<br />
Zl’avy Malé Luka<br />
Pustatina RadoSiná nad Váhom PieSt’anY Hlohovec<br />
complexe carbonaté<br />
entre<br />
au No de au N de RadoSiná Hubina et entre<br />
Závada Hradok et Koplotovce<br />
XI.58-X.59 617 mm 592 mm - 568mm 597mm 536mm<br />
X1.61-VIL62 514 mm - 432mm 505mm 497mm 499mm<br />
Sur la base des valeurs des écoulements souterrains spécifiques de l’un de ces com-<br />
plexes calcaréo-dolomitiques situé près de Zavada à l’est de la montagne (analysé plus<br />
en détail dans la partie précédente de ce travail), nous avons évalué le bilan des autres<br />
formations calcaréo-dolomitiques, et cela près de Hubina, Hrádok, Moravany,<br />
Koplotovce et RadoSiná (1). L’un des complexes évalués, situé le plus au nord, entre<br />
les villages Hubina et Hrádok, occupe une étendue de 33,44 km2. Le propre lambeau<br />
calcaréo-dolomitique est caractérisé par une structure géologique très simple avec<br />
inclinaison générale vers l’ouest. I1 repose sur les assises imperméables affleurant au<br />
nord, à l’est et au sud. Sa bordure occidentale est en contact avec les couches aquifères<br />
paléogènes, néogènes et quaternaires de la vallée du Wag. Les eaux souterraines venant<br />
de ce complexe alimentent les sources et les cours d’eau de surface avec un débit<br />
d’environ 100 I/s en moyenne. En comparant l’écoulement souterrain véritable avec<br />
le supposé (environ 200 l/s), d’après le calcul le la région analogue de Závada (avec<br />
(I) Les conditions hydrogéologiques sont étudiées plus en détail dans la contribution<br />
: E. KULLMAN 1964 : Bilancia podzemnj.ch vôd ju2nej Easti Povaiského Inovca,<br />
Geol. Prrfce - Zprrfvy, 31, Bratislava.<br />
156
l’écoulement souterrain spécifique de 5,88 I/s/km2)), on peut supposer que durant leS<br />
périodes sèches, plus que 48 y< d’eaux souterraines (durant les périodes de débit abon-<br />
dant encore beaucoup plus) s’infiltrent dans les sédiments quaternaires et tertiaires<br />
de la vallée de Povaiie, éventuellement dans leurs assises sous-jacentes mésozoiques.<br />
Un autre complexe dolomitique évalué se trouve au sud du précédent parmi les<br />
villages de Moravany, Ratnovce, JalSové, Salgovce et Koplotovce à inclinaison générale<br />
des assises vers le sud-ouest. La plupart des assises carbonatées passant à la plaine<br />
voisine plongent sous la couverture des schistes pauvres en eau (entre Moravany et<br />
Sokolovce). La limitation de ce complexe est tectonique par rapport à la plaine voisine<br />
du Danube. Nous pouvons admettre que les eaux souterraines karstiques passent aux<br />
sédiments tertiaires et surtout quaternaires de la plaine voisine. Le propre complexe<br />
dolomitique occupe l’étendue de cca 37,8 km2. Durant la période stationnaire sans<br />
précipitations, l’écoulement souterrain total atteint 50,O I/s (l’infiltration supposée<br />
représente cca 220 l/s par analogie au complexe près de Závada). Par analogie au pré-<br />
cédent, on peut supposer que plus de 75% de la quantité totale d’eau infiltrée ne sort<br />
pas du complexe, mais les eaux karstiques se dispersent dans les sédiments tertiaires,<br />
le plus souvent quaternaires et même dans les carbonates de l’unité inférieure de leur<br />
propre montagne. Dans l’autre complexe carbonaté A prédominance dolomitique de<br />
la montagne Inovec, au nord de RadoSiná, reposant sur le cristallin sous-jacent et<br />
sur les assises mésozïques pauvres en eau, au sud, en passant vers le terrain montueux<br />
de Nitra, en contact tectonique avec l’imperméable néogène constitué par des sédiments<br />
argileux (l’étendue de 19,7 km2), l’écoulement souterrain déterminé est identique<br />
avec le supposé (l’infiltration supposée d’environ 105-120 l/s par analogie à la zone<br />
de Závada), le débit véritable des eaux karstiques atteignait environ 100 ljs. Les résul-<br />
tats que nous avons atteints dans ce complexe à faible perte des eaux souterraines,<br />
vérifiés aussi par le bilan, mettent en évidence l’exactitude suffisante de cette méthode<br />
hydrogéogique applicable surtout aux complexes dolomitiques à écoulement constant<br />
et rendent possible de poursuivre la recherche hydrogéologique des différentes régions.<br />
Nous avons dressé, d’après cette méthode, le bilan des eaux fissurées karstiques<br />
du complexe carbonaté situé sur les versants sud-ouest des Petites Carpathes. II s’étend<br />
parmi les villages de Rohoiník, Cerová-Lieskové et Trstín (complexe carbonaté de<br />
l’unité de Cho?.). Le complexe carbonaté représente un ensemble hydrogéologique<br />
indépendant, reposant sur l’assise imperméable des grès et des schistes de l’âge trias-<br />
sique avec lesquels il plonge sous les sédiments néogenes de la plaine voisine Záhorská<br />
níiina, qui en est séparée par la faille de bordure. Le long de cette faille, les complexes<br />
carbonates se sont affaissés en profondeur notable (d’environ 1000 m). Nous admettons<br />
que les eaux karstiques passent aux assises mésozoiques jusqu’aux quaternaires de la<br />
plaine voisine.<br />
Le bilan était calculé par analogie au complexe voisin calcaréo-dolomitique entre<br />
les villages de Kuchyña et LoSonec (complexe carbonaté de i’unité de KríZna), dans<br />
lequel il y a possibilité de mesurer le débit de toutes les eaux infiltrées revenant s’écouler<br />
à la surface (évaluation plus détaillée dans le chapitre précédent).<br />
Les deux complexes voisins s’étendent à travers la montagne et ils présentent les ménies<br />
conditions climatiques, morphologiques et végétales. Admettant les mêmes possibilités<br />
d’infiltration des précipitations en profondeur des deux complexes et en comparant les<br />
écoulements spécifiques des eaux souterraines affleurant le sol revenant s’écouler a<br />
la surface durant la période de longue durée (7 années hydrologiques), voir tableau 2,<br />
figure I (l), nous pouvons dresser un gros bilan quantitatif du passage caché des eaux<br />
karstiques.<br />
(l) La fluctuation des valeurs des écoulements souterrains spécifiques est causée<br />
par les mesures non systématiques des eaux karstiques passant aux ruissellements.<br />
157
a)<br />
20-<br />
10-<br />
a-<br />
-5 -<br />
4a-<br />
30 -<br />
20-<br />
10-<br />
o*<br />
:I<br />
‘C mm<br />
90- u)<br />
10o-<br />
1 o<br />
-5-<br />
COMPLEXE CARBONATÉ DES PETITES CARPATES<br />
-.-.- ECOUEMENT TOTAL DES EAUX SOUTERRAINES<br />
PRÉCIPIJAJIONS íSTAT/IoN PLUVIOMETRIQUE DE KvCUYiA - VIVRAT)<br />
------ TEMP~RATURE DE L‘ AIR (srAnIoN DE KUCHYF~AI<br />
COMPLEXE CAR8ONATÉ DE LA MONTAGNE STRÁ~OVSKÁ WRNATINA<br />
XI. XII / Il /II IV v v/ w vm /x x<br />
-<br />
-.-.- ÉCOULEMENT TOTAL DES EAUX SOUTERRAINES<br />
PRÉCIPIJATIONS (SJATIi3d PLUVIOMÉTRIOUE DE /-!OT€~/C€)<br />
--I-- TEMPERATURE DE i AIR (STATION DE TRENCIANSUE TEPLICE)<br />
Fig. 2 - Rapport des précipitations avec la température de l’air et les changements<br />
de I’écoulement total des eaux souterraines karstiques des complexes carbonates<br />
des Carpates Occidentales (valeurs moyennes au cours des années hydrugéolo-<br />
Biques 1959-1963).
ÉCOULEMENTS SOUTERRAINS SPECIFIQUES MOYENS DES COMPLEXES CARBONATES DES<br />
PETITES CARPATHES<br />
TABLEAU 2<br />
~~ ~~<br />
Année hydro- Complexe carbonaté Complexe carbonate<br />
logique entre LoBonec et Kuchyiia entre RohoZník et Trstín<br />
Débit en I/s/km2 Débit en I/s/km2<br />
1957<br />
1958<br />
1959<br />
1960<br />
1961<br />
1962<br />
1963<br />
8,3-9,5<br />
8,l-8,9<br />
7,8-8,9<br />
7,3-8,4<br />
6,l-7,2<br />
7,5-8,6<br />
7.5-8,6<br />
4,6-4,s<br />
4,l-4,3<br />
4,l-4,3<br />
4,O-4,3<br />
3,7-3,9<br />
3,s-3,9<br />
3,s-4,0<br />
En comparant les deux complexes par méthode d’analogie, nous pouvons supposer<br />
que cca 270 1/s (environ 40-50%) d’eaux, infiltrées en profondeur du complexe carbonaté<br />
parmi les villages de Rohotník, Cerová-Lieskové et Trstfn, passent aux assises de la<br />
plaine voisine Záhorská nítina. L’exactitude de ces résultats est vérifiée par la recherche<br />
hydrogéologique qui documente sur le passage des eaux souterraines du complexe<br />
cité plus haut le plus souvent aux sédiments quaternaires et en partie aussi aux sédiments<br />
mésozoïques de cette plaine.<br />
PRECIPITATIONS ET RECHARGE DES RESERVES D’EAUX KARSTIQUES<br />
Dans les complexes karstiques, la connaissance du rapport des précipitations avec<br />
la recharge des réserves d’eaux karstiques est très importante. Ce rapport doit &tre<br />
étudié et connu au point de vue des pronostics de l’économie des eaux et aussi pour<br />
résoudre le problème de l’influence de l’infiltration sur le changement quantitatif des<br />
eaux de circulation profonde sortant vers la surface.<br />
On a essayé, dans les Carpathes occidentales, d’établir le rapport entre des préci-<br />
pitations et l’écoulement des eaux souterraines karstiques. L’évaluation des eaux<br />
souterraines karstiques venant sourdre soi de toute une série de complexes carbonatés<br />
donne des indications sur la recharge des réserves d’eaux karstiques résultant des<br />
précipitations totales durant la période janvier-avril (surtout sous forme de neige)<br />
des différentes années hydrologiques. Cette évaluation démontre l’influence secon-<br />
daire des précipitations, atteignant leur maximum en été, sur l’augmentation des réserves<br />
d’eaux souterraines karstiques dans les Carpathes occidentales (voir fig. 2). L’influence<br />
des précipitations annuelles maximales sur l’augmentation des réserves d’eaux karsti-<br />
ques est secondaire, elle diffère et dépend de la position des différentes montagnes dans<br />
les Carpathes occidentales.<br />
Au sud-ouest de la chaîne de montagne (dans les Petites Carpathes), I’infiuence<br />
des précipitations maximales sur l’augmentation des eaux karstiques est très secondaire<br />
(voir fig. 2a). L’augmentation des réserves d’eau est influencée par le maximum des<br />
précipitations seulement dans la partie centrale de la chaîne de montagne (StraZovská<br />
hornatina, voir fig. 2b). Nous pouvons supposer que ces phénomènes dépendent surtout<br />
de I’évapotranspiration des régions karstiques atteignant savaleur maximale en été. Cette<br />
influence est plus importante dans la partie sud-ouest et sud que dans la partie centrale<br />
et septentrionale des Carpathes occidentales en relation avec les conditions climatiques.<br />
Les connaissances citées plus haut rendent possible de juger les différents complexes<br />
159
carbonatés au point de vue de l’économie des eaux. Elles servent de base pour faire<br />
des pronostics du débit minimal en différentes années hydrogéologiques et par leur inter-<br />
médiaire on peut résoudre le problème du rapport des précipitations avec l’écoulement<br />
souterrain des eaux karstiques dans les conditions géologiques et tectoniques plus<br />
compliquées.<br />
BIBLIOGRAPHIE<br />
KULLMAN, E. 1961. Vápencovodolomilické kompiexy a ich vzcah k podzemnim<br />
vodám, Geol. Práce - Zprávy, 22, pp. 189-198, Bratislava.<br />
KULLMAN, E. 1964. Bilancia podzemnich vôd juihej Casti Povaiského Inovca, Geol.<br />
Práce - Zprcivy, 31, pp. 183-194, Bratislava.<br />
KULLMAN, E. 1964. Krasové vody Slovenska a ich hydrogeoiogicki vfskum, Geol.<br />
Práce - Zprávy, 32, pp. 9-28, Bratislava.<br />
MAHEL’, M. 1946. Tektonika územia medzi stredngm tokom Váhu a Hornou Nitrou,<br />
Geol. Práce, 18, Bratislava.<br />
160
CONTRIBUTION OF GEOLOGY TO THE RESEARCH<br />
OF GROUND WATER IN CRYSTALLINE ROCKS<br />
SUMMARY<br />
Luis SIQUEïRA<br />
(Brazil)<br />
The foregoing work is the first attempt to list all types of structure which allow us<br />
to obtain ground water from Crystalline Rocks. The order in which these structures<br />
are numbered, is a decreasing order according to the importance of the structure as<br />
a water bearing body.<br />
Later on, the writer wil give the first table for valuation of a water deposit in crystal-<br />
line rocks. The calculation, in its essence is very simple, but it has always been effective<br />
whenever it was used.<br />
Finally, the advisability of drilling a given area, is mentioned, aiming not only the<br />
quantity of water but also its chemical quality. The writer considers among the several<br />
limiting factors, those concerning to morphology, drainage pluviality and petrography<br />
of the area.<br />
Resuming, with the present work, the writer aims to help all the geologists who<br />
are willing to search water for people and herds. It is a reasonable amount of experienm,<br />
which the writer has acquired by drilling nearly 400 holes in the surroundings of<br />
Curimataú, Sabogi, Cariri, Petrolina and Ouricuri.<br />
The writer also hopes that his modest work may be of help to all those who are<br />
interested in the matter.<br />
CONTRIBUTlON DE LA GEOLOGIE À LA RECHERCHE<br />
DE L’EAU SOUTERRAINE<br />
DANS LES ROCHES CRISTALLINES<br />
RESUME<br />
Luis SIQUEIRA<br />
(Brésil)<br />
L’auteur tente pour la première fois d’énumérer tous les types de structure qui<br />
permettent d’exploiter les eaux souterraines contenues dans les roches cristallines.<br />
Ces structures sont classées par ordre décroissant selon leur importance en tant<br />
qu’aquifère.<br />
Il donne ensuite le premier tableau permettant d’évaluer l’importance d’une nappe<br />
dans des roches cristallines. Le calcul, très simple dans son principe, a toujours donné<br />
de bons résultats.<br />
I1 est fait mention de l’utilité de forer des puits dans une zone donnée afin de déter-<br />
miner non seulement la quantité d’eau, mais aussi sa qualité chimique. Parmi les divers<br />
facteurs limitatifs, l’auteur évoque ceux qui se rapportent à la morphologie, à l’écoule-<br />
ment, à la pluviosité et à la pétrographie de la région.<br />
L’auteur espère aider tous les géologues qui sont prêts à prospecter les ressources<br />
en eaux pour les besoins de l’homme et du bétail.11 a acquis une assez grande expérience<br />
en forant près de 400 puits aux environs de Curimataù, Sabogi, Cariri, Petrolina et<br />
Ouricuri.<br />
I1 espère aussi que cette modeste étude pourra être utile à tous ceux qui s’intéressent<br />
à ces questions.<br />
161
RECHERCHES (HYDROGEOLOGIQUES)<br />
DANS LA REGION DES LACS KARSTIQUES BEOTIENS<br />
RESUME<br />
Gasp. G. MISTARDIS<br />
1. Les bassins lacustres de Béotie (poljé de Copaïs, bassin de Paralimni. etc.) doivent<br />
etreconsidéréscommed’origine tectonique (Pliocènehférieur?): ils ont évolué sous<br />
l’effet de l’érosion normale, mais surtout par des phénomènes de karstification au Pliocène<br />
et au Pleistocène.<br />
2. Copais, le plus vaste des lacs béotiens, a &té asséché artificiellement en 1892;<br />
récemment aussi le petit marais de Sphinx.<br />
Au contraire, la surface des lacs Yliki et Paralimni s’est sensiblement accrue depuis<br />
1892, les eaux du Copaïs étant drainées par un tunnel vers le lac Yliki, puis par un<br />
canal vers le lac Paralimni et, de celui-ci, par un autre tunnel vers la mer.<br />
3. Avant 1892, les eaux du lac COQ~S s’écoulaient souterrainement, surtout vers<br />
le nord-est, par des catavothres latérales (altitude 94 m environ). Une partie réapparaissait<br />
près de la côte en des résurgences karstiques (Larymna, Skroponéri, etc.).<br />
Comme des résurgences restent très abondantes malgré le drainage du lac Copaïs,<br />
il est évident qu’un important réseau karstique existe sous le poljé et qu’il continue de<br />
fonctionner activement.<br />
4. Un autre réseau souterrain doit exister à l’est du poljé de Copaïs sous les bassins<br />
des lacs Yliki et Paralimni. Avant 1892, une partie seulement des eauxdu lac Copals<br />
qui s’échappaient vers l’est par les catavothres latérales alimentait les lacs Yliki et Paralimni<br />
.<br />
5. L’auteur examine certaines questions concernant l’origine de ces réseaux karstiques,<br />
l’influence des variations du niveau du grand lac Pliocène-Pleistocène s’étendant<br />
de Locrisde au nord-ouest de l’Eubée, l’influence des oscillations du niveau de la mer<br />
au Pleistocène Supérieur et à l’Holocène, et l’amplitude du surcreusement karstique<br />
souterrain.<br />
SUMMARY<br />
Research in the Boetian karstic lakes region<br />
1. Boetian lakes basins (polje of Copais, basin of Paralimni etc) are to be consi-<br />
dered as of tectonic origin (Lowest Pliocene?); developed further by normal erosion,<br />
but chiefly by karstification during Pliocene and Pleistocene,<br />
2. Copais, the more extended boetian lake, was in 1892 artificially drained. In way<br />
of drainage is now the little swamp of Sphinx.<br />
On the contrary, a sensible enlargement of the area of lakes Yliki and Paralimni<br />
took place since 1892, owing to that waters of Copais through a tunnel are running<br />
to Yliki, then by a canal to Paralimni and from it through another tunnel, towards the<br />
sea.<br />
3. Before 1892 Copais waters were by side pot-holes (alt. about 94 m) running under<br />
ground chiefly towards northeast. A part of them was springing near thc sea shore line<br />
as karstic resurgences (Larymna, Skroponeri, etc.).<br />
As these karstic springs continued to be enough abundant also after the drainage<br />
of Copais it becomes evident, that an important Karstic network of galeries etc. is<br />
existing under the polje and continue to be active.<br />
4. Another underground Karstic network must exist eastward of Copais polje<br />
under the basins of Yliki and Paralimni. Before 1692, only a few part of lake Copais<br />
waters which by side pot-holes were running underground eastward was feeding lake<br />
Yliki (and Paralimni).<br />
5. This communication is referring only to some questions concerning the origin<br />
of these undergro.und Karstic networks, the influences of level fluctuations of Pliocene-<br />
Pleistocene Lokris-northwestern Euboea great lake, those of sea level fluctuations in<br />
upper Pleistocene and Holocene and the amplitude of the underground Karstic<br />
overdeepening.<br />
162
i. INTRODUCTION<br />
1. Le nord-est de la Béotie, dont la superficie ne dépasse pas 1500 km2 en grande<br />
partie constitué de calcaires dans ses régions en relief, était une région de lacs Kars-<br />
tiques. Il continue encore de l’être, mais seulement en partie maintenant.<br />
2. Le plus étendu de ces lacs, celui de Copaïs fut asskché par des travaux techniques<br />
importants vers la fin du siècle passé. Le petit étang de Sphinx dans la plaine Ténerienne<br />
fut aussi asséché récemment.<br />
Au contraire, l’étendue du petit lac de Paralimni, et surtout celle d’Yliki furent tres<br />
sensiblement augmentées à la suite des travaux d’assèchement du Copaïs, dont les eaux<br />
se déversent à Yliki par un canal (-tunnel en partie) et de ce lac, par un autre<br />
canal à Paralimni. Enfin, de ce dernier lac par un tunnel-canai aboutissent au golfe<br />
Euboïque prts de la place de l’ancienne Anthédon (fig. 1).<br />
- -a<br />
Fig. 1 - La région des lacs Béotiens :<br />
a. Canai.<br />
b. Partie en tunnel.<br />
’ c. Canal étroit vers St.-Thomas (Marathon).<br />
d. Grande catavothre.<br />
e. Sources karsti ues importantes : 1. de Polygyra; 2. de Djamali; 3. des Grâces;<br />
4. de Pétra (Tjphoussa); 5. d’aaliartus; 6. d’Anchoé.<br />
f. Sources littorales salées : 7. d’Armyra: - . 8. d’Opous: 9. de Larymna: 10. de<br />
Skroponéri.<br />
g. Sources sous-marines à faibles profondeurs : 11. d’Anthédon.<br />
L. Montagnes-collines de Locride.<br />
H. Mt. Hélicon (1748 m).<br />
P. Mt. ~~ Ptoon. ~.~~<br />
Y. Mt. Ypaton.<br />
PL. Lac Paraiimni.<br />
YL. Lac Yliki.<br />
S. fitang Sphinx (Variko).<br />
K. Bassin de Copais.<br />
M. Rivière Mélas.<br />
T. Bassin Ténérien.<br />
A. Bassin Aonien.<br />
163
La construction d’un long canal après la dernière Guerre a permis d’amener une<br />
partie des eaux d’Yliki au lac artificiel de Marathon pour les besoins en eau d’Athènes<br />
et des agglomérations voisines.<br />
II. PREUVES DE L’EXISTENCE D’EAUX SOUTERRAINES KARSTIQUES ABONDANTES<br />
3. Bien que les eaux de Copaïs se déversent à Yliki depuis peu avant la fin du siècle<br />
passé et ne s’échappent plus, par les catavothres de la bordure du bassin, directement<br />
vers le golfe Euboïque septentrional, les sources de la zone côtière (Skroponéri, Larym-<br />
na, etc) continuent cependant à fonctionner. Leur débit ne semble pas avoir diminué<br />
fortement après l’assèchement du Copaïs.<br />
De même, la grande source du Ano Képhalari (Anchoé des anciens) au sud de<br />
Larymna, à une altitude d’environ 40 m et à 3 k m de l’extrémité orientale du bassin<br />
de Copais (altitude environ 90 m) qui ne fonctionnait pas en été (l) quand le lac était<br />
très restreint, ne tarit plus complètement depuis l’assèchement de ce lac (2).<br />
4. 11 devient donc évident que les sources karstiques de la zone côtière étaient ali-<br />
mentées non seulement par les eaux mêmes du lac, mais aussi par des eaux souterraines.<br />
Sans doute, il y eut, en plusieurs endroits, une infiltration d’eaux du lac Copais en<br />
profondeur dans les dépôts lacustres etc. sous-jacents et ensuite dans les fissures etc.<br />
du fond calcaire, aidant ainsi à alimenter en partie les sources de la zone catière et le<br />
ruisseau de Larymna, qui même en été ne manque pas d’eau.<br />
Naturellement, depuis l’assèchement du lac les quantités d’eau ainsi infiltrées doi-<br />
vent être moins importantes : on peut donc un peu difficilement expliquer l’abondance<br />
relative de certaines sources et la pérennité du ruisseau de Larymna.<br />
5. On se demanderait alors, si une partie au moins des sources de la zone côtière<br />
ne sont pas alimentées, en partie aussi par des eaux d’un autre réseau karstique sou-<br />
terrain plus profond.<br />
La présence des sources saumâtres sur la ligne littorale, à la baie d’Opous, à Larym-<br />
na et à l’ouest d’Anthédon (3) (et dont celles d’Armyra (baie d’Opous) jaillissent avec<br />
grande force) est aussi en faveur d’une telle hypothèse.<br />
6. L’alimentation de ce dernier réseau doit être cherchée surtout dans les eaux<br />
souterraines de la partie orientale (calcaire) du Mt. Parnasse et de la partie septentrio-<br />
nale de l’Hélicon.<br />
La présence de sources très puissantes (des Grâces, de Polygyra etc.) à la bordure<br />
nord-occidentale du bassin de Copals entre Orchomène et Asplédon, relativement à<br />
proximité de ces endroits (environ 25 km de Parnasse et 20 km d’Hélicon) est en faveur<br />
de cette hypothèse (4).<br />
7. Ces constatations donnent à penser que :<br />
a) Une partie seulement des eaux de l’ancien lac Copaïs, qui s’engouffraient dans les<br />
catavothres de la bordure du bassin alimentaient les sources de la zone côtière et le<br />
ruisseau de Larymna; le reste s’enfonçait plus profondément et devait réapparaître<br />
sous forme de sources sous-marines probablement à des distances de quelques centaines<br />
de mètres, loin de la côte, cas très fréquent en Grèce (5)<br />
b) Une infiltration, évidemment moins importante qu’avant l’assèchement du<br />
Copaïs, a lieu à travers les dépôts lacustres etc. et ensuite par les fissures, catavothres<br />
etc., surtout du fond calcaire ; elle alimente les sources de la zone côtière.<br />
c) Certaines de ces sources, surtout parmi celles qui sont saumâtres jaillissent fortement<br />
et, sont probablement aussi alimentées par des eaux d’un autre réseau plus profond<br />
(56).<br />
164
8. On voit donc se dessiner plutôt trois réseaux karstiques souterrains, qui en certains<br />
endroits peuvent s’entre-croiser, et dont celui qui était alimenté autrefois par les<br />
catavothres de la bordure du bassin de Copaïs est devenu stérile après I’assechement du<br />
lac.<br />
Quand et sous quelles conditions furent formés ces différents réseaux karstiques<br />
est une question qui ne pourra être élucidée qu’après de longues recherches et de<br />
nouvelles études spéléologiques, géologiques etc., relativement à ce sujet.<br />
Nous nous bornons donc pour le moment à exposer certaines hypothèses basées<br />
sur les données géologiques, morphologiques et spéléologiques dont nous disposons<br />
sur l’aire Béotienne.<br />
III. FORMATION DES RESEAUX KARSTIQUES SOUTERRAINS<br />
9. Des lambeaux ou vestiges d’une ancienne surface, datant probablement de la<br />
partie la plus élevée du Mioche ou du commencement du Pliocène sont reconnais-<br />
sables, tant au nord de la région des lacs (vers Martinon etc.), qu’au sud (vers Mavromati<br />
etc.) à des altitudes de 300-400 m. L’existence d’autre part des failles nombreuses dans<br />
le bassin de Paralimni, etc. et en général l’étude géologique (6) et morphologique de la<br />
région conduisent à considérer les bassins lacustres de la Béotie comme étant d’origine<br />
tectonique en partie.<br />
Le processus de leur formation était probablement très compliqué, lent et à plu-<br />
sieurs stades. Le bassin de CopaIs donne l’impression qu’on ne peut pas exclure totale-<br />
ment une certaine dissidence. L’évolution du relief et celle de la Karstification souter-<br />
raine peuvent se dessiner comme suit dans leurs grandes lignes.<br />
10. A l’époque de l’ancienne surface de 300-400 m plus haut mentionnée ($9) les<br />
eaux coulant superficiellement, qui provenaient surtout des grandes masses monta-<br />
gneuses qui bordaient le bassin du Haut Céphise IMt. Parnasse etc.) et de celle plus<br />
réduite d’Hélicon, suivaient, en se dirigeant vers le sud-est, entre Chéronée et Tanagra<br />
(partie inférieure de la vallée d’Asopos) à peu près le même tra& que la ligne ferrée<br />
actuelle.<br />
Au nord-est de cet ancien couloir s’étendait la région ou furent formés plus tard<br />
les bassins lacustres. Elle présentait alors partout des altitudes supérieures à celles du<br />
coulo ir .<br />
Dans cette région plus élevée que le couloir de Chéronée-Tanagra, l’érosion atta-<br />
quant fortement les schistes, les roches vertes et le Aysch, qui recouvraient largement<br />
les calcaires, contribua à la formation de nombreux creux, vallées de formes diverses,<br />
bassins torrentiels, etc. dont les eaux se dirigeaient alors naturellement vers le couloir<br />
en question qui était moins élevé. (fig. 3, I).<br />
11. Les conditions topographiques d’alors favorisaient l’enlèvement graduel, par<br />
l’érosion, des schistes, des roches vertes et surtout du flysch sur des étendues relative-<br />
ment considérables. Ce furent ainsi les calcaires qui affleurèrent largement.<br />
Les calcaires mis à nu commencbrent à se karstifier fortement, tant superficielle-<br />
ment, que souterrainement. Ainsi commença à se développer un réseau karstique SOU-<br />
terrain (no 2) qui peu à peu devint assez important.<br />
12. A la suite des mouvements tectoniques, certaines parties de la région commen-<br />
cèrent à s’effondrer lentement et probablement par stades. Ainsi peu à peu plusieurs<br />
parties des creux mentionnés plus haut ($10) se trouvèrent plus bas que le couloir Ché-<br />
ronée-Tanagra (fig. 3, I).<br />
Les eaux superficielles cessèrent ainsi à s’échapper par le couloir. Elles se diri-<br />
geaient maintenant vers les parties déprimées mentionnées ci-dessus et surtout vers le<br />
165
assin de Copaïs et s’engouffraient dans les catavothres des parties calcaires du fond.<br />
Ainsi se favorisait beaucoup l’élargissement du réseau karstique souterrain no 2.<br />
13. Dans ces bassins effondrés et surtout dans celui de Copals devaient jaillir à la<br />
circonférence des eaux souterraines provenant des masses montagneuses voisines, ame-<br />
nées par un réseau karstique plus ancien (no i).<br />
Les sources abondantes actuelles de la bordure nord-occidentale du bassin entre<br />
Asplédon et Orchomène, ainsi que celles de sa partie méridionale à Tilphoussa (Pétra)<br />
et Haliartus témoignent en faveur de l’hypothèse de ce réseau Karstique plus ancien<br />
(no i).<br />
14. L’érosion karstique souterraine dans la plus grande partie de notre région était<br />
favorisée non seulement par la forte fissuration des calcaires, mais aussi par le fait que<br />
Fig. 2 - Partie orientale de la région :<br />
a. Affleurements des serpentines.<br />
b. Schisto-Cornéens.<br />
c. Flysch.<br />
d. Canal.<br />
e. Partie en tunnel.<br />
f. Canal étroit vers St.-Thomas.<br />
g. Catavothres 1-24 (selon Philippson - Ref. 3, pp. 46-53); 1-3 : groupe septentrional;<br />
4-9 : groupe nord-oriental (8 : grande catavothre); 10-13 : groupe de<br />
Gla; 14-21 : groupe d’Akraifnion; 22-24 : groupe de Kaneski.<br />
h. Probable voie souterraine karstique.<br />
i. Vestiges des travaux anciens (tunnel?).<br />
j. Col.<br />
K. Bassin de Copais.<br />
GL. Hum de Gia.<br />
M. Rivière Mélas.<br />
YL. Lac Yliki.<br />
PL. Lac Paralimni.<br />
EU. Golfe Euboïque septentrional.<br />
X. Sources karstiques d’Anchoé.<br />
S. Source de Skroponeri.<br />
T. Sources sous-marines d’hthédon.<br />
166
la région voisine qui est occupée aujourd’hui par le golfe Euboïque septentrional, elle<br />
aussi effondrée, était plus déprimée (bassin Locrien).<br />
Les réseaux karstiques souterrains, tant le plus ancien d’entre eux (no i), que celui<br />
qui commence à se développer avec la formation des bassins fermés Béotiens (no 2) POU-<br />
vaient donc se développer plus facilement en profondeur (fig. 3, II).<br />
15. Plus tard, sous l’influence des conditions climatiques, capables de permettre<br />
le déplacement facile des matériaux très abondants par les eaux des pluies, il arrive que<br />
les entrées des catavothres du fond des bassins Béotiens furent plus ou moins bouchées.<br />
Ainsi commencèrent à se former des lacs.<br />
Le surplus des eaux s’échappait, d’une part par des infiltrations à travers les dépôts<br />
récents du fond et le réseau karstique no 2, et d’autre part par les fissures et catavothres<br />
des parties des pentes submergées. (7) Un autre réseau karstique souterrain (no 3) com-<br />
mença donc à fonctionner (fig. 2).<br />
Sans doute plusieurs parties des trois réseaux karstiques souterrains s’entrecroi-<br />
saient-elles et une certaine partie des eaux de l’un passait à l’autre (fig. 3, III).<br />
IV. INFLUENCES DES FLUCTUATIONS CLIMATIQUES ET DES OSCILLATIONS DU NIVEAU DE LA<br />
MER AU QUATERNAIRE<br />
16. Les dépôts qui se formaient au fond des lacs Béotiens tant par les apports des<br />
eaux courantes, que surtout par les matériaux fins qui se prkipitaient acquirent<br />
dans le bassin de Copaïs une épaisseur considérable.<br />
Il est évident que, au fur et à mesure que l’épaisseur des dépôts du fond augmentait<br />
l’infiltration à travers leurs couches et leur échappement ensuite par le réseau karstique<br />
souterrain no 2 diminuaient. Les eaux s’engouffraient maintenant surtout dans les<br />
catavothres de la bordure qu’elles élargissaient peu à peu, surtout celles du nord-est<br />
et de l’est.<br />
17. Le développement des réseaux karstiques souterrains fut fortement influencé<br />
par les fluctuations très fortes du climat au Quaternaire. Durant les périodes à climat<br />
humide, des eaux très abondantes se déversaient dans les bassins Béotiens fermés, sur-<br />
tout dans celui de Copaïs. L’érosion karstique souterraine devenait alors intense.<br />
Au contraire, elle était moins importante durant les périodes à climat sec, pendant<br />
lesquels peu d’eau aboutissait aux bassins Béotiens et leurs lacs étaient très souvent<br />
asséchés. Le réseau Karstique souterrain no 3 devenait alors mort ou presque mort; les<br />
deux autres fonctionnaient faiblement, surtout le no 2.<br />
18. Lorsque le bassin Locrien se mit en communication avec la mer (au Quater-<br />
naire Moyen?) et que le bassin lacustre devint marin (golfe Euboïque septentrional),<br />
son niveau dut s’abaisser durant les périodes glaciaires, tandis que, durant les périodes<br />
interglaciaires la mer regagnait plus ou moins son niveau d’auparavant.<br />
Li juxtaposition des conséquences des mouvements tectoniques verticaux, vint com-<br />
pliquer un peu les déplacements de la ligne du rivage dans le bassin du golfe Euboïque<br />
septentrional.<br />
19. En tout cas, durant les périodes glaciaires Rissienne et Würmienne l’érosion<br />
Karstique souterraine doit avoir avanc6 en profondeur jusqu’assez au-dessous du<br />
niveau actuel de la mer (4.<br />
Des sources karstiques devaient apparaître évidemment dans la zone périphérique<br />
du bassin du golfe Euboïque septentrional découverte alors à la suite de l’abaissement<br />
du niveau de la mer, et surtout devant le front calcaire de notre région (fig. 3, IV).<br />
Avec le relèvement du niveau de la mer aux périodes interglaciaires et à la période<br />
postglaciaire certaines de ces sources, les plus fortes, devaient continuer à jaillir, mais<br />
167
maintenant sous le mer (fig. 3, V) comme c’est le cas dans plusieurs parties de la Grèce.<br />
11 en est ainsi au nord-ouest de la Béotie, dans la baie d’Antikyrra, au golfe Argolique<br />
(9), à l’ouest de Mani occidentale (lo) etc.<br />
20. Cependant à distance de la cote actuelle de la région des lacs Béotiens de grandes<br />
sources sous-marines ne sont pas connues.<br />
Les sources saumâtres importantes d’Armyra (à 13 km au nord de Copais) et celles<br />
d’Anthédon (0 22) se trouvent sur la ligne littorale ou pas loin d’elle.<br />
Fig. 3 - Schéma probable de l’évolution des réseaux karstiques souterrains dans la<br />
partie septentrionale de la région :<br />
I. A l’époque du couloir Chéronée-Tanagra.<br />
II. Après la formation des bassins fermés.<br />
III. Au Quaternaire moyen.<br />
IV. Au Würmien.<br />
V. Aux temps historiques.<br />
VI. Après le dessèchement de Copaïs.<br />
a. Creux aprks érosion du flysch etc.<br />
b. Réseau karstique no 1.<br />
c. Réseau no 2.<br />
d. Source karstique.<br />
e. Dépôts lacustres etc.<br />
f. Réseaun” 3.<br />
g. Réseau affaibli.<br />
h. Ancien niveau de la mer.<br />
i. Source sous-marine.<br />
j. Réseau mort.<br />
k. Source sous-marine affaiblie.<br />
1. Faille.<br />
X. Mt. Hélicon.<br />
P. Nord-est-Béotien.<br />
V. Couloir.<br />
W. Bassin Locrien.<br />
A. Bassin de Copais.<br />
Z. Bassin (Locrien) lacustre ou marin.<br />
T. Bassin (Locrien) marin (golfe Euboïque septentrional).<br />
168
Il est très difficile, pour le moment de trouver une explication assez satisfaisante<br />
de cette question de grandes sources sous-marines, pour plusieurs raisons.<br />
D’ailleurs nous ne savons pas si de telles sources existaient avant l’asskchement du<br />
lac Copaïs, alimentées engrande partie par le réseaukarstique souterrainn” 3, et si, quand<br />
ce réseau devint mort dans sa partie alimentée par ce lac après son assèchement, ces<br />
sources furent taries ou virent leur débit s’affaiblir jusqu’au point de ne plus donner<br />
à la surface de la mer aucun signe, facilement constatable, de leur existence.<br />
D’autre part, des recherches spéciales manquent dans la zone devant la côte de<br />
notre région pour constater si vraiment de telles sources n’existent pas à distance.<br />
I1 est vrai que le réseau karstique no 3 devint mort après l’assèchement du lac Copaïs,<br />
dans sa partie septentrionale et que la circulation d’eau dans le réseau no 2 diminua<br />
(fig. 3, VI). Mais, dans leurs parties méridionales ces deux réseaux alimentés par les<br />
lacs Yliki et Paralimni ne subirent pas le contrecoup de l’assèchement de Copaïs.<br />
Au contraire, elles doivent être enrichies en eaux surtout, celle du réseau no 3, étant<br />
donné quela surface de ces deux lacs s’agrandit après le dessèchement de Copaïs ($2)<br />
recouvrant ainsi d’autres surfaces calcaires aussi (I1).<br />
V. QUELQUES coNcLusioNs<br />
21. De tout ce qui a été exposé dans cette courte étude il devient évident que la<br />
région des lacs Béotiens est, même après l’assèchement du lac Copaïs, riche en eaux<br />
souterraines. Le réseau souterrain karstique no 3 devint mort dans sa partie septen-<br />
trionale après le dessèchement du lac, mais il s’enrichit fortement dans sa partie méri-<br />
dionale. Le réseau no 2 s’appauvrit dans sa partie septentrionale (I2) après le dessè-<br />
chement du lac, mais il s’enrichit peut-être dans sa partie méridionale, OU est d’ailleurs<br />
probablement entrecroisé avec le réseau no 3.<br />
Le réseau no 1 ne doit avoir subi aucun contrecoup sensible à la suite de l’assèche-<br />
ment du lac Copaïs.<br />
22. Les eaux de la partie méridionale du réseau Karstique souterrain no 3 doivent<br />
être très abondantes à cause de la très forte fissuration des calcaires, surtout dans le<br />
bassin du lac Paralimni. Une partie d’elles réapparaît à la côte, pas loin de la place de<br />
l’ancienne Anthédon, en sources salées puissantes pouvant être caractérisées sûrement<br />
comme sous-marines (i 3), tandis que le reste s’enfonce plus profondément probable-<br />
ment, et s’éloigne plus vers l’est ou le nord-est.<br />
Le réseau souterrain en effet doit avoir été assez approfondi et élargi durant les<br />
abaissements du niveau de la mer au Würmien et au Rissien.<br />
23. Dans la partie méridionale de la région des lacs Béotiens le réseau karstique<br />
souterrain no 2 est très probablement réuni avec celui du réseau no 3.<br />
Dans la partie septentrionale où le réseau no 3 est mort, une partie des eaux du<br />
réseau no 2 réapparaît à la surface dans les sources de la zone côtière, tandis que le reste<br />
s’enfonce plus profondément et s,’éloigne plus dans les ramifications du réseau formées<br />
durant les périodes de l’abaissement du niveau de la mer.<br />
24. I1 en est de même pour une partie des eaux du réseau no 1, qui en plusieurs<br />
endroits doit être réuni avec le réseau no 2. Une autre partie des eaux du réseau no 1<br />
réapparaît à la surface dans les sources de la circonférence du bassin de Copaïs (Poly-<br />
gyra, des Grâces, etc.).<br />
25. Pour les grandes quantités d’eau des trois réseaux karstiques souterrains qui ne<br />
réapparaissent pas à la surface se posent évidemment les questions suivantes.<br />
169
a) Dans quels lieux du golfe Euboïque septentrional est-il le plus possible qu’elles<br />
jaillissent, au moins une partie d’elles, en sources sous marines et à quelles profondeurs?<br />
b) Quels tracés suivent-elles au-dessous de notre région et des parties voisines<br />
d’autres régions, avant d’arriver à leur limite avec le bassin marin du golfe Euboïque<br />
septentrional?<br />
c) Ces eaux s’enfoncent-elles rapidement à des profondeurs relativement considé-<br />
rables, où se tiennent-elles à de faibles profondeurs, ce qui faciliterait leur capture?<br />
26. Evidemment il n’est pas possible d’avoir des réponses satisfaisantes à ces ques-<br />
tions avant des recherches et études approfondies sur la karstification souterraine de la<br />
région et de quelques parties des régions voisines.<br />
REFERENCES<br />
Voir : BITTNER A., Der geologische Bau von Attika, Boetien, Lokris und Parnassis,<br />
Wien 1878, p. 4; PHILLIPSON A., Bericht über eine Reise durch Nord-und Mittelgriechenland,<br />
Zeitschr. Ges. Erdkunde, Berlin 1890, p. 389.<br />
PHILIPPSON A., Die Griechischen Landschaften, 1, 2, Frankfurt 1951, p. 358 (se<br />
réfère à RENZ).<br />
Voir PHILIPPSON A., Der Kopais-See in Griechenland und seine Umgebung, Berlin<br />
1894, carte.<br />
Voir aussi : MISTARDIS GASP., Recherches sur l’hydrologie des massifs calcaires<br />
à plusieurs niveaux de base locaux de la Grèce méridionale, Premier Congrès<br />
Intern. Spéléologie, Paris 1953, C.R. tome 11.1, pp. 251-255.<br />
Voir pour certaines de ces sources : MISTARDIS GASP., Sur l’érosion Karstique souterraine<br />
jusqu’au-dessous du niveau actuel de la mer en Cynourie, Mani occidentale<br />
et Sphakia, Bull. Soc. Spéléologie de Grèce, VIII, 1966 pp. 153-160; ARONIS G.,<br />
Observations on the coastal karst of Greece, Mémoires tome V, Réunion d’Athènes<br />
1962, Assoc. Internat. Hydrogéologues, pp. 263-4; PAPAKIS N., Problèmes hydrogéologiques<br />
de la Grèce, Mémoires, V, 1962, Ass. Intern. Hydrog., p. 304; PETRO-<br />
CHILOS J., Recherches spéléologiques à Mani (en grec), Bull. Soc. Spéléol. Grèce,<br />
11.1953, p. 21.<br />
Voir en dehors de BITTNER (1) et PHILIPPSON (l,3j3) aussi : RENZ C., Der geologische<br />
Aufbau der Gebirge um das Kopaisbecken, Zeitsch. Deutschen Geologischen<br />
Ges., Bd. 65, 1913, pp. 607-619) et Die vorneogene Stratigraphie Griechenlands,<br />
Athènes 1955, PETRASCHECK W., Les gîtes des minéraux de fer-nickel<br />
de Locride (en grec), ïmtitute for Geology and Subsurjare Research, Athens, tome<br />
III, 1953, pp. 135-165, carte 1:50000, aussi carte 1:200000 dans Notes on the first<br />
field trip, October 1962, Athens Meeting, Internat. Assoc. Hydrogeologists, pp.<br />
12-13.<br />
Probablement aux périodes d’eaux abondantes, une partie des eaux du lac Copaïs<br />
s’échappaient par la trouée d’onchestos-Kaneski vers les bassins Ténérien et<br />
Aonien qu’elles transformaient en un grand lac; ensuite par le couloir Yliki-Paralimni<br />
se déversaient au bassin del’Euboïque septentrional (voir aussi : MAULL O.,<br />
Beiträge zur Morphologie des Peloponnes und des südlichen Mittelgriechenlands,<br />
Leipzig-Berlin 1921, p. 75).<br />
Voir aussi : MISTARDIS GASP. Sur te drainage karstique dans les régions calcaires<br />
côtières de la Grèce méridionale, Premier Congrès Internat. Spéléologie, Paris<br />
1953, C.R., tome IT, pp. 247-250.<br />
Voir aussi : MISTARDIS GASP., On shore line displacements in north and northeastern<br />
Peloponnesus during Middle and Recent Quaternary, IVme Colloque<br />
International Spéléologie, 1963, Athènes, C.R. pp. 20-44).<br />
Voir PETROCHILOS J.,>p. cit.<br />
La surface du lac Yliki de 13 km2 devint 22 et celle de Paramlini de 9 km2 passa à<br />
environ 15. (voir aussi : FELS E., Landgewinnung in Griechenland, Gotha 1944,<br />
pp. 64-66).<br />
I1 se Dose une auestion : si les eaux au’on avait trouvé orès de Néon Kokkinon<br />
(extrsme est du-bassin de Copaïs) pâr deux forages (profonds de 112 et 118 m)<br />
à travers les dépôts lacustres et les calcaires sous-jacentes (voir : TRIKKALINOS J.,<br />
Conditions hydrogéologiques de la Grèce (en grec), Annales géologiques des Pays<br />
Helléniques, VIII, 1957, pp. 99-134; ARONIS Cr., The need for Karstic ground<br />
water exploration in Greece (en grec), Athènes 1959, fig. 10, p. 18) proviennent en<br />
totalité du Mt. Ptoon (réseau Karstique na I) ou dans une certaine partie, d’infil-<br />
trations dans le bassin (réseau karstique no 2).<br />
(13) Voir : ARONIS G., Observations on the coastal karst of Greece, p. 262.<br />
170
DETERMINATION OF THE VERTICAL AND HORIZONTAL<br />
PERMEABILITIES OF FRACTURED ROCKS<br />
Dr. Kamal F. SAAD<br />
Desert Institute, Mataria, Cairo, U. A. R.<br />
This paper will be published in the issue of September of the Bulletin íASH.<br />
Fractured water bearing formation may be considered as an anisotropic aquifer.<br />
In case of the formation of horizontal fractures, the horizontal permeability represents<br />
the transmitting properties of the fractures and the vertical permeability represents<br />
that of the parent rock. Where in case the fractures are vertical. the transmitting<br />
properties are represented by the vertical permeability and that the horizontal perme-<br />
ability and that the horizontal permeability characterises the parent rock. That IS,<br />
the original rock was considered isotropic. The purpose of the present work is to<br />
determine both the vertical and horizontal permeabilities as well as the storative<br />
through the data of the pumping tests. The procedure is based on the double-slope<br />
method (Saad et al, 1964). Moreover, the magnitude of the vertical and horizontal<br />
permeabilities may indicate the pattern of the fractures through knowledge of easiness<br />
of flow in each direction.<br />
DETERMINATION DES PERMEABILITIES VERTICALE<br />
ET HORIZONTALE DES ROCHES FRACTUREES<br />
Dr. Kamal F. SAAD<br />
République arabe unie<br />
On peut considérer les formations aquifères fracturées comme des aquifères<br />
anisotropes. Lorsqu’il s’agit de fractures horizontales, la perméabilité horizontale<br />
correspond aux propriétés de transmissivité des fractures et la perméabilité verticale<br />
est celle de la roche-mare. Au contraire, lorsqu’il s’agit de fractures verticales, la per-<br />
méabilité verticale correspond aux propriétés de transmissivité des fractures et la<br />
perméabilité horizontale caractérise la roche-mère. Autrement dit, on considère que<br />
la roche-mère est isotrope. Le présent travail vise à déterminer les perméabilités<br />
verticale et horizontale des roches fracturées, aussi bien que leur capacité de réserve,<br />
par l’étude des données des tests de pompage. Le procédé employé est fondé sur la<br />
méthode de la double pente (Saad et al., 1964). De plus, la magnitude des perméabi-<br />
lités verticale et horizontale peut fournir des indices sur les réseaux de fractures si l’on<br />
connaît la facilité de 1’écoulement dans chaque direction.<br />
171
RESUME<br />
L’HYDROGRAPHIE DU KARST<br />
Dr Franc JENKO<br />
Les opinions diffèrent encore et l’on hésite toujours entre la théorie de la nappe<br />
d’eau karstique, et celle des cours d’eau indépendants du karst. La théorie de la nappe<br />
d’eau a commis l’erreur hydraulique de soutenir que, dans le sol perméable du Karst,<br />
les eaux situées au-dessous des bases extérieures d’érosion sont immobiles. La théorie<br />
des cours d’eau indépendants, par contre, pèche en ne prenant en considération que<br />
les cours d’eau appartenant aux cavités tectoniques du karst.<br />
Les recherches contemporaines ont découvert un triple système aquifère dans le<br />
karst : i) la nappe d’eau, 2) les rivières à perte et resurgence, 3) les courants d’eau sou-<br />
ter raine.<br />
Les explorations du Karst effectuées par sondage et par les méthodes de,géophy-<br />
sique ont permis de découvrir des nappes d’eau sinueuses fractionnées, horizontale-<br />
ment et verticalement à des profondeurs différentes et, jusqu’au niveau d’érosion de<br />
base (le quotient de la perméabilité de la matière karstique est compris entre et<br />
m/s). Les rivières présentant des pertes sont des cours d’eau nés dans des terrains<br />
plutôt imperméables (flysh, en partie dolmitique, glaciers, etc.) qui, en passant sur un<br />
terrain karstique, continuent leurs cours soit à la surface du sol soit dans des canaux<br />
étagés, et sont caractérisés par leur abondance dans le Karst perméable.<br />
Mais le transvasement des nappes d’eau emporte dans les profondeurs les réserves<br />
d’eau les plus importantes d’où la terrible aridité en surface des terrains karstiques.<br />
I1 est possible d’évaluer les débits de ces rivières souterraines présentant des pertes<br />
et ces cours d’eau des profondeurs par une méthode graphique spéciale dite des
INTRODUCTION<br />
Les vastes recherches hydrogéologiques modernes ainsi que la construction ont<br />
trouvé la science du karst impuissante devant les tâches que lui impose l’économie des<br />
eaux dans le karst. Par manque de connaissance hydrogéologiques, l’économie des<br />
eaux dans le karst a souvent enregistré des échecs, ce dont témoignent des recherches<br />
sans succès, d’eau potable, etc. Les phénomènes compliqués des rapports et des influ-<br />
ences de la matière et de l’eau dans le karst ont autrefois été traités d’une façon assez<br />
sommaire par une géologie déductivement qualitative et surtout par la géographie.<br />
Cependant, le karst est un phenomène hydrogéologique et géomécanique, un vaste<br />
système de drainage dans le calcaire et en partie le dolomite; ce sont donc surtout,<br />
l’hydrologie, l’hydraulique, la géologie et la géomécanique qui sont liées à la recherche<br />
moderne pour le développement de la science du karst. Ce n’est pas seulement la lutte<br />
pour cette science qui est difficile; ce n’est pas non plus la lutte avec le karst qui est<br />
dificile; ce qui est plus dur encore, c’est la lutte contre I’incompréhension du karst, les<br />
préjugés dont il est l’objet. I1 faut avant tout des principes scientifiques pour orienter,<br />
faciliter et rendre possibles les recherches à faire et les mesures à prendre dans le karst.<br />
Ces derniers temps, les recherches analytiques de quantité, les traitements des sec-<br />
teurs du karst dinarique comme d’importantes constructions relevant de l’économie<br />
des eaux se multiplient, ce qu’il convient de mettre à profit pour l’étude théorique et<br />
pratique du karst. Grâce à des recherches de mesures et au rapprochement des résul-<br />
tats, on aura du karst une image de plus en plus naturelle qu’il faudra seulement raffer-<br />
mir scientifiquement.<br />
PROBLEMES FONDAMENTAUX DU KARST<br />
Dans les mesures à prendre dans le karst pour l’économie des eaux, il faut d’abord<br />
étudier les centres géologiques, faire des analyses des quantités d’eau de surface et d’eau<br />
souterraine des principaux réservoirs d’eau, surtout des terrains et vallées karstiques<br />
pendant les inondations, établir les bilans des eaux et de leur écoulement, la part des<br />
eaux de condensation; il faut aussi délimiter les secteurs souterrains, découvrir les<br />
rivières à perte et les cours d’eau souterrains, et ce faisant, les relations de situation, de<br />
profondeur et de quantité des eaux karstiques; il convient encore de rechercher le degr6<br />
d’imperméabilité des terrains et vallées karstiques en vue de l’accumulation des eaux, des<br />
argiles du karst pour l’herméticité, de procéder à l’étude hydrogéologique de la matière<br />
et des zones propres à la construction, d’avoir des données et des résultats théoriques<br />
sur le karst et enfin de créer une méthode de recherches, de projets et de constructions<br />
dans le karst.<br />
Parallèlement, et en unissant diverses recherches particulières des domaines géolo-<br />
gique, hydrologique, morphologique et spéléologique, on peut résoudre bien des pro-<br />
blèmes karstiques, surtout les problèmes hydrologiques, par les bilans d’eau, par la<br />
méthode graphique particulière des ( lignes de transvasements souterrains ”, et si besoin<br />
est, par la comparaison des oscillations des hyétogrammes et des hydrogrammes; les<br />
problèmes géologiques, par la constatation des revêtements imperméables sur la terre<br />
(les cours d’eau souterrains évitent les revêtements plus épais), par la répartition des<br />
strates imperméables, leur rôle dans l’orientation et la rétention des cours d’eau; par<br />
la découverte des failles. On résoudra le problème morphologique par les formes et la<br />
répartition des diverses espèces d’entonnoirs karstiques, les problèmes spéléologiques<br />
par les gouffres et les hauteurs au-dessus du niveau de la mer des hautes et basses eaux<br />
et par là le niveau souterrain des eaux, leurs chutes et la direction des cours d’eau (les<br />
gouffres étant quelquefois le seul moyen de mesurer l’eau dans le karst), et s’il le faut<br />
par des analyses physico-chimico-biologiques et la coordination de la chaleur, de la<br />
dureté et des autres propriétés des eaux karstiques.<br />
173
LIGNES DE TRANSVASEMENTS SOUTERRAINS KARSTIQUES<br />
Les méthodes hydrologiques habituelles de l’analyse d’espace et de temps des quan-<br />
tités d’eau ne donnent aucun résultat dans les inondations des champs et des vallées<br />
karstiques, alors que la mesure des débits et des écoulements est impossible; vu la durée<br />
des inondations karstiques, il était également impossible de procéder à une stricte ana-<br />
lyse hydrologique, et par conséquent d’établir plus justement les bases pour l’économie<br />
des eaux dans le karst. En recherchant les lois de la circulation des eaux du karst, on<br />
a pu grâce à la méthode graphique des ( lignes de transvasements souterrains ) déter-<br />
miner quelques caractéristiques de l’hydromécanisme karstique et, par là, faire l’ana-<br />
lyse des régimes aquatiques du karst. Les inondations des terrains et vallées karstiques<br />
sont de plus longue durée et leurs écoulements souterrains plus modérés et plus équi-<br />
librés que les poussées des grandes eaux des autres cours d’eau de surface et souterrains;<br />
par conséquent, et compte tenu de la force maximum constatée des cours d’eau souter-<br />
rains karstiques, il est possible, grâce à un réseau suffisant de mesure des eaux, de<br />
répartir les cours d’eau karstiques d’après leur composition et de les analyser sous l’angle<br />
de leurs débits.<br />
174<br />
Fig. la<br />
eo04 nimaux duau<br />
mm I<br />
Fig. 16
La méthode graphique mentionnée ci-dessus établit une corrélation entre le niveau<br />
des inondations les plus marquées des terrains et vallées karstiques, et les débits des<br />
sources correspondantes. Pour les grandes pluies et inondations, on porte verticalement<br />
les niveaux quotidiens des inondations des terrains karstiques et horizontalement le<br />
débit des sources correspondantes. Les lignes de corrélation ainsi obtenues ont la<br />
forme d’une boucle dont la verticale antérieure avancée représente l’écoulement sou-<br />
terrain constant de l’inondation, les écartements de la boucle montrant les afflux de<br />
surface et souterrains intermédiaires, tandis que les cassures de la ligne de corrélation<br />
qui peuvent se manifester devant la boucle indiquent l’absorption des groupes particu-<br />
liers d’entonnoirs.<br />
Fig. IC<br />
La verticale apparaît à cause du fort écoulement constant de l’inondation; dans cette<br />
dernière il faut aussi comprendre l’afflux intermédiaire qui, après chaque pluie, glisse<br />
rapidement en quantités insignifiantes par rapport à l’écoulement de l’inondation même.<br />
Les brusques oscillations de la boucle même sont la conséquence des pluies intermédi-<br />
aires qui, pour un temps assez bref, augmentent l’écoulement et qui, par de rapides<br />
secousses allant même jusqu’à la verticale, montrent que l’écoulement par les rivières<br />
à perte et les entonnoirs est le même que l’inondation soit en hausse ou en baisse. La<br />
175
justesse de l’interprétation du graphique est encore prouvée par la comparaison avec<br />
les chutes et par le double calcul des afflux sur les champs karstiques dans les basses<br />
inondations ou les inondations en crue ou en décroissance, alors que l’afflux n’est pas<br />
encore contenu et qu’on le connait généralement par les courbes dans la mesure de<br />
l’écoulement, ce qui concorde avec les calculs de l’afflux provenant de l’écoulement<br />
souterrain et des modifications quotidiennes de l’inondation. Outre la capaciié d’ab-<br />
sorption des entonnoirs et des groupes d’entonnoirs des champs et des vallées karstiques,<br />
et les afflux souterrains intermédiaires, cette méthode découvre encore le fait que l’écou-<br />
lement souterrain del’inondation, àpartir du transvasement des entonnoirs, est constant<br />
et indépendant du niveau de l’inondation; eile montre en même temps les liens entre<br />
les diverses eaux souterraines, car la boucle caractéristique apparaît seulement dans les<br />
lignes de dépendance des inondations karstiques et des sources réellement correspon-<br />
dantes. C’est par cette méthode à laquelle sont venues se joindre d’autres recherches<br />
que l’on a traité les régimes aquatiques du karst en Slovénie.<br />
BILAN<br />
DES EAUX KARSTIQUES, COEFFICIENT D’ÉCOULEMENT, LIGNES DE PARTAGE DES EAUX,<br />
EAU DE CONDENSATION<br />
Les bilans d’eau des cours d’eau karstiques à certains endroits caractéristiques,<br />
établis par les cartes des chutes de pluie d’une année ou de plusieurs années, les mesures<br />
des quantités d’eau de périodes hydrologiques, la comparaison des hydrogrammes et<br />
hyétogrammes qui conviennent, et surtout les chutes sur les pluviomètres et les oscilla-<br />
tions du niveau sur les pluviomètres, le tout se joignant s’il le faut a la coloration et<br />
aux recherches quantitatives des eaux karstiques et aux analyses géologique, morpho-<br />
logique et spéléologique des secteurs d’eau permettent souvent de résoudre les plus<br />
urgents problèmes que pose le karst.<br />
Tandis que les afflux maximums des grandeseauxdansle karst sont l’expression d’une<br />
hydraulique occasionnelle, l’écoulement en général et l’écoulement particulier des petites<br />
eaux sont les données hydrologiques basiques du karst qui aident à résoudre approxi-<br />
mativement les problèmes du karst. C’est ainsi qu’on a constaté, eu égard aux années<br />
sèches ou humides, aux années à neiges abondantes ou plus rares, un coefficient d’écou-<br />
lement de près de 0,6-0,7 pour le karst plat, 0,7-0,8 pour le karst profond, et 0,8-0,9<br />
pour le karst de haute montagne. L’écoulement particulier des petites eaux karstiques<br />
est caractéristique, bien que dépendant lui aussi surtout de l’épaisseur du karst; il est<br />
à peu près de 2 i/s km3 dans le karst plat, 3 l/s km2 dans le karst profond, et 5 l/s km2<br />
dans le karst de haute montagne, ce qui aide à classer les secteurs d’eau du karst en<br />
petites eaux. Les eaux plus hautes ont souvent une circulation très compliquée et il faut<br />
par les autres recherches les classer comme intermédiaires avec indication des apports<br />
d’eau.<br />
On souligne souvent la portée des eaux de condensation dans le karst, en disant<br />
qu’elles fournissent un apport considérable aux eaux karstiques qui montent en temps<br />
de sécheresse ou de grande chaleur. Cependant la comparaison des hydrogrammes<br />
karstiques et non karstiques pour les étés chauds et les hivers froids montre une sem-<br />
blable oscillation des eaux, dépendant uniquement du karst et de tous les facteurs du<br />
climat. Les eaux de condensation n’enrichissent pas sensiblement les eaux du karst, ce<br />
qui s’applique aussi aux sources karstiques du bord de la mer et aux sources sous-mari-<br />
nes.<br />
CARACTERISTIQUES PHYSICO-CHIMICO-BIOLOGIQUES ET DÉPOTS DES EAUX KARSTIQUES<br />
Les résultats les plus récents sont traités dans d’autres rapports; nous ne voulons<br />
indiquer ici que quelques phénomènes fondamentaux importants pour I’hydrotechnique.<br />
176
L’essence de la formation du karst est un phénomène géomécanique particulier de<br />
lavage et d’entraînement de débris de la matière écrasée par les eaux d’infiltration et les<br />
eaux d’écoulement sous terre, ainsi qu’une désagrégation et un entraînement de la surface<br />
par des infiltrations inégales, surtout par le CO2 de l’humus des eaux de pluie actives.<br />
Le karst est donc formé de matières tectoniquement écrasées, broyées, lavées par<br />
l’érosion dans les profondeurs de fissures et fossés, et à la surface recevant sa forme de<br />
la corrosion. En résumé, c’est surtout du calcaire, du dolomite en blocs et non pas<br />
sablonneux avec une plus faible proportion d’autres roches; quant à la solubilité dans<br />
l’eau, la corrosion existe à côté de l’érosion dans les profondeurs, pour le gypse, le sel<br />
et la giace; dans les terres noires, la putréfaction des herbes de steppe permet le creusage;<br />
dans la lave, ce sont les gaz dégagés et divers courants de lave non encore solidifiée<br />
dans la matière déjà dure.<br />
Les bilans chimiques de l’entraînement du calcaire dissous par l’eau du karst qui,<br />
dans le carst dinarique, montrent un dépôt annuel de 0,07 mm ou environ 200 m du<br />
pliocène moyen jusqu’à nos jours, c’est-à-dire une période de 3 millions d’années, nient<br />
eux aussi la corrosion souterraine. La dénudation karstique est bien plus faible que la<br />
dénudation non karstique, et elle est en grande partie chimique. De l’inconstance des<br />
eaux dans le karst et de leur écoulement il résulte que la moyenne de la formation des<br />
cavités en activité est de 1/1000 de la matière; cela revient à dire que, pour une matière<br />
de 300 m d’épaisseur, une strate d’épaisseur a 30 cm. I1 est impossible d’imaginer que<br />
la forte dissolution du calcaire dans le karst durant cette longue ère géologique du pliocène<br />
à nos jours n’aurait produit qu’une strate insignifiante de 30 cm pour se diriger<br />
ensuite vers la surface où sont dans presque leur totalité les 200m de calcaire rest?<br />
La dureté de 1”eau est surtout dans la ligne de dépendance de l’humus comme saturant<br />
de l’eau en COZ. L’eau avec COZ dissout principalement les carbonates qui sont<br />
plus solubles à chaud qu’à froid; cependant, l’eau froide absorbe plus de COZ, d’où<br />
il s’ensuit que les eaux d’hiver sont insensiblement plus dures que les eaux d’été. Dans<br />
l’écoulement et le réchauffement des eaux, les excédents d’équilibre de COZ s’évaporent<br />
et il reste le calcaire et le dolomite. Ces deux ne se dissolvent qu’à la surface du karst<br />
jusqu’au point de l’épuisement d’équilibre en COZ dans l’eau; dans l’écoulement souterrain,<br />
le plus souvent la dureté des eaux diminue insensiblement, les carbonates sont<br />
libérés sous formes de stalactites et de dépôts sur les parois.<br />
La présence de dépôts dans les grottes est souvent interprétée par l’évaporation des<br />
eaux dans les grottes; cependant, ces dernières sont humides, presque à 100%. 11 faut<br />
en rechercher la cause dans la fuite hors de l’eau de l’excès de COZ, peut-être sous l’influence<br />
des différences de température, des changements de la tension de COS dans l’eau<br />
et le gonflement intérieur des gouttes d’eau et des eaux glissantes. I1 n’y a de depôts que<br />
dans les grottes d’où l’eau s’est retirée; dans les grottes où il y a de l’eau, soit permanente<br />
soit temporaire, on trouve tout au plus quelques dépôts sur les parois, mais pas<br />
de stalactites.<br />
Le vrai karst est presque sans entraînement d’érosion et les eaux karstiques presque<br />
sans apports. Elles en ont, en moyenne au-dessous de 1/10 de moins que les cours d’eau<br />
non karstiques; les accumulations d’eau artificielle dans le karst sont presque d’une<br />
durée illimitée (seules quelques rares sources dégorgent de temps en temps quelques<br />
apports qui viennent surtout des fonds et des éboulements intérieurs; quelques sources<br />
sorties de l’argile sont fortement troubles).<br />
Les eaux du karst se purifient légèrement par un modeste filtrage à travers les matières<br />
broyées; leur principale amélioration se fait dans le dépôt des impuretés et par<br />
conséquent des germes, grâce à l’écoulement lent des rivières à perte et des cours d’eau<br />
souterrains dans les fissures et les canaux. Les eaux de moyenne hauteur entraînent les<br />
dépôts (les eaux les plus hautes smt de nouveau plus lentes), ce qui est préférable à<br />
une souillure des petites eaux. En général, les eaux karstiques d’été et d’hiver sont sanitairement<br />
plus ou moins sans défaut, dans la mesure où des affluents non karstiques,<br />
177
le degré d’ennuagement et les impuretés amenées par les pluies ne créent pas des excep-<br />
tions; les eaux de printemps et d’automne sont plus sujettes à des changements. Les<br />
cours d’eau souterrains qui durent plus d’un mois sont de eaux parfaitement pures.<br />
Quant à leur composition chimique, les clacaires et les dolomites du karst dinarique<br />
ont plus de 99% de Caco3 ou MgC03, et le reste est formé de SiO2, A1203, Fe203,<br />
humidité et autres composants.<br />
HYDROMECANIQUE SOUTERRAINE DU KARST<br />
Le centre et le champ d’activité le plus compliqué de la théorie et de la pratique du<br />
karst est l’hydromécanique souterraine. Malgré une grande facilité d’accès naturelle<br />
et la découverte artificielle du karst, tout est longtemps resté obscur. Dans leur essence<br />
les opinions hésitaient et partiellement hésitent encore entre la théorie de la nappe d’eau<br />
karstique et celle des cours d’eau karstiques. La théorie de la nappe d’eau prévoit dans<br />
le karst une c eau de fond >> immobile, au niveau de la mer et au niveau des bases ter-<br />
restres d’érosion, et au-dessus d’elle et variable dans sa dépendance des chutes, une<br />
( eau karstique ) s’écoulant par les sources karstiques; elle prévoit aussi que les canaux<br />
d’érosion, par l’épuisement de COS dans l’eau se dispersent probablement dans I’in-<br />
térieur du karst dans des fissures. La théorie des cours d’eau du karst soutient un sys-<br />
tème souterrain en étages comprenant des cavités tectoniques reliées entre elles hori-<br />
zontalement et verticalement par des canaux de corrosion, le tout rempli d’eau variable.<br />
La théorie de la nappe souterraine a commis l’erreur des canaux de circulation se<br />
rétrécissant dans le sens du courant de l’eau et l’erreur hydraulique du principe de<br />
l’immobilité des eaux dans le karst perméable au-dessous du niveau des bases d’érosion;<br />
cette théorie ne pouvait donc pas connaître les courants profonds, souvent en siphons,<br />
de cette (< eau karstique ».<br />
Fig. 2<br />
La théorie des cours d’eau souterrains présente des lacunes hydrogéologiques et<br />
hydrologiques par ses cours d’eau karstiques indépendants liés aux ( cavités tecto-<br />
niques ) mais non rattachés, du moins aux eaux basses, aux bases d’érosion; cette théo-<br />
rie, même si elle reconnaissait l’existence des cours d’eau à siphon, ne pouvait embrasser<br />
les nappes souterraines et leurs courants de profondeur. Ces erreurs techniques ont<br />
entraîné des pertes économiques. En niant l’existence des cours d’eau au-dessous du<br />
niveau des bases d’érosion, on a commis des erreurs dans l’endiguement des cours d’eau<br />
karstiques : en niant l’existence des nappes souterraines et des courants souterrains,<br />
on a recherché l’eau à tort et on a élargi les entonnoirs et les entrées des cavités pour<br />
renforcer les écoulements. Et cependant, les nappes souterraines sont des unités hydrau-<br />
liques dont les cours d’eau ne dépendent que de leur chute comme de la dimension et<br />
178
de la forme des cavités et du mouvement; dans les cours d’eau souterrains et dans les<br />
rivières à perte, il y a une dépendance des conditions hydrauliques de l’ensemble des<br />
secteurs souterrains et non pas seulement des entonnoirs et de l’entrée des cavités. Les<br />
recherches actuelles et l’expérience du karst, les lois hydrauliques des eaux et les pro-<br />
priétés des carbonates montrent qu’il existe dans le karst un triple système aquatique :<br />
i) nappes d’eau; 2) rivières à perte et jets; 3) courants souterrains.<br />
Des sondages et des recherches géophysiques dans le karst dinarique découvrent<br />
des nappes interrompues, en degrés, sinueuses, à diverses profondeurs, les plus basses<br />
près des bases d’erosion. Imperméables dans leur essence, les masses carbonées sont,<br />
dans la nature, toujours écrasées et perméables; mais selon qu’elles sont lavées ou au<br />
contraire chargées de dépôts ou d’argile, elles ont un comportement local différent.<br />
En temps de sécheresse, elles prédominent, saturées d’eau, à côté des masses sans eau;<br />
en période de pluies, les eaux de nouveau s’élèvent à des niveaux différents et s’écoulent<br />
au dehors dans les fissures et les canaux (le coefficient de perméabilité de la matière<br />
karstique, même sans grandes fissures ou canaux est : k = 10-5 - 10-7 m/s). Les rivières<br />
a perte sont des cours d’eau nés dans des matières imperméables comme le flysch, les<br />
glaciers, le dolomite sableux qui, en passant dans le karst continuent leur cours excep-<br />
tionnellement sur terre et le plus souvent sous terre dans divers défilés et canaux, rece-<br />
vant OU perdant de l’eau sur leur parcours selon les pluies ou la sécheresse, la saturation<br />
et l’état se de la matière environnante. Ce comportement des rivières à perte dans<br />
le karst et sur le karst est la conséquence d’un excès d’eau dans une matière trop peu<br />
perméable et des dépôts de calcaire et d’argile dans leur lit. ’<br />
Les revêtements imperméables ayant été dénudés, les eaux de pluie ont chassé l’air<br />
des matières perméables et se sont infiltrées jusqu’aux bases imperméables. Les e au<br />
ont saturé les masses imperméables jusqu’aux niveaux des bases d’érosion intérieures<br />
et extérieures (bases imperméables premières ou plissées intérieurs et extérieures); les<br />
eaux gonflant encore, elles ont commencé à se répandre en dehors, créant ainsi dans la<br />
nappe divers courants souterrains, sinueux, horizontaux et verticaux; au-dessus des<br />
nappes, l’arrivée de diverses eaux étrangères dans la matière perméable a formé des<br />
rivières à perte.<br />
Les courants souterrains sont les voies d’écoulement fondamentales du karst, avec<br />
des niveaux piézométriques aux basses eaux, aux points terminus d’érosion des bases<br />
d’érosion correspondantes. C’est là l’essence du terrible manque d’eau sur le Karst o&<br />
aux périodes de sécheresse, disparaît sur d’immenses superficies jusqu’à la moindre<br />
trace d’eau.<br />
Des sondages et des recherches spéléologiques montrent les niveaux piézométriques<br />
des cours d’eau souterrains qui passent asymptotiquement à l’horizontale vers les<br />
sources ou plutôt s’élèvent de 0,l à 1 %. Ce qui est égaiement compréhensible, c’est la<br />
croissance et ensuite l’affaiblissement de la rapidit6 de transvasement dans les cours<br />
d’eau souterrains et partiellement dans les rivières à perte avec la montée du niveau<br />
(de quelques centimèires/seconde à 1 décimètre/seconde, avec UP léger abaisspment aux<br />
niveaux les plus élevés). L’augmentation du transvasement fait que siphons et gorges<br />
unissent toujours davantages la chute des eaux; leur vitesse d’écoulement augmente de<br />
3 à 6 m/s, ce qui accentue le cours tourbillonnant et même parfois le mélange percep-<br />
tible de l’air à l’eau, la quantité du transvasement restant stable. Les niveaux d’eau<br />
s’élèvent ainsi égaiement dans les parties du cours à plafond plus haut, ce qui a pour<br />
effet de diminuer les vitesses. Comme un pareil comportement des eaux prévaut dans<br />
les secteurs souterrains, les vitesses d’écoulement diminuent avec I’dlévation du niveau<br />
des eaux. C’est là en même temps cet afflux maximum des cours d’eau souterrains que<br />
nous avons déjà mentionnés.<br />
L’infiltration allant de la surface vers les rivières à perte où les cours d’eau souter-<br />
rains et la retenue des eaux dans les champs et vallées karstiques étouffent les grandes<br />
eaux karstiques, et dans le karst terrien, elles sont de 5 à 10 fois plus faibles que les<br />
179
grandes eaux non karstiques; il n’y a guère de fetenue des eaux dans les rivières à perte<br />
et les cours d’eau souterrains. I1 résulte de tout cela que des croisements de cours d’eau<br />
souterrains sont possibles - bien que rares - à des niveaux différents ou méme des<br />
croisements de cours d’eau karstiques avec des cours d’eau de surface (par exemple la<br />
grande source sur la rive droite de la Sota en face de la source Mrzlek, etc.). L’hydro-<br />
mécanique du point de rencontre du karst et de la mer est également caractéristique;<br />
là, des eaux karstiques au-dessus et au-dessous de la mer, les diverses densités des eaux<br />
douces et des eaux salées, le mouvement des marées créent un énigmatique accrois-<br />
sement et décroissement des eaux et méme une absorption des eaux ainsi qu’un flux<br />
et reflux et une modification dans la teneur en sel des sources karstiques de la côte. En<br />
général, dans les périodes humides, toutes les sources sont douces; dans les périodes<br />
sèches elles sont plus salées et diversement soumises aux marées; elle décroissent ou<br />
même tarissent; ça et là, les sources sous-marines deviennent même des entonnoirs<br />
(les ( moulins marins D de l’île de Kephalonia en Grèce absorbent constamment la<br />
mer et font tourner deux moulins.<br />
Circulation das eaux<br />
doucc2s ut SalCGS<br />
c<br />
IQau .dQ<br />
+<br />
Fig. 3<br />
-loaidcuce<br />
Depuis longtemps on interprète tous ces phénomènes de diverses façons; on les<br />
a d’abord considérks du point de vue hydrodynamique, tandis qu’aujourd’hui on con-<br />
sidère comme fondée l’interprétation hydrostatique. L’explication hydrodynamique<br />
repose sur la supposition d’une succion de l’eau des veines inférieures aux veines supé-<br />
rieures par des goulots aux croisements; mais la fausseté de cette interprétation est<br />
prouvée par le fait que ce sont justement les petites eaux qui sont le plus salées, et que<br />
certaines sources sous-marines absorbent méme la mer en temps de sécheresse; par<br />
ailleurs, il est impossible qu’il y ait dans le karst tant de siphons hermétiques. Tout<br />
comme les bases d‘érosion terrestre, le karst déverse ses eaux vers la mer en courants<br />
d’eau souterrains réguliers qui, à cause de la friabilité du terrain à leurs embouchures<br />
se dispersent en multiples sources s’étendant sur des kilomètres. En principe, des cal-<br />
culs expliquent tous ces phénomènes comme une circulation des eaux douces et des<br />
eaux salées à leur profond point de rencontre et par des afflux d’eau douce.<br />
HYDROMÉCANIQUE KARSTIQUE APPLIQUEE<br />
Le karst et surtout le karst dinarique est une région de peuplement, une région de<br />
passage et une région économique. Pour l’homme, le karst est plus sain que les terres<br />
formées de roches éruptives ou métamorphosées, car le calcaire est en lui-même indis-<br />
pensable à la vie, et par son origine marine il contient des substances également néces-<br />
saires (iode, brome, sel, etc.). Evidemment, la terre et l’eau sont essentielles pour le<br />
peuplement. Les champs karstiques argileux, les cuvettes de ñysch’avec des cours d’eau<br />
et des nappes souterraines remplissent ces conditions; lemste du karst, sans eau et bois,<br />
180
lande ou pâturage. En lui-même, le karst n’est pas ennemi de la végétation; les débris<br />
de calcaire et de dolomite sont plus fertiles par exemple que les terres lourdes, les bois<br />
du karst ressemblent à tous les autres bois, mais ce sont cependant les landes arides qui<br />
prédominent en raison du climat et des mesures prises par l’homme.<br />
Sous l’angle hydrologique, l’agriculture est praticable dans les champs karstiques,<br />
les vallées de flysch et autres vallées imperméables; les pâturages occupent les coteaux<br />
de dolomite et la forêt le calcaire karstique. La configuration du terrain suit cette divi-<br />
sion : d’abord la plaine, puis les coteaux et, pour la forêt, toutes les situations depuis<br />
le terrain plat jusqu’aux pentes raides.<br />
Dans le karst, l’essence de tout c’est l’eau, soit qu’il y en ait trop dans les inondations<br />
des champs et des vallées karstiques, soit qu’il en manque le reste du temps et dans les<br />
autres parties du karst. L’eau est en meme temps une matière première, une source<br />
d’énergie. L’économie des eaux est directement intéressée à l’eau pour l’énergétique,<br />
les amendements, les adductions d’eau, les alluvions et la possible navigation, mais<br />
l’économie tout entière est indirectement touchée par la question de l’eau.<br />
Les mesures prises dans le passé se sont avérées en grande partie inefficaces. On a<br />
élargi les entonnoirs et les cavités pour arrêter les inondations, mais sans grands<br />
résultats; pour le ravitaillement en eau, on creuse sans succès des puits; on étend des<br />
conduites d’eau sur une centaine de kilomètres, on puise jusqu’à 1.000 mètres. 11<br />
s’agit ici de savoir si on restera à l’acqueduc romain avec de longuses conduites hori-<br />
zontales ou si, dans des conditions favorables, on passera au puisage de l’eau des cours<br />
d’eau souterrains et des nappes environnantes. Par leur grande abondance, leurs chutes<br />
convenables, l’absence de dépôts, la possibilité de les accumuler et de les retenir, les<br />
eaux du karst deviennent importantes comme source d’énergie; ainsi s’ouvrent de<br />
nouvelles perspectives pour des réalisations jusqu’à présent u non rentables », pour la<br />
captation des eaux en lacs, le ravitaillement en eau et d’autres possibilités. Tandis que<br />
le manque d’eau des landes karstiques est un problème économique insoluble et que la<br />
forêt et partiellement le pâturage sont les seules solutions possibles, pour les champs,<br />
et les vallées karstiques, on peut remédier aux inondations et à l’état marécageux, ou<br />
si cela risquait d’entraîner de trop grands frais, on peut capter les eaux en lacs pour la<br />
pêche et le tourisme. D’une façon général, il n’est pas encore possible de situer tangi-<br />
blement la place des cours d’eau souterrains dont on connaît hydrogéologiquement<br />
l’existence. Des mesures géoélectriques ou mieux encore gravimétriques montrent par<br />
exemple a une approximation de 10 m la position des cavités s&hes avec leur coupe<br />
au-dessus de 100 m2 de surface jusqu’à une profondeur de 60 mètres mais on ne peut<br />
pas constater les fonds.<br />
Les principales mesures à prendre dans le karst dinarique sont l’accumulation des<br />
eaux, diverses espkes d’endigages, le relèvement et la réorientation des cours d’eau<br />
de surface et souterrains pour des fins énergétiques, avec solution simultanée des amen-<br />
dements, des adductions d’eau et autres questions. Pour cela il est nécessaire de con-<br />
naître la situation et le volume des cours d’eau et la perméabilité de la matière. Pour<br />
quelques cours d’eau dont la hauteur et le volume conviennent et pour les champs et<br />
vallées peu karstifiés, les accumulations sont réalisables sous les angles technique et<br />
économique. On peut procéder à l’exploration des fonds et des flancs par des forages<br />
géologiques et la mesure de la perméabilité des masses et des surfaces des nappes sou-<br />
terraines. Aux points de vue technique, économique et de la protection du pays, surtout<br />
pour les eaux captéees en lac supérieurs, le bon moyen est de rendre hermétiques les<br />
zones d’entonnoirs par un revêtement d’argile avec filtres de protection en haut et en<br />
bas. Les rideaux d’herméticité dans le karst retiennent ou dirigent les eaux, mais il faut<br />
qu’ils soient reliés à la matière imperméable. Comme le prouve l’accumulation de la<br />
Cetina dans la longue vallée calcaire au-dessus de Split, des rideaux tombant assez bas<br />
sont efficaces dans le calcaire assez broyé (la purification du cours d’eau au-dessous du<br />
rideau devant être assez lente pour que, pendant ce temps, la surface de l’accumulation<br />
181
devienne alluviale). Les avantages du karst résident aussi dans la faiblesse des apports<br />
et celle des grandes eaux, et dans l’impossibilité des inondations et de la pénétration<br />
des eaux dans les charnps karstiques fermés.<br />
Les impuretés entraînées par l’eau peuvent être évitées dans le karst grâce à des<br />
industries convenables qui ne souillent pas les eaux; on peut encore dériver ces impu-<br />
retés dans les cours d’eau souterrains de plus longue durée et moins endommagés et<br />
enfin, s’il le faut, on peut procéder aux nettoyages les plus urgents.<br />
Dans les secteurs non peuplés et non agricoles, les eaux karstiques n’ont en général<br />
pas besoin d’être améliorées pour l’approvisionnement en eau; ce qui s’impose, c’est<br />
la possibilité de les désinfecter dans les cas extraordinaires, tandis que les eaux des inon-<br />
dations et celles de l’arrière-pays avec des eaux de surface doivent &re purifiées et<br />
désinfectées. Dans le karst, jusqu’à présent, l’approvisionnement en eau a dépendu de<br />
rares sources sur terre et de sources au bord de la mer. Les plus grandes quantités d’eau<br />
se trouvent dans les cours d’eau souterrains qui sont encore en grande partie non exploi-<br />
tés. C’est pourquoi pour l’instant, la principale possibilité d’avoir de l’eau en quantité<br />
suffisante réside dans les fortes sources et les fossés et canaux au voisinage des cours<br />
d’eau souterrains. Les pertes d’eau des gouffres à perméabilité mesurée permettent de<br />
calculer théoriquement le quotient approximatif de perméabilité de la masse karstique;<br />
à partir de la chute extrême du niveau des nappes souterraines, on peut calculer la<br />
longeur des fossés de recueil des eaux pour des eaux déterminées. Dans la perméabilité<br />
la plus fréquente de la matière karstique, k = 10-5 à 10-7 m/s, on peut obtenir théo-<br />
riquement dans les nappes karstiques souterraines un débit approximatif de 100 l/s sur<br />
une longueur de canal de 240 mètres.<br />
Le ravitaillement en eau est plus tragique au point de rencontre du karst et de la mer<br />
que sur la terre karstique. Depuis longtemps on essaie d’obtenir de l’eau douce des<br />
cours d’eau karstiques qui se jettent dans la mer en mettant au jour le siphon supposé<br />
sur la côte et plus récemment en captant les sources sous-marines dans des tuyaux<br />
flexibles et des passages flottants, et en bouchant les sources par des injections de ciment.<br />
Cependant, à cause de leurs sinuosités en siphons et de l’affaissement local du littoral,<br />
les cours d’eau souterrains sont susceptibles de couler à l’arrière à plusieurs centaines<br />
de mètres au-dessous du niveau de la mer. L’eau douce et l’eau salée se mélangent sur-<br />
tout aux divisions des veines d’eau sous le rivage; par endroits, l’eau de mer étant plus<br />
lourde inonde les espaces les plus profonds des veines d’eau dans les petites eaux, loin<br />
à l’intérieur, mais les grandes eaux la repoussent à leur tour. I1 n’est possible de recueil-<br />
lir de l’eau douce que plus à l’arrière, au moyen de fossés et de canaux dans les bandes<br />
des cours d’eau souterrains, et juste au-dessous du niveau de la mer, et cela par épuise-<br />
ment seulement d’une partie de l’eau douce. En empêchant par des rideaux d’herméti-<br />
cité qui coûtent cher les fuites souterraines dans la mer dans le secteur des cours d’eau<br />
souterrains de la côte, on peut attirer à la surface ou puiser dans les profondeurs de<br />
plus grandes quantités d’eau sans traces de sel.<br />
182
THE INFLUENCE OF FAULTING ON THE DISTRIBUTION<br />
OF DOLINES: THE MIDDLE ATLAS LIMESTONE<br />
PLATEAU OF AFENNOURIR<br />
Jacques MARTIN<br />
Morocco<br />
Summary of a proposedpaper on a karstic problem in Morocco<br />
Numerous depressions in the Middle Atlas are ascribable directly or indirectly to<br />
tectonic accidents. A fault line may determine the formation of a doline at a particular<br />
spot. In the case under consideration, the evolution of a dense network of subsidence<br />
dolines was arrested following the development of a graben. This crust movement<br />
brought about the disappearance of the charged groundwater system, and the drying-<br />
out of a whole tier pocked fossil dolines.<br />
The paper would comprise a section describing the Afennourir region, with an<br />
exposition of the hypothesis of tectonic and hydrological cataclysms and their conse-<br />
quences.<br />
LE ROLE DES FAILLES SUR LA REPARTITION<br />
DES DOLINES D’EFFONDREMENT : L’EXEMPLE<br />
D’AFENNOURIR, CAUSSE MOYEN ATLASIQUE<br />
Jacques MARTIN<br />
Maroc<br />
Résumé d’une communication éuentuelle sur un problème karstique au Maroc<br />
De nombreuses dépressions karstiques du Moyen Atlas sont liées directement ou<br />
indirectement aux accidents tectoniques.<br />
Une ligne de faille peut déterminer localement la formation d’une doline. Dans le<br />
cas envisagé, un réseau dense de dolines d’effondrement a eu son évolution bloquée à<br />
la suite de l’affaissement d’un graben. Ce mouvement de blocs a entraîné la disparition<br />
du réseau souterrain sous pression et l’assèchement de tout un gradin criblé de dolines<br />
fossiles.<br />
La communication comprendrait une partie descriptive de la région d’ Afennourir,<br />
le développement de l’hypothèse des bouleversements tectoniques et hydrologiques et<br />
leurs conséquences.<br />
183
RESUME<br />
LES EAUX SOUTERRAINES À LA BASE DES<br />
COUCHES DURES NON STRATIFBES ET LES<br />
CAVERNES DE LA BASE<br />
Ernst SOBOTHA<br />
Dans la région des couches épaisses, dures et non stratifiées les fissures diaclases et<br />
les zones de faille rassemblent les eaux d’infiltration. S’il y a une zone d’altération per-<br />
méable, l’eau s’infiltre vitement atteignant des profondeurs remarquables. L’écoulement<br />
de l’eau souterraine et le débit des sources sont grandes. SI les couches dures ont subi<br />
des pressions et des tensions tectoniques on trouve des phénomènes karstiques même<br />
dans les grès massifs, par exemple dans l’environ du BURGWAFD en Hesse.<br />
Dans les terrains calcaires les problèmes du karst sont bien connus. Mais on a<br />
oublié l’importance de la zone de base des couches non stratifiées, où surtout dans les<br />
synclinales la tectonique ouvre des diaclases. Les eaux y forment un système de caver-<br />
nes suivant la face inférieure des couches inclinées. On le peut observer en Iran comme<br />
en Sicilie, en Tunisie et en Yougoslavie. C’est une zone difficile pour 1a.construction<br />
des barrages, mais elle conduit rapidement l’eau dans la profondeur alimentant des<br />
nappes artésiennes avec des eaux relativement froides.<br />
ABSTRACT<br />
Underground water at the base of non-laminated hard srrata and caverns otz the lower<br />
conlact<br />
In the region of thick non-laminated hard rocks strata, water of infiltration accumulates<br />
in the fissures, joints and brecciated zones. If there is a permeable weathering<br />
layer, the water infiltrates rapidly and reaches notable depths. The flow of underground<br />
water and the discharge from springs are both considerable. If the hard strata have<br />
undergone tectonic alteration by pressure and tension, karstic phenomena are encountered<br />
even in compacted sandstones, e.g. in the neighbourhood of the Burgwald in<br />
Hesse.<br />
In the calcareous terrains the karst problems are satisfactorily known, but there<br />
has been forgetfulness of the importance of the base zone of the compacted non-laminated<br />
beds, where, particularly in the synclinals, tectonic action opens diaclases. In<br />
this zone the water forms a system of caverns along the lower contact of the inclined<br />
beds. Examples are to be found in Iran, Sicily, Tunisia and Yugoslavia. This is difficult<br />
country for dam-building, but it does carry water down to the depths at high speed and<br />
recharges the artesian reservoirs with relatively cold water.<br />
Dans les roches meubles la perméabilité est un problème de la porosité d’interstices-<br />
Quand il s’agit de trouver assez d’eaux dans des roches endurcies et cimentées un cher-<br />
cheur d’eau ne peut pas compter beaucoup seulement sur la porosité de fissures. Les<br />
sondages dans la rkgion des roches cimentées n’atteignent pas des nappes normales<br />
comme dans les sables et les graviers. Les courants d’eau dans les fissures et les dia-<br />
clases sont séparés, le niveau de l’eau souterraine change rapidement. I1 y a des son-<br />
dages secs à quelques mktres d’une source.<br />
En cherchant le lieu d’un sondage il faut d’abord s’informer sur les zones des fis-<br />
sures et des diaclases. On connaît les zones des failles en répérant une carte géologique.<br />
Si les couches de la région sont uniformes ce n’est pas facile,mais peut-être comme dans<br />
les granites et les chistes du Briovérin de la Bretagne des petits morceaux de quartz<br />
sont les indices de fractures et de diaclases. La tâche fondamentale c’est l’épreuve que<br />
les diaclases soient ouverts. Les fissures fermées soit par pression tectonique soit par<br />
remplissage n’ont pas d’eau. C’est dommage qu’il n’y ait pas aujourd’hui une méthode<br />
184
annonçant la direction des forces tectoniques dans l’écorce terrestre. I1 faut étudier<br />
l’histoire géologique d’une région, constater les mouvements antérieurs et rechercher<br />
les caractères lithologiques.<br />
Ce sont les zones des roches dures où la pression et la tension tectonique forment<br />
des diaclases et des fissures ouvertes et fermées. I1 faut donc chercher ces zones.<br />
I1 y a des zones de failles entourant les blocs formés par des grès massifs et des cal-<br />
caires compacts. Si elles sont provoquées par des fractures profondes de l’écorce ter-<br />
restre elles se meuvent périodiquement. Des chemins s’ouvrent aux courants souter-<br />
rains surtout dans les roches dures, l’eau infiltrée dans la surface altérée passe jusqu’a<br />
la basedes roches hachées decassures. Onvoit cesroches fracturées si l’homme a exploité<br />
les sables et les arhes de l’altération (fig. 1). Le diagramme explique la situation. Des<br />
zones de failles coupent une voûte, le plissement a fracturé les poudingues du Permien.<br />
Les diaclases sont ouverts sous la zone d’altération (fig. lu).<br />
Fig. 1<br />
Fig. la<br />
Fig. 1 et la - Des zones des failles dans des couches dures non stratifiées (Source<br />
a Gernshauser Teich n dans l’environ de Frankenberg, Hesse)<br />
(I) Captage d’eau (ancienne source).<br />
i“ Sondage sec.<br />
3) Zone de faille, les poudingues sont hachées de diaclases (voyez fig. lu).<br />
4) Carrière, peu de diaclases dans les grès triasiques.<br />
(9 Poudineues du Permien.<br />
(6) Marnecdu Permien<br />
(7) Grès triasiques.<br />
Dans les régions cantiques on a étudié l’écoulement des eaux souterraines - il<br />
faut nommer par exemple les géologues de la Yougoslavie préparant les barrages -.<br />
On a constaté des diaclases vides accompagnées par des fissures pleines d’eau. Exploi-<br />
tant les riches ressources d’eau dans les blocs de grès bigarré de l’Allemagne on trouve<br />
185
les mêmes conditions des courants souterrains. Seulement le chimisme diffère plus.<br />
L’exemple d’une région du Burgwald (Hesse) nous montre des zones de faille remplies<br />
d’eau plus ou moins dure (fig. 2). Dans la source du Christborn l’eau émerge d’un<br />
système de diaclases conjugées. Un sondage fût fait de quelques mètres du Katzenborn<br />
non loin du Müllersborn. Ce pompage n’a pas diminué l’émergence de ces sources. La<br />
figure montre les détails.<br />
Creusant une galerie à la base des grès massifs j’ai recherché des fissures vides. Le<br />
plongement de la roche ouvrait les diaclases à la base qui accompagnaient Ia vallée de<br />
la Sarre.<br />
1”<br />
Fig. 2<br />
;naD m, 7;<br />
, ,<br />
OE noD m, 3:! Oit OU , ,?, , ,’? L , , oit , nOu , , , , F, , , 71 , Oit , 0<br />
Fig. 2a<br />
Fig. 2 et 2a - Zones des failles avec des eaux différentes et le Streuungsband. (Vallée<br />
de Wiesenfeld à Ernsthausen, Hesse).<br />
(i), (2), (3), (4) Grès triasiques non stratifiés; (H) Heiligenborn (source forte) pres<br />
de Wiesenfeld; (C) Christborn; (M) Müllersborn, le Katzenborn est situé entre<br />
(C) et (M); íB) Source de la Bruchmühle; (W) Source du Würzeberg.<br />
O---- Source et ruisseau douce.<br />
o- Source et ruisseau dure<br />
Le (< STREUUNGSBAND D (fig. 24 donne la dureté totale des sources pendant les<br />
mois de novembre jusqu’au 15 octobre: 15” d.H = 150 mg Ca0 par litre.<br />
186
11 est facile de comprendre qu'il y a dans les régions d'un plissement, des zones avec<br />
des groupes de diaclases parallèles (fig. 3) dans les plis synclinaux. Les roches non<br />
stratifiées et dures ont subi un tension tectonique a leur base. Les eaux souterraines se<br />
rassemblent dans ces diaclases en les élargissant. Dans les calcaires les eaux dissolvent<br />
la chaux. Elles forment une système de cavernes. Un exemple unique c'est la caverne<br />
EINHORNHOHLE dans les montagnes du HARZ. La caverne est située entre deux vallées<br />
parallèles en suivant l'axe de la synclinale. Les diaclases sont ouverts à leur base et se<br />
Fig. 3<br />
Fig. 3a<br />
Fig. 3 et 3a - Les diaclases et les cavernes de base dans les plis synclinaux et dans les<br />
flexures. (3a EinhornhöhlejScharzfels-Harz) (3 Pente de la Sarre/Merzig).<br />
(1) Couche dure non stratifiée (2) Diaclases de la base, cavernes dans les calcaires.<br />
(3) Couche sousjacente<br />
g : Grès bigarré; Zm : Calcaire du Permien; Cu : Carbonifère inf.; M : Melaphyre<br />
altér6.<br />
187
ferment vers le haut. Les grottes suivent la face inférieure de la couche dure, elles sont<br />
situées sur la jointe de stratification. Un diagramme nous montre les collines près de<br />
la porte du Koran sur la route de Shiraz vers Persepolis-Isfahan. Les calcaires éo-oli-<br />
gocènes plongent vers la ville de Shiraz, des petites cavernes accompagnent la base des<br />
calcaires (fig. 4). Onconstantelesmêmesgrottes aunord-ouest de la villecomme ausud-est<br />
dans la vallée transversale avec le tombeau de SADI.<br />
Fig. 4 Fig. 4a<br />
Fig. 4 et 4a - Cavernes de la base près de la porte du Koran (Shiraz/Iran).<br />
(1) Calcaires de grande épaisseur.<br />
(2) Cavernes de la base<br />
(3) Ancien barrage, rempli par des alluvions. (4) Marnes sousjacentes.<br />
(5) Source près de la porte du Koran.<br />
c Direction d’une tension tectonique.<br />
J’ai trouvé cette couche de grottes en montant sur le sentier du MONTE PELLEGRINO<br />
en Sicile comme au sud de Tunis en passant la route vers Monastir. L’apparition de<br />
cette couche de cavernes au lieu de la construction du barrage de Grancarevo (vallée<br />
de la TrebiSnjica en Yougoslavie) est d’un intérêt spécial en revoquant des devoirs<br />
complexes et lourds.<br />
Je ne connais pas de galerie de captage creusée dans ces cavernes de base. Les eaux<br />
souterraines y atteignent rapidement des profondeurs remarquables. Elles restent froides<br />
par la vitesse de l’écoulement comme on peut le constater au nord et au sud de la montagne<br />
Elbours (Iran). Alimentant les nappes artésiennes dans les plaines entourant<br />
la montagne elles ne sont pas sursalées. Le captage de ces eaux souterraines serait donc<br />
très utile pour l’alimentation et l’irrigation dans des régions arides. L’âge de ces grottes<br />
n’est pas encore étudié. Les cavernes affleuranies sont au moins formées au tertiaire.<br />
Dans les environs de Fulda (Hesse) des carrières ont trouvé des grottes de base remplies<br />
par des sédiments du pleistocène (fig. 5). Aujourd’hui une vallée sépare les cavernes<br />
de la région qui a fourni le remplissage.<br />
Ce sont les figures de la communication qui nous donnent le mieux tous les renseignements<br />
pour les chercheurs des eaux souterraines dans les régions des roches dures et<br />
non stratifiées. I1 faut rechercher la tectonique, elle desstine les zones fissurées et aussi<br />
les cavernes de la base.<br />
188
Fig. 5<br />
Fig. 5a<br />
Fig. 5 et 5a - Anciennes cavernes de la base près de Künzell (Fulda, Hesse).<br />
(1) Marnes du Röt.<br />
(2) Chaux jaunes à la base du Muschelkalk.<br />
(3) Muschelkalk.<br />
(4) Caverne de la base remplie par du limon et des graviers intercalés.<br />
(5) Grès bigarrés (seulement dans la coupe montrant la situation).<br />
BIBLIOGRAPHIE (EXTRAITS)<br />
VAN DEN BROECK, MARTEL et RAHIR, Les cavernes et les rivières souterraines de la<br />
Belgique. Bruxelles 1910..<br />
CVIJIC, JOVAN, La géographie des terrains calcaires, Beograd 1960.<br />
GRAHMANN, Rudolf, Die Grundwasser in der Bundesrepublik Deutschland und ihre<br />
Nutzung. Remagen 1958.<br />
Hydrogeologische Forschungen. Abhandl. d. Reichsamtes fur Bodenforschung NF 209<br />
Berlin 1944.<br />
SCHOELLER, H, Les eaux souterraines, Paris 1962.<br />
SOBOTHA, ERNST, Beobachtungen über Grundwasser und Grundwassererschließung in<br />
ariden Räumen (Iran und Tunesien). Zs. Die. Wasserwirtschaft, 53. Jahrg. S. 102<br />
ff. Stuttgart 1963.<br />
189
SUR LE PROBLEME DE LA DÉTERMINATION<br />
DES BASSINS VERSANTS ET DES DIRECTIONS<br />
DE LA CIRCULATION DES EAUX SOUTERRAINES<br />
DANS LE KARST DINARIQUE<br />
RESUME<br />
Dr Ing. Miornir KQMATINA<br />
Institut de recherches géologiques et géophysiques-Belgrade<br />
Parmi les nombreux problèmes du karst se compte aussi le problème de la déter-<br />
mination des lignes de partage des eaux et des directions des eaux souterraines. On a<br />
presque tout fait en utilisant une des méthodes les plus éprouvées - la méthode de<br />
coloration des eaux souterraines et l’analyse des éléments géomorphologiques, et malgré<br />
cela il y reste assez d’imprécis en ce qui concerne l’extension des bassins versants et la<br />
détermination des directions de circulation des eaux souterraines. Les recherches se<br />
basant sur les facteurs géologiques et hydrogéologiques n’étaient appliquées que secon-<br />
dairement et c’est seulement dans ces dernières années qu’on les utilise à l’occasion de<br />
la solution de ce problème du karst.<br />
Dans cette communication l’auteur traite ce problème d’une manière générale en<br />
citant les exemples variés du karst dinarique. On a prêté une attention particulière a<br />
l’étude de la fracturation des roches carbonatées et du facteur qui avait prédisposé le<br />
développement des principales zones de karstification et par conséquent la formation de<br />
principaux collecteurs-conducteurs des eaux souterraines dans le karst. Dans ce but<br />
il serait indispensable d’élaborer In carte des fractures, et lorsqu’il s’agit d’un district<br />
plissé tectoniquement plus fori aussi la carte de l’intensité de la fissuration des roches<br />
carbonatées.<br />
SUMMARY<br />
The problem of the demarcation of drainage basins and directions of fioiu of the under-<br />
ground streams in the Dinar Karst<br />
Among the many problems presented by the karst one is that of the demarcation<br />
of the divides and the directions of flow of the groundwater. Almost all the work done<br />
on this has relied on the injection of colour tracers into the groundwater coupled with<br />
analysis of the geomorphological factors. This is one of the best tried methods but still<br />
remains relatively imprecise as regards the extent of the groundwater basins and the<br />
determination of the directions of groundwater flow. Studies based on the geologicals<br />
and hydrogeological factors were very much of a side-line and it is only of recent years<br />
that they have become a regular procedure when this particular karstic problem arises.<br />
In his paper the author deals broadly with the question illustrating its varied forms<br />
with examples from the Dinaric Karst. Special attention has been given to the study.of<br />
fracturing in carbonate rocks as the predisposing factor in the development of the chief<br />
zones of karstification and hence in that of the principal structures for groundwater<br />
collection and movement in the karst. In this connexion it would seem essential to<br />
prepare a map of fracture areas and also, in the case of districts with heavier tectonic<br />
folding, of the relative intensities of fissuring of the carbonate rocks.<br />
Les nombreuses tentatives faites jusqu’à présent dans le but de connaître une for-<br />
mation naturelle aussi complexe que le karst, ont souvent été des échecs plus ou moins<br />
grands, résultant soit de l’observation unilatérale, insuffisante et régionale, soit parce<br />
qu’on a attribué à certaines régularités qui ne sont valables que pour les conditions<br />
géologiques et hydrogéologiques déterminées, une certaine portée générale. C’est seule-<br />
ment une étude minutieuse et complexe des facteurs géologiques, hydrogéologiques et<br />
géomorphologiques qui pourrait offrir de nombreuses régularités de l’hydrogéologie<br />
karstique et du karst en général, et seulement aprks l’étude et le classement de ces fao<br />
teurs on pourra tenter de donner, par les méthodes h ydrogéologiques, hydrologiques<br />
et hydrauliques, des solutions quantitatives objectives.<br />
190
Faute de lois définies sur le complexe hydrogéologique karstique, il était difficile<br />
d’observer les rapports hydrogéologiques concrets dans les districts pratiquement inté-<br />
ressants d’une des plus typiques régions karstiques, les Dinarides externes. Sur l’étendue<br />
de cette vaste région on a profité de toutes les possibilités offertes par une des méthodes<br />
les plus éprouvées, la coloration des eaux souterraines; pourtant il y reste assez d’impré-<br />
cision encore en ce qui concerne l’extension des bassins hydrographiques et la détermi-<br />
nation des directions de la circulation des eaux souterraines. Par les recherches faites<br />
pendant cette dernière décade, basées sur les facteurs géologiques et hydrogéologiques,<br />
complétés par les éléments géomorphologiques et hydrogéologiques, on a obtenu, mal-<br />
gré des difficultés considérables, une image sur les rapports des eaux souterraines qui<br />
s’écoulent en suivant la loi de la pesanteur vers les différentes bases érodées. I1 est impor-<br />
tant de souligner que l’image des bassins versants déterminés se différencie considé<br />
rablement de ceux antérieurement donnés seulement sur la base des études hydrolo-<br />
giques et morphologiques. D’autre part, il est visible que les bassins d’alimentation<br />
déterminés, recherchés d’une manière complexe coïncident avec les valeurs numériques<br />
de ces bassins obtenues par l’examen des données des observations hydrologiques de<br />
longues années.<br />
SUR CERTAINES QUESTIONS DE LA METHODOLOGIE DES RECHERCHES HYDROG~OLOGIQUES<br />
DANS LE KARST<br />
Pour la recherche des régions karstiques, on pourrait dire qu’il n’existe pas de<br />
méthodologie généralement adoptée. Les recherches antérieures se basaient essentielle-<br />
ment sur les études de la géomorphologie et de l’hydrologie des districts karstiques.<br />
Fig. 1 - Lapiés, dans les calcaires du Jurassique supérieur aux environs de Dubrovnik.<br />
191
Les facteurs géologiques et hydrogéologiques restaient souvent secondaires, leur intér&t<br />
était réduit et c’est seulement dans ces derniers temps qu’on leur attribue un intérêt<br />
accru.<br />
On ne peut pas contester le fait que les facteurs géologiques et hydrogéologiques<br />
sont ceux qui prédéterminent les caractéristiques des eaux souterraines dans le karst.<br />
Avec combien de succès ils peuvent etre appliqués est une autre question. En tout cas, il<br />
est logique et nécessaire de s’efforcer qu’ils soient étudiés le mieux possible. Les<br />
recherches plus récentes,faites dans le karst dinarique, avaient démontré que c’est unique-<br />
ment par l’utilisation au maximum des éléments géologiques et hydrogéologiques<br />
natu-rellement en s’aidant, plus ou moins, des éléments hydrologiques et géomorpholo-<br />
giques qu’on peut obtenir l’image complètes les bassins versants, même dans le cas où il<br />
s’agit de bassins dans les calcaires propres ou d’importance locale. Avec cela, les éléments<br />
hydrologiques et géomorphologiques peuvent être un bon contrôle et un indicateur à<br />
l’occasion des observations hydrogéologiques, surtout pour le contrôle de la grandeur<br />
d’un bassin versant et des directions principales de la circulation des eaux souterraines.<br />
Les colorations peuvent offrir particulièrement les points de repère qui aideraient à<br />
profiter de ces éléments géologiques dictant la répartition des eaux sur de petites<br />
sur faces plus concrètement déterminées.<br />
N’entrant pas cette fois dans de larges observations de tous les éléments géologiques<br />
prédéterminant les caractéristiques hydrogéologiques des terrains karstiques, je vou-<br />
drais mettre en évidence deux facteurs importants pour l’étude plus efficace des bassins<br />
versants et des directions de la circulation des eaux souterraines. Ce sont :<br />
- la répartition des terrains en régions d’après les formes structurales essentielles<br />
(structures de contraction, structures de dilatation de l’écorce terrestre, etc.) et<br />
- l’étude minutieuse de la fracturation des masses de rochers.<br />
Des facteurs hydrogéologiques, il faut en mentionner tout d’abord deux :<br />
- le rôle hydrogéologique des masses de rochers dans certaines régions, et<br />
- le rôle des fractures.<br />
Le premier exige en toute rigueur l’examen de chaque membre hydrogéologique<br />
distingué, de chaque masse dolomitique à part, et le deuxième demande l’étude des<br />
éléments dont dépend le rôle hydrogéologique de chaque fracture plus grande ou de la<br />
zone de petites ou de grandes fractures.<br />
En examinant le rôle hydrogéologique de certaines fractures on doit prendre en<br />
considération toute une série d’éléments dont il est fonction. On peut partir de deux<br />
règles :<br />
- les principaux conducteurs des eaux souterraines dans un district calcaire sont les<br />
fractures dictant le style de la fracturation de ce district, et<br />
- pour autant que les fractures de semblables dimensions soient différemment orien-<br />
tées, les principaux collecteurs-conducteurs sont alors les fractures de direction per-<br />
pendiculaire (ou la plus proche de la perpendiculaire) par rapport à la direction de<br />
la base érodée.<br />
11 est particulièrement important d’examiner la constitution et les caractéristiques<br />
des blocs de grandes fractures. La fonction du rôle hydrogéologique des fractures, et<br />
de la constitution lithologique de leurs blocs peut-être très différente : très exprimée :<br />
à titre d’exemple, les fractures, dont les entre-blocs sont des sédiments clastiques, sont<br />
régulièrement les isolateurs hydrogéologiques, tandis que les fractures dans les calcaires<br />
massifs et propres du point de vue chimique, étant déformées au plus haut degré par la<br />
karstification, sont les meilleurs collecteurs des eaux souterraines dans le karst.<br />
Comme on voit, en étudiant la répartition des eaux dans le karst, il est indispensable<br />
d’étudier les zones tectoniquement endommagées comme des directions où est exclusi-<br />
vement localisée la karstification profonde et par conséquent du milieu le plus propice<br />
192
pour la circulation des eaux souterraines. Pour l’étude du rôle hydrogéologique des<br />
fractures dans les terrains karstiques des Dinarides, j’ai grandement profité de la carte<br />
des formes cassantes et de la carte de l’intensité de la fissuration. Pour cette raison, je<br />
vais m’arrêter un peu plus largement sur cette question.<br />
La carte des formes cassantes est dressée tout d’abord pour les districts avec un<br />
nombre imposant de grandes fractures (fig. 3). Après l’élaboration photogéologique<br />
détaillée des formes cassantes, on se met à la vérification et à l’observation sur le terrain<br />
OU l’on récolte toutes les données géologiques et hydrogéologiques les plus importantes.<br />
En même temps, sur les régions déterminées de 50 x 50 à 150 x 150 m, on enregistre<br />
Fig. 2 - Faille fortement inclinée aux environs de Ljubinja dans l’Herzégovine orientaie.<br />
toutes les cassures et fissures. A côté de toutes les grandes fractures et des diagrammes<br />
de Schmidt enregistrés, il est souhaitable d’inscrire sur la carte aussi les éléments hydro-<br />
géologiques et géomorphologiques caractéristiques qui sont en relation étroite avec les<br />
fractures et de distinguer les districts faits de calcaires, de dolomies et de roches non<br />
carboeatées.<br />
La carte de l’intensité de la fissuration est utile tout d’abord chez les roches endom-<br />
magées par les cassures (fig. 4). Ce sont les roches des districts plus intensément plissés.<br />
On obtient la carte après l’enregistrement de la densité des cassures aux points disposés<br />
dans les profils perpendiculaires àla direction des structures plissées. Sur la carte peuvent<br />
être inscrits les axes des plis encore et la répartition des membres carbonatés, pour<br />
mettre respectivement en évidence la fonction de l’intensité de fissuration de la position<br />
dans le cadre du pli respectif, et celle de ces membres lithologiques.<br />
SUR LES BASSINS VERSANTS DANS LE KARST<br />
Les lignes de partage des eaux dans le karst sont représentées, soit par une large et<br />
assez variable zone, soit par le contact des roches perméables et imperméables; elles<br />
peuvent être aussi les lignes de partage des eaux topographiques. Dans le premier cas,<br />
193
194<br />
Fig. 3 - Maquette de la carte des formes cassantes.<br />
Légende : 1. Calcaires; 2. Dolomies; 3. Roches non carbonatées; 4. Nappe de char-<br />
riage; 5. Fractures; 6. Diagramme de Schmidt; 7. Gouffre; 8. Source karstique.<br />
5 f -2 m<br />
7 3-4<br />
Fig. 4 - Maquette de la carte de l'intensité de la fissuration.<br />
Légende : 1. Calcaires; 2. Dolomies; 3. Roches non carbonatées; 4. à 9. Champs<br />
de la densité déterminée des cassures.
qui est le plus fréquent, la position et la détermination des lignes de partage des eaux<br />
sont fonction des hauteurs d’eau, de sorte que la ligne de partage des eaux karstiques<br />
est la mieux définie pendant l’étiage même. I1 est logique qu’à l’occasion de la déter-<br />
mination de certaines lignes de partage des eaux, on rencontre le plus de difficultés<br />
justement à l’occasion de la détermination des parties qui sont sous forme de vastes<br />
zones.<br />
En liaison avec la détermination des bassins versants je citerai quelques règles vala-<br />
bles pour la majeure partie du karst dinarique et probablement pour les autres terrains<br />
karstiques. Ces règles sont les suivantes :<br />
- Le sens de la circulation des eaux souterraines vers l’aboutissement principal de<br />
toutes les eaux sous l’action de la pesanteur, vers la mer, donc, vers le sud ou le sud-<br />
ouest, est incomparablement mieux exprimé que le sens de la circulation vers le nord et<br />
le nord-est, donc, vers les bases d’érosion locales, ce qui a comme conséquences que la<br />
plupart des bassins versants sont asymétriques;<br />
- Les lignes de partage des eaux hydrogéologiques peuvent être parallèles aux<br />
directions de la circulation des eaux souterraines voisines. Ceci est conditionné par la<br />
position même de certaines fractures comme de bons collecteurs des eaux souterraines<br />
et la faible fracturation de certaines zones calcaires d’une part, et la position des buts<br />
vers lesquels s’écoulent ces eaux en suivant la loi de pesanteur, d’autre part (fig. 5);<br />
- De deux zones d’érosion voisines mais à différentes altitudes, l’eau s’écoule’<br />
sur une bande beaucoup plus large, vers celle qui est plus basse;<br />
-4 o<br />
Fig. 5 - Un exemple de la détermination de la ligne de partage des eaux dans un terrain<br />
purement calcaire. La ligne de partage des eaux zonée entre le bassin versant de la<br />
source côtière A et la source sous-marine B est déterminée sur la base des éléments<br />
tectoniques et géomorphologiques et les colorations des eaux.<br />
Légende : 1. Poljé karstique: 2. Gouffre; 3. Estavelle; 4. Ligne de partage des eaux;<br />
5. Fracture; 6. Direction de la circulation des eaux souterraines.<br />
195
- Pour les cours d’eau karstiques, sur les lignes sous forme des canyons, c’est-à-dire<br />
là où l’écoulement se fait à travers un terrain purement calcaire, le bassin de réception<br />
se rétrécit considérablement.<br />
- La grandeur du bassin versant est fonction de plusieurs éléments et le bassin<br />
est d’autant plus grand en tant que ces facteurs agissent plus profondément. Ces él&<br />
ments sont : l’orographie prononcée du terrain; le degré d’homogénéité de la compo-<br />
sition lithologique; l’extension des collecteurs hydrogéologiques; le degré de fractura-<br />
tion du terrain et les dimensions des fractures;la longueur,la profondeur du plongement<br />
et la position de la principale barrière hydrogéologique, etc. Avec cela, pour autant que<br />
la base d’érosion soit hypsométriquement plus basse, le bassin est plus grand, et inver-<br />
sement.<br />
- La forme du bassin versant est plus ou moins, mais toujours, asymétrique, ce qui<br />
dépend de la composition lithostratigraphique et du type structural du district, puis<br />
des caractéristiques géomorphologiques, hydrologiques et hydrogéologiques du dis-<br />
trict, de la position vers le principal but des eaux vers la mer.<br />
COUP D’CCIL SUR CERTAINS BASSINS VERSANTS DES DINARIDES EXTERNES<br />
En vue de l’examen des particularités qui apparaissent à l’occasion de la déter-<br />
mination de certains bassins versants, on va faire pour l’instant un classement généra-<br />
lisé des terrains karstiques des Dinarides externes. Etant donné que les caractéristiqucs<br />
hydrogéologiques, hydrologiques et géomorphologiques apparaissent comme consé-<br />
quence tout d’abord d’un groupe de facteurs - facteurs géologiques, on peut distinguer,<br />
en se basant sur les facteurs, les types suivants de terrains :<br />
A. régions de contraction tectonique:<br />
- basses pénéplaines près de la mer;<br />
- districts des monts et des montagnes;<br />
B. régions de la dilatation de l’écorce terrestre.<br />
Les bassins versants et les directions de lu circulation des eaux souterraines dans les<br />
districts tertoniquement plissés.<br />
Sous le district tectoniquement plissé, on comprend une large zone littorale, limitée<br />
par la ligne Obrovac-MubMostar-mer.<br />
Dans ce district, un rôle important dans la répartition et l’acheminement des eaux<br />
souterraines peut être joué par un nombre restreint d’éléments hydrogéologiques. Ce<br />
sont : le rapport des barrières et des collecteurs hydrogéologiques, puis le système fran-<br />
chement développé des cassures soit longitudinales, soit transversales ou diagonales et<br />
les failles diagonales ou certaines autres grandes failles. Si les deux premiers éléments<br />
sont essentiels, les bassins versants sont allongés dans la direction NW-SE ou W-E de<br />
méme que les structures et, naturellement, la plus grande partie des eaux s’écoule dans<br />
ce sens. Pour autant que les grandes fractures soient essentielles, surtout si elles sont<br />
diagonales, et les structures plicatives faites essentiellement de calcaires, les bassins<br />
versants sont plus irréguliers. On va citer à titre d’exemple, quelques cas du Littoral<br />
de la Dalmatie septentrionale représentant des districts de basses pénéplaines, et du<br />
Littoral plus large de Sibenik et de Split représentant des districts de monts et de mon-<br />
tagnes.<br />
Le terrain plan, faiblement développé du point de vue orographique, limité par des<br />
zones flyschs de Bokanjac et de D. Zemunika appartient au bassin versant de la plaine<br />
de boue Bokanjatko blato. A cause de la position spécifique vers les calcaires de l’anti-<br />
clinal de Bokanjac, le Flysch éocène se comporte ici en parfaite barrière hydrogéologique<br />
196
déterminant la limite sud-ouest et nord-est du bassin versant. C’est ainsi que le problème<br />
de la détermination du bassin versant est restreint à la détermination d’une petite partie<br />
de la ligne de partage des eaux du sud-est.<br />
La circulation des eaux souterraines dans le bassin versant de BokanjaCko blato est<br />
directement fonction de la constitution tectonique du terrain. La plus vive circulation<br />
s’effectue par les cassures longitudinales le long de la crête anticlinale.<br />
Aux environs plus larges de Sibenik, dans le cadre du bassin versant de la source<br />
côtière Litno, les eaux souterraines circulent par les failles diagonales vers le sud-est,<br />
pour se lier plus loin dans leur cours pour les cassures bien prononcées de la crête anticlinale<br />
de Mrdakovica. Les amples recherches sur ce district révèlent que les grandes<br />
formes karstiques sont développées le long des failles citées ci-dessus mème jusqu’à la<br />
barrière flysch au SW du bassin, ce qui veut dire que les eaux souterraines circulaient<br />
autrefois jusqu’à la barrière et puis déviaient vers le SE, et que la situation actuelle est<br />
le résultat de récents plongements intensifs du terrain.<br />
Autrement, le bassin versant de Litno est défini par les barrières hydrogéologiques,<br />
à savoir du NE par la dolomie cénomanienne-turonienne, du SW par la zone flysch,<br />
tandis que la limite nord-ouest du bassin, pareillement comme dans la plaine de boue<br />
Bokanjatko blato, reste problématique encore.<br />
Le bassin versant de Jadar est un des nombreux bassins faits essentiellement de<br />
calcaires fort fracturés et karstifiés. La limite nord de ce bassin est précisément déterminée<br />
et coïncide en partie avec la zone de contact des calcaires de VojniC et du Néogène<br />
du poljé Sinjsko polje, et en partie avec la ligne de partage des eaux superficielles dans<br />
le Werfenien imperméable de MuC. I1 est quelque peu plus difficile de parler de la ligne<br />
de partage vers le Pantan. A L’Est, la ligne de partage avec le bassin versant de la Zeta<br />
est jusqu’à un certain point déterminée par la coloration du gouffre à D. Dolac et certains<br />
éléments géologiques, hydrogéologiques et géomorphologiques. Au sud, elle coïncide<br />
avec le contact Flysch-calcaire. Les eaux souterraines circulent par les fractures<br />
longitudinales au sud-est extrême du bassin versant et par les failles diagonales de la<br />
direction nord-sud sur l’étendue plus large de Mu6 et de Sinj.<br />
Les bassins d’alimentaiion et les directions de la circulation des eaux souterraines dans les<br />
districts de la dilaiation de l’écorce terresire.<br />
Les limites nord et sud du bassin versant de 1’Unac dans la Bosnie occidentale sont<br />
assez nettement déterminées par les barrières dolomitiques de Grahovo, de Jedovnik<br />
et de Bosanski Petrovac. La limite est mal définie par la disposition de sèches dolines<br />
karstiques et des zones dolomitiques du Sator et de Javorova kosa, ainsi que par la<br />
position du poljé karstique de Rora appartenant au bassin versant de la Sana.<br />
Nous citons, sans nous arrêter sur le bassin versant immédiat de I’Unac, cette partie<br />
du bassin se drainant à travers la source karstique plus forte de BastaSica. Vers cette<br />
source s’écoulent les eaux des environs plus larges du poljé Resanovatko polje et de<br />
Ja pénéplaine karstique de Kamenica. U n collecteur conducteur principal des eaux<br />
souterraines suivait le système des fractures entre le poljé et la source même (fig. 6).<br />
La rivière Cetina draine tant la région de son bassin versant immédiat, que le district<br />
des poljés karstiques bosniaques occidentaux. I1 est caractéristique que vers la Cetina<br />
s’écoulent presque exclusivement et seulement les eaux du nord-est, de la sorte que le<br />
bassin versant de cette rivière est très asymétrique.<br />
La position de la ligne de partage des eaux adriatiques et de la mer Noire dans la<br />
partie correspondant au bassin versant de la Cetina d’une part, et au bassin versant de<br />
la Pliva et de la Sana d’autre part, qu’on cite comme la plus problématique dans notre<br />
karst en général, fut étudiée par de nombreux géologues, géomorphologues et hydrogéo-<br />
logues. Leurs opinions sont différentes ce qui est la preuve de la complexité et de la<br />
gravité de ce problème. D’après nos recherches, le rôle essentiel est joué dans ce cas<br />
par la dolomie seule barrière bien prononcée. Gráce à ses propriétés isolatrices, sa<br />
197
position favorable et le plongement en profondeur, la dolomie principale du GlamoE<br />
et du PopoviCi a considérablement influencé la répartition des eaux souterraines et leur<br />
acheminement vers le nord-est ou le sud-ouest.<br />
Fig. 6 -Zone des fractures - collecteur-conducteur des eaux souterraines entre le<br />
gouffre ResanovaEki ponor et la source de la BastaSica près de'Drvar.<br />
Légende : 1. Calcaires jurassiques et crétacés; 2. Dolomies triasiques supérieures;<br />
3. Néogène, 4. Fracture; 5. Direction de la circulation des eaux souterraines.<br />
198<br />
Fig. 7 - Source de la BastaSica près de Drvar.
On va mentionner, laissant à part pour le moment les rapports hydrogéologiques<br />
complexes dans le domaine du bassin versant de ce cours d’eau karstique, deux collecteurs-conducteurs<br />
prononcés des eaux souterraines de cette aire d’alimentation :<br />
- La zone des fractures de Grahovo-Uniste-Vrelo (source) de la Cetina, collecteur<br />
des eaux du gouffre &linac dans le poljé PaSicá polje, et drain des eaux souterraines<br />
d’une partie de la Dalmatie nord-ouest;<br />
- La zone des fractures diagonales de Zdralovac-M. KabliC de la direction NNW-<br />
SSE qui joue le rôle du collecteur-conducteur principal des eaux souterraines de la<br />
Velika Golija, du Crni Vrh et du Zdralovac.<br />
Fig. 8 - Source sud de la Pliva.<br />
Aux collecteurs cités nous ajoutons encore deux principaux collecteurs-conducteurs<br />
bien prononcés des eaux souterraines de la partie NW du poljé ClamoEko polje vers la<br />
Pliva et la Sana, marqués par toute une série de gouffres :<br />
- la zone de fractures de la Dubrava (GiamoCko polje) - Cardak Livada, et<br />
- la zone de fractures Odiak-MliniSte.<br />
BIBLIOGRAPHIE<br />
HERAK M., 1957, La base géologique de certains phénomènes hydrogéologiques dans<br />
le karst littoral. IIle Congrès des géologues de Yougoslavie.<br />
KOMATINA M., 1964, Composition stratigraphique et la constitution tectonique de la<br />
Dalmatie moyenne et méridionale (thèse de doctorat). Belgrade (manuscrit).<br />
LUKOVIC M. T., 1960, Quelques observations sur la circulation des eaux souterraines<br />
dans le karst à l’occasion de la construction de grands aménagements dans le karst<br />
de Yougoslavie. Bulletin de l’Institut de recherches géologiqrres et géophysiques, série<br />
B, T. I. Belgrade.<br />
STEPANOVIC B., 1957, Esquisse des provinces hydrogéologiques de Yougoslavie (thèse de<br />
doctorat). Belgrade (manuscrit).<br />
199
NAPPES KARSTIQUES ET CONDUITS KARSTIQUES<br />
PREFACE<br />
N. Llopis LLADO<br />
Departamento de Hidrogeologia del<br />
Consejo Superior de Investigaciones Cientificas<br />
Madrid<br />
Le problème de la circulation karstique n’est pas encore résolu. Cvijic (l), Martel<br />
(ll), Grund (7), Lhemann (9), Davis (3) et beaucoup d’autres ont successivement<br />
apporté des idées au long d’un siècle environ sans arriver à des conclusions précises.<br />
Le problème le plus grave se pose quand on veut se décider entre ces deux points :<br />
1. Admettre pour le karst l’existence de la ) préconisée par Grund;<br />
2. Admettre avec Martel l’existence d’une circulation à travers des conduits, forcés<br />
ou non (2), mais indépendants les uns des autres.<br />
La nappe karstique comporte implicitement l’existence d’un niveau piézométrique<br />
théorique, alors que la circulation à travers des conduits ne peut dépendre d’un niveau<br />
piézométrique général.<br />
I. TYPES DE FISSURATION DES CALCAIRES ET TYPES DE CIRCULATION<br />
Quand on observe la fissuration des masses calcaires, d’ages divers et de structure<br />
différente, on peut faire deux grands ensembles :<br />
i. Calcaires à fissuraiion régulière et Ilornogène, caractérisés par l’existence de réseaux<br />
de diaclases très réguliers et par des indioidus indépendants les uns des autres;<br />
2. Calcaires ù,fissuration irrégulière et he‘térogène, caractérisés par l’existence de réseaux<br />
de diaclases irréguliers avec des indicidus reliés les uns CIUX autres par des diaclases<br />
accessoires.<br />
Ces .deux types de fissuration nous amènent à la conception de deux types de circulation<br />
différents dans les appareils karstiques :<br />
a) Circulation par des conduits indépendants les uns des autres. Toutefois, ils sont<br />
conditionnés par un niveau de base karstique ou épigé unique. Dans ce type de circulation,<br />
il ne peut y avoir un niveau piézométrique unique. Par contre, chaque<br />
système de conduits aura son propre niveau piézométrique. Des zones sèches existeront<br />
dans le même niveau bathymétrique de la masse calcaire entre deux systèmes<br />
de conduits à niveau piézométrique propre. La masse calcaire à circulation par des<br />
conduits indépendants se caractérise en général par l’existence de grands systèmes<br />
de diaclases à grands intervalles, développés dans des régions tabulaires ou en<br />
(< cuesta ), dans la périphérie des régions de plissement intense. Les diaclases sont<br />
en général des lèvres ouvertes et vides;<br />
b) Circulation par des conduits reliés les uns aux autres par des diaclases accessoires,<br />
en général par des diaclases de déchirement ou de relais. Dans ce cas, on arrive à<br />
la conception de la c nappe karstique H du Grund, surtout si la texture et la structure<br />
synsédimentaires de la roche se prêtent à la formation d’une nappe. Dans les carnioles,<br />
par exemple, dans ies calcaires brechoïdes et dans des calcaires très fissurés, on<br />
arrive à trouver des vraies nappes qui ressemblent énormément à tous points de<br />
vue aux nappes phréatiques.<br />
200
II. DENSITE DE VIDES<br />
La perméabilité dans Les nappes phréatiques a été définie par la porosité. Dans le<br />
cas des calcaires on ne peut peut-être pas parler de porosité, mais de densitéde oides. Nous<br />
entendons par ceci le rapport entre le volume des zones imperméables ou compactes<br />
d’une masse calcaire et leurs vides, par m3. Ainsi, on peut établir une échelle de perméabilité<br />
pour les roches calcaires, exprimée par des indices de vides. Si nous appelons C<br />
les zones compactes et V les vides, nous aurons :<br />
1. C/V = 1 C = V = 50% de vides = roche moyennement perméable;<br />
2. C/V = 10 C V = roche imperméable:<br />
3. C/V = 0,i C V = roche très perméable.<br />
A B<br />
Fig. 1 - Deux types de diaclasation dans les massifs calcaires :<br />
A. Diaclases normales dans une région tabulaire. Impossibilité de formation de<br />
nappe karstique.<br />
B. Diaclases dans une région plissde.<br />
Possibilite de formation de nappe karstique.<br />
Le rapport 3 est évidemment un cas théorique car dans les roches calcaires les vides<br />
n’excèdent jamais 75% du volume total, mais le rapport 1 est très courant, ainsi que<br />
les cas compris entre 1 et 10, ce qui nous permet d’établir une échelle de perméabilité,<br />
d’indices compris entre 1 et 10, dans laquelle nous aurons une gamme de roches cal-<br />
caires d’une perméabilité nulle jusqu’à une très haute perméabilité. Dans ce dernier cas,<br />
nous pouvons accepter parfaitement l’idée de Grund, de la nappe karstique.<br />
Fig. 2 - Les systèmes de diaclases dans le massif calcaire de Llenaire (Mallorca).<br />
201
III. LA NAPPE DE LLENAIRE A POLLENSA (MAJORQUE), EXEMPLE DE NAPPE KARSTIQUE<br />
Dans la chaine NW de l’île de Majorque, nous avons plusieurs exemples de nappes<br />
karstiques. Dans la baie d’Alcudia et Cap Formentor, se développe un système d’écailles<br />
entre trois éléments lithochronologiques :<br />
1. Trias, formé par le Muschelkalk :<br />
50-60 m. Calcaires lités, parfois dolomitiques, gris-blanchâtres.<br />
Trias, formé par Keuper :<br />
80-100 m. Argiles rouges et gypse. Marnes bariolées à ofites;<br />
20-30 m. Carnioles jaunâtres.<br />
2. Lias, formé par :<br />
40-50 m. Calcaires dolomites brechoïdes;<br />
250 m. Calcaires massifs, mal Ijtés du Domérien.<br />
3. Bourdigalien, formé par :<br />
10-12 rn. Conglomérats calcaires;<br />
8-10 m. Grès jaunes;<br />
250-300 m. Marnes bleues.<br />
Fig. 3 - Coupe hydrogéologique de la vallée de Pollensa (majorque) et des buttes de<br />
Llenaire.<br />
K. Keuper. Dolomies jaunes et marnes bigarrés à gypse.<br />
L. Lias. Domerien. Brèches calcaires à la base et calcaires fissurés.<br />
M. Miocène. Burdigalien. Conglomérats à la base, grès jaunes et marnes grisâtres.<br />
N. Niveau piézométrique du Karst.<br />
P. Puits.<br />
Ps. Puits sec.<br />
Les éléments lithologiques rigides sont les calcaires du Lias; les éléments plastiques,<br />
le Trias et lei Bourdigalien. Une tectonique à style en écailles se développe déversée vers<br />
le NW. Les calcaires du Lias forment les reliefs et constituent les zones d’absorption<br />
de l’eau. La fissuration de ces calcaires est très intense avec des indices inférieurs à I.<br />
La paléohydrologie de ces massifs nous signale une ancienne circulation, surtout au<br />
long des diaclases du système N 10-30 E., verticales; vers le SE. Dans ces conditions,<br />
s’impose l’idée d’une nappe karstique développée dans les calcaires du Lias ayant pour<br />
niveau de base karstique les marnes du Keuper. Le système de diaclase dominant est<br />
le N 10-30 E., verticales ou inclinées 80” vers l’E ou vers I’W. Ces diaclases ont parfois<br />
les levres très ouvertes et des remplissages de brkhes à éléments calcaires et matrice<br />
de ( terra rossa ». Ces diaclases sont des zones régulatrices de la circulation (10).<br />
L’absorption se réalise à travers ces systèmes et l’eau forme une nappe karstique,<br />
dont le niveau piézométrique est en général peu profopd, quoique déterminé par les<br />
marnes du Keuper.<br />
Au pied de l’&aille du Turd Gros de Llenaire, existe une résurgence intermittente, le<br />
( Pouet de Brabatxó D, qui fonctionne pendant quatre ou cinq mois après les périodes<br />
de précipitation, qui ont lieu de septembre à décembre avec des précipitations de 700-<br />
800 mm an.<br />
202
Dans le Turó Petit de Llenaire il y a une nappe exploitée par le Pou Nou de Llenaire<br />
(= le puit neuf de Llenaire), dans lequel le niveau piézométrique est à 9 m de la sur-<br />
face et a un débit de 25 m3 a l’heure.<br />
La nappe karstique de Pollensa est tres influencée par la structure tectonique; elle<br />
est profondément déprimée dans les sinclinaux occupés par le Bourdigalien impermé-<br />
able; en revanche, elle s’élève dans les zones d’absorption, dans les massifs calcaires<br />
du Lias. C’est donc dans la base méridionale de ces massifs où il faudrait placer les<br />
puits pour l’exploitation de cette nappe karstique. Les puits construits jusqu’à présent<br />
corroborent parfaitement cette théorie.<br />
CONCLUSIONS<br />
On envisage l’existence de deux types de circulation karstique :<br />
1. Circulation par nappes karstiques. Développée surtout dans les pays de plissement<br />
où la densité de diaclases est très grande et où on trouve des diaclases en relais qui<br />
relient tous les systèmes. L’existence de porosité synsédimentaire favorise la for-<br />
mation de la nappe.<br />
2. Circulation par conduits karstiques. Très courante partout dans les calcaires com-<br />
pacts et peu tectonisés. Les régions tabulaires et en (< ouesta ) nous en offrent de<br />
beaux exemples.<br />
203
HYDRODYNAMIC ZONING OF KARST WATER<br />
D.S. SOKOLOV<br />
State Geological Committee, USSR<br />
Study of the vertical hydrodynamic zoning karst waters is an important aspect of<br />
karstic hydrogeology. This subject has been considered in some detail by almost all<br />
prominent karst investigators at the end of the 19th century and first forty years of the<br />
20th century (E. Martel, A. Grund, F. Katzer, J. Cvijic, A. Kruber, V. Varsanofyeva,<br />
w. Davis, O. Lehmann, I. Shchukin, I. Zaitsev, etc.); it should be emphasized that as<br />
early as the end of the 19th century P. A. Tutkovskii showed the essential role of artesian<br />
waters in karst development. In the USSR, particular emphasis has been placed in the<br />
last twenty years upon the vertical hydrodynamic zoning of karst waters (V. A. Aprodov,<br />
N.A. Gvozdetskii, A.G. Lukoshin, F. A. Makarenko, G. A. Maksimovich, D.V. Ryzhikov,<br />
D. S. Sokolov, etc.).<br />
In the karstic areas composed of thick strata of carbonate and sulphate rocks, four<br />
vertical hydrodynamic zones should be distinguished which differ in the karst water<br />
movement conditions and regime. They are:<br />
(o) The zone of aeration in which descending movement of infiltration and inflow<br />
waters prevails; also the so-called “suspended” karst waters in the zone of aeration<br />
are characteristic of many karst areas;<br />
(b) The zone of seasonal fluctuation of karst water level;<br />
(c) The zone offull saturation where drainage is governed by the local drainage network;<br />
(d) The zone of deep circulation where ground waters move in the direction of remote<br />
outlets, there being no direct influence of the local drainage network.<br />
This subdivision reflects general features of the vertical hydrodynamic zoning of<br />
karst waters; depending on geological structure and relief, these distinct zones may not<br />
all be observed in certain areas.<br />
The cavities where karst waters move developed on the basis of fracture and pore<br />
permeability. It is impossible to draw exact boundaries in the series: primary crack of<br />
known origin-karst crack-karst canal-karst cave and in the series: pores-caverns<br />
-larger isometric karst cavities. Under natural conditions, all these cavities have no<br />
sharp boundaries. Karst waters move through such a complicated system: they may<br />
move mainly through pores and canvers or cracks and canals, or these types of move-<br />
ment may be combined. Even in such isolated underground karst streams as cave rivers<br />
one can observe karst inflow from smaller cavities or partial resorption of karst flow<br />
in adjacent fractures and caverns. Therefore, underground karst flows are but a variety<br />
of flow in zones with large cavities. More or less isolated underground karst flows are<br />
observed in all three upper hydrodynamic zones, these flows can be confined or uncon-<br />
fined. As a rule, underground river formation results from long development of karst.<br />
Such flows, in turn, are of great importance to further karst development in a given<br />
area.<br />
THE ZONE OF AERATION<br />
The thickness of the zone of aeration ranges within wide limits and can amount to<br />
some hundreds of metres. It depends on climate, infiltration conditions of meteoric<br />
waters, geological structure (rock position and permeability) and drainage conditions<br />
of the massif being subjected to karsting (frequency and depth of erosion cuts).<br />
204
Karst water movement in the zone of aeration is influenced first of all by the infiltration<br />
factor. Its components are: the steepness of the land surface, character of the<br />
ravine network and microrelief, composition and thickness of cover beds, precipitation<br />
(climate governing its character and seasonal distribution), conditions of soil freezing<br />
and thawing, the thickness of snow cover, its redistribution and thaw rate, the character<br />
of vegetation.<br />
The localized character of infiltration within the zone of aeration is further intensified<br />
by the non-uniform permeability of soluble rocks. The main causes of this nonuniformity<br />
are: (a) karsting that occurred at earlier stages of karst development when<br />
strata were in lower hydrodynamic zones or underwent previous epochs of karst development;<br />
in this connexion karst development in the zone of aeration invariably has<br />
features of an inherited process, (b) the heterogeneity of the lithological composition<br />
of strata of soluble rocks and the anisotropy of both fracture and pore permeabilities<br />
connected with this heterogeneity; (c> filling of karst cavities with various subterranean<br />
sediments; (d) the mode of rock occurrence.<br />
In the zone of aeration of many karst areas “perched” karst waters are widespread.<br />
The main cause of their formation is the non-uniform permeability of the strata of<br />
soluble rocks and presence of local aquicludes in them. Encountering these aquicludes<br />
descending infiltration waters change the direction of their movement from vertical to<br />
near-horizontal. The aquicludes are interlayers of insoluble rocks or impervious parts<br />
of soluble rocks; aquicludes are sometimes formed as a result of clogging of karst<br />
cavities. The regime of “suspended” karst waters depends on the continuity of aquicludes,<br />
on the character of karsting of rocks overlying them and on the regime of infiltration<br />
waters. In some cases the perched water occurs as small seasonal water-bearing<br />
lenses, in other cases it gives rise to seasonal or annual karst flows, which may be fairly<br />
continuous or only appear at discrete levels.<br />
“Suspended” karst waters move to the boundaries of the aquicludes or to cracks<br />
within them, so penetrating into the lower horizons of the zone of aeration, or to valley<br />
slopes where they form springs at different levels.<br />
The aquicludes of “suspended” karst waters may be destroyed as a result of leaching<br />
or (in uplift areas) graduai opening of fractures due to relaxation.<br />
The most favourable conditions for formation of “suspended” karst waters are<br />
observed in uplift areas confined to zones with a moist climate.<br />
Water derived from precipitation and entering the zone of aeration is markedly<br />
undersaturated with carbonate and sulphate compounds. The soil in which biochemical<br />
processes take place is a most powerful generator of COZ. The COZ content in soil air<br />
is tens and more often hundreds of times as great as in the atmosphere; the COS content<br />
is the greatest in the soil air of tropical and subtropical zones. The formation of COZ<br />
in soil is closely .connected with the growing period; depending on climate this<br />
process may be seasonal or annual.<br />
The CO2 of soil air is consumed as a result of (a) diffusion into the atmosphere, (b)<br />
assimilation by plants, (c) diffusion into subsoil horizons of the zone of aeration, and<br />
(d) dissolution in infiltration waters when they move through the soil layer. The last<br />
two processes are of prime importance to the enrichment of the karst waters of the zone<br />
of aeration with carbon dioxide; in summer the process of carbon dioxide diffusion<br />
from soil air into subsoil horizons of the zone of aeration increases because of increased<br />
thermal energy entering the soil.<br />
In the subsoil horizons of the zone of aeration, CO2 forms at the expense of the<br />
following processes: (a) the life and decomposition of organisms populating these horizons,<br />
(6) oxidation of organic matter brought in by infiltration and inflow waters, (c)<br />
oxidation of sulphides, and (d) at the expense of the organic matter of carboniferous<br />
strata.<br />
205
THE ZONE OF SEASONAL FLUCTUATION OF KARST WATER LEVEL<br />
This zone is of transitional character: when water levels fall, it becomes part of the<br />
zone of aeration and, vice versa, when water levels rise, it merges with the zone of full<br />
saturation. This determines the periodic change of the horizontal and vertical circula-<br />
tion of karst waters in the given zone.<br />
The thickness of the zone greatly varies not only between various karst areas but<br />
also within one and the same area. This variation is due to the influence of the infil-<br />
tration factor, the non-uniform karsting of rocks and the amplitude of river stage fluc-<br />
tuations in riverside areas.<br />
Here are examples of these relations: (a) the thickness of the zone is greater where<br />
there is a more marked seasonal irregularity of recharge by precipitation, (b) the thick-<br />
ness of the zone is less in the locations where there are “suspended” karst waters in the<br />
zone of aeration, discharging as springs on valley slopes, (c) the thickness of the zone<br />
is greater in locations where the karst absorbs surface waters, (d) intensive development<br />
of freely-communicating underground karst forms leads to a reduced thickness of the<br />
zone.<br />
Estimation of the permeability of rocks in individual locations of a massif subjected<br />
to karsting can be successfully made on the basis of analysing groundwater contour<br />
maps characterizing seasonal changes of the depression surface of karst waters.<br />
In some karst areas of the USSR, there are persistent local depressions of the karst<br />
water level along the river’s course. Such depressions are formed where the waters of<br />
large rivers are partially and usually nnnoticeably absorbed by karst cavities in the bank<br />
and downstream they return to the same river. Within such depressions, the thickness<br />
of the zone of seasonal fluctuation of karst water levels is closely connected with river<br />
flood stages.<br />
The dissolving ability of karst waters of the zone under consideration in riverside<br />
locations significantly increases as a result of mixing karst and river waters.<br />
THE ZONE OF FULL SATURATION SITUATED IN THE SPHERE OF DRAINING INFLUENCES OF THE<br />
LOCAL DRAINAGE NETWORK<br />
In this zone karst waters move all the year round. The lower boundary does not<br />
coincide with the water stage in the river or with the original valley floor; this boundary<br />
is situated much lower covering the area of stream underflow and the sphere of karst<br />
water discharge at the valley bottom. In the upper part of the zone, karst water movement<br />
to the valley drainage is nearly horizontal. In deeper horizons of the zone, the<br />
movement of karst waters as they approach their outflow assumes ap ascending character.<br />
The boundary of the zone under consideration with the zone of deep circulation<br />
lying below is of complicated nature. Its position depends on a number of factors: depths<br />
and widths of river-valleys, permeabilities of the massif being karsted, difference between<br />
the karst water level and the divide part of the massif and the river stage, etc. In coastal<br />
areas, it is most difficult to establish the boundary between these zones.<br />
Sites of intensive jointing, dislocations with a break in continuity and local karsted<br />
locations act as underground drains in respect of the karst waters of the zone under<br />
consideration. In the process of karst development the draining role of such local zones<br />
usually increases and in them large underground karst flows are formed which are of<br />
ascending character.<br />
The presence of even thin interbeds of impervious rocks greatly influences karst<br />
water movement to its outflow and in a number of cases is the cause of emergence of<br />
relatively separated “basins” of karst waters in the massif.<br />
206
Specific hydrodynamic conditions are observed in underchannel areas of this zone.<br />
In flood periods ascending karst waters here mix with river waters. Particularly in these<br />
periods, intensive clogging of underchannel karst cavities takes place. In some cases<br />
such clogging is so perfect that karsted zones become safe aquicludes.<br />
The karst waters of the zone under consideration are typical leaching waters, the<br />
undersaturation of which is due to active water exchange. Only in some locations waters<br />
saturated with calcium sulphate and carbonate compounds are observed.<br />
The dissolving ability of these karst waters is primarily a result of the undersatu-<br />
ration of the infiltration waters which enter the zone of full saturation via the zone of<br />
aeration. The following processes maintain this state of affairs: (u) diffusion of COS<br />
from the underground air of the zone of aeration which increases in warm seasons, (b)<br />
sulphide oxidation, (c) oxidation of the organic matter brought in by infiltration waters<br />
and trapped in rocks, (a') COZ formed as a result of the activity of bacteria living in the<br />
given zone. In underflow locations, the dissolving ability of karst waters increases when<br />
mixed with river waters.<br />
THE ZONE OF DEEP CIRCULATION<br />
This zone has been studied less and is characterized by slow water exchange. The<br />
direction of karst water movement here is determined by the tectonic structure and<br />
location of places of discharge which often arise far from recharge areas. For a number<br />
of causes (self-diffusion, hypergene metasomatosis, sulphate reduction, etc. i these waters<br />
undergo considerable transformation in their slow movement to their outflow.<br />
In this zone, leaching processes are greatly weakened, but they are still proceeding,<br />
so during a long geological period of time may cause the formation of caverns. Account<br />
must be also taken of the fact that biochemical processes accompanied by formation<br />
of COZ can develop at depths of more than one kilometre.<br />
In each distinct hydrodynamic zone karst develops in a way peculiar to the zone.<br />
However, there are generai regularities of the development of this process. They are<br />
manifested in the following: (I) reduction of massif karsting with depth, (2) more inten-<br />
sive karsting of near-valley sites as compared to the central parts of watershed massifs,<br />
(3) close relation of karst development and climate, carbonate karst being also connec-<br />
ted with vegetation (as a product of climate). These general regularities in some areas<br />
appear very distinctly, in others due to certain local causes they are complicated and<br />
concealed, in yet other areas they simply had no time to develop. As a rule, these com-<br />
plications and concealment are due to certain peculiarities of the geological structure<br />
and history of a given area. Specifically, the distinctness of general regularities of karst<br />
development greatly depend on the interrelation of the rate of karst formation, the<br />
rate of river erosion, marine abrasion and the extent of tectonic movements.<br />
207
THE EFFECT OF KARST ON THE REGULARITIES<br />
OF GROUNDWATER FLOW FORMATION<br />
Professors B.I. KOUDELIN and V.P. KARPOVA<br />
Moscow University, USSR<br />
Groundwater flow into streams is formed principally under the influence of three<br />
factors: climatic, topographic and hydrogeologic structure.<br />
Climate gives groundwater flow distribution features of pronounced latitudinal<br />
zonation. The groundwater flow moduli (1) in the territory of the European part of the<br />
USSR decrease uniformly from north and north-west to south and south-east from<br />
6 to 4 l/sec/km2 to fractions of a liter per second per km?. There is also a decrease in<br />
annual precipitation from 700 - 600 mm to 400 - 300 mm and increase in evapotrans-<br />
piration in the same direction.<br />
Topography, closely connected with the structure of the earth crust, gives ground-<br />
water flow features of vertical zonation which in turn are connected with distribution<br />
of precipitation which depends on the elevation. On plateaux, the largest values of<br />
groundwater flow are recorded in the uplands; within mountain-fold structures, ground-<br />
water flow moduli generally increase with land elevation (to certain limits) along with<br />
an increase in precipitation and increase in erosion depth and the length of erosion<br />
cutting per unit area.<br />
The hydrogeological factor disturbs the smooth zonal character of groundwater<br />
flow distribution over the territory. It is most pronounced in areas of fissure-karstic<br />
water occurrence. As a rule, karst sharply increases the values of groundwater flow<br />
moduli as compared with their regional values .(?)<br />
The Urals are a typical example of karst effect on groundwater flow formation. The<br />
considerable water supplies of the territory and high long-term moduli of groundwater<br />
flow of up to 10-12 l/sec/km2 in the basins of the rivers Shchugor, Vishchera, Kosva,<br />
etc. are due to calcareous karst development in the Paleozoic rocks of the western slope<br />
of the Urals. Here, rivers in their middle courses are incised in strata of karstic rocks<br />
and drain these aquifers well. At the same time, in basins situated in the vicinity, where<br />
karst is absent, the groundwater flow moduli do not exceed 3-4 l/sec/km2.<br />
On the eastern slope of the Urals, karstic waters are observed occasionally in the<br />
basins of the rivers Sosva and Vagran and are characterized by long-term groundwater<br />
flow moduli of 3-3.5 l/sec/km2, while in basins devoid of karst they decrease to<br />
2 I/sec/km2 and less.<br />
The surface of the Ufa Plateau is composed of Lower Permian strongly karsted<br />
calcareous and gypsiferous rocks, which easily absorb precipitation. Hence the increase<br />
of groundwater flow modulis up to 4 l/sec/km2 in the basins of the Ufa River and its<br />
tributaries Aya, Yuryuzan, etc., though in the territory adjacent to the plateau the<br />
groundwater flow modulus is equal to 2-3 l/sec/km2.<br />
Strong effects of karst on groundwater flow formation are observed in the Crimea.<br />
Jn the mountainous part of the Crimea under common climatic conditions, ground-<br />
water flow forms only in the area of Jurassic karsted calcareous sediments rich in<br />
water, where flow moduli are 5-15 I/sec/km2 and more against the background of<br />
Triassic, Jurassic, Cretaceous impervious rocks practically devoid of water.<br />
(1) The groundwater flow modulus is defined as a volume of groundwater discharge<br />
in a unit period of time from a unit of underground drainage area.<br />
(2) The data on the characteristics of groundwater flow presented below are bor-<br />
rowed from a set of groundwater flow maps of the USSR compiled by a group of<br />
hydrogeologists and hydrologists under the scientific leadership of Professor B.1. Kou-<br />
delin, the hydrological work was performed under O. V. Popov.<br />
208
The effect of karst on groundwater flow is also observed in other regions. For<br />
example, there are regions with anomalous values of flow moduli in karstic areas developed<br />
among the mari-chalk rocks in the middle course of the Volga River, namely<br />
in the basins of the rivers Serezha, Tesha and Pyana.<br />
In the north, a small area of intensively karsted limestones and dolomites of Carboniferous<br />
age, belonging to the Onega-North Dvina interfluve, occurs. Here, in the<br />
basins of the rivers Emtsa and Vaimuga, the average annual value of groundwater flow<br />
reaches 3.0-5.0 l/sec/km2, the background modulus value being 2.0-2.5 l/sec/kmz. In<br />
the karsted basin of the Kuloi River, composed of Carboniferous limestones and dolomites<br />
and Lower Permian gypsiferous sediments, the groundwater flow moduli are<br />
equal to 5.0-6.0 l/sec/km2.<br />
In theTiman Ridge, an increase in flow moduli from the edge to the centre amounting<br />
to 4 l/sec/km2 is observed. This may be due to development of karstic and fissure-karstic<br />
waters in Middle and Upper Paleozoic carbonaceous rocks.<br />
Similar examples of increase in groundwater flow modulis in karstic areas also<br />
can be found in the Black Sea zone of the southern slope of the Caucasus (Sochi-<br />
Sukhumi), where flow moduli reach 35-40 l/sec/km2.<br />
In karstic areas, a pronounced -increase in both average annual and minimum<br />
groundwater flow moduli is observed. Thus, during the period of steady low water, the<br />
long-term flow modulus for the Vishera River is 4.5 l/sec/km2, and for the karsted basins<br />
of the rivers on the eastern slope of the Urals it is equal to 1.5 I/sec/km2. On the Ufa<br />
and Onega-North Dvina plateaux the flow moduli are 3-3.5 l/sec/km2, and on the<br />
Kuloi Plateau up to 4.0 l/sec/km2 and more, while for non-karsted river basins of these<br />
regions minimum groundwater flow moduli range from 1 to 2 l/sec/km2. Sharp increases<br />
in minimum groundwater flow moduli as compared with their zonal values are observed<br />
in karstic areas of the southern slopes of the Caucasus, in the Crimea and in the middle<br />
part of the Volga basin, etc. The controlling effect of karst on streamflow is thus manifested,<br />
which was established by many hydrologists and hydrogeologists working in<br />
karstic regions.<br />
The controlling rôle of karst is manifested not only in annual redistribution of<br />
streamflow, i.e. a decrease in spring floods and increase in stream low-water discharges,<br />
but also in the ratio of groundwater Row to surface runoff. The portion of groundwater<br />
Row in the total annual streamflow, or the so-called coefticient of base flow, invariably<br />
increases in karstic areas.<br />
Over most of the European territory of the USSR, the groundwater flow constitutes<br />
20-30% of the total streamflow; in the south however it is less and in the north-east of<br />
the country in the perma-frost area it is less than 10%. In the areas where karst is<br />
developed, in the Urals, the Ufa and Onega-North Dvina plateaus and the Central<br />
Devonian field, the coefficient of base flow increases to 40-50%; on the Kuloi Plateau,<br />
in the area of the Caucasus and in the Crimea it is more than 50%.<br />
The coefticient of groundwaterflow, i.e. the ratio of groundwater flow to precipitation,<br />
also sharply increases in karstic regions. In karsted areas of the Kuloi Plateau, the<br />
western slope of the Urals and the Caucasus, it is equal to 30-40% and more (from long-<br />
term data), while in non-karstic areas it amounts to 10-20%. In the Crimea Yaiila, the<br />
coefficient of groundwater flow reaches 70%.<br />
In the Silurian Plateau on the coast of the Gulf of Finland, over an area of 3000 km2,<br />
where recent intensive calcareous karst is developed (revealing itself on the surface as<br />
single or multiple sink holes), surface runoff is absent altogether. All the precipitation,<br />
except that lost by evaporation and transpiration, is absorbed by karstic rocks and<br />
recharge the karstic waters to form groundwater flow. According to V. K. Kolotilshchi-<br />
kov’s water balance investigations during the period of 1948-1954, evapotranspiration<br />
209
losses constituted 41 to.61% of the total precipitation, the remaining 39 to 59% becoming<br />
inflow and percolation into the limestone strata. For these seven years, an average of<br />
38.7% of the total precipitation amount went to spring flow, and 2.5-23.2% went underground<br />
to change groundwater resources and form deeper groundwater flow.<br />
The phenomenon of intensive absorption of precipitation and surface runoff by<br />
karstic rocks, exposed on the land surface, leading to elimination or sharp diminishing<br />
of runoff is well known and observed in individuai areas of the Crimea Yaiila, the Ufa<br />
Plateau and other regions of the USSR. G.A. Maksimovich and D.S. Sokolov give<br />
examples of this phenomenon in many karstic regions of Italy, Morocco, Australia,<br />
France, the Balkan Peninsula and other countries.<br />
The “modulus of absorption” of the surface runoff in the Southern Urals in the<br />
basins of the rivers Kamenka, Blinovka, Termenevkd, Pokrovka, etc., according to<br />
P.V. Molitvin‘s observations, amounted to 4-5 l/sec/km2 in 1953 and 6-7 l/sec/kmz<br />
in 1954; in the Uluir River basin it reached 4-6 l/sec/km2. For the karsted basins of the<br />
rivers of the Onega-North Dvina divide and for the Pyarga River basin in particular the<br />
“modulus of absorption” was 6.5 l/sec/km2 in 1949, for the Sukhaya Sheksna River<br />
basin about 7.5 I/sec/km2, according to the same data.<br />
The rivers mentioned above have a steady flow only at their mouths as a result of<br />
karstic water discharge. Along all the river course steady flow is observed only in the<br />
periods of spring floods, a significant amount of streamflow being lost in karstic rocks<br />
at the bottoms of river channels and valleys.<br />
However, losses of surface runoff and precipitation are largely of local nature and<br />
lead to redistribution of groundwater flow in relatively small areas. Highly indicative<br />
of this are the results of P.V. Molitvin’s investigations in the karstic regions of the<br />
Northern and Southern Urals and the Onega-North Dvina interfluve.<br />
The estimation of the water balance of the rivers Vagran and Sosva carried out by<br />
P.V. Molitvin in 1947 showed that practically all the waters absorbed in the upper parts<br />
of the basins of these rivers returned to rivers “at the moment of the rivers emergence<br />
from the limestone band into the zone of non-karstic rocks, not influencing the water<br />
volume at the final gauge station”. This phenomenon was also established by the same<br />
investigator in the Southern Urals. The waters lost by surface runoff and channel flow<br />
in the Kamenka River return underground to the Aii River, which is the main drainage<br />
artery of the region .Within the area of the Aii River basin, 5384 kin2, the average annual<br />
streamflow modulus becomes stable. The channel flow of the Emtsa River, the main<br />
stream of the Onega-North Dvina interfluve, has also undergone great changes along<br />
its course. These changes are due to the development of varied forms of calcareous karst<br />
inits basin. However, with the basin area of 1467 km2 the streamflow modulus improves<br />
and approaches the “climatic standard”. The flow which is lost “in the basins of the<br />
rivers Pyarga and Sykhaya Sheleksna returns underground to the Emtsa River forming<br />
large spring openings in its valley”.<br />
The phenomenon mentioned above is of great importance to-the study’ of ground-<br />
water flow in karstic regions. In regional estimation of the groundwater flow values and<br />
natural groundwater resources in karsted territories using the method of river hydro-<br />
graph separation, it is necessary to take sufficiently large basins, which according to the<br />
classification of P.V. Molitvin, G.A. Maksimovich and L.A. Vladimirov are the so-<br />
called “neutral river basins”, within which the exchange between surface and ground-<br />
waters is of “closed” nature, i.e. absorption of the surface runoff and streamflow in<br />
some areas of a basin is compensated by strong groundwater efflux in other areas.<br />
Other types of rivers, namely, rivers “with predominance of flow losses in karstic rocks”<br />
or “with partial flow loss into karst” cannot be used for estimatim and mapping of<br />
groundwater flow and naturalgroundwater resources, as in this case:underestirnated<br />
values of groundwater ,flow moduli wil be obtained. Conversely, karstic rivers “with<br />
21Q
predominant groundwater drainage” wil give over-estimated values of groundwater<br />
flow moduli due to groundwater movement from adjacent basins and due to lack of<br />
coincidence of areas of surface and subsurface catchments. These rivers may be used<br />
for the purposes mentioned above, ifthere is an opportunity to determine the areas of<br />
subsurface catchments sufficiently precisely. These circumstances were taken into con-<br />
sideration while compiling maps of groundwater flow of the USSR.<br />
The characteristics of groundwater flow for karstic regions were obtained by the<br />
method of separation of total streamflow hydrographs for sufficiently large basins of<br />
from 1000-3000 to 10,000 kmz, and rarely 30,000 km2, which can be classed as “neutral<br />
river basins”. However, the position of gauges on rivers has never exactly coincided<br />
with the boundaries of karst development. In this sense, the data presented above are<br />
somewhat conditional, though they reflect the principal features of groundwater flow<br />
formation in karstic areas. If river gauges were located specifically, these features would<br />
be expressed more clearly.<br />
On the basis of the available material, obtained at the present time as a result of<br />
many investigations, the following main conclusions can be made concerning the effect<br />
of karst on the regularities of groundwater flow formation:<br />
1. Karst leads to an intensification of groundwater flow. The averagelong-term, annual<br />
maximum and minimum flow moduli (or inches of runoff), and the coefficients o<br />
groundwater flow and base flow in karstic regions have markedly greater values than<br />
the regional ones.<br />
2. Karst interrupts the smooth zonal character of the distribution of groundwater,<br />
flow values over the territory, which ordinarily depend on the climatic latitudinaif<br />
zonation or vertical zoning in mountain-fold areas.<br />
3. Within karstic regions, wide fluctuations of groundwater flow and surface runoff<br />
are observed: areas abundant in water are replaced by arid waterless areas. This is due<br />
to the nature of karst and hydrography of karstic regions.<br />
4. Karst leads to redistribution of groundwater flow into rivers within relatively small<br />
areas. When studying the groundwater resources of karstic regions by the genetic sepa-<br />
ration of hydrographs of total streamflow, it is necessary to take sufficiently large<br />
“neutral basins”, within which a full cycle of interrelation (exchange) of surface and<br />
groundwaters takes place.<br />
5. The large values of the moduli and coefficients of groundwater flow and base flow<br />
in karsted regions are due not only to highly favourable conditions for absorption of<br />
precipitation and surface runoff by karstic rocks but also due to the peculiar features<br />
of the karstic water regime noted for its vigorous, turbulent and rapid groundwater<br />
movement, relatively direct paths of water flow and well-developed recharge and dis-<br />
charge areas. The average coefficients of groundwater flow for karstic waters are gener-<br />
ally considerably higher than those for other types of groundwaters, excluding fissure<br />
waters in mountain-fold structures.<br />
6. The type of groundwater flow in karsted massifs in many cases (depending on the<br />
type of karst) roughly resembles a streamflow regime and has the same phases with the<br />
latter, but sometimes may lag behind the streamflow maxima and minima.<br />
7. Karsted rock massifs are noted for relatively limited water storage as compared<br />
with loose sediments. The average volume of interstices of karst massifs for large rock<br />
blocks is typically a few per cent, whereas the porosity of loose sediments is equal to<br />
tens of per cent. The values of groundwater flow moduli are conversely related. Accord-<br />
ingly the time of renewal of karstic waters is much briefer than that of waters in loose<br />
sediments.
The peculiarities of groundwater flow formation in karstic areas described above are<br />
undoubtedly of a generalized nature. The regularities of the formation of groundwater<br />
flow into streams are greatly influenced, apart froin karst, by other physiogeographic<br />
factors-the presence of forests, lakes, marshes, the ruggedness of the territory, perma-<br />
frost in the north-east of the USSR, the human factor, etc., which superimpose on the<br />
principal factors which have been discussed above. The factors do not act in isolation,<br />
but are interrelated. Only broad field experiments, which could be most easily achieved<br />
in the programme of the International Hydrological Decade, wil help elucidate the true<br />
rôle of karst in development of groundwater flow processes.<br />
It should be pointed out that the typical features of the groundwater flow regime in<br />
karstic areas, as described above, are of more general nature. They quite well characterize<br />
groundwater flow in areas of fissure development in mountain-fold structures,in coarse<br />
detrital rocks composing alluvial fans and in some other rocks, for example, young<br />
quaternary lavas in the Armenian Highlands.<br />
212
RESUME<br />
LE REGIME DE TARISSEMENT DE LA FOUX<br />
DE LA VIS<br />
RTUDE PR~LIMINAIRE<br />
Commune de Vissec : Gard<br />
(Carte I.G.N. : Le Caylar XXVI-42, N”3)<br />
J. FORKASIEWICZ et H. PALOC<br />
Étude comparée de 11 courbes de tarissement d’une importante résurgence en<br />
terrain dolomitique.<br />
Analyse des courbes observées, extrapolées et décomposées, emploi des formules<br />
et signification des résultats.<br />
La Foux de la Vis (X = 69200, Y = 178,55) est la plus importante résurgence de<br />
la région constituant les Grands Causses du Massif Central français, et l’une des plus<br />
grosses sources de France.<br />
C’est une source «de karst» dont le bassin d’alimentation se développe surtout<br />
sur les calcaires et les dolomies jurassiques des causses méridionaux du Larzac, de<br />
Campestre et de Blandas-Montdardier. Mais elle draine aussi, par l’intermédiaire de<br />
captures souterraines dans les hautes vallées du Vissec et de la Virenque, les circulations<br />
superficielles du versant sud du massif du Saint-Guiral formé de terrains primaires<br />
pratiquement imperméables.<br />
En période de très hautes eaux, ces captures ne sont pas suffisantes pour absorber<br />
la totalité de l’écoulement : celui-ci réutilise alors le réseau superficiel creusé dans les<br />
calcaires, empruntant sur plusieurs kilomètres en aval des points de captures les gorges<br />
profondes, normalement à sec, du Vissec et de la Virenque. C’est à quelques kilomètres<br />
en aval de leur confluence, sur la rive droite de la vallée ainsi formee, que se situe la<br />
Foux de la Vis.<br />
En période de moyennes et de basses eaux, ce n’est qu’à partir de cette résurgence<br />
que se produit une circulation superficielle permanente dans la vallée : la rivière à<br />
laquelle elle donne naissance est dénommée «la Vis)).<br />
La localisation de la Foux est récente et son raccordement au talweg de la vallée<br />
inachevé. Elle jaillit à 360 mètres d’altitude de la dolomie bathonienne et de nombreuses<br />
grottes dans son voisinage attestent qu’elle s’est déplacée souvent dans ce niveau<br />
dolomitique, et de plus en plus profondément.<br />
C’est une source pérenne, bien que cette pérennité ait été interrompue au moins<br />
quatre fois : en 1779 pendant 8 jours, en 1890 pendant 24 heures, en 1927 pendant<br />
8 heures, et le 10 août 1961 pendant 6 heures.<br />
Son débit d’étiage est élevé, rarement inférieur à 1 m3/seconde.<br />
Son débit de crue paraît dépasser 10 m3/seconde.<br />
A 4 km environ en aval de la source, une station de jaugeage (= prise de Navacelle)<br />
a été aménagée par E.D.F. et, en dehors des périodes de très hautes eaux, les débits<br />
mesurés peuvent être condondus avec ceux de la source, aucun apport ni aucune perte<br />
ne se faisant entre ces deux points.<br />
Nous avons eu à notre disposition les relevés des débits moyens journaliers pour la<br />
période allant du ler janvier 1950 au 31 mai 1961(*). Ce sont ces relevés que nous<br />
(*) Nous devons remercier ici MM. Brousse et Grand, ingénieurs de la<br />
5e Circonscription Electrique à Toulouse, qui ont bien voulu nous confier ces relevés.<br />
213
avons cherché à exploiter ici car il pouvait être intéressant, disposant de plusieurs<br />
années d’observations, de préciser le régime de vidange de la source et de vérifier la<br />
validité d’emploi des formules de tarissement habituellement utilisées pour caractériser<br />
un exutoire.<br />
Les services intéressés de 1’E.D.F. estiment que dans l’ensemble les relevés doivent<br />
être assez précis pour les débits naturels inférieurs à 3 m3/s, c’est-à-dire ceux qui nous<br />
intéressent surtout ici. Au-delà (débits naturels supérieurs à 3 m3/s) les évaluations<br />
journalières faites seraient plus approximatives, certaines, au-delà de 10 m3/s, pourraient<br />
même comporter une grosse marge d’incertitude.<br />
La station est à l’altitude de 334,57 mètres et le bassin superficiel pour cette station<br />
est voisin de 282 km2. Le bassin d’alimentation de la Foux, bien qu’encore imparfaitement<br />
délimité, ne saurait être très différent de cette valeur.<br />
Sur les quatre pluviomètres dont on pouvait disposer, un seul (Alzon) est situé à<br />
l’intérieur du bassin versant superficiel de la Vis à la station, les trois autres (Le Caylar,<br />
Saint-Maurice (bourg), Arrigas) se trouvant à sa périphérie.<br />
Aussi est-ce avec la plus grande prudence que certaines observations doivent<br />
être interprétées.<br />
RELATIONS PLUIE-DEBIT<br />
Afin de pouvoir analyser l’évolution du débit de la Foux en étiage et caractériser<br />
ainsi le comportement de l’aquifère en régime rigoureusement non influencé, nous avons<br />
cherché a déterminer l’influence de certaines pluies de saison sèche sur le débit de la<br />
source.<br />
Les résultats obtenus ne sont donnés qu’à titre indicatif, parce que d’une part<br />
les 4 stations pluviométriques déjk mentionnées ne reflètent qu’imparfaitement la<br />
pluviométrie réelle du bassin, en raison de leur petit nombre, et que d’autre part le<br />
bassin étant relativement étendu et peu homogène du point de vue pluviométrique,<br />
l’influence d’une pluie sur le débit de la source pourra Qtre très différent selon sa<br />
localisation sur le bassin.<br />
Toutefois, ayant pu disposer de nombreuses moyennes entre les quatre postes,<br />
nous pouvons admettre comme twalables statistiquement)) les constatations ci-après :<br />
- Les pluies d’étiage, inférieures à 10 mm, et isolées, n’influencent pas d’une<br />
manière sensible le débit de la Foux.<br />
- II suffit cependant que plusieurs pluies inférieures mais assez voisines de 10 mm<br />
se succèdent pour provoquer une stabilisation temporaire du débit, ou un ralentissement<br />
de la décroissance du débit de la source.<br />
- Lorsqu’une influence se fait sentir, elle se manifeste à la source (station E.D.F.)<br />
1 à 2 jours après la pluie.<br />
11 est certain que cette influence des pluies sur le débit demanderait à être précisée<br />
en fonction des nombreux paramètres que nous n’avons pas eu la possibilité d’étudier<br />
ici : situation d’une averse dans le cycle hydrologique, durée et intensité, état de<br />
remplissage du karst etc ...<br />
Mais ne s’agissant pas d’un bassin versant expérimental, nous n’avons pu que<br />
rechercher les seules indications qui nous étaient nécessaires pour sélectionner et<br />
interpréter nos diverses courbes annuelles de tarissement.<br />
ANALYSE DES COURBES ANNUELLES DE TARISSEMENT<br />
Les périodes choisies pour l’analyse du régime de tarissement de la Foux de la Vis<br />
sont les suivantes :<br />
214
1950<br />
1951<br />
1952<br />
1953<br />
1954<br />
1955<br />
1956<br />
1957<br />
1958<br />
I959<br />
1960<br />
du 19 mars au 15 octobre<br />
du 19 mai au 12 octobre<br />
du 4 mai au 20 octobre<br />
du 20 mars au 15 septembre<br />
du 16 mai au 22 novembre<br />
du 1 er février au 23 septembre<br />
du 30 mars au 24 septembre<br />
du 17 juin au 10 décembre<br />
du 4 avril au 15 septembre<br />
du 30 avril au 4 septembre<br />
du 28 mars au 26 juillet<br />
210 jours<br />
146 jours<br />
169 jours<br />
179 jours<br />
190 jours<br />
234 jours<br />
i80 jours<br />
175 jours<br />
169 jours<br />
127 jours<br />
120 jours<br />
Elles correspondent aux périodes pendant lesquelles le débit de la source décroissait<br />
d’une manière plus ou moins régulière (pluies d’étiage et crues parasites) mais assez<br />
continue.<br />
L’action des précipitations survenant au cours de ces périodes peut être de deux<br />
sortes :<br />
- ou bien elles retardent le tarissement provoquant un décalage dans le temps de la<br />
courbe de tarissement, comme par exemple pendant l’étiage 1953 (fig. Za), ce qui<br />
signifie qu’il y a eu une recharge sensible des réserves;<br />
- ou bien, si l’action des pluies est momentanée, l’hydrogramme de la nouvelle<br />
décrue peut rattraper la courbe de tarissement au bout d’un temps plus ou moins<br />
long, comme par exemple pendant l’étiage 1951 (fig. 1 a).<br />
Dans le cas où l’on n’observe pas une courbe continue de tarissement en raison<br />
d’une recharge des réserves sous l’influence d’une pluie d’étiage, ou s’il y a eu simplement<br />
changement de vitesse de décroissance du débit, on a intérêt à séparer la partie<br />
régulière représentant le tarissement pur tel qu’il se serait produit sans l’intervention<br />
de la pluie d’étiage, de la partie modifiée sous l’influence de cette pluie (cf. figures 1 a<br />
et 2n).<br />
Nous avons donc essayé de reconstruire ces courbes de tarissement pur, que nous<br />
appellerons par la suite
21 6<br />
li<br />
----___<br />
------<br />
Fig.la<br />
Fig .I b
Fig. IC<br />
Fig. 1 - Foux de la Vis. (Année 1957).<br />
1 a : Courbe de tarissement observée et extrapolée.<br />
1 b : Décroissance du débit en diagramme semi-logarithmique. log Q = f(t)<br />
(hydrogramme observé).<br />
1 c : Hydrogramme extrapolé et sa décomposition.<br />
1 d: Essai d'application de la formule l/Qt2 = I/Qo2+Bt.<br />
217
La formule permet de prévoir en période de régime non influencé (tarissement pii-)<br />
quel sera le débit de la source au bout d’un temps f si l’on connaît le débit Qo au<br />
temps to.<br />
L’intégration de la formule permet d’évaluer le stock d’eau disponible contenu<br />
dans les réserves souterraines à un instant t à partir du débit Qt correspondant à cet<br />
instant :<br />
I-.<br />
‘x<br />
Volume du stock = Qo e-“ dt = go = QoT<br />
a<br />
u-<br />
pour I = 10<br />
R~LTATS OBTENUS PAR APPLICATION DE LA FORMULE EXPONENTIELLE À LA Foux<br />
DE LA VIS<br />
Les diagrammes semi-logarithmiques (figs. 1 b et 26) où sont reportés en ordonnées<br />
les débits observés en m3/s en échelle logarithmique, en abscisses les temps corres-<br />
pondants, montrent que ces débits s’alignent convenablement seulement au bout d’un<br />
temps assez long, ne donnant que des tronçons de droites qui sont courts par rapport<br />
a la durée totale de la vidange.<br />
Ainsi :<br />
En<br />
1950<br />
1951<br />
1952<br />
1953<br />
1954<br />
1955<br />
1956<br />
1960(*)<br />
Les points commencent<br />
à s’aligner au bout de<br />
i 30 jours<br />
100 jours<br />
100 jours<br />
122 jours<br />
108 jours<br />
90 jours<br />
50 jours<br />
53 jours<br />
(*) Les années 1957, 1958 et 1959 donnent des courbes.<br />
A partir de qo =<br />
i,i m3/s<br />
1,6 m3/s<br />
i ,I m3/s<br />
l,i m3/s<br />
2,0 m3/s<br />
2,4 m3/s<br />
2,8 m3/s<br />
3,3 m3/s<br />
Le coejïcient de tarissement OL uane ainsi de 0,0025 à 0,OI. On constate donc :<br />
- Qu’il n’est pas possible de ramener ici la décroissance du débit en période de<br />
vidange à une simple fonction exponentielle. Seules les parties terminales des<br />
hydrogrammes obtenus (à l’exception des années 1956 et 1960) donnent des droites<br />
218
dont les équations montrent une décroissance lente du débit qui correspond bien<br />
à la vidange d’un réservoir en régime laminaire.<br />
- Que le coefficient de tarissement habituellement utilisé pour caractériser une source<br />
de karst, varie ici d’une année à l’autre. Cette variabilité pourrait être la conséquence<br />
d’une hétérogénéité du bassin et d’une alimentation des réserves irrégulière dans<br />
le temps et dans l’espace : les différentes valeurs de a pourraient par exemple corres-<br />
pondre à une alimentation préférentielle de telle ou telle partie du bassin ... mais le<br />
manque de points d’observation ne permet pas de conclure sur ce point.<br />
ANALYSE DES COURBES EXTRAPOLEES DE TARISSEMENT<br />
La partie supérieure de l’hydrogramme, celle qui donne une courbe en coordonnées<br />
semilogarithrniques, indique qu’au début de la vidange il y a plusieurs régimes de<br />
décroissance des débits qui se superposent au régime laminaire. Une première étude<br />
de la Foux de la Vis a d’ailleurs déjà permis à l’un d’entre nous de reconnaître à la<br />
dolomie un comportement aquifère qui rend bien compte de cette superposition de<br />
plusieurs types d’écoulement.<br />
Théoriquement, il est possible de séparer sur l’hydrogramme reporté en coordonnées<br />
semilogarithmiques les différentes composantes de l’écoulement.<br />
Les courbes de décrue de chacune des composantes sont alors représentées approximativement<br />
par des droites de pentes différentes.<br />
En décomposant pour la Foux de la Vis les ((hydrogrammes extrapolés)), on se<br />
rend compte qu’il y a pour la plupart des années trois composantes d’écoulement<br />
(figs. 1 c et 2c). Si l’on veut alors analyser le tarissement à partir de la pointe, le débit<br />
de tarissement de la source à l’instant t sera la somme de trois (ou méme quatre pour<br />
l’année 1950) exponentielles :<br />
Les débits 40, 40 et q‘l et les coefficients al, a2 et a3 correspondant aux trois différentes<br />
sortes d’écoulement, doivent être cherchés chaque fois sur les droites qui leur<br />
correspondent. La somme de q’+q”+q”’ étant égale au débit observé.<br />
Au bout d’un certain temps les premiers termes de 1’8q”ation peuvent être<br />
négligés : ainsi :<br />
Pour l’année 1953 (fig. 2c), la formule complète de tarissement en partant de<br />
l’instant r = O et du débit de la pointe est la suivante :<br />
le débit de la pointe observé = 10,8 m3/s.<br />
Après 13 jours, le premier terme devient négligeable et la formule devient (en<br />
tenant compte de la décroissance du débit) :<br />
e -0,003Zt<br />
Q = q” e-a2t + qlf‘ e-a3t = 1,2 e-0,048t + 1,3~<br />
Et après 90 jours, elle peut être simplifiée à son dernier terme :<br />
Q = 1,1 e-0,0032t<br />
Le volume initial disponible serait donc la somme de trois volumes différents :
220<br />
Fig.20
E I<br />
Fig.2c<br />
Fig. 2 - Foux de la Vis (Année 1953).<br />
2a : Courbe de tarissement observée et extrapolée.<br />
2b : Décroissance du débit en diagramme semi-logarithmique. log Q = f(t)<br />
(hydrogramme observé).<br />
2c : Hydrogramme extrapolé et sa décomposition.<br />
2d: Essai d’application de la formule l/Qt2 = 1/Qo2SBt.<br />
22 1
Le volume en fin de période de vidange serait seulement fonction du débit q”’ et<br />
de m3 et correspondrait à celui des micro-fissures :<br />
Veen in, = 9“’ . 86.400<br />
u3<br />
La différence des deux volumes donnant le volume d’eau écoulé pendant l’étiage :<br />
volume écoulé = (Vo - I.-e)<br />
Les tableaux ci-dessous donnent les coefficients de tarissement des différentes<br />
composantes de l’écoulement (tableau I), et les volumes initiaux disponibles, résiduels<br />
CE fin d’kt‘tiage, et écoules pendant l’étiage, pour les années étudiées, à l’exception de<br />
1957 et 1958, les précipitations ayant été trop importantes pendant les étiages de ces<br />
2 années pour qu’il y ait eu tarissement (tableau II).<br />
TABLEAU I<br />
Coeflcients de tarissement de diffirentes composanies de l’écoulement<br />
Année<br />
Débit observé<br />
à l’origine<br />
&O en m3/s<br />
Cc0 a1 a2 u3<br />
1950<br />
1951<br />
1952<br />
1953<br />
1954<br />
1955<br />
1956<br />
1958<br />
1960<br />
10,4<br />
17,5<br />
18,6<br />
10,8<br />
14,4<br />
24<br />
10,3<br />
10<br />
22,4<br />
1 0,286<br />
0,4<br />
0,286<br />
0s<br />
0,5<br />
1<br />
2<br />
-<br />
1<br />
3<br />
TABLEAU II<br />
0,036<br />
0,056<br />
0,05<br />
0,048<br />
0,063<br />
0,083<br />
0,091<br />
0,091<br />
0,143<br />
1950 1,3 793 52,O 60,6 31<br />
1951 2J 67 54,5 63,5 31<br />
1952<br />
1953<br />
3,4<br />
1,3<br />
8,6<br />
3,6<br />
65,6<br />
37,4<br />
77,6<br />
42,3<br />
39<br />
21,4<br />
1954<br />
1955<br />
0,9<br />
171<br />
7,6<br />
8,1<br />
54,O<br />
61 ,O<br />
62,5<br />
70,2<br />
24,9<br />
20,9<br />
1956<br />
1958<br />
1960<br />
02<br />
0,3<br />
0,4<br />
3,1<br />
497<br />
3,5<br />
43,2<br />
41,4<br />
45,8<br />
46,5<br />
46,4<br />
49,7<br />
16<br />
20,8<br />
14,7<br />
V, : volumes initiaux,<br />
Ve : volumes résiduels en fin d’étiage,<br />
Yo- Ve : volumes écoulés pendant l’étiage.<br />
(Volumes exprimés en 106 m3).<br />
222<br />
0,0025<br />
0,0038<br />
0,0030<br />
0,0032<br />
0,0042<br />
0,0045<br />
0,007<br />
0,0042<br />
0,01<br />
29,6<br />
32,5<br />
38,6<br />
20,9<br />
37,6<br />
49,3<br />
30,5<br />
25,6<br />
35,0
Les pourcentages des différents volumes qui entrent en jeu pour chaque année<br />
considérée sont les suivants :<br />
Année t‘O vó V: Vo’<br />
1950<br />
1951<br />
1952<br />
1953<br />
1954<br />
1955<br />
1956<br />
1958<br />
1960<br />
% %<br />
12 86<br />
10,5 86<br />
11 84,6<br />
8,5 88,5<br />
12 86,5<br />
11,5 87<br />
63 93<br />
10,2 89,2<br />
7 92<br />
Ces résultats permettent de préciser le comportement hydraulique de l’aquifère<br />
de la Foux de la Vis :<br />
1) Ils mettent en relief l’existence de vitesses de décroissance très différentes : à<br />
03 correspond une vidange très lente, en régime laminaire, tandis que les vitesses sont<br />
beaucoup plus rapides pour a2 (environ 14 fois plus rapides que pour a3) et pour mi<br />
(environ 150 fois plus rapides que pour a3) : nous interprétons ces différences de vitesse<br />
comme étant la conséquence de la juxtaposition de plusieurs types de porosité dans le<br />
bassin d’alimentation de la Foux.<br />
2) En ce qui concerne les volumes, on voit que dans tous les cas c’est le volume<br />
Vó - qui correspond à a3 - qui est de beaucoup le plus important par rapport à<br />
VA et Vi, constituant de 850,; (1952) à 93% (1956) du volume total à l’instant initial :<br />
nous admettons que ces indications traduisent la prédomipance des micro-fissures<br />
dans l’alimentation de la résurgence et nous lions cette porosité à la présence très<br />
générale des dolomies du Bathonien (et du Lias) dans le bassin d’alimentation de la<br />
Foux de la Vis.<br />
3) Les différentes valeurs des coefficients a observés pour chaque année montrent<br />
qu’il est risqué de vouloir caractériser le régime d’une source par de tels coefficients<br />
si l’on ne dispose que d’une année d’observation. Nous avions déjà indiqué la difficulté<br />
de tracer une courbe moyenne de tarissement de la Fou pour I’epsemble de ses étiages.<br />
La figure 3 souligne ainsi que pour un même débit observé, les volumes résiduels peuvent<br />
être très différents selon l’année considérée, variant parfois du simple au double. 11<br />
paraît donc de la plus grande importance, si l’on veut que ces coefficients aient une<br />
rigoureuse signification, de les relier de très près au régime pluviométrique d’un bassin,<br />
et plus précisément à la répartition dans le temps et dans l’espace des averses sur ce<br />
bassin. Faute de mieux, il sera préférable de donner des intervalles de variations de<br />
ces coefficients pour le cycle d’années d’observation.<br />
EMPLOI D’UNE AUTRE FORMULE<br />
L’application de la formule exponentielle, parce qu’elle nécessite la décomposition<br />
de l’hydrogramme observé, est dans le cas de la Fow de la Vis d’un usage peu<br />
commode : en effet cette décomposition ne peut être faite que lorsque l’on connaît la<br />
223
partie terminale de I’hydrogramme. Ainsi elle ne permet pas de prévoir le débit à<br />
l’instant t2 en fonction du débit Q1 observé à l’instant t1 si l’on ne connaît que la<br />
partie initiale de l’hyàrogramme, ni de calculer le volume emmagasiné en cet instant.<br />
Aussi avons-nous procédé à la recherche d’une autre formule (cf. H. SCHOELLER 1948).<br />
15.<br />
IQ<br />
9-<br />
L<br />
7.<br />
b<br />
5-<br />
4.<br />
3-<br />
2.<br />
1.<br />
I<br />
I~~~~<br />
I<br />
l<br />
I<br />
I<br />
l<br />
I<br />
l<br />
I<br />
1 I<br />
l<br />
I 1<br />
\<br />
i ;<br />
I i<br />
I :<br />
i ;<br />
+<br />
‘60<br />
-Volume résiduel en l06d<br />
I 80 70 60 50 40 30 20<br />
Fig. 3 - Foux de la Vis. Volumes résiduels (d’après la formule exponentielle).<br />
En étudiant la relation qui existe entre d4/dt et 4 qui ne nous a pas donné de<br />
résultat, et ensuite entre log (-dqldt) et log 4, nous arrivons à une formule du type :<br />
elle correspond à une nappe libre en régime mixte ou turbulent.<br />
224
Dans notre cas n serait égal environ à -0,5, ce qui donnerait :<br />
1 1 1<br />
---<br />
Q? Qg<br />
- -i- Bt OU Q, =<br />
Qo et Qt étant les débits observés aux instants to et t, et B un coefficient de décroissance<br />
du débit.<br />
Cette équation donne une droite en diagramme arithmétique si l’on porte :<br />
- en ordonnées, l’inverse du débit observé au carré,<br />
- en abscisses, le temps correspondant.<br />
La pente de la droite permet de calculer 8.<br />
Les graphiques obtenus (figs. id et 2d) montrent que l’on obtient de très bonnes<br />
droites, notamment pour l’étiage 1951.<br />
Au cours des autres étiages les crues survenant pendant la Mdange donnent une<br />
dentelle de points et décalent les droites, mais en prenant les débits sur les courbes<br />
extrapolées de tarissement (figs. i a et 2n), on arrive trks bien à tracer des droites pour<br />
tous les étiages, sauf pour 1957 et 1960.<br />
L’intégration de la formule entre deux instants donnés donne le volume d’eau<br />
écoulé pendant cet intervalle :<br />
donc :<br />
’-> (VO - Ve),, m3 = 2 (-L - ‘ 86.400<br />
P QI QO<br />
Le tableau ci-dessus résume les résultats obtenus :<br />
Année QO ß ( vo - Ve)<br />
en 106 m3<br />
1950 10,4<br />
1951 17,5<br />
1952 18,6<br />
1953 10,8<br />
1954 14,4<br />
1955 24,O<br />
1956 10,3<br />
1958 10,o<br />
1959 t6,7<br />
0,0059<br />
0,0040<br />
0,0034<br />
0,0093<br />
0,0037<br />
0,0028<br />
0,0037<br />
0,006<br />
0,0041<br />
En ce qui concerne 8 les valeurs sont assez homogènes.<br />
Les valeurs des: volumes d’eau écoulés sont comparables à celles obtenues par la<br />
formule exponentielle (cf. tableau II).<br />
30<br />
32<br />
36<br />
21<br />
36<br />
46<br />
31<br />
26<br />
15<br />
225
Ainsi, cette formule, beaucoup plus simple donc d’usage plus facile que la formule<br />
exponentielle, a l’avantage d’être la méme pour toute la période de vidange. Elle<br />
permet de prévoir le débit de la source en fonction du débit Qo observé à l’instant to,<br />
en ne connaissant que le début de la courbe de vidange, ceci bien sûr en régime<br />
non influencé.<br />
En ce qui concerne l’appréciation des volumes, l’intégration de la formule permet<br />
de calculer le volume d’eau écoulé entre deux instants, et seulement lorsque la durée<br />
entre ces 2 instants est assez longue. Par contre, elle ne permet pas de calculer le<br />
volume emmagasiné à un instant donné - l’utilisation de la formule entre un temps<br />
donné et l’infini donnant toujours un volume infini - et c’est là son principal<br />
inconvénient.<br />
BIBLIOGRAPHIE<br />
C. DROGUE, 1964, Etude géologique et hydrométrique des principales résurgences de<br />
la région nord-montpelliéraine : sources du Lez, du Lirou et de Sauve. Thèse<br />
3e cycle, C.E.R.H. Montpellier. Avril 1964.<br />
H. PALOC, 1962, Contribution à la connaissance des circulations karstiques dans une<br />
région type du midi-mediterranéen. Observations sur le comportement aquifère<br />
des dolomies, Mémoires de I’A.I,H., tome V. Réunion d’Athènes, pp. 243-248.<br />
- 1964, Carte hydrogéologique de la région karstique nord-montpelliéraine à<br />
l’échelle du 1/80.000. Edition B.R.G.M., Paris. Foux de,la Vis : numéro 211.<br />
H. SCHOELLER, 1948, Le régime hydrogéologique des calcaires éocènes du synclinal<br />
du Dyr-El-Kef (Tunisie), Bull. Soc. Géol. Fu., 5e série, tome 18, pp. 167-180.<br />
- 1962, Les eaux souterraines, Edition Masson et Cie, Paris, pp. 205-214.<br />
226
RESUME<br />
STATISCICAL ASPECT OF THE PROBLEM<br />
ON THE PERMJ3ABILITY OF THE JOINTY ROCKS<br />
RATS M.V. and CHERNYASHOV, S.N.<br />
Aspects statistiques du problème de la perméabilité des roches fissurées<br />
L’étude des paramètres de perméabilité à l’eau des roches fissurées (coefficient de<br />
filtration, coefficient d’absorption spécifique de l’eau) permet d’appliquer à l’analyse<br />
de ces roches l’appareil de la statistique mathématique.<br />
Dans la présente étude, les auteurs étudient les lois qui régissent la répartition des<br />
paramètres de fissurabilité et de perméabilité de ces roches, et examinent du point de<br />
vue statistique l’hétérogénéité ou l’homogénéité de la fissurabilité et de la perméabilité.<br />
Ils proposent des critères à appliquer pour distinguer les milieux homogènes des<br />
milieux hétérogènes, et ils déterminent les limites dans lesquelles peuvent s’appliquer<br />
les différentes lois de répartition des paramètres de perméabilité : le paramètre loga-<br />
rithmo-normal, le paramètre de Maxwell et le paramètre normal.<br />
Ils donnent des exemples d’application des méthodes statistiques, à l’analyse des<br />
variations géographiques des paramètres de fissurabilité et de perméabilité, en fonction<br />
des conditions géologiques telles que le développement du karst et d’autres phénomènes<br />
physiques ou géologiques.<br />
The problem of statistical description arises in cases one studies popular processes<br />
and an investigator is interested in summary results of the process. Such description<br />
proves to be possible when the process is characterized by “Stability of frequencies” i.e.<br />
when experimented under similar conditions the trials yield in homogenous (Stable)<br />
results. As experience shows parameters of jointing and permeability to water prove to<br />
be stable within the limits of geologically similar parts. As appears from the above<br />
statistical study of distribution laws of jointing and permeability to water parameters<br />
is possible on condition of careful and tedious investigation of the geological region<br />
structure.<br />
For practical uses the solvation of jointing quantity study wil be satisfactory if one<br />
succeeds in constructing the mathematical model of fracture net, breaking the massif<br />
of rocks. This problem is to be solved with the help of statistical genetic method of<br />
jointing research (Rats 1963, Rats and Chernyashov 1965). According to this method<br />
each of the jointing parameters (fracture length, distance between the fractures, their<br />
width and orientation) is studied statistically, separately for each system of jointing<br />
developed in massif(*).<br />
Hypothesis on logarithmically normal distance distribution between neighbour<br />
fractures and lengths for fractures of different origin in rocks of different composition<br />
and age has been checked with the help of K. Pirson’s criterion x2 in Rats and Cher-<br />
nyashov’s work (i 965). Proper coincidence of data with lognormal distribution gives<br />
the opportunity to use the lognormal law for getting the most effective estimates of<br />
mean and dispersion density and fracture length for estimation of the required quantity<br />
of measurements and so on. (Aitchison and Brown 1957).<br />
These estimations in comparison with ordinary ones give the possibility to get the<br />
same precision (for given reliability) in the presence of less quantity of definitions, while<br />
difference in quantity of the required definitions increases considerably with the rise of<br />
logarithm dispersion.<br />
* Under system of jointing we mean a lot of fractures roughly parallel to each other<br />
and making a single maximum on the net of azimuthal projection.<br />
227
Two models were proposed in the USSR for transition from the jointy parameters<br />
to the permeability parameters of the jointy massif. G.I. Barenblatt and others (Barenblatt,<br />
Zheltov and Kochina, 1960) have deduced an equation of the underground water<br />
movement in the rock massif, broken by the chaotically oriented fractures. In their<br />
model they have taken into account jointy permeability and interblocked pory permeability.<br />
The single parameter L has been introduced for characteristic of all geometric<br />
peculiarities of the medium. It is not likely yet to get L estimation for the real massif<br />
by means of the experiment. Another model was introduced by E. S. Romm (Romm<br />
and Pozinenko, 1963). In this model the rock massif is presented as the medium broken<br />
by some systems of strictly oriented infinite fractures. Fracture width and the distance<br />
between them, besides orientation, has been taken into account. Permeability parameters<br />
are presented by the function of the assumed parameters and tensor magnitudes.<br />
E. S. Romm has given the analytical expression of the jointy parameter connection with<br />
the components of the permeability tensor. It is not unlikely, using his equations and<br />
jointy parameter estimation, discovered by means of statistics, to define the permeability.<br />
It is not unlikely either to accomplish the inverse task-to find jointy width estimations<br />
using permeable parameter estimations and distance between joints. Such a task has<br />
been achieved by the authors while studying Tolstomys trapp intrusion, the river of<br />
Angara. Estimations of orientation fracture parameters, average distance between<br />
fractures and permeability magnitude Kf has been obtained by means of statistical<br />
treatment. Estimation of the average fracture width and the massif porosity has been<br />
calculated on the basis of these data. The calculations have been made for some genetically<br />
separated intrusion parts of different jointing and, consequently, of different<br />
permeability. The porosity n% for the internal part of the intrusion has been defined<br />
by V.I. Koptev by means of ultrasound well logging. Estimation x 0.2% has been<br />
achieved by him which properly coincided with the result of calculations which gave<br />
for this part of the intrusion n O. 1 %.<br />
The principal quality of jointing and permeability is their spatial heterogeneity.<br />
We’ll distinguish 3 types of heterogeneity subdivision (orders of heterogeneity).<br />
Heterogeneity of the 3rd type (order)-that is the established in petrography structure<br />
heterogeneity of the rocks; form difference, grain (crystal) size difference, heterogeneity<br />
of cement and pore distribution, different character of the contracts between grains,<br />
presence of microjoints and so on. Owing to this heterogeneity two samples of mostly<br />
homogeneous rock wil possess porosity and permeability of different degree.<br />
Heterogeneity of the 2nd type (order)-is a heterogeneity of structure andcomposition<br />
of the rocks within the limits of one bench rhythm, layer, which is widely known in<br />
hydrogeology; interstratification of the rocks of different composition, presence of<br />
macrojointing, small tectonic, non-tectonic dislocation and so on. On account of this<br />
heterogeneity two test pumpings, two superchargements in the boreholes within the<br />
limits of mostly “homogenous” element of the massif wil never yield the same results.<br />
At last heterogeneity of the 1st type (order)-that is heterogeneity of the rock massif<br />
which is well known in geology: presence of different by suites composition structures<br />
texture, facies, variability, magma intrusion, different degree of lithification tectonic<br />
faults, zone of hydrothermal action, weathering relief of the above situated rocks and<br />
so on. Heterogeneity complex of the Ist type (order) is no other than geological structure<br />
of the massif. All the engineer and hydrogeological prospecting work is usually aimed<br />
at the exposure and study of the 1st type (order) heterogeneity.<br />
All the above mentioned heterogeneities have two common qualities: (i) their<br />
relative character (homogeneity or heterogeneity depends on the detailed consideration)<br />
and (2) their statistical nature.<br />
The idea of heterogeneous relativity may be illustrated by the graph of structural<br />
heterogeneity (see also Fridman, 1956)-figure 1. Size of structural heterogeneity is to<br />
be placed on the abscissa axis, line size of the zone of exploration or of the influenced<br />
228
zone, i.e. the doubled influence radius while pumping, sample size, if one studies core<br />
permeability, length of the pressure front in a dam range and so on-on the ordinate<br />
axis.<br />
Fig. 1 - Graph of structural heterogeneity of the rock massif M,N-predominant<br />
areas of different distribution laws on permeability-lognormal, Maxwell and<br />
normal (Gauss') respectively.<br />
The graph diagonal differentiates at the 1 st approximation area, representing the<br />
homogenous structure (from above) and heterogenous one (at bottom). The border in<br />
the first approximation is given conditionally according to the ratio Lg/Lc = 10. In<br />
the upper part (Lg/Lc> 10) heterogeneity is statistically levelling and becomes apparent<br />
to us as the medium quality. In other words, one can suppose some equivalent homogenous<br />
medium for the top of the graph having the same qualities as the real medium<br />
with heterogeneityk
entire fracture mapping with 1:50 scale on 40 sq.rn. was taken as an example. The area<br />
was divided at random first into 10 right-angled small parts and then into 5. While<br />
dividing the area into 10 parts, hypothesis on even distribution is rejected. Fact material<br />
doesn’t contradict with the even distribution hypothesis in decreasing the number of<br />
parts of the area twice as little.<br />
That is why it is useful to differ heterogeneities concerning their relation to the size<br />
of influence sphere in each specific task. They are as follows:<br />
(i) Heterogeneities of the highest order that represent themselves in the form of qualities<br />
of the equivalent homogenous medium and<br />
(2) Effective heterogeneities conditioning dispersion of the test results (the hatched areas<br />
on the graph). Size of these heterogeneities (upon the average) is at an order higher<br />
than the influence area size (Lg/Lcw IO). These are, for example, heterogeneities of<br />
the 2nd order (macrojointing) while test superchargement in boreholes.<br />
(3) Heterogeneities of the lowest order are those which sizes are more than (or equal to)<br />
the sizes of the influenced zone. Statistical nature of these heterogeneities is being<br />
hazed: they display themselves as macroscopic ,phenomenologic peculiarities of the<br />
structure. Such are for example, heterogeneities of the Ist order (geological structure<br />
of the massif and its elements) while carrying out test-filtration works which are<br />
considered at the end of the report.<br />
Permeability is an additive function of jointing. If one supposes jointy parameters<br />
in the first approximation as interindependent then using conclusion of the statistical<br />
physics, one can write:<br />
Y= 16 (1)<br />
where V - ratio of permeability variation.<br />
II - fracture quantity (or ways of filtration) in the researched volume.<br />
In other words, variation of permeability diminishes with growth of the filtration<br />
canal number in the researched volume. At the same time the change of the researched<br />
volume doesn’t influence the average permeability magnitude.<br />
Permeable dispersion depends, in fact, on filtration canal number in the rock volume<br />
involved in the test sphere, as B.T. Baishev (1960) proved and as appears from the facts<br />
given in Law’s work (1944), Beljaev’s work (1959) and the rest. A similar idea belongs<br />
to Lyikoshin (1958). The form of the curve of distribution is to be changed parallelly<br />
to dispersion alteration because the distribution curve of the permeability parameters<br />
is asymmetrical with the left assymmetry. Definition results of the porous permeability<br />
on the samples of the oil wells are distributed logarithmically normal, as that was first<br />
discovered by J. Law. Research of the rock permeability in the borehole by geophysical<br />
methods gave less asymetrical Maxwell’s distribution (B. T. Baishev, 1960). At last,<br />
filtration test of the alluvial deposits with large depression radius gives seria of results<br />
with normal distribution (B. T. Beljaev, 1959). Influence limits of all three distribution<br />
laws are seen on figure 1, and correspondent curves of distribution are shown on figure 2.<br />
Dependence of curve distribution form of the permeability parameters from filtration<br />
canal quantity, involved in the test sphere appears as dependence of the distribution<br />
form from the test volume. However, this connexion is indirect. W.C. Walton and<br />
J. C. Neil (1963) have got the same lognormal law of the results distribution by hydro-<br />
dynamical method while researching jointy permeability T. Law of dolomites have got<br />
the same results in the porous cores. Test volume in these cases differs at least in IO6<br />
times. Grain volume (d = O. 1 sm) differs from the block of jointy dolomite (a = 10 sm)<br />
at the same order. Consequently, in J. Law’s trials as well as in Walton and Neil’s were<br />
tested the equial quantity of filtration canals.<br />
Checking up of the coincidence empiric distribution of permeability parameters<br />
that have been got by means of Gidroproekt engineer and geological research at different<br />
230
parts of the USSR and for different rocks with theoretical lognormal distribution<br />
confirms Walton and Neil’s conclusions (table). Checking up of mutual independence<br />
of the test results has been carried out that have given the positive results, as checking<br />
up of the distribution law has the sense only for mutually independent or slightly<br />
dependent magnitudes.<br />
P<br />
4. O<br />
O. 8<br />
O, 6<br />
a4<br />
I22<br />
O i 2 3<br />
Fig. 2 - Principal distribution types of permeability:<br />
u) Lognormal;<br />
b) Maxwell;<br />
c) Normal.<br />
4 5<br />
Conclusion on coincidence of permeable parameter distribution-specific water<br />
absorption and filtration ratio KF-with theoretically lognormal distribution gives the<br />
opportunity to calculate the estimations of these parameters (Aitchison, Brown 1957).<br />
Influence analysis on jointing and permeability of the lowest order heterogeneities,<br />
especially of the geological structure of the massif is of great interest together with the<br />
mentioned above effective heterogeneities.<br />
(i) With bad thickness expansion the distance between “common” fractures as well<br />
as their width increases. Giving the qualitative analysis to these dependence D. S. Soko-<br />
lov (1962) considers that with increasing of the limestone bed thickness the massif<br />
permeability is to be increased too. Quantitative estimations for the sandstones of<br />
Ordovician flysch (Central Kazahstan) have been carried out by Rats (1963). According<br />
to the field measurements of jointing (fig. 3).<br />
Ig o = 0.41 lg nz + 0.45 (2)<br />
lg 3 LI = 0.41 Ig m -0.64 (3)<br />
where rn - bed thickness, sm;<br />
a - average distance between neighbour fractures, sm;<br />
An - average fracture width, mm<br />
For filtration cases, perpendicular bedding (along a fracture) by Romm’s formula<br />
we may get:<br />
Kf = 0.82Igm-0.19 (4)<br />
where Kf - permeability m/daily;<br />
m -bed thickness, sm<br />
23 1
4-<br />
Treatment of test-filtration work with calculation of Spirman's rank correlation has<br />
confirmed the considerable permeability increasing at the areas, complicated by rough<br />
flysch with increased bed thickness.<br />
Fig. 3 - Parameter dependence of the "common" fractures from the bed thickness of<br />
sandstones:<br />
u) Dependence of average distances between neighbour fractures (a) on layer<br />
thickness (m) ;<br />
6) Dependence of the average fracture width (u) on bed thickness.<br />
(2) It is known that near the earth surface the rock massifs are subjected to exo-<br />
genetic deformations and weathering. According to D. S. Sokolov (1962) exogenetic<br />
deformations always promote the permeability increasing and its heterogeneity. Weath-<br />
ering increases or diminishes the permeability. It depends on geological conditions.<br />
The diagrams of alteration with the depth of specific water absorption in the zone of<br />
exogenetic deformations are shown on figure 4.<br />
232<br />
-Ja- , w,<br />
*I7<br />
*/*<br />
. .
Average values q at some dozen metres depth have considerable stability. With<br />
approaching the surface they suffer specific alterations. First of all as a result of the<br />
massif discondence permeability increases. Further on, as the degree of the rock weath-<br />
ering increases, this intensification either slackens and then near the surface transits<br />
e<br />
X<br />
X<br />
%<br />
X<br />
X<br />
' kX<br />
Fig. 4 - Dependence of permeability to and its dispersion on depth of the test interval:<br />
a) In sandstones, aieurolite, argillites, of Tushamyask Carbon, ferous, period series<br />
(Middle Angara basin);<br />
b) In trapps (Middle Angara basin).<br />
233
s,<br />
b<br />
&<br />
*<br />
2<br />
b<br />
bo<br />
a<br />
C<br />
'E: .<br />
e<br />
U<br />
M<br />
-<br />
E<br />
-E.<br />
W<br />
2<br />
v><br />
vi<br />
9<br />
3<br />
W<br />
a.<br />
oi<br />
d:<br />
3<br />
a<br />
x<br />
*<br />
O<br />
O<br />
r<br />
*<br />
e<br />
*<br />
e<br />
o<br />
*<br />
-e<br />
*<br />
vi<br />
d<br />
I<br />
N<br />
r-2<br />
ò<br />
I<br />
a.<br />
2<br />
I<br />
234
abruptly into permeability lowering as a result of fracture culmatation by clay products<br />
of weathering (fig. 4a), or intensification increases as a result of weathering fracture<br />
formation (fig. 46). In the last case, as it is observed from the dispersion alternation<br />
diagram D lg a: permeability heterogeneity increases to the surface too. Similar depen-<br />
dences have been got by the authors for granites in different regions and for Ordovician<br />
red deposits of the Eastern Siberia. Similar dependences were described by E. Wigel<br />
(1962) for slates of the Rhine slate mountains.<br />
(3) The regular alterations of permeability near the Tolstomis trapp instusion<br />
contact with the enclosed rocks are shown in figure 5. They are connected with strength-<br />
ening near the contact of the trapp primary jointing and with strengthening of the<br />
joints of sedimentary rock troubled while being intrused.<br />
Fig. 5 - Dependence of permeability on distance on intrusion contact with the enclosed<br />
rocks. Below-trapps. On top-sedimentary rocks.<br />
235
The stated above statistical analysis methods of jointing and permeability of the<br />
jointy rocks may be used for permeability research of the karsted massifs and the karst<br />
formation processes. For example, statistical analysis of permeability dependence from<br />
the layer thickness gives quantitative expression to D. S. Sokolov’s conclusions on<br />
permeability of increased layer thickness and consequently the heightened intensity of<br />
the karst formation processes in them. Karst development leads to the increasing of<br />
the average magnitude and fracture width dispersion and fracture permeability. In<br />
accordance with this the statistical analysis for jointy and permeability parameters for<br />
limestones of possible different degree of karsting will make the research of the karst<br />
formation process. It stands to reason that the statistical method serves the cause of<br />
addition to the qualitative geological analysis and substitutes the latter on no account.<br />
236
EXPLOITATION D’UNE NAPPE KARSTIQUE CAPTIVE<br />
À EXUTOIRES SOUS-MAIUNS<br />
PROBLÈMES POSES ET SOLUTION ADOPTEE<br />
COTE LIBANAISE<br />
RESUME<br />
Louis MOULLARD (I), Borivoje MLJATOVIC (2), René KAREH (9<br />
et Bernard MASSAAD (4)<br />
Dans la région de Chekka, Liban-Nord, d’importantes quantités d’eau (6 m3/sec<br />
en période d’étiage et plus de 50 m3/sec en hiver) jaillissent dans la mer par plusieurs<br />
sources sous-marines situées entre 20 et 2000 m de la côte.<br />
Deux problèmes principaux se posent :<br />
a) Etude des possibilités d’invasion de l’eau de mer à partir des sources sous-marines;<br />
b) Captage de la nappe karstique sur la côté en des points où l’écoulement souterrain<br />
et les charges sont convenables.<br />
Les phénomènes sont schématisés de la façon suivante :<br />
i) Les calcaires sont recouverts de marnes sénoniennes et les sources sous-marines<br />
jaillissent soit en des points où l’épaisseur des marnes est faible, soit le long de<br />
fissures traversant ces marnes;<br />
2) Les calcaires sont compacts dans certaines zones alors qu’ils présentent dans<br />
d’autres des fissures importantes typiquement karstiques. L’existence de ces canalisations<br />
souterraines très importantes est confirmée par la rapidité de l’incidence des<br />
pluies alimentant ces calcaires sur les débits enregistrés aux différents exutoires et<br />
les niveaux piézométriques;<br />
3) Certaines sources sous-marines sont permanentes alors que d’autres (comme la<br />
plus importante Siz) se tarissent en fin de période d’étiage, ce qui provoque une<br />
entrée d’eau salée dans les canaux karstiques.<br />
Toutes ces remarques nous permettent de considérer ce système hydraulique comme<br />
un équilibre dynamique entre l’eau douce et l’eau salée dans des canaux karstiques<br />
suivant la relation :<br />
AP (H+h)pg-Hps g<br />
AP = Variation de pression;<br />
H<br />
h<br />
p<br />
pz<br />
g<br />
= Hauteur de l’eau de mer;<br />
= Hauteur de l’eau douce au-dessus du niveau de la mer;<br />
= Densité de l’eau douce;<br />
= Densité de l’eau de mer;<br />
= Accélération de la pesanteur.<br />
La conclusion de ces études préliminaires a abouti à des essais de pompage exécutés<br />
dans des forages ayant recoupé des fissures dans les marnes communiquant avec les<br />
calcaires cénomaniens. Les résultats définitifs ne pourront être fournis qu’à la suite des<br />
essais en vraie grandeur (i m3/sec) prévus.<br />
ABSTRACT<br />
Exploitation of a captive karstic nappe discharging through submarine springs-Problems<br />
arising and solution adopted (Lebanese Coast)<br />
In the Chekka region of north Lebanon, considerable amounts of water (6 ms/sec.<br />
in the low water period and over 50 m3/sec. in winter) spout up in the sea from a number<br />
of submarine springs lying between 20 and 2,000 m off-shore.<br />
(l\ Directeur du Projet des eaux souterraines.<br />
(2) Expert de5 Nations Unies.<br />
(3) Hydrogéologue du Projet.<br />
(4) Hydraulicien du Projet.<br />
237
This poses two main problems :<br />
(u) That of the possibility of sea water invasion of the aquifer via the submarine springs;<br />
(b) That of tapping the karstic nappe on the coast at points where underground flow<br />
and pressures are suitable.<br />
(I) The limestones are overlain by Senonian mark and the submarine springs arise<br />
either at points where the marl cover is thin or along fissures cutting it;<br />
(2) In some zones, the limestones are compact while in others they exhibit large and<br />
typically karstic fissures. The presence of such major underground channels is con-<br />
firmed by the rapidity with which rainfall infiltrating the limestones reacts on the<br />
discharges recorded at the various outlets and on piezometric levels ;<br />
(3) Some submarine springs are perennial: others (like the largest, S12) cease flowing<br />
at the end of the low water period, which produces an influx of salt water into the<br />
karstic channels.<br />
All the foregoing suggests that this hydraulic system is one of dynamic equilibrium<br />
between fresh and salt water in karstic channels expressed by the relation:<br />
A P = (H+ II) pg - Hps g where<br />
dP = variation of pressure;<br />
H is the height of sea water;<br />
h = height of fresh water above sea-level;<br />
p = density of fresh water;<br />
pz = density of sea water;<br />
g = gravity of acceleration.<br />
The complication of these preliminary studies was followed by pumping tests carried<br />
out on bore holes cutting through fissures in the mark communicating with the Cenomanian<br />
limestones. The final results wil only be available following the projected fullscale<br />
(I msjsec.) trials.<br />
Dans la région de Chekka (Liban-Nord), plusieurs sources sous-marines, situées<br />
entre 20 et 1500 m de la côte permettent à d’importantes quantités d’eau de se perdre à<br />
la mer. Leur débit varie de 6 111”s en période d’étiage à plus de 60 m3/s en période de<br />
crue.<br />
Le nombre total des sources connues est de 17; 7 sont permanentes, les autres, parmi<br />
lesquelles la Si2 dont le débit est de 50 m3/s, ne se manifestent qu’en hiver.<br />
Leur étude préliminaire a permis de décrire avec présicion, grâce à des plongées<br />
sous-marines, les sources visibles en été; l’inventaire des points d’eau existant sur la<br />
côte a également été effectué et a permis de décrire plusieurs forages et deux sources<br />
intermittentes artésiennes, appelées crevasses. A la suite des résultats obtenus, qui ont<br />
montré l’existence d’une nappe typiquement karstique à exutoires sous-marins, nous<br />
avons choisi la solution du captage sur la côte. Une campagne de géophysique nous<br />
permit de différencier les zones douces de celles OU les eaux souterraines subissent<br />
l’influence de la mer (fig. 1).<br />
T. DESCRISTION DES PHENOMENES<br />
Les calcaires Cenomano-Turoniens qui constituent un bassin versant d’environ<br />
350 km2 sont recouverts dans la région de Chekka par les marnes du Sénonien; les sources<br />
sousmarines jaillissent soit en des points où l’épaisseur des marnes est faible soit le<br />
long des fissures traversant ces marnes. Elles sont sensiblement alignées sur un axe sudest-nord<br />
ouest qui pourrait être l’anticlinal des calcaires dont l’amorce a été décelée par<br />
les sondages électriques effectués en bordure de la côte. ífig. 2) Les calcaires sont en<br />
général compacts (T = 9,8.10-5 ma/s dans F3) mais ils peuvent présenter des fissures<br />
importantes (T= 1.3 mr/s dans crevasse C). Nous admettrons que, au sein de ces<br />
calcaires compacts, il existe un réseau typiquement karstique bien développé mais<br />
limité et représenté par de véritables conduits souterrains. En effet, les variations de<br />
238
débit sont rapides et importantes, les fluctuations du niveau statique de très grande am-<br />
pleur et, en hiver,l es sources sous-marines fournissent une eau remarquablement douce.<br />
Même si les calcaires sont fissurés dans l’ensemble de leur masse, ces trois phéno-<br />
mènes laissent supposer que le rôle de ces fissures est négligeable comparé à celui des<br />
chenaux karstiques.<br />
Nous pouvons donc admettre que ce réseau karstique est mis en charge par les<br />
marnes du Sénonien malgré la présence des exutoires; cette mise en charge est due, en<br />
été, à la densité de l’eau de mer et, en hiver, à la section des conduits qui ne peuvent<br />
évacuer la totalité des débits d’alimentation.<br />
Les seuls exutoires naturels de la nappe sont les sources sous-marines, dont le<br />
nombre et le débit varient en fonction des pluies et les deux crevasses sur la côte qui<br />
fonctionnent comme des sources intermittentes. Le débit d’hiver remarquable de ces<br />
deux crevasses (2 m3/s) témoigne qu’elles communiquent directement avec le réseau<br />
karstique par l’intermédiaire de cheminées naturelles traversant toute l’épaisseur des<br />
marnes.<br />
Les teneurs en ions C1 des eaux prélevées dans les sources au fond de la mer varient<br />
de 16.000 mg/l en été à 46 mg/l en hiver; par contre, l’eau prélevée dans la crevasse C<br />
239
est douce (21 mg/i) durant toute l’année. Dans ces conditions, il paraît raisonnable<br />
d’admettre qu’une ou plusieurs sources sous-marines, qui ne débitent pas en été (comme<br />
la SIZ), se tarissent lorsque la charge en amont est trop faible et fonctionnent dans le<br />
sens inverse au cours de cette même période en provoquant une invasion d’eau de mer<br />
dans le réseau.<br />
Marner (SENONIEN)<br />
A-A<br />
Ech. horiz = 1 : 20 O00<br />
Sources proietees<br />
LEGENDE<br />
Fig. 2<br />
II<br />
II<br />
Crevasse C et les<br />
lorages projetés<br />
RBseau karstique<br />
Sources sous-marines<br />
CWWSSeS<br />
Des observations analogues ont d’ailleurs été faites dans d’autres karsts littoraux<br />
de la Méditerranée (Grèce, Yougoslavie).<br />
I1 est certain que la présence de l’épaisse série de marnes imperméables constitue la<br />
condition essentielle à la formation d’une nappe partiellement douce à exutoires sousmarins;<br />
en effet, l’absence de cet écran aurait immanquablement provoqué un envahissement<br />
total de l’eau de mer. Cette situation privilégiée, qui limite les possibilités de<br />
retour d’eau salée et permet l’évacuation périodique de celle-ci, n’est réalisée dans aucun<br />
autre groupe de sources sous-marines du bassin méditerranéen et laisse un bon espoir<br />
d’exploiter, en période de déficit pluviométrique, d’importants débits d’eau utilisable.<br />
Deux problbmes principaux se posent donc à nous :<br />
- la détermination des limites d’invasion de l’eau de mer à partir des sources sousmarines<br />
;<br />
- la possibilité de l’aménagement d’un captage sur la côte en des points où I’écoulement<br />
souterrain et les charges sont convenables.<br />
2. OBSERVATIONS HYDRAULIQUES<br />
Les observations des sources sous-marines ont été entreprises depuis le début de<br />
l’été 1963. Des observations régulières sur la côte ont été effectuées depuis le début 1964;<br />
ce n’est qu’au mois de février de cette même année que l’artésianisme de forages et des<br />
crevasses déjà connu des habitants de la région a été constaté et mesuré d’une manikre<br />
240<br />
SE<br />
50<br />
O<br />
50<br />
1 O0<br />
150
certaine. C’est ainsi que nous avons pu définir, sans risque d’erreur, les points d’eau<br />
correspondants à la nappe karstique des calcaires.<br />
2.1 Niveaux piézométrigues<br />
Tous les forages ayant atteint le Cénomano-Turonien subissent des fluctuations<br />
périodiques dues aux marées. Ces fluctuations sont instantanées et très bien prononcées.<br />
&té 1964 -A la fin de la période d’étiage, le niveau le plus bas a été mesuré dans le F14,<br />
forage situé à 300 m de la côte. Les niveaux piézométriques dans les forages F25 et<br />
F, se trouvant à 700 m environ de la côte, sont plus élevés durant la même période et le<br />
gradient constaté suppose d’importantes pertes de charge.<br />
Période d’observation Niveau piézométrique en m<br />
Et6<br />
F14 F25 Fe Q en ma/sec<br />
2,37 6,35 6,5 6<br />
Hiver 1964 - Au début de février 1964, les forages 9, 13, 14, 21, et 25 et les crevasses<br />
sont devenus artésiens. I1 a été impossible de mesurer la charge au sol d’une manière<br />
précise car aucun équipement étanche n’était installé. Elle a pu cependant être estimée<br />
sur les forages 13,21 et 25, ces derniers étant parfaitement isolés par des tubages jusqu’à<br />
la surface. Elle est de I’ordre de 1 m sur les forages 13 et 25 et de 11 m sur le Fz~; la<br />
distance qui sépare les forages FI3 et Fzl n’est que de 650 m. Ce gradient particulière-<br />
ment élevé est dû aux grandes vitesses de l’écoulement souterrain au cours de l’hiver,<br />
entraînant des pertes de charge considérables.<br />
Période d’observation Niveau piézométrique en m<br />
2.2 Débits et vitesses<br />
Hiver<br />
&té 1963 - Les mesures effectuées sur les sources en été (par la Parsons Co) ont indiqué<br />
un débit total de 6 m3/s; la source Sa fournirait à elle seule 2,150 m3/s. Les vitesses<br />
enregistrées aux exutoires varient entre 0,005 m/s dans la s6 et 0,455 m/s dans la S2.<br />
~ ~~ ~ ~~<br />
No des sources Zone productrice Vitesse moyenne Débit<br />
(m2) (mts) (m3/s)<br />
I 25<br />
II A- 3.75<br />
B - 4.50<br />
III 50<br />
IV 60 (5 m2 intense)<br />
(55 m2 faible)<br />
V 36<br />
VI 6<br />
~<br />
0,041 6 0,750<br />
0,26 0,975<br />
0,455 2,150<br />
0,039 0,750<br />
0,139 1,20<br />
Non mesurable 0,20<br />
0,038 0,lO<br />
Total 6,OO<br />
24 1
En appliquant la formule Vm<br />
Q,+Q, ... R,<br />
nous avons trouvé une vitesse moyenne de<br />
1,463<br />
Vml - = 0,24 m/s<br />
6,OO<br />
Hiver 1963 - Il nous a été possible d’effectuer des mesures de débit sur la Siz, qui<br />
constitue en cette période de l’année, l’exutoire sous-marin le plus important. Son débit<br />
a été estimé à 50 m3/s environ. Les crevasses fournissent un débit total de 2,O m3/s. On<br />
peut cependant estimer, par comparaison, que le débit total évacué est de l’ordre de<br />
60 m3/s.<br />
La vitesse moyenne qui correspond à ce débit remarquable serait donc dix fois plus<br />
élevée que celle du débit d’été.<br />
Vm, = Q 2 Vm, = -.0,24 m/s = 2,4 m/s<br />
QI 6<br />
II est à remarquer que cette augmentation considérable se manifeste quelques heures<br />
à peine après les premières chutes de pluies violentes en montagne.<br />
2.3 Interprétation des observations<br />
Toutes les observations faites nous permettent, au point de vue théorique, de con-<br />
sidérer ce système hydraulique comme un équilibre entre l’eau douce et l’eau salée dans<br />
un réseau typiquement karstique répondant à l’équation générale de Ghyben-Herzberg :<br />
AP = variation de pression;<br />
H, = hauteur de l’eau de mer;<br />
H = hauteur de l’eau douce au-dessus du niveau de la mer;<br />
Y = poids spécifique de l’eau douce:<br />
Ys = poids spécifique de l’eau de mer.<br />
Si AP > O, l’eau douce sort du niveau aquifère pour se perdre dans la mer;<br />
Si LIP < O, l’eau salée pénètre dans le niveau aquifère (fig. 3).<br />
Le d6bit de sortie de l’eau douce diminue en même temps que AP; donc, pour H<br />
donné, le débit de sortie sera d’autant plus faible que Us sera plus grand, toutes choses<br />
restant égaies; par ailleurs, si dP = O, il existe toujours une certaine cote d’équilibre<br />
de l’interface eau douce-eau salée donnée par.<br />
La profondeur Hs est donc fonction du niveau piézométrique d’eau douce et de la<br />
différence de densité entre l’eau douce et l’eau salée. Ainsi, à Chekka, où lts =<br />
1,040 g/cm3, et y = 1,000 g/cm3, on obtient N coefficient de Ghyben-Herzberg))<br />
?)/ys - y 25; la profondeur de l’interface sous le niveau de la mer est donc 25 fois<br />
plus grande que la charge d’eau douce en amont.<br />
La source 5’12, qui apparait comme la plus importante résurgence intermjttente,<br />
se trouve à 45 m au-dessous du niveau de la mer, c’est-à-dire 25-30 m plus bas que les<br />
6 sources d’été.<br />
242
La charge de l’eau de mer, exprimée en eau douce, aux points de sortie en mer est<br />
égale à :<br />
H=””= ‘H 1,04.45 = 46,80m<br />
Y<br />
Fig. 3<br />
----<br />
I1 faudrait que la charge d’eau douce amont, comptée audessus du niveau de la mer,<br />
soit au moins égale à :<br />
H = (ys-y)H3 = 0,04.45 = 1,80m<br />
La charge en Sia en période d’étiage est alors supérieure de 2,37 m à la charge obser-<br />
vée sur F14. I1 est alors normal que le front d’eau salée avance jusqu’au forage Fi&<br />
repoussant et contaminant l’eau douce.<br />
Le fonctionnement de la source SIZ est comparable aux phénomènes constatés sur<br />
la côte yougoslave et grecque et connus sous le nom d’e Estavele marinen :<br />
- Lorsque l’alimentation dans l’aquifère provoque une charge suffisante pour repous-<br />
ser l’eau de mer jusqu’a I’exutoire Si2 et vaincre la contre-charge créée par les 45 m<br />
de hauteur d’eau en mer, la source s’amorce et son débit augmente rapidement pour<br />
atteindre 50 m3/s<br />
environ.<br />
- Au fur et à mesure que le niveau de la nappe baisse, le débit de la source Sir diminue<br />
et I’eau de mer se mélange graduellement à l’eau douce au-dessus de la sortie de Siz.<br />
La contre-charge de l’eau de mer se trouve ainsi augmentée, réduisant encore le débit.<br />
L’eau salée envahit alors le passage à travers les marnes et pénètre dans 1’a.quifère. 11<br />
y a inversion du sens de l’écoulement, et la source SIZ se transforme en gouffre.<br />
Les fluctuations rapides des débits et des niveaux piézométriques prouvent d’une<br />
manière indiscutable que le réseau karstique n’intéresse qu’une partie de la masse calcaire.<br />
Ce réseau se réduit plutôt à uncertain nombre de conduits dont les diamètres sont<br />
insuffisants pour évacuer rapidement la totalité des débits d’hiver.<br />
243
Examinons maintenant les valeurs des débits disponibles en été et en hiver en fonc-<br />
tion des pertes de charge relevées en amont aux memes périodes.<br />
Si les pertes de charge causées par les sources elles-mêmes sont négligeables, la perte<br />
de charge hw entre deux points 1 et 2 doit se traduire en principe par la différence entre<br />
les niveaux piézométriques augmentés du terme V2/2g dû à l’écoulement dans les con-<br />
duits karstiques :<br />
Mais ii -est impossible de déterminer le terme V2/2g; nous examinerons donc les<br />
pertes de charge sur la base des niveaux piézométriques seulement.<br />
Pour le calcul des pertes de charge en été et en hiver, il faut prendre respectivement<br />
en considération les contre-charges produits par SZ et S12.<br />
La perte de charge dans l’aquifère serait :<br />
- en été, de l’ordre de 1,57 m entre le forage FI4 et SZ, compte tenu de la colonne de<br />
20 m d’eau de mer, de ys = 1,04, surmontant SZ.<br />
- en hiver, au moins égale à 13,7 m entre le forage 21 et la Si2 (en considérant que<br />
les 50 m3/s débités par Si2 remplacent l’eau salée jusqu’à l’exutoire en mer et<br />
que la contre-charge de la mer est assez réduite).<br />
En comparant ces chiffres, nous constatons que, pour des débits 10 fois supérieurs<br />
en hiver, la perte de charge est 8 fois plus forte qu’en été. Ceci est incompatible avec le<br />
régime turbulent qui existe vraisemblablement dans les conduits karstiques et l’on est<br />
amené à considérer que les cheminements à travers les marnes provoquent aux sources<br />
mêmes des pertes de charge considérables. Nous avons essayé de les calculer en tenant<br />
compte des vitesses moyennes aux points de sortie, ce qui nous donnerait une perte de<br />
charge 100 fois plus forte en hiver qu’en été.<br />
Période d’observation Débit en m3/s h en rn Forage<br />
Et6 6 2,37 F 14<br />
Hiver 60 15,5 F 21<br />
II semble que les vitesses d’écoulement dans les zones privilégiées de l’aquifère<br />
soient assez élevées. On est amené à une correction de perte de charge comprise entre<br />
O et 0,50 m en appliquant l’équation de Bernoulli.<br />
3. ETUDES CHIMIQUES<br />
Dans le courant du mois d’août 1963, pendant les mesures de débit, des prélève-<br />
ments ont été effectués en mer et sur la côte. Comme pour les niveaux piézométriques,<br />
nous avons éliminé de cette étude tous les points n’ayant pas atteint d’une manière<br />
certaine les calcaires.<br />
Eré 1963 - Les teneurs en C1 de toutes les sources sont très élevées et en empêchent<br />
l’utilisation immédiate. Par contre, sur la côte, parmi une quarantaine d’échantillons<br />
prélevés, quatre seulement intéressent la nappe karstique; un seul d’entre eux (F14)<br />
a fourni une eau salée :<br />
244
Forage F 14<br />
F9<br />
F 21<br />
F 25<br />
Source S 1<br />
s2<br />
s3<br />
s4<br />
s5<br />
S6<br />
Eau de mer<br />
C1 : 3777 mg/l<br />
43<br />
46<br />
43<br />
CI : 16.000 mg/l<br />
15.000<br />
15.000<br />
14.000<br />
15.000<br />
16.000<br />
37.000<br />
Hioer 1964 - Après les premières pluies, toutes les eaux deviennent remarquablement<br />
douces, même celles prélevées à la sortie des sources sous-marines.<br />
Forage F 14<br />
F9<br />
F 21<br />
Source S 1<br />
s2<br />
Crevasse C<br />
CI : 32 mg/l<br />
16<br />
14<br />
48<br />
26<br />
14<br />
Les prélèvements étant impossibles à exécuter par plongées à cette période de<br />
l’année, nous n’avons pu analyser que les eaux des deux sources les plus accessibles.<br />
Les résultats obtenus nous montrent toutefois qu’un changement complet se produit<br />
dans le mode d’écoulement dès que les débits atteignent une valeur suffisante.<br />
3.2 Evolution chimique des eaux<br />
Les analyses ont été représentées sur des diagrammes logarithmiques et des diagrammes<br />
en losanges; les premiers permettent de définir l’origine des eaux, les seconds<br />
leur évolution chimique en cours de cycle hydrologique.<br />
Les prélèvements effectués ne sont malheureusement pas assez nombreux et échelonnés<br />
dans le courant de l’année pour nous permettre de suivre avec précision I’évolution<br />
des eaux de l’été à l’hiver et inversement. On peut cependant remarquer que les<br />
points représentatifs des eaux d’hiver des sources et du FI4 se déplacent en été vers<br />
l’eau de mer pure; par contre ceux de Fg et F21, quoique indiquant une faible augmentation<br />
en ions C1, se déplacent vers une zone légèrement plus riche en sels mais sans<br />
augmentation sensible de Na (fig. 4).<br />
Le front de l’eau salée est donc assez large au voisinage du forage FI4 et nettement<br />
plus réduit dans la zone des forages Fe et Fzi, ce qui montre que l’interface entre l’eau<br />
douce et l’eau salée se déplace assez rapidement en fonction des fluctuations saisonnières<br />
de la nappe.<br />
Par conséquent, dans le courant de l’été et en liaison avec une diminution du débit<br />
du réseau karstique, on peut constater une invasion de l’eau de mer dans certaines<br />
régions. Par contre, les régions où se produisent les écoulements souterraines les plus<br />
importants (zones des crevasses, de FS et de FZ~), ne subissent aucune influence de la<br />
mer malgré une exploitation continue des forages Fsi et Fs.<br />
4. ESSAIS DE POMPAGE SUR LE FORAGE Fe DANS LA CREVASSE C<br />
Un essai de pompage a été exécuté le 6/3/65 sur le forage Fc se trouvant dans la<br />
crevasse C. I1 a été déjà constaté que les crevasses B et C jouent le rôle d’une cheminée<br />
d’équilibre en période de crues, lorsque les sources sous-marines ne peuvent évacuer<br />
la totalité des debits d’alimentation.<br />
245
Le niveau piézométrique dans le forage était de +8,05. Au cours des essais, on a<br />
obtenu une stabilisation instantanée du rabattement de 12,5 cm pour un débit de 104 I/s.<br />
I1 a été impossible d’effectuer une étude quantitative des coefficients d’emmaga-<br />
sinement et de transmissivité sur la base de l’évolution transitoire, car nous nous sommes<br />
trouvés en présence d’un régime permanent, normal pour un réseau karstique. Nous<br />
Fig. 4<br />
nous baserons donc simplement sur les pertes de charge et les rabattements. Pour cela<br />
nous avons réalisé plusieurs stabilisations et avons obtenu un diagramme
II faut bien noter que l’influence de la marée est instantanée dans la région. Or,<br />
après stabilisation du niveau, toutes les variations sont dues à la marée. On ne peut<br />
donc considérer qu’un temps très court de stabilisation.<br />
4.1 Équation du diagramme<br />
Nous nous placerons dans le cas général de la présence d’une perte de charge dans<br />
le forage. L’équation de la courbe caractéristique est de la forme :<br />
s = aQ2+bQ<br />
où s représente le rabattement en crn<br />
et Q les débits du pompage en i/s<br />
Nous tiendrons donc compte, pour la détermination de l’équation, des deux premières<br />
stabilisations :<br />
- Celle obtenue lors du développement : Q 104 i/s et s 12,5 cm<br />
- Celle obtenue au début de l’essai : Q 20 l/s et s 2,O cm<br />
Les autres rabattements seront déduits par calcul. Nous trouvons :<br />
a : 2,42. 10-4<br />
b == 9,51 - 10-2<br />
donc :<br />
s = 2.42 10-4 Q3+9,51 Q<br />
Le coefficient n = 2,42. lop4 est faible; les pertes de charge sont pratiquement<br />
négligeables par rapport au terme up2. Donc, pour de faibles débits, on obtient pratiquement<br />
une droite.<br />
Mais pour des débits importants, le terme aQ3 n’est plus négligeable; les pertes<br />
de charge croissent alors rapidement et nous aurions :<br />
pour Q = 250 l/s s = 39cm<br />
Q = 1000 1,’s<br />
’ s = 337 cm<br />
Les autres stabilisations seront :<br />
s = 8,75 cm<br />
s = 12 cm<br />
pour Q = 17 lis<br />
pour Q = 104 i/s<br />
En utilisant la formule approximative de calcul de T découlant de la formule de<br />
Theim où rl est le rayon du forage et re le rayon d’influence :<br />
O 104<br />
T = 1,39 = 1,3 L- = 1,13 m2/s<br />
S 0,12<br />
Cette transmissivité élevée montre bien l’existence d’une karstification bien déve-<br />
loppée.<br />
4.2 Annlyses rhimiqires<br />
Les échantillons d’eau ont été prélevés toutes les 6 heures. La salinité est restée<br />
constante pendant toute la durée de l’essai :<br />
~~~~~ ~~<br />
Ca Mg Na C1 SO4 C03H Res.sec Dh Ph<br />
~~~ ~~~<br />
mg/l 70 7 6 21 10 6 210 21 7,6<br />
m.e. 3,5 0,6 0,3 0,6 0,2 3,6 - - -<br />
247
4.3 Conclusion sur l’essai de pompage<br />
Etant donné l’accroissement des pertes de charge en fonction des débits, il est pré-<br />
férable de limiter ces derniers, donc d’augmenter le nombre de forages. Quatre forages<br />
de 250 11s donneraient un rabattement de 0,40 x 4 = 1,60 m. En considérant que l’influ-<br />
ence produite par un forage sur un autre ne peut être supérieure au rabattement d’un<br />
forage considéré seul, nous nous placerons toujours en régime laminaire. Cet essai à<br />
104 11s nous a montré d’une manière indiscutable que des débits beaucoup plus impor-<br />
tants peuvent être exploités dans la crevasse C, avec des ouvrages analogues à celui<br />
déjà exécuté.<br />
Mais il faut bien souligner qu’il est toutefois indispensable, pour reconnaître les<br />
variations de salure en période d’étiage, d’exécuter un essai de plus longue durée à<br />
plusieurs centaines de l/s. Cet essai nous fixera définitivement sur les débits qu’il est<br />
possible d’exploiter sans risque d’invasion importante de l’eau de mer dans le réseau<br />
karstique autour des crevasses B et C.<br />
5. DETERMINATION DU COEFFICIENT D’EMMAGASINEMENT<br />
Nous avions déterminé, par essai de pompage sur le forage Fc, la transmissivité T<br />
du réseau karstique dans les calcaires. 11 nous avait été impossible de calculer le coeffi-<br />
cient d’emmagasinement, car le rabattement assez faible et instantané n’a provoqué<br />
aucune influence sur le forage piézométrique F,i. C’est pourquoi nous avons appliqué<br />
l’équation générale de la théorie des fluctuations périodiques dans les nappes dues aux<br />
marées sur la nappe karstique captive à Chekka pour déterminer le coefficient d’emma-<br />
gasinement avec précision.<br />
5.1 Fluctuations périodiques daris la nappe captive à Chekka dues aux marées<br />
L’eau de mer monte et descend périodiquement suivant l’équation :<br />
2nt<br />
H = ho sin -<br />
to<br />
ho étant la demi amplitude et to la période. La nappe captive subit des fluctuations<br />
périodiques de niveau sous l’action de la marée. Ces fluctuations donnent naissance<br />
à des ondes se propageant dans la nappe :<br />
Dans le temps, en un point donné, à une distance x, la variation du niveau de la<br />
nappe est sinusoïde de période to, déphasée de<br />
et la demi-amplitude des oscillations est réduite à<br />
248
A un instant t, la surface de la nappe a l’allure d’une sinusoïde amortie, d’amortissement<br />
J-- et ia longueur d’onde est : A = 2 -<br />
TtO E<br />
La vitesse de propagation des ondes est :<br />
Nous pouvons calculer S d’après l’équation de l’amortissement des ondes :<br />
2 60-<br />
2 40-<br />
log !2 = 0,4343 x<br />
h,<br />
puisque nous connaissons les valeurs de ho, hz et fo d’après les diagrammes du lim-<br />
nigraphe et T d’après l’essai exécuté.<br />
5.2 Résultats obtenus<br />
Deux limnigraphes installes dans les deux forages Fi4 et F25 nous ont donné les<br />
valeurs des variations des niveaux d’eau. Simultanément, un limnigraphe installé dans<br />
le port de Chekka nous donnait les variations du niveau de la mer. Les répercussions<br />
de la marée se font bien sentir. II existe deux marées pour la période de 24 heures : une<br />
grande et une petite. L’amplitude maxima de la marée est de 40 cm, celle de FI4 de<br />
24 cm et celle de F25 de 10 cm (fig. 6).<br />
6.40<br />
T<br />
0.40<br />
-l-<br />
,j<br />
A-- v-<br />
Fluclualions pèriadiques dans le forage F 25<br />
Fluctuaiions périodiques dans le forage F 14<br />
A A<br />
Fluc~uaiions périodiques de la marée dans le port de Chekka<br />
A<br />
, 20/8/60 , 21 , 22 ,23/8/64<br />
Fig. 6<br />
La période de la marée est de 12 heures : to = 4,3 - IO4. Les forages FI4 et F25 sont<br />
respectivement à 500 et 900 m des sources les plus grandes.<br />
249
a) Forage FI4 Nous avions trouvé d’après l’essai de pompage effectué sur le Fc, une<br />
transmissivité : T = 1,13 m2/s<br />
40<br />
log - = 0,4343.500<br />
24<br />
40<br />
log - = 0,4343 ‘900<br />
10<br />
d’oh : S = 0,04 - 2,4 * 10-2 = 2,4%<br />
Ces valeurs se rapprochant, nous admettrons la valeur moyenne de S = 2%. A<br />
titre indicatif, la vitesse de propagation des ondes serait de l’ordre de 13 cm/s.<br />
6. SOLUTION ADOPTEE POUR L’EXPLOITATION DE LA NAPPE<br />
La solution qu’on adoptera est basée sur trois facteurs essentiels :<br />
1) Le niveau piézométrique (+6,5 cm) dans la crevasse C en fin d’étiage indique<br />
que la charge de l’eau douce en ce point compense largement celle due à l’eau de mer-<br />
2) La crevasse C étant reliée à travers les marnes à l’aquifère karstique, nous sommes<br />
persuadés que nous nous trouvons dans la zone la plus fissurée du système.<br />
3) La cote de la crevasse étant de + 18 m, la hauteur manométrique de refoulement,<br />
en exploitation, ne serait que de 13 ou 14 m, ce qui est parfaitement raisonnable du<br />
point de vue économique.<br />
Avant l’aménagement complet du système pour une exploitation définitive, 4 forages<br />
de 20” ont été exécutés dans la crevasse et arrêtés à la cote absolue -2. Ces forages<br />
ont été essayés à 100 l/s et ont donné les mêmes résultats que l’essai entrepris sur le Fc.<br />
Ces premiers résultats nous permettent d’espérer un rabattement de l’ordre de<br />
1,60 m pour un débit total de lm3/s. Ce dernier essai est prévu pour le mois de septembre<br />
1965 et son but essentiel serait de nous indiquer l’évolution possible des salures à des<br />
débits d’exploitation importants.<br />
On peut espérer qu’au cours de cet essai, la charge ne baissant pas au-dessous de<br />
+4,5 m au minimum, restera suffisante pour compenser celle de l’eau de mer.<br />
Dans le cas où les résultats de cet essai, exécuté en fin de période d’étiage, seraient<br />
concluants, cette première tranche pourrait être livrée immédiatement à la consom-<br />
mation et des travaux complémentaires sont prévus pour déterminer les débits inaxi-<br />
mums possibles.<br />
250
DEVELOPMENT OF PERMEABILITY AND STORAGE<br />
IN THE TERTIARY LIMESTONES OF<br />
THE SOUTHEASTERN STATES, U.S.A.<br />
H.E. LEGRAND and V.T. STRINGFIELD, Geologists<br />
U.S. Geological Survey<br />
Washington, D.C.<br />
This contribution has been published in the “Bulletin ofthe hternational Association, of<br />
Scientific Hydralogie (XI Année No 4 - dérembre 1966).<br />
ABSTRACT<br />
Permeability and storage characteristics in the Tertiary limestone system of south-<br />
eastern United States have developed progressively but non-uniformly as circulation<br />
of water and solution in the limestone have changed during the geologic and hydrologic<br />
history.<br />
The limestone formations, predominantly of Eocene age and subordinately of<br />
Oligocene and Miocene age, are widespread at and beneath the surface. They commonly<br />
dip gently seaward and are covered in coastal areas by Miocene to Recent clays and<br />
sands. Sinkholes and other karst features are common, but topographic relief is gene-<br />
rally not great.<br />
Circulation of water under water-table conditions when the limestone was exposed<br />
to meteoric weathering (before middle Miocene time) resulted in development of secon-<br />
dary permeability as solution channels in near-surface parts of the limestone. Marine<br />
deposition of middle and late Miocene clays and later emergence converted part of the<br />
water-table circulation system to the present great artesian system. Later, Pleistocene<br />
changes in sea level caused changes in places wheTe water discharged, which in turn<br />
caused changes in rates of circulation and,changes in rates and positions of solution of<br />
limestone. Both present and past circulation of water have contributed to changes in<br />
permeability and storage of this limestone system.<br />
This paper was published in 1966 in the Bulletin of I A S H<br />
DEVELOPPEMENT DE LA PERMÉABILITE ET DE LA<br />
CAPACITE D’EMMAGASINAGE DES CALCAIRES<br />
TERTIAIRES DANS LES ÉTATS DU<br />
SUD-EST DES ÉTATS-UNIS<br />
H.E. LEGRAND et V.T. STRINGFIELD<br />
(États-Unis)<br />
RESUME<br />
La perméabilité et la capacité d’emmagasinage qui caractérisent le système calcaire<br />
tertiaire du sud-est des Etats-Unis se sont accrues progressivement, mais non unifor-<br />
mément, à mesure que la circulation de l’eau et la dissolution des calcaires ont évolué<br />
au cours de l’histoire géologique et hydrologique.<br />
Les formations calcaires, principalement écocènes et secondairement oligocènes et<br />
miocknes, sont largement répandues en surface et en sous-soi. Elles sont généralement<br />
inclinées en pente douce vers la mer et, dans les régions côtières, elles sont recouvertes<br />
par des argiles et des sables allant du miocène à un Ige récent. On y reconnaît fréquem-<br />
ment des avens et autres caractères karstiques, mais le relief n’est généralement pas<br />
très accentué.<br />
La circulation de l’eau en régime libre lorsque le calcaire était exposé à l’altération<br />
méttoïique (avant le miocène moyen), a provoqué le développement d’une preméabilité<br />
secondaire par la formation de galeries de dissolution dans la partie supérieure des<br />
calcaires. Le dépôt d’argiles marines au milieu et à la fin du miocène et plus tard une<br />
surrection ont transformé en partie ce système de circulation en régime libre pour don-<br />
nei le grand système artésien actuel. Plus tard, au pléistocene, les variations du niveau<br />
de la mer ont déplacé les exutoires de la nappe. Ces déplacements ont à leur tour causé<br />
des changements dans l’intensité de la Circulation, le taux de dissolution et le! zones<br />
de dissolution du calcaire. Donc le cheminement passé et le cheminement habituel de<br />
l’eau ont contribué à l’évolution de la perméabilité et de la capacité d’emmagasinage<br />
de ce système calcaire.<br />
Le mémoire a été publié in entenso en 1966, dans le bulletin de l’A I H S.<br />
251
RÉSUME<br />
INFLUENCE DE LA LINEATION SUR<br />
LE COURS DES EAUX SOUTERRAINES DANS<br />
UNE ROCHE HOMOGÈNE<br />
A.P. SCHICK<br />
(Israël)<br />
L'importance de la fissura tion linéaire (par exemple, diaclases), telle qu'elle appa-<br />
raît dans le tracé d'un réseau de drainage, ne peut être évaluée que par comparaison<br />
avec I'angularité d'un système de chenaux qui se serait formé dans un ensemble litho-<br />
logique homogène, non fissuré. La valeur ( de référence >) de la déflexion aléatoire de<br />
la direction locale des chenaux par rapport à la direction générale d'écoulement dépasse<br />
300 de part et d'autre sur environ 50% d'une longueur donnée et peut dépasser 60° de<br />
part et d'autre sur 10% ou plus de la longueur du chenal.<br />
Les réseaux d'écoulement indicateurs d'une fissuration linéaire ne peuvent être<br />
observés directement que dans des cas exceptionnels. Les diagrammes de déflexion<br />
caractéristiques d'un substratum à structure linéaire sont souvent bimodaux, contraire-<br />
ment au diagramme généralement unimodal d'un milieu homogène. Les deux modes<br />
tendent à avoir un écartement de 60" à 100" (disposition en damier) et sont asymétriques<br />
par rapport à la direction principale de l'écoulement (O'). La symétrie bimodale n'ap-<br />
paraît que dans le cas des chenaux à méandres recoupés; les modes ont alors souvent<br />
un écartement supbrieur à 90".<br />
On décrit une technique d'utilisation des diagrammes de déflexion, dans le cas où<br />
les observations sur le terrain sont limitées, en vue d'évaluer le degré de lineation dans<br />
une région donnée. Cette technique est illustrée par des exemples de chenaux de tailles<br />
diverses observables dans différentes régions du monde.<br />
ABSTRACT<br />
JOINTS AND STREAM CHANNEL PATTERNS<br />
A.P. SCHICK<br />
The extent of jointing as expressed in the alignment of the drainage network can be<br />
judged only in comparison with the angularity of a channel system developed in a ho-<br />
mogeneous, non-jointed lithology. This " background" value of random deflection of<br />
local stream direction from the generai direction of the drainage exceeds 30° to either<br />
side in about 50% of a given channel length, and may exceed 60° to either side in 10%<br />
or more of channel length.<br />
Drainage patterns indicative of heated jointing can, be identified visually only in<br />
unique cases. Deflection diagrams characteristic of a jointed substratum are often<br />
bimodal, in contrast to the generally unimodal diagram of a homogeneous substratum.<br />
The two modes tend to be 60"-90" apart (checkerboard arrangement) and are assy-<br />
metric with respect to the cardinal drainage direction (O"). Bimodal symmetry is shown<br />
only by stream channels with incised meanders, with the modes often more than 90"<br />
apart.<br />
A technique is described by which drainage deflection diagrams can be used, in<br />
conjunction with limited field checking, to estimate the degree of jointing in a given<br />
region. This is illustrated by example from stream channels of various sizes in different<br />
parts of the world.<br />
252<br />
This paper was published in the Bulletin of <strong>IAHS</strong>.
2.3<br />
Hydrologies karstiques régionales<br />
Karstic Hydrology of Regions
SUMMARY<br />
THE BASIC HYDROLOGIC CHARACTERISTICS<br />
OF THE KARST RIVER LJUBLJANICA<br />
Friderik LEWICKI<br />
Hidrometeoraloiki zavod SRS, Ljubljana<br />
The river Ljubljanica, an upper course tributary of the Sava has a great part of its<br />
drainage basin on karstic terrain. The karstic features of this basin influence the hydro-<br />
logic characteristics of the river. Therefore the hydrologic characteristics of the<br />
Ljubljanica differ considerably from those of the Sava and the neighbouring Sofa<br />
which are not subject to such an extent to karstic influences.<br />
The waters forming the springs of the Ljubljanica flow through the drainage basin<br />
partly as surface water and partly as groundwater. During periods of heavy precipita-<br />
tion in flat lareas of flish regions, when water flows above around level, floods occur<br />
owing to the small infiltration capacity of the “ponors” infiltration. These floods have<br />
a beneficial effect on the springs of the Ljubljanica where water level is low in pro-<br />
portion to the large area of the drainage basin.<br />
Since the water is both retained on the karst fields and accumulated underground<br />
the previously low level of water at the Ljubljanica springs becomes fairly constant and<br />
relatively high.<br />
The special hydrologic characteristics of the Ljubljanica, caused by the karstic<br />
features of the drainage basin, influence downstream hydrologic conditions especially<br />
those of the Sava.<br />
On the Ljubljanica drainage basin a great deal of research work has been carried<br />
out from the hydrologic, geologic, speléologic as well as other points of view,nevertheless<br />
there are many problems remaining which ought to be solved in order to obtain more<br />
useful and permanent results.<br />
RÉSUM~<br />
Caractéristiques jòiidumentales de la rivière karstique Ljublianica<br />
Une grande partie du bassin hydrographique de la Ljubljanica, qui est un affluent<br />
du cours supérieur de la Sava, est constituée par des terrains karstiques. Les caractères<br />
karstiques de ce bassin influent sur les caractéristiques hydrologiques de la Ljubljanica.<br />
C’est pourquoi les caractéristiques hydrologiques de cette rivière sont très différentes<br />
de celles de la Sava et de la Soea voisine, qui ne subissent pas à un tel degré les influences<br />
karstiques.<br />
Les eaux qui alimentent les sources de la Ljubljanica traversent le bassin de drainage<br />
pour une part en surface, et pour une autre part souterrainement. Pendant les périodes<br />
de fortes précipitations sur les étendues plates de flych, lorsque l’eau coule au-dessus<br />
du sol, des inondations se produisent par suite de la faiblesse de l’infiltration dans les<br />
( ponors ». Ces crues ont un effet favorable sur les sources de la Ljubljanica, OU le<br />
niveau d’eau est bas proportionnellement à l’étendue du bassin de drainage.<br />
Comme l’eau est retenue sur les surfaces karstiques, d’une part, et qu’elle s’accumule<br />
sous terre, d’autre part, le niveau des sources de la Ljubljanica primitivement bas<br />
s’élève de façon appréciable et reste constant.<br />
Les caractéristiques hydrologiques particulières de la Ljubljanica, dues aux carac-<br />
tères karstiques de son bassin, influent sur les conditions hydrologiques en aval,<br />
notamment sur le régime de la Sava.<br />
Le bassin hydrographique de la Ljubljanica a fait l’objet de nombreux travaux<br />
de recherches des points de vue hydrologique, géologique, spéléologique etc. ; mais<br />
il reste de nombreux problèmes à résoudre pour obtenir des résultats plus utiles et<br />
durables.<br />
Ljubljanica is the river whose drainage area is located in the so-called classical<br />
karst territory. Speleology has been made its appearance there as a science, helping<br />
to investigatethe secrets below the earthsurface. In spiteof a hundred years of investiga-<br />
tions there are still many questions to solve.<br />
255
The river Ljubljanica is the right tributary of the upper part of the Sava, in the north<br />
west comer of Yugoslavia. Its drainage area includes most of the central part of<br />
Slovenia. This area borders on the watershed of the Notranjska reka to the south,<br />
on the SoCa basin to the west, on the direct region of the Sava with its tributary Sora<br />
to the north and on the watershed of the Krka and Kolpa, which belongs to the Sava<br />
hydrographic system-to the east. The border between the watersheds of the Ljubl-<br />
janica and Notranjska reka and the watershed of the SoEa is the part of the hydro-<br />
graphic border between the Adriatic and Black Sea. The border of the Ljubljanica<br />
drainage area is not precisely determined everywhere. This determination is difficult,<br />
due to the Karstic character of the drainage area of the upper part of the river Ljubl-<br />
janica.<br />
This drainage area is located in the extreme north west part of the Dinara mountain-<br />
system. This system is orographically decomposed, the highest point (Sneinik) being<br />
1,796 m above sea-level and the lowest (Ljubljanica outlet into the Sava) only 266 m<br />
Thus we have a difference of 1,530 m.<br />
We can divide the whole drainage area of the Ljubljanica into 3 parts:<br />
1. Upper drainage area with typical karstic character (the “Notranjski Karst”);<br />
2. The part of “Polhograjski dolimiti” and the tributary region on the edge of<br />
“ Ljubljansko barje” (Ljubljana-moor);<br />
3. The lowland part of the Ljubljanica, lying mostly in the moor land.<br />
The whole drainage area of the Ljubljanica is at present 1.889 km2. From this<br />
part (1) is 1.087 km2 (57,6% of he whole area), part (2) 642 km2 (23,9%) and part (3)<br />
approximately 160 km2 (8,5%).<br />
The Ljubljanica has this name only in its lower part. The hydrological characteristics<br />
are given to it from its whole watershed. The flow of the Ljubljanica is only 33 km long.<br />
Its numerous springs are collected mainly into three groups:<br />
(i) Springs of the Small and Large Ljubljanica;<br />
(2) Springs of the Lubija;<br />
(3) Springs of the Bistra.<br />
All these springs are strong and create the main flow of the Ljubljanica. Its drainage<br />
area is the karstic part of the Ljubljanica watershed.<br />
As the first and most distant spring of the Ljubljanica we can consider the spring<br />
Trebuhovica-Prezidski potok. This spring, at an altitude of 765 m, is of karstic character<br />
too. After a short length of surface flow about 500 m, this brook starts to disappear and<br />
after 1 km disappears completely.<br />
Only the tracing conducted in the May of this year by Hydrometeorological<br />
Institute proved finally the appearance of the Trebuhovica water in the springs of<br />
Veliki Obrh and Bajer in Loi-valley at an altitude of 575 m. For this underground route,<br />
about 6 km long by air, the waterflow needed 130 hours. The Veliki Obrh and Bajer<br />
join the Mali Obrh and other springs. The surface flow of the joint Obrh is very short<br />
again and starts disappearing into the swallow holes until its complete disappearance<br />
into the Golobinska Cave at an altitude of 542 m.<br />
Until recently the catchment area of the LoBki potok was added to the drainage area.<br />
This area is located to the north of Prezid, close to Travnik. The tracing experiment<br />
in 1964 showed that this region, 52,3 km2 large, belongs to the hydrographic system<br />
of the Krka and partially to that of the Kolpa.<br />
The water of Obrh is lost underground, appearing again after 2 km as Strzen,<br />
which is the strongest inlet on the Cerknica-plain. At last tracing, the flow were quite<br />
plentiful, and needed about 30 hours to travel between Golobina and StrZen springs.<br />
On the Cerknica-plain-besides Strien-many other strong flows appear, as LipsenjS-<br />
Eica, ZercvniSca, GrahovSEica and others from the east and north side of the plain.<br />
256
From the south side (Javorniki mountains) we do not notice any stronger surface inlet.<br />
During rainy periods however, this region produces large quantities of groundwater.<br />
The 36 km2 large Cerknica-plain, extending in Dinara NW-SE direction, is 9 k m<br />
long.<br />
The Strien meanders in the same direction and so does (to the north of Strien)<br />
another stream, called Vodonos. In addition, another strong tributary-Cerknilca<br />
appears at the extreme north west edge of the Cerknica-plain. The CerkniSca has<br />
about 45 km2 of watershed, and it partially disappears even before it reaches the<br />
Cerknica-plain. O n the north and north west side of the plain ali thsse waters disappear<br />
again into numerous swallow holes. The most important are Retje, ReSeta, Vodonos,<br />
Velika and Mala Karlovica, Svinjska jama and others.<br />
During heavy, continuous rain these swallow holes are not able to absorbs consume<br />
all the flow. At that time the plain changes into the lake. The plain is on average 7-8<br />
months of the year more or less flooded, and thus deserving the name of Cerknica-Lake.<br />
Experiments on the underground connection showed that the disappearing water<br />
of the Cerknica-Lake partially drains directly to the north to the springs of the Ljubl-<br />
janica at Vrhnika (to the springs of the Bistra, Lubija and Velika Ljubljanica. The other<br />
part of the water, in particular that disappearing into the underground and into<br />
swallows and Karst holes of the Velika and Mala Karlovica and Svinjska jama is<br />
connected to the springs of Rak which are at a distance of 2,3 km. The Rak flows<br />
through the short, very interesting sinking valley only for 1,7 km on the surface. After<br />
that it disappears again, and it comes on the surface once more on the Planina-plain.<br />
The Planina plain also receives the water from the south west part of the drainage<br />
area of the Ljubljanica. In the neighbourhood of the village Kneiak when it rains the<br />
water starts to collect in the otherwise dry riverbed in the upper Pivka valley. The<br />
riverbed of Pivka meanders in the northern direction up to Postojna. On the way it<br />
is joined by tributaries which, in times of drought, together form only a small discharge.<br />
At Postojna the Pivka disappears and flows through the well known Postojna Cave<br />
into Pivka Cave. After 2,4 km of unknown course, this water appears again in the<br />
overflow-siphon of PivSki rokav in the Planina Cave.<br />
In the Planina Cave this water joins the waters coming from the Cerknica Lake.<br />
This water flowing through “Rakov rokav” comes on the Pianina-plain as Unica.<br />
In the springs of the Planina plain this water possibly joins the water from the southern<br />
part of the Ljubljanica region. This is the region Javorniki, which has no surface flows.<br />
Unica has more springs, Beside inflow from the Planina Cave, to the Unica are<br />
joined the water of the springs of Maljni and Skratovka. All these springs are very<br />
strong.<br />
Unica starts disappearing after 2-3 km except at high water, when the length of<br />
flow increases. The first larger swallows for the low waters are “MilavEevi KljuEi”.<br />
The most distant swallow holes from the springs are those at Jakovica and Podstene,<br />
which are about 14 km far off.<br />
On the extreme north west edge of Planina-plain Unica there are a few smaller<br />
inconstant springs from the region of Kalce and GrEarevec. Along the underground<br />
way from the swallows on Planina-plain to the springs at Vrhnika the flow increase<br />
with the brooks Hotenka, LogalEica, Rovtarica and Petrovec, which all disappear<br />
on the flat north from Logatec.<br />
Like Cerknica-plain, the Planina-plain and Logatec-plateau are flooded many<br />
times too, however not to such an extent as Cerknica-plain. The reason is, likewise,<br />
the limited discharge capacity of the swallow-holes.<br />
The water retention on the karst plains (Loi plain, Cerknica Lake, Planina-plain)<br />
and the retardation due to the underground drainage give the Ljubljanica a special<br />
hydrological picture which is different from that one of the Sava or SoEa. The last two<br />
rivers coming from the Alps, have the character of alpine rivers.<br />
257
The watershed determination on the Karstic drainage area is impossible (or approxi-<br />
mate only). The hydrographic borders do not follow the orographic ones and in many<br />
places is absolutely impossible to draw the hydrographic borders due to bifurcations or<br />
different drainage directions at different water states.<br />
Likewise the drainage quantity determination of the Ljubljanica drainage area very<br />
difficult. On the short flow section between the last springs and first swallow holes it<br />
is sometimes almost impossible to find the characteristic profile which would collect<br />
all the water and where the regular observations and the necessary measurements would<br />
be possible.<br />
On the drainage area which is contributing its water to the springs of Ljubljanica<br />
the net of water-measuring stations is organized.<br />
CHARACTERISTIC DISCHARGES<br />
Based on observations and measurements conducted by Hydrometeorological<br />
Institute of Ljubljana for the drainage area of Ljubljanica and for the years 1962 and<br />
1963 the values of discharge on the extended network of flow-measuring stations are<br />
established. With additional data from some representative flow-measuring stations for<br />
longer period the application of these data on the longer period from 1924 to 1958<br />
(34 yrs) was possible. On the basis of these data and on the basis of established mutual<br />
underground connections between individual sections of the region, conclusions about<br />
the discharge means are possible.<br />
In unkarstic circumstances, for a certain profile where the discharges are not known,<br />
we can use more or less the low that for similar ground and climatological conditions<br />
and equal watersheds the specific discharges (in m3isec. km2) are nearly the same and<br />
that the specific discharges decrease with the extending watershed. Dealing with Karstic<br />
streams this is of no use. First of all we do not know the boundaries and the area of<br />
the watersheds and secondly, the discharges of disappearing streams and karstic springs<br />
are dependent on the permeability of the swallows, canals and siphons, the length<br />
of the underground stream, the underground inlets, splitting of the streams etc. Thus<br />
that discharge means depend on a series of conipletely inknown factors. Therefore we<br />
cannot show graphically the discharge means along the streams as we can for unkarstic<br />
streams, where the discharges as parameters of the length of the waterstream from the<br />
source to the mouth could be plotted. Similarly we cannot plot the chart showing the<br />
relation between specific discharge and the area of the watershed.<br />
MEAN FLOWS<br />
The near discharges for the period from 1924 to 1958 are shown in the following<br />
table: (See trrble next page)<br />
Estimating this data, we can get them using the following chematic chart of near<br />
annual discharges (fig. 1).<br />
The picutre of surface and underground inflows of average discharges in the karstic<br />
part of the Ljubljanica drainage area gives the underground inflow on the Cerknicaplain<br />
(in the “Strien” from Javorniki region) to be approximately 5,7 m3/sec., on the<br />
Planina-plain (in the Unica) approximately 6,7m3/sec. Thus there Rows into the springs<br />
of the Ljubljanica, Lubija and Bistra from the Cerknica-plain, CerkniSca and the<br />
region between Cerknica-plain and Vrhnika approximately 12.3 m3/sec.<br />
LOWEST FLOWS<br />
In times of drought the inflows are very low. The Loi-plain has an inflow of approximately<br />
0,2 m3/sec. only, the Cerknica-plain approximately 0,9 mS/sec., the Rak riverbed<br />
258
No. Ri ver Water-meas. Discharge<br />
ís tream) station m3/sec.<br />
1.<br />
2.<br />
3.<br />
4.<br />
5.<br />
6.<br />
7.<br />
8.<br />
9.<br />
10.<br />
11.<br />
12.<br />
13.<br />
14.<br />
15.<br />
i 6.<br />
17.<br />
18.<br />
19.<br />
20.<br />
21.<br />
Vel. Obrh<br />
M. Obrh<br />
Obrh<br />
StrZen<br />
GoriEki potok<br />
LipsenjSEica Lipsen<br />
ZerovniSca<br />
GrahovSEica<br />
Martiniski p.<br />
Cerknika<br />
Rak<br />
Pivka<br />
Unica<br />
LogaSEica<br />
Hotenka<br />
Rovtarica<br />
Petkovec<br />
Hri bSEica<br />
Ljubljanica<br />
Lubija<br />
Bistra<br />
Vrhnika<br />
KozariSEe<br />
Pudob<br />
Gor. Jezero<br />
GoriEica<br />
Lipsen<br />
Zerovnica<br />
Grahovo<br />
Martinjak<br />
Cerknica<br />
Slivice<br />
Postojna<br />
Haasberg<br />
Logatec<br />
HotedrSEica<br />
Rovte<br />
Zaplana<br />
Vrhnika<br />
Vrhnika<br />
Verd<br />
Bistra<br />
1,81<br />
1,74<br />
3,12<br />
9,20<br />
0,13<br />
1,26<br />
0,33<br />
0,05<br />
0,12<br />
1,23<br />
9,85<br />
4,98<br />
21,6<br />
0,48<br />
0,24<br />
0,30<br />
0,20<br />
0,82<br />
23,1<br />
6,30<br />
6,45<br />
is almost dry and the Pivka in Postojna has almost no discharge. The whole Unica<br />
has only 0,4 m3/sec. The lowest waters of the karstic region springs at Vrhnika have<br />
together 3,50 m3/sec. which for an area of 1.032 km3 gives the specific outflow of<br />
3.391/sec. km2. If we add the discharges from Cerknica and Planina plain and the<br />
inflows of the Logagcica, Hotenjka, Rovtarica and PetkovHek up, the sum is approxi-<br />
mately 1,5 malsec. The difference between the water from the springs and the quoted<br />
inflows, which is approximately 2,O m3/sec. is added partiaiy by underground streams<br />
of the regions where there is no surface flow and partialy by the underground reserves<br />
-the retained water. How much is added by one and how much by the other remains<br />
an open question.<br />
HIGH FLOWS<br />
During heavy rains only the part of water is drained through swallows. The rest<br />
of the water fills up the riverbeds and floods the plains. Thus the high-water discharges<br />
on the downstream-plains and the karstic spridgs of Ljubljanica decreas. The karstic<br />
plains on the Ljubljanica watershed are flooded for a number of months in the year.<br />
The Cerknica-plain is flooded the longest time. Due to the retention of the water on<br />
karstic plains and in the underground spaces, high flows in karstic springs are consid-<br />
erably decreased. In such a manner the high flow at Vrhnika for the period 1924-1958<br />
is only 159 m3/sec. This means a specific discharge of the maximum water of only<br />
154 ]/sec. km2.<br />
259
CHARACTERISTIC DISCHARGE DURATIONS<br />
Regarding duration, the karstic springs give together at Vrhnika the following<br />
characteristic discharges:<br />
Lowest discharge 3,s rna/sec.<br />
medium low discharge 7,6 m3/sec.<br />
9-monthly discharge 14,8 m3/sec.<br />
6-monthly discharge 23,4 m3/sec.<br />
3-monthly discharge 46,O m3lsec.<br />
medium high discharge 112,O malsec.<br />
highest high discharge 159,O malsec.<br />
DISPOSITION OF THE DISCHARGE DURING THE YEAR<br />
The outflow on average, regarding yearly outflow as 100%:<br />
from January to April 44,3%<br />
from May to September 19S%<br />
and from October to December 36.2%<br />
The highest flows occur in general in October and December and the lowest in<br />
August.<br />
COMPARISON WITH NEIGHBOURING STREAMS<br />
In the following a comparison of characteristic values with unkarstic, high-mountain<br />
rivers Sava and SoCa at approximately equal watersheds is given:<br />
Discharge:<br />
Karstic region<br />
of Ljubljanica<br />
Equivalent region of<br />
Sava<br />
SoCa<br />
Medium discharge 35,O m3/sec. 55,8 m3/sec. 73,5 m3/sec.<br />
Lowest discharge 3,5 m3/sec. 7,7 m3/sec. 10,5 m3/sec.<br />
Highest discharge 159,O m3/sec. 960,O m3/sec. 1424,O m3/sec.<br />
9-monthly discharge 14,8 m3/sec. 29,8 m3/sec. 32,O m3/sec.<br />
6-monthly discharge 23,4 ma/ ,. 45,l m3/sec. 50,3 m3/sec.<br />
3-monthly discharge<br />
Discharge percent<br />
48,O mYsec. 70,O m3/sec. 146,O m3/sec.<br />
from I.-IV. 4433 % 259 % 3 1 ~<br />
Discharge percent<br />
from V.-IX.<br />
Discharge percent<br />
from X.-XII.<br />
Yearly precipitations<br />
Approximate drainage<br />
19s %<br />
362 %<br />
1,690 mm<br />
44,1 %<br />
308 %<br />
2.155mm<br />
403 %<br />
28J %<br />
2.576 mm<br />
coefficient 0,58 0,80 0,87<br />
260<br />
%
Fig. 1 -Surface and underground average medium yearly discharges in m3/sec. On the<br />
inlets of Ljubljanica in the karstic region of its watershed.
The comparison of hydrological characteristics shows the drainage coefficient of<br />
Karstic region of the Ljubljanica to be extremely low. The low flows are proportionally<br />
low too and the high flows are especially low.<br />
Due to the retention of the water on karstic plains the dynamics of the drainage<br />
during the year is particularly interesting. At Ljubljanica the discharge is the lowest<br />
in summer months (from May to September). During this period the discharge of<br />
Sava and Sota is, in contrast, the highest. The drainage from the Karstic region of<br />
Ljubljanica is highest during the first months of the year and lower during the last<br />
months.<br />
The low high flows and the adverse dynamics of the drainage, having regard to<br />
the season of the year, have a very favourable influence on the downstream hydrological<br />
circumstances of the Ljubljanica and Sava. At future eventual interventions in the<br />
natural water regime these hydrological means have to be kept, and futhermore pro-<br />
fitably utilized.<br />
262
SUMMARY<br />
THE HYDROSYSTEM OF KARSTIC SPRINGS<br />
IN THE TIMAVO BASIN<br />
Franc BIDOVEC<br />
HidrometeoroloSki Zavod SRS, Ljubljana<br />
The short river Timavo, which flows into the Adriatic Sea about 20 kilometers<br />
north-west from Trieste, is fed by karstic springs. The problem, from where these<br />
springs receive the relatively abundant water quantities, has been technically studied<br />
for over 100 years. Yet “the mystery” of the Timavo has remained an unsolved problem<br />
up to the present, although its karstic region belongs to the most thoroughly explored<br />
areas. The results of the tracing of the subsurface water connection between the<br />
Notranjska Reka and the Timavo carried out in 1962 with tritium, have not been<br />
hydrologically correctly explained either, therefore the erroneous opinions about the<br />
water connections of the Timavo have not been completely done away with. Applying<br />
a thorough analysis of the hydrologic conditions and taking into account the different<br />
permeabilities of the particular regions the complicated system of the Timavo springs<br />
can principally be correctly solved. More accurate results of the water quantities that<br />
the Timavo springs get under various hydrologic situations from the basins of the<br />
Sota, Notranjska Reka, and from its own adjacent area, can be obtained only with<br />
a well organized hydrometric service and broader systematic investigations. Since the<br />
drainage basin of the Timavo lies on both sides of the Yugoslav-Italian border, the<br />
hydrologic investigations must needs be coordinated.<br />
RESUME<br />
Le système hydrographique des sources karstiques du jîeuue Timauo<br />
Le court fleuve Timavo, qui se jette dans l’Adriatique à une vingtaine de kilomètres<br />
au nord-ouest de Trieste, est alimenté par des sources karstiques. Depuis plus de 100<br />
ans, on cherche à déterminer d’où ces sources reçoivent leurs eaux relativement abon-<br />
dantes. Cependant, c< le mystère» du Timavo est resté entier jusqu’à maintenant, bien<br />
que le bassin karstique de ce fleuve fasse partie d’une région explorée à fond. Les<br />
résultats de la recherche effectuée en 1962 à l’aide du tritium pour déterminer le cours<br />
de la communication souterraine entre le Notranjska et le Timavo n’ont pas non plus<br />
été correctement interprétés du point de vue hydrologique; c’est pourquoi i1 subsiste<br />
encore des idées fausses sur les connexions du système hydrographique souterrain du<br />
Timavo. C’est surtout par une analyse approfondie des conditions hydrologiques et<br />
en tenant compte des différentes perméabilités de chaque région que le système com-<br />
plexe des sources du Timavo pourra être expliqué correctement. Des données plus<br />
précises sur les quantités d’eau que les sources du Timavo reçoivent, dans des conditions<br />
hydrologiques diverses, des bassins de la Socà, de la Notranjska Reka et des régions<br />
que lui-méme traverse, ne pourront être obtenues que par un service hydrométrique<br />
bien organisé et à la suite de recherches systématiques plus étendues. atant donné que<br />
le bassin hydrographique du Timavo s’étend de part et d’autre de la frontière italo-<br />
yougoslave, il faudra que ces recherches hydrologiques soient coordonnées.<br />
DUE TO DEFICIENT HYDROLOGICAL RESEARCH AND DISCUSSIONS THE “MYSTERY” OF THE<br />
PERSISTS<br />
TIMAVO<br />
The intensive use of water nowadays demands much better and more exact infor-<br />
mation on water resources. The collecting of reliable hydrological data to rationalize<br />
water projects and economize the use of water is, in general, a difficult task. A special<br />
problem, however, is the collecting of data on Karstic springs. In a hydrological study<br />
of Karst territory with complicated underground drainage system we are concerned<br />
with certain questions, and no real advance can be shown. The reason for this state is,<br />
263
first of all, the undeveloped hydrological science and the disorganised hydrological<br />
service. Instead of systematic and continuous research based on professional hydrological<br />
principles and conducted by a unified hydrological organization such research is<br />
carried out by several institutions independantly. The hydrological study of Karstic<br />
region in the past was limited mostly to the study of underground-water connexions.<br />
There was very little donc in the field of quantitative research. It is true that hydrological<br />
investigations in Karst areas require corresponding research on geological,<br />
morphological, chemical, and other questions, but the results of those, for the hydrological<br />
research auxiliary studies, have to be interpreted from the hydrological point of<br />
view.<br />
A good example of previous inadequate methods and results of hydrological study<br />
of Karst areas are the experiments in the Timavo basin. Although the Timavo basin<br />
was one of the most extensively studied Karstic regions we are today still facing some<br />
basic problems of its hydrographic background, and we are still lacking reliable<br />
hydrometrical data on the main springs of the Timavo. Better information on the<br />
hydrology of this region is essential to several interests, such as the water supply of<br />
Trieste or the need for exact explanations of consequences provoked by possible<br />
interventions in the river régimes of the N. Reka or the SoCa river as well, etc.<br />
In order to get better and more complete hydrological data, it is necessary to<br />
conduct continuous and systematic professional hydrological research. Above all,<br />
we have to organize in the Timavo basin a good flow-measuring service, because such<br />
data are indispensable for all future experiments.<br />
The history of hydrological research of the Timavo basin shows that people have<br />
been for a long time interested to know from where the short river Timavo, which has<br />
its outlet into the Adriatic sea about 20 kilometres north-east from Trieste, was receiving<br />
such large quantities of water. They were looking, first of all, for a connexion with the<br />
N. Reka river, which disappeared in the Skocjan Caves (fig. I).<br />
The first tracing experiments in this connexion were conducted in the 17th century,<br />
and sawdust was used as tracers. Those experiments and many others with different<br />
floating particles gave no results. Not before the beginning of this century was the<br />
connexion between the Timavo springs and the N. Reka river disclosed by tracing<br />
tests with different substances (marked eels, dyes, chemical substances, and radioactive<br />
isotopes). Most of these experiments were performed for the study of the water supply<br />
of Trieste by G. Timeus, professor of chemistry.<br />
The problems of the Timavo “mystery” and the results of quite extensive research<br />
work were published in many papers, but the final form was given in the study by<br />
Boegan “IL TIMAV0”4. The entire catchment of the Timavo should occupy, according<br />
to Boegan, 874 km2, of wich 482 km2 should belong to the N. Reka river (the<br />
upper Timavo), and 392 km2 to the underground part of the Timavo. According to<br />
Boegan, the N. Reka river is connected with all the main Timavo springs, with the<br />
Sardotsch and Moschenizze springs, with the springs at Auresina, and with several<br />
other springs along the sea coast. Only the Bagnoli springs should not be connected<br />
to the N. Reka river.<br />
When, in 1956, the question arose as to what the effect would be on the Timavo<br />
discharge of a diversion of the N. Reka river into another hydrographic system, water<br />
balance analyses for the Timavo basin and the adjoining catchment areas were made.<br />
it was established, however, that the N. Reka river with the lowest discharge<br />
Q = 160 l/sec. and an average low discharge Q = 400 ]/sec., respectively, could give<br />
but a very small contribution to the Timavo springs, which were presupposed to have<br />
a discharge of about Q = 10 m3/sec. At low stage, the Timavo springs seemed to be<br />
fed mainly by water from the SoCa river basin. Mr. d’Ambrosi, however, did not agree<br />
with this opinion, and attributed the large flow of the Timavo springs at low stage to<br />
the retention of the N. Reka river water in Karst.5<br />
264
The experiments of the last years, as well as groundwater research in the Sota-<br />
Vipava region and the tracing of the underground connexions of the N. Reka river<br />
carried out in 1962 with tritium have, to a large extent, cleared the basic hydrological<br />
problems of the Timavo. Unfortunately, the results of the tracing in 1962 were not<br />
correctly interpreted in the papers6s7 where they had been published. In the<br />
reports of both papers the contribution of the N. Reka river to theTimavospringsis<br />
Fig. 1 - Inflow of the N. Reka river into the Skocjan caves.<br />
calculated too low. In the former report an excessive contribution is attributed to<br />
the SoEa river. In the latter report, however, the contribution from the SoEa river<br />
is reduced and contributions from Citarija and the Podgrad region and from else-<br />
where are presumed instead.<br />
26 5
THE FLOW DEVIATIONS OF THE N. REKA RIVER ACCORDING TO THE RESULTS OF THE<br />
TRACING IN 1962<br />
In discussing the Timavo springs, we have to take into account that they are fed<br />
partly by water from their own immediate catchment area, and partly by waters from<br />
the basins of the N. Reka and the SoCa rivers as well. At different run-off conditions<br />
these different drainage basins may have different influences on particular springs. The<br />
conducting capacity of the underground drainage system of the Timavo is limited as<br />
regards the high flow quantities. In addition, the run-off of high flows of the N. Reka<br />
river is slowes if heavy rainfall occurs in the immediate area of the Timavo springs than<br />
it is if there are no local precipitations. Further, if at low water stage the discharge of<br />
the main Timavo springs suddenly increases as a result of high local rainfall, or if<br />
the main springs are artificially raised, the backwater produces, owing to the small<br />
water surface slope, a rise of water level in the Auresina springs and in the Trebiciano<br />
Cave. For each spring and river section studied in the Timavo basin we have to con-<br />
sider the constant changing of discharges and drainage circumstances in the hydro-<br />
graphic system.<br />
The tracing of underground connexions of the N. Reka river in 1962 was planned<br />
to be carried out at steady low water stage. Actually at 13 hour on 3 July, when 200 C<br />
of tritium and 100 kg of fluorescein were injected, the discharge of the N. Reka river<br />
at the entrance into the Skocjan Caves was only 500 ]/sec.<br />
As a matter of fact, the N. Reka river starts disappearing a few kilometres before<br />
the Skocjan Caves, approximately 400 m downstream from the water-gaging station<br />
Cerkvenik mil (fig. 2), where the river channel crosses limestone strata. Water disap-<br />
pearing in this river reach has a connexion, according to Timeus’ tracing, with the<br />
flow in the Skocjan Caves. Therefore, we have to take into account the total discharge<br />
Fig. 2 - The schematical plan of underground waterconnections of the N. Reka river<br />
with the springs of the Timavo hydro-system after the tracing experiment in<br />
July 1962.<br />
Cuves: 1. Skocjan, 2. KaEna, 3. Trebiciano, 13. Brestovica, 14. Comarie.<br />
Springs: 4. Bagnoli, 5. Osp, 6. Riiana, 7. Guardiella, 8. Aurisina, 9. Timavo,<br />
10. Sardotsch, II. Moschenizze, 12. Lisert.<br />
266
of the N. Reka river as measured at the gaging station Cerkvenik mill. In the time of<br />
injection the discharge of the N. Reka river amounted, however, to Q = 1,2 m3/sec.<br />
On the same day heavy rainfall started after the injection and the N. Reka river rose<br />
considerably. The flood wave peak attained the value of Q = 50 m3/sec. at the gaging<br />
station Cerkvenik mill. This increase of flow ought to be taken into consideration in<br />
the tracing experiment.<br />
During the tracing experiment samples were taken at 14 different points, which are<br />
shown in the plan (fig. 2) and indicated by numbers from 1 to 14.<br />
The observation point No. I (the Skocjan Caves-Hanke bridge) was situated<br />
470 m dowsntream from the point of injection and had the sole purpose verifying of<br />
the quantity of the passing tracer. As regards the computation of the quantity of the<br />
passing tracerG~~, I would like to remark in general that Karstic underground channels<br />
with their large dead spaces as well as the manner of sample taking does not satisfy<br />
the basic conditions for an exact determination of the passing tracer. even if the accuracy<br />
of the sample analyses was assumed1.<br />
The 300 m deep Katna Cave (fig. 2-5) has no flowing water. The bottom of the cave<br />
ends in a siphon where water ñuctuates. This water could only be under the influence<br />
of the backwater in the channel system of the N. Reka river. Sampling at this observation<br />
point was not possible at the time because the access into the cave was established<br />
too late.<br />
The same also occurred in the 329 m deep Trebiciano Cave, where sampling did not<br />
start in time. Only on 6 July, when the high water stage in the Trebiciano Cave was<br />
already in recession, was the first sample taken. The resulting incomplete record of tbe<br />
time-curve of concentration and the impossibility of establishing flow-rates of the<br />
flood wave, during the appearance of the tracer, did not permit determination of the<br />
quantity of the passed tracer. By means of visible trails in the Trebiciano Cave the<br />
Fig. 3 - Time-curves of cencentration in the observed springs during the 1962 tracing<br />
of the N. Reka river connections.<br />
267
highest level at the peak discharge was determined to be H # 14 m. In figure 3 the<br />
approximate hydrograph is plotted in dotted line. If a stage-discharge curve for the<br />
Trebiciano Cave were available, it could be easily demonstrated that the rates of<br />
flow in the Trebiciano Cave must have been many times larger than the values computed<br />
in the<br />
The computations with assumed discharges in the Trebiciano Cave (400.000 m3/<br />
day = 4,63 m3,kec.) too low and the supposition that the N. Reka river was contributing<br />
only 500 l/sec. were the main causes of incorrect conclusions in the reportses7. Thus<br />
were brought to life again old and new hypotheses, that the underground flow of the<br />
Timavo draws waters from the Podgrad, the Citarija and from other regions’. Such<br />
hypotheses could not appear if a sounder hydrological analysis of the region had been<br />
worked out.<br />
Fig. 4 - Discharges of the N. Reka river and of the observed springs during the 1962<br />
tracing.<br />
The abundant flow rates of the RiZana spring and the tracing test, already performed<br />
on the disappearing Odolina river by Timeus, indicate that the region of Materije<br />
belongs to the RiZana river basin. Likewise, special investigations and searching for<br />
an underground flow in the valleys of the GlinSEica and the Osp rivers could be omitted.<br />
According to the theory of Professor Marussi7, based on the study of some morpholo-<br />
gical features of terrain, which are regarded as a consequence of erosion of the “paleo”<br />
rivers, this underground flow ought to descend from the cicarija region and be con-<br />
nected with the underground flow of the Timavo river. Such an imagined flow con-<br />
nexion, however, is not possible, because at high stage in the Trebiciano Cave the<br />
268
water level rises for more than 100 m (fig. 5). Under such circumstances, in the valley<br />
of the GlinSEica river, lying low above sea-level, springs would appear and ground<br />
would be Aooded.<br />
According to the results of the tracing in 1962, it can be assumed that the N. Reka<br />
river does have connexion with the Bagnoli spring (fig. 2-observation point 4), which<br />
is at variance with the results of previous tracings. Unfortunately, the sample taking<br />
did not start in time. The concentration level of the first samples (5,s mpC), the com-<br />
parison with the time variation of tracer concentration in the Trebiciano Cave, and<br />
the form of the regression curve of concentrations show that tracing matter appeared<br />
in this observation point. It is possible, of course, that only high waters of the N. Reka<br />
river flow over to the Bagnoli spring.<br />
Fig. 5 - Schematic longitudinal profile of the N. Reka river from the place of disap-<br />
pearing to the Timavo springs Elevations above sea-level by Boegan (4).<br />
The springs of the Osp river (fig. 2-observation point 5) and of the Risana river<br />
(fig. 2-observation point 6) gave samples during the tracing in 1962 without any sign<br />
of tracer. The spring of the Osp river should be observed, nevertheless, in future tracing<br />
tests, especially in the case of high water stages in the N. Reka river.<br />
In the Guardiella spring (fig. 2-observation point 7), which is supposed to get<br />
water directly from the local catchment area5, no tracer was detected during the tracing<br />
in 1962.<br />
In the springs at Nabreiina (fig. 2-observation point 8) the tracer appeared a<br />
few days later than in the main Timavo springs, in spite of the fact that the latter ones<br />
have an air-line distance from the point of injection 7,2 kilometres longer. Therefore,<br />
the time variation of concentrations and of levels of concentrations are more extended<br />
than is the case with the main Timavo springs.<br />
In the three main Timavo springs (fig. 2-observation point 9) the concentrations<br />
appeared at the same time and passed away similarly in regular waves. The normal<br />
duration and form of the concentration waves of the main Timavo springs and of other<br />
observation points as well prove that no significant retention of waters running<br />
the regions of the N. Reka river and the underground Timavo takes place2a5.<br />
269
It is interesting to note that the samples taken from the Sardotsch spring (fig. 2-<br />
observation point lo), which feeds the water supply of Trieste, did not show any<br />
tracer. The Sardotsch spring seems, therefore, to get water from the Sora-Vipava<br />
groundwater basin and not from the N. Reka river, as considered up to the present.<br />
It can be assumed, likewise, that the springs Moschenizze (fig. 2-observation<br />
point 1 i), Lisert (fig. I-observation point 12), Comarie (fig. I-observation point 14),<br />
and Dolenca (fig. I-observation point 13) are not connected to the N. Reka river,<br />
but are fed by groundwater from the Sota-Vipava region, although very low concentra-<br />
tions in the samples were detected, showing steadily variations up to & 3 mpC as the<br />
natural background.<br />
INVESTIGATIONS OF THE SOEA-VIPAVA GROUNDWATER AND ITS DRAINAGE TOWARDS THE<br />
SPRINGS<br />
SIMAVO<br />
While the N. Reka river disappears visibly through the mighty Skocjan Caves<br />
into the Karst underground, the disappearance of the Sota and Vipava rivers is not<br />
visible. The study of the percolation of groundwater into the Karst is therefore a more<br />
difficult problem, because the places of disappearing are hidden.<br />
The SoEa river begins losing water, that percolates into the groundwater system,<br />
immediately after Gorica, whilst the Vipava river shows water losses from Dornberk<br />
downwards. The Sota-Vipava groundwater is also recharged by precipitation on its<br />
own catchment area. Only by special investigations could it be determined whether<br />
this groundwater system is also recharged by the headwater of the Sota river and/or<br />
by the deep Karst streams of the plateau BanjStica and Trnovski Gozd territory.<br />
The direction of flow of the groundwater and the.altitude above sea-level of its water-<br />
table at low stage in the Miren region is proof of the diversion of the Sota-Vipava<br />
groundwater into the Tirnavo springs.<br />
Fig. 6 - General plan of the Sota-Vipava groundwater with approximate water-<br />
table contours at low water stage.<br />
270<br />
$
In future more detailed research must be established in which places does groundwater<br />
percolate into the Karst, what is the percolating amount, and with which springs<br />
of the Timavo region particular underground streams communicate. With this intention<br />
some investigations have been made already. The Geological Institute in Ljubljana,<br />
for example, employed in 1962 a geo-electric method in order to establish directions of<br />
groundwater flow in Karst. For this purpose two profiles stituated about i km south<br />
of Miren, along the contour line of 100 m were investigated (fig. 6, profile 1-1 and profile<br />
11-11) and by the method of apparent specific resistivity zones of low and high resistivity<br />
were delermined. Resistivity in the profile 11-11 was on the whole very low. In the<br />
profile 1-1, at the point of the lowest specific resistivity, indicating supposedly a possible<br />
water flow, an 80 m deep hole was drilled by the Geological Institute (fig. 6-point<br />
M i). In this borehole, penetrating fractured and porous limestone, no water was found<br />
at the time of drilling; on the contrary, between the depths from 63,9 to 80 m, drilling<br />
water was disappearing. In the borehole M 1 water appears in periods of rainfall and<br />
rises very high, but at low-water stage it disappears through the bottom of the borehole,<br />
which lies 16,25 m above sea-level. Regrettably, the borehole is not deep enough to<br />
permit determination of the lowest level of the Karstic subsurface water at this point.<br />
In the borehole M 2, made by the Geological Institute on the left bank of the<br />
Vipava river (fig. 6-7, point M 2), water appeared in the depth of i7 m, that is on the<br />
boundary between the Quaternary deposits and the limestone strata. In the 50 m deep<br />
borehole M 2, which had been chosen as a point of injection for the intended tracing<br />
test, the Bundesversuchs und Forschungsanstalt Arsenal, Wien, tried to establish<br />
flow direction and velocity of the groundwater by the method of dilution of the injected<br />
tracing substance, but no satisfactory results were obtained. These experiments would<br />
have had more success if they had been directed by hydrological criteria and if the<br />
already available hydrological informations on this region had been consulted.<br />
The groundwater of the Sota-Vipava region does not flow into the Karst frontally<br />
through one or more trenches following the direction and remaining on the level,<br />
which is characteristic for this groundwater as long as it is mowing through the deep<br />
-<br />
M ü km<br />
Fig. 7 - Schematic longitudinal profile of the subsurface flow of the Sora-Vipava<br />
groundwater from the Miren region to the Thavo springs.<br />
l<br />
27 1
waterbearing gravel layer. On the contrary, the groundwater is percolating into the<br />
fractured and porous limestone in many places, at different altitudes, and in different<br />
geological and hydrological situations of its large swallowing zone. That explains why<br />
the water table in such a zone cannot be shown by a contour map.<br />
in the swallowing zone of Miren, south of the Vipava river, along the reach from<br />
the village Vrtote to the State border, there are numerous wells for local water supply.<br />
(fig. 6) The fluctuation of the water level in these wells (fig. 8), their specific yield and the<br />
chemical properties of water indicate a variety of origins of the groundwater in this<br />
region. Some of the wells are recharged from the Karst only, that is from the opposite<br />
southern direction (fig. 6 and 8, wells X, N, VI), in others, however, groundwater<br />
of the Sota-Vipava region prevails. In some of these latter wells, dependent on the<br />
actual hydrological situation, water is mixed more or less with water flowing from the<br />
Karst. In view of the large and fast water level oscillations in the wells X and P as in<br />
the borehole M 1 as well, one can conclude that this water has weak outflow and<br />
insufficient connexion with the main drainage arteries. In spite of the low permeability<br />
of the terrain, the well P and especially the borehole M 1 (fig. 6) may have connexions<br />
with deep-lying drainage arteries, which is inferred from the lowest water stages attained<br />
here.<br />
'i<br />
30-<br />
m<br />
'O 1<br />
s i i 5'<br />
n X il, N VI N II Mz P<br />
Fig. 8 -Water levels and hardness of the ground water in the wells of Miren-region<br />
south of the Vipava river.<br />
In the water flowing only from the Karst (the well N) the hardness rises when the<br />
water stage is receeding; in the wells recharged mainly from the groundwater of the<br />
Sota-Vipava basin, however, the hardness is falling when the inflow from the Karst is<br />
diminishing (fig. 6 and 8). Analyses of chemical and other properties of water can be<br />
very helpful if they are conducted in connexion with other hydrological research.<br />
Even the most recent interesting research of the Timavo origins by Professor<br />
Tongiorgio in Pisa, who is analysing and characterizing samples of water taken in<br />
different places of the Timavo hydrographic system, by the structure of the atomic<br />
nucleus of oxygen cannot give quantitative results by itself and requires a parallel<br />
basic hydrological research.<br />
As was shown for the SoEa-Vipava groundwater, the origin and the properties<br />
of water are changing very fast. Taking samples for water quality analyses demands,<br />
therefore, that not only the profile but also the point of sampling be examined critically.<br />
For the determination of flow quantities an adequate flow measuring service should<br />
be organized first and charged with the task to establish the amounts of water seeping<br />
272
from the rivers Sora and Vipava and percolating as groundwater into the Karst, as<br />
well as the amounts of water discharged by springs in the Timavo region, the origin<br />
of which is still uncertaina. The lowest discharge of the main Timavo springs was<br />
estimated in papers published to the present to be 10 m3/sec4. In view of this lowest<br />
discharge the contribution of the SoEa river would be proportionally large3. In accor-<br />
dance with later estimates that the main Timavo springs discharged only one half Of<br />
that quantity, 5 m3/sec., approximately, at low stage attained in October 1962, the<br />
contribution from the Sota basin would be proportionally smaller. For the Moschenizze<br />
springs, which discharge relatively large amounts at low stage, and could therefore be<br />
taken into consideration for the solving of water supply problems, there are no usable<br />
data on characteristic flow quantities at our disposai.<br />
On the other hand, the water losses of the Sota and Vipava rivers must be deter-<br />
mined by simultaneous flow measurements. These losses, being dependent on the piezo-<br />
metric level of the watertable, can be different even at the same river stage. Simui-<br />
taneous flow measurements on the Vipava river show losses up to 1.0 m3/sec. (fig. 9).<br />
Fig. 9 - Lines showing discharge distribution along the Vipava river ad established<br />
by simultaneous flow measurements.<br />
Analysing the results of simultaneous Row measurements we have to be careful<br />
and take into account the accuracy of such measurements, the variations of the water<br />
stages and of the water surface slope, etc. The results of more detailed and co-ordinated<br />
hydrological investigations of the Soca-Vipava groundwater system (water table<br />
elevations, direction and velocity of flow, discharge) covering the entire pertinent<br />
Yugoslav-Italian territory, wil by themselves solve the question of the groundwater<br />
percolation into the Karst. These results will also be necessary for future tracings of<br />
the underground flow connexions.<br />
From previous research of the groundwater it can be deduced that the main amounts<br />
of water lost by the SoEa river on Italian territory percolate into the Karst. Large<br />
outflow apparently occurs at the well 31 (fig. 6) and in some places downstream from<br />
the Vipava river mouth. The circumstance, that the groundwater flowing from che Karst<br />
has in some places along the left bank of the SoCa river its water table at a higher level<br />
than the level of the SoEa river stage does not exclude the possibility of groundwater<br />
273
percolation into the Karst either at another depth or in another place nearby under<br />
specific local outflow conditions.<br />
On Yugoslav territories, the we11 I1 (fig. 6) and the adjoining wells reveal best the<br />
Character of the Soca-Vipava groundwater. They have large yields, and it would be<br />
advisable therefore to seek here a location for boreholes that would serve as injecting<br />
points for possible tracing of underground connexions. Injecting the tracer directly<br />
into the Vipava or SoCa rivers would cause loss of great quantities of the tracing<br />
substance, but it would not establish through which swallow holes the tracer comes into<br />
the Timavo springs.<br />
The hydrological research of the complicaled hydrosystem of the Timavo springs<br />
wil be more ~uccessîul if we get a clear insight into all hydrological problems of the<br />
Timavo basin which were in this report but briefly stated, due to limited space, and if<br />
we start with extensive and systematic research co-ordinated perfectly on both sides<br />
of the Yugoslav-Italian border.<br />
REFERENCES<br />
I. B~DOVEC F., The investigation of the karst underground watersystems and hydrology.<br />
The report, 4th interizationtrl Congres of Speleooiogy iir Yugoslacia. Ljubljana<br />
1965.<br />
2. BIDOVEC F., II servizio idrologico deve esaminare e dimestrare il collegamento dell’<br />
Isonzo con il Timavo. Tecnica Ituliuiia, N. 9. 1961. Trieste.<br />
3. BIDOVEC F., Il contributo della Notranjska Reka alle quantità d’acqua delle<br />
sorgenti carsiclie del Timavo. Tecnica ftnlirrnn, N. 9. 1960. Trieste.<br />
4. BOEGAN E., II Timavo. Trieste. 1938.<br />
5. D’AMBROSI C., Sul problem0 dell’ alimentazione idrica delle fonti del Timavo<br />
presso Trieste. Tecnica ífnliuria, N. 8. 1960. Trieste.<br />
6. ERIKSON E., F. MOSETTI, K. HODOSCEK and L. OSTANEK, Some new results on thc<br />
carstic hydrology with the employ of tritiated water as tracer. Bolletlino di GeoJisica<br />
Teorica ed Applicafu, N. 17. 1963. Udine.<br />
7. MOSETTI F. and collaborators : Un nuovo contributo alla conoscenza dell’ idrologia<br />
sotterranea del Timavo. Tecnica Italiaitu, N. 4 1963. Trieste.<br />
274
RESUME<br />
HYDROLOGIE EN ZONE KARSTIQUE AU MAROC<br />
SEBOU-BETH<br />
R. HAZAN<br />
Chef du Service des Ressources en eau<br />
et<br />
Dj . LAZAREVITCH<br />
Dipl. Ingénieur hydrologue k l’ON1<br />
La présente étude tente de dégager les caractéristiques hydrologiques essentielles<br />
d’un bassin en zone fissurée, karstique.<br />
Pour une meilleure interprétation, une comparaison est faite entre des régimes<br />
hydrologiques semblables intéressant les bassins de nature géologique différente : kars-<br />
tique et impermeable (primaire ou secondaire).<br />
Les modes d’écoulement seront donc comparés, ainsi que leurs caractéristiques<br />
essentielles : débit, ruissellement, crues, étiages, débits solides etc.. . La répercussion<br />
de ces phénomènes sur l’exploitation de ces ressources en eau sera dégagée succinte-<br />
ment en connaissance de cause : laminage par des barrages, envasements, énergie élec-<br />
trique etc.. .<br />
SUMMARY<br />
Surface water Iijdrolugy of karstic zone of Seboit-Beth<br />
This paper seeks to exhibit the essential hydrological characteristics of a drainage<br />
basin in a karstic fissured zone.<br />
For clearer exposition comparisons are drawn between similar hydrological regimes<br />
in the geologicully unlike - karstic and impermeable (primary or secondary) types of<br />
basin.<br />
Accordingly the runnoff patterns in the two instances and their essential characteris-<br />
tics - discharge, runoff over the surface, flouds, low-water periods, solid discharges,<br />
etc. wil be compared after which the inferences of these phenomena for the exp!oi-<br />
tation of these water resources will be drawn succinctly and advisedly- ‘‘ reduction<br />
in peak discharge” “laminage” by dams, silting, electric power, etc.<br />
L’hydrologie d’un cours d’eau est fonction de très nombreux paramètres. L’étude<br />
analogique entre deux ou plusieurs cours d’eau, impose l’existence d’un certain nombre<br />
de paramètres communs ou semblables, de telle sorte que l’étude ne porte que sur les<br />
seuls paramètres qui diffèrent.<br />
L’hydrologie en zone karstique ne peut à elle seule, dégager
LE BASSIN DU HAUT BETH<br />
A l’amont d’El Kansera est entièrement établi sur les formations imperméables du<br />
Primaire et du Permo Trias du Massif Central marocain : les basaltes quaternaires sur<br />
lesquels coule l’oued Beth naissant sont de trop faible importance pour être pris en<br />
considération.<br />
Dans le vaste ensemble pal6ozoïque, d’âge ordovicien, gothlandien et carbonifère<br />
les schistes, admettant parfois des intercalations de quartzites et de calcaires, forment<br />
l’essentiel des formations.<br />
Plus au Nord, mais à l’amont d’El Kansera apparaissent les argiles rouges salifères<br />
du permo trias auxquels sont associés quelques basaltes d’extension limit&<br />
LE HAUT SEBOU<br />
Issu du vaste château d’eau du Maroc qu’est le Moyen Atlas s’écoule dans des for-<br />
mations sédimentaires a prédominance calcaire du Lias. Le faciès dolomitique domine<br />
dans le niveau de base du Lias et le faciès calcaire est prépondérant dans le Lias moyen.<br />
Cette unité a été l’objet de failles et accidents tectoniques répétés au cours des temps<br />
géologiques qui, en plus desa nature calcaire, la prédestinaient aux actions de l’érosion,<br />
particulièrement aux eaux météoriques chargées de gaz carbonique. I1 en est résulté une<br />
série de circulations par les puits ou diaclasses pouvant aller jusqu’a la création de véri-<br />
tables chenaux et cavernes. L’épaisseur de ces formations calcaires peut atteindre 300 m.<br />
Les eaux ainsi filtrées réapparaissent sous forme de sources ou alimentent latéralement<br />
des nappes phréatiques ou artésiennes ou des sous-écoulements d’oued.<br />
II. CARACTERISTIQUES GENERALES<br />
Leurs caractéristiques hydrologiques générales permettent une comparaison rapide<br />
entre les deux cours d’eau.<br />
Le Sebou à Aïn Le Beth à<br />
Timedrine El Kansera<br />
Superficie du bassin<br />
versant en km2 4.387 4.542<br />
Pluviométrie moyenne en mm 616 700<br />
Débit moyen fictif continu<br />
en m3/s 2130 11,40<br />
DBbit spécifique moyen<br />
en l/s/km2 4,97 2,51<br />
Coefficient d’écoulement 26 % 12%<br />
Débit maximum millénaire<br />
en m3/s 1.950 3.100<br />
Débit maximum spécifique<br />
en m3/s/km2 0,438 0,682<br />
Longueur du cours<br />
d’eau en km 125 189<br />
Pente en 1/1.000 12,6 995<br />
Débit minimum m3/s 427 0.60<br />
276
Le choix entre les sections de comparaison sur les deux cours s’est fait :<br />
- sur le Sebou : à la station d’Ah Timedrine;<br />
- sur le Beth : au site d’El Kamera.<br />
Pour ces deux emplacements, les superficies des bassins versants sont pratiquement<br />
identiques. La pluviométrie moyenne annuelle est pratiquement semblable. Elle est<br />
respectivement de 616 et 700 mm donc légèrement plus abondante sur le Beth que sur<br />
le Sebou.<br />
O JO<br />
Fig. 1<br />
IS0<br />
277
Ces remarques permettent de classer les deux bassins dans un certain nombre de<br />
conditions comparables : contiguïté, superficie des bassins versants, et pluviométrie<br />
équivalentes.<br />
Malheureusement, les différents autres paramètres, indépendamment de la géologie,<br />
qui interviennent dans les écoulements sont peu semblables.<br />
Ainsi :<br />
Les longueurs des cours d’eau sont 1<br />
- 125 km pour le Sebou à la station étudiée;<br />
- i89 km pour le Beth à la station étudiée.<br />
La superficie étant égale, il semble que le bassin du Beth soit en moyenne plus étroit<br />
que celui du Sebou.<br />
Les pentes<br />
La pente moyenne du Sebou de sa source à Aïn Timedrine est de 13,6 pour mille.<br />
Celle du Beth jusqu’à El Kansera est de 93 pour mille.<br />
Le schéma 1 montre la relation (altitude-longueur) de chacun des cours d’eau.<br />
La dénivellée du Sebou à Ain Timedrine est de 7.200 - 625 = 1.575 m<br />
Celle du Beth à EI Kansera est de . . . . . . 1.940 - 140 = 1.800 m<br />
I1 faut toutefois remarquer que sur leurs premiers quarante kilomètres, la pente<br />
du Beth est supérieure à celle du Sebou; par la suite celle-ci devient supérieure.<br />
COEFFICIENT D%COULEMENT MOYEN<br />
De 26% pour le Sebou il n’est plus que de 12% pour le Beth.<br />
Cette différence peut provenir du fait que la pente générale du Sebou est supérieure<br />
à celle du Beth; d’autre part les 3/4 du cours supérieur du Sebou est à une altitude<br />
supérieure à 1.000 m. Alors que seulement le 1/4 du cours supérieur du Beth est à une<br />
altitude supérieure à 1 .O00 m. Aussi pour ces deux raisons le Beth est plus soumis aux<br />
effets d’évaporation et évapotranspiration que le Sebou. D’autre part et c’est là le<br />
caructère fondamental, les roches karstiques constituant le haut bassin du Sebou permettent<br />
une infiltration très importante, infiltration qui est alors non soumise aux efets<br />
thermiques, et est restituée en sources dans le lit du Sebou de façon plus ou moins retardée.<br />
Les roches karstiques jouent par leur qualité de perméables en grand, le rôle de réservoir<br />
économisant ainsi de grandes quantités d’euu, qui seraient sans cette qualité, perdues<br />
par évapotrunspirntion.<br />
Le gain est ici de :<br />
21,8 - 11,4 = 10,4 m3/s pour le Sebou.<br />
soit un peu moins de 90%, ce qui est considérable.<br />
Nous allons maintenant comparer pour les deux cours d’eau un certain nombre<br />
de caractéristiques hydrologiques.<br />
III. COMPARAISON ENTRE LES DEBITS MOYENS ANNUELS<br />
ET LES PLUVIOMGTRIES ANNUELLES<br />
Le graphique 2 compare pour les deux cours d’eau et pour 30 ans de mesure, les<br />
rapports :<br />
K = Pa/Pn (Pa pluviométrie annuelle)<br />
(Pn pluviométrie moyenne sur 30 ans)<br />
K = Qa/Qn (Qu débit moyen annuel)<br />
(Qrt débit moyen sur 30 ans).<br />
278
279<br />
.- J<br />
a<br />
CI
On remarque que :<br />
a) En années exceptionnelles :<br />
Le débit moyen annuel atteint un rapport de K = 2,s pour le Beth et K = 1,9 pour<br />
le Sebou.<br />
C’est-à-dire que le débit du Beth est 2,s fois celui de son année moyenne; tandis que<br />
celui du Sebou est 1,9 fois son débit moyen interannuel.<br />
I1 y a donc une régulariiéplus grande sur le Sebou en zone karstique, que sur le Beth.<br />
b) Ea amées très pauures : l’inverse se produit.<br />
Le rapport K pour le Beth est de 0,4; tandis que pour le Sebou en moyenne K est<br />
de 0,7; là encore, apparaît, en période sèche, la régularité du Sebou par rapport à celle<br />
du Beth.<br />
Ainsi donc i’ ffydroiogie en zone kaïs:iquc cs? mr?rp&, fo!Jf~s choses égales par<br />
ailleurs, par une remarquable régularité des débits moyens annuels, par rapport à ceux<br />
en ione non karstique.<br />
Cette remarquable régularité annuelle est également complétée par une re‘gulurisation<br />
pluriannuelle.<br />
Ainsi durant la période 46 à 48 très sèche, la pluviométrie sur le Beth est supérieure<br />
à celle tombée sur le Sebou. I1 n’en demeure pas moins que les débits moyens annuels<br />
en cette période sur le Sebou sont toujours supérieurs à ceux du Beth.<br />
DEBITS MOYENS ANNUELS<br />
Le graphique 3 donne les débits moyens annuels comparés,<br />
soit 21,8 m3/s pour le Sebou et i 1,4 m3/s pour le Beth.<br />
Les courbes sont assez homothé?iques. On voit clairement que les débits minimums<br />
sont supérieurs à :<br />
15 m3/s pour le Sebou<br />
5 m3/s pour le Beth.<br />
Le Sebou a donc indépendamment de sa régularisation naturelle annuelle et pluriannuelle<br />
un
28 1<br />
I !<br />
I
K.<br />
fi<br />
282<br />
Fig. 4
E<br />
o<br />
$<br />
m<br />
w<br />
n -<br />
u)<br />
I- -<br />
u1<br />
æ<br />
W<br />
><br />
O<br />
æ<br />
W<br />
a<br />
rn<br />
-I<br />
W<br />
3<br />
rn<br />
z<br />
W<br />
a<br />
a<br />
5<br />
I-<br />
æ<br />
a<br />
o<br />
c<br />
œ<br />
W<br />
O -<br />
o<br />
- Lu<br />
I<br />
U<br />
w<br />
VI<br />
W<br />
5<br />
-! I L
Pour une fréquence inférieure à 70% K Sebou est supérieur à K Beth. Pour les<br />
années extrêmement sèches, il y a relativement plus de débit sur le Sebou que sur le<br />
Beth; nous nous en expliquerons plus loin.<br />
IV. DEBITS MOYENS MENSUELS<br />
La courbe no 3 établit la comparaison des débits moyens mensuels sur 30 ans entre<br />
les deux cours d’eau.<br />
Les courbes sont homothétiques avec décalage des axes<br />
Le maximum a lieu en février pour le Beth et en avril pour le Sebou; soit un retard<br />
de deux mois pour l’écoulement en zone karstique. L’effet G tampon D est ainsi bien<br />
marqué; la nature karstique du terrain en est le principal artisan.<br />
D’autre part si au cours des mois de septembre à janvier la différence entre les<br />
débits moyens mensuels est d’environ 4 m3/s en faveur du Sebou, par la suite la diffé-<br />
rence est de 24 m3/s pour le même Sebou.<br />
Le décalage des axes des courbes est dû aux effets de l’écoulement ((retardé)) et<br />
soutenu pour le Sebou principalement dû au caractère karstique de son bassin versant.<br />
Débits moyens mensuels des saisons sèches<br />
Le graphique 5 compare les débits mensuels durant les périodes sèches de l’année<br />
(juillet, août, septembre).<br />
Ces écoulements sont des écoulements d’étiage; ils caractérisent la pérennité hydraulique<br />
de chacun des bassins.<br />
La courbe concernant le Sebou est largement au-dessus de celle du Beth. Si celui-ci<br />
enregistre des débits moyens mensuels inférieurs à 1 m3/s par contre le Sebou enregistre<br />
des débits supérieurs à 5 m3/s.<br />
La moyenne peut être de 8 m3/s Sebou et de 2 m3/s seulement pour le Beth.<br />
Les effets ( retard ) et ( tampon n exercés pour le bassin karstique sont mis en évidence<br />
au cours de I’annk 1935; où, sur le Beth, une pluviométrie partielle augmente<br />
le débit d’étiage de juillet à septembre alors qu’elle est sans action immédiate sur les<br />
débits du Sebou. Le même phénomène se reproduit en 1948. Cela provient sans doute de<br />
l’état étiré du bassin du Beth, et surtout de son bassin versant imperméable.<br />
Donc le bassin karstique est caractérisé en période sèche par un étiage soutenu er<br />
relativement abondant, acec un retard de i‘action directe des pluies sur l’écoulement super-<br />
ficiel en grand.<br />
V. DEBITS MOYENS JOURNALIERS MINIMUM (graphique 6)<br />
Le débit journalier minimum est de 4,27 m3/s pour le Sebou.<br />
Le débit journalier minimum est de 0,59 m/3s pour le Beth.<br />
Le débit minimum minimorum est de 2,20 m3/s pour le Sebou.<br />
Le débit minimum minimorum est de 0,004 m3/s pour le Beth.<br />
Malgré une pluviométrie moyenne inférieure pour le Sebou, celui-ci garde pour les<br />
caractéristiques minimum des valeurs supérieures à celles du Beth. Le rôle de réseruoir<br />
souterrain constitué par les calcaires karstiques du bassin du Sebou est assez manifeste<br />
à ce sujet.<br />
284
VI. DEBITS SPECIFIQUES<br />
1. Relation entre les débits spicifigues moyens annuels et les superficies des bassins uer-<br />
sants (fig. 7)<br />
Ces courbes montrent que pour de mémes superficies de bassin versant, le débit<br />
spécifique par 1/s par km2 est nettement supérieur en ce qui concerne le Sebou que le<br />
Beth.<br />
DEB1 TS MOYEN S JOUR NA LIERS M 1 N IMUM<br />
__ _____<br />
Fig. 6<br />
2. Relations entre les débits spérifiques maxima instantanés et la superficie des bassins<br />
versants<br />
On a déjà vu que les débits de pointe sont supérieurs sur le Beth que sur le<br />
Sebou à Ain Timedrine. Ainsi le débit millénaire de 3.100 m3/s pour le Beth, passe a<br />
1.950 m3/s sur le Sebou. Les pointes sont donc plm accusées en terrain imperméable qu’en<br />
terrain karstique; celui-ci joue un rôle important de G laminage des crues >> dans les<br />
phénomènes hydrologiques. Ce rôle d’écrétement des crues est assez significatif et bien<br />
marqué.<br />
Le graphique 8 montre les corrélations existantes pour les deux cours d’eau, entre<br />
les débits spécifiques maxima ou instantanés et la superficie des versants intéressés.<br />
Dans ce cas la courbe de corrélation concernant le Beth est toujours au-dessus de<br />
celle du Sebou.<br />
285
286<br />
Fig. 7<br />
IOW0<br />
CORRELATION ENTRE LES OEBITS SPE~~FIOUES MAXIMUM AS TAN TAN ES<br />
ET LA SUPERFICIE DU BASSIN VERSANT<br />
O<br />
Fig. 8
Ces courbes traduisent bien les phénomènes de laminage et d’écrêtement des crues<br />
caractéristiques des terrains karstiques.<br />
3. Hydrogramme de crue<br />
Le graphique 9 représente les hydrogrammes de crue pour une même période sur<br />
les deux cours d’eau.<br />
I------<br />
PO<br />
JO<br />
O<br />
1<br />
IO4nn<br />
HYDROGRAMMES DES CRUES I<br />
287
On peut remarquer, la disproportion qui existe entre les différents débits de pointe,<br />
même dans le cas d’une pluviométrie sur le Sebou légèrement supérieure. L’écrêtement<br />
et le laminage de crue est manifeste pour le Sebou.<br />
288<br />
Pour ces crues le coefficient d’écoulement instantané est de :<br />
Fig. 10
VII. LES COURBES DES DEBITS CLASSES (no 10)<br />
Ces courbes définissent toutes les caractéristiques hydrologiques comparées des deux<br />
cours d’eau.<br />
Si aux débits de pointe, les valeurs du Beth sont supérieures à celles du Sebou, soit<br />
en moyenne six jours par an, par la suite et tout le reste du temps les valeurs caracté-<br />
ristiques du Sebou sont supérieures à celles du Beth. Ces courbes démontrent encore<br />
une fois, s’il le fallait, le rôle de ( barrage H et de
Le phénomène d’amorçage des syphons, imposant au-dessous d’eux une charge<br />
minimum déterminée, accentue encore ce décalage entre les valeurs limites des coeffi-<br />
cients d’écoulement en zone karstique.<br />
L’année 1944 correspond effectivement à une année sèche précédée elle-meme de<br />
périodes sèches; les sources d’Ain Timedrine ont été désamorcées, il faut une certaine<br />
charge d’eau au-dessus d’elles, pour les réamorcer et leur permettre de couler à nou-<br />
veau; cela peut demander un certain temps, d’ailleurs leur débit est fonction de la<br />
charge du Lias qui les domine et celui-ci dépend de la plus ou moins bonne réalimen-<br />
tation de cette nappe.<br />
DEBITS SOLIDES<br />
L’analyse comparée des transports solides pour les deux types de cours d’eau est<br />
intéressante pour dégager l’action érosive en terrain karstique.<br />
LE BETH A EL KANSERA<br />
Une accumulation d’un volume de terres de 30.000.000 m3 s’est produite derrière<br />
le barrage d’El Kamera en 30 ans. Compte tenu des chasses et des déversements effec-<br />
tués sur le barrage, ce chiffre représente une valeur minimum du transport solide; soit<br />
par an un volume de 1.000.000 m3 ou si on prend une densité de 2,2.000.000 tian.<br />
Le volume d’eau annuel moyen écoulé est 350 Mm3<br />
La concentration moyenne est de 6 g/l.<br />
LE SEBOU A AIN TIMEDRINE<br />
Sur une période de 10 ans le tonnage moyen annuel de débit solide est de 780.000 t ;<br />
pour un volumed’eau moyen annuel de650 Mm3,1a concentration moyenneest de 1,2g/l.<br />
Cependant, la période de prélèvement concernant le Sebou correspond à un cycle<br />
particulièrement humide; le chiffre 1,2 g/l serait un chiffre par exces.<br />
En conclusion l’érosion en terrain karstique est minima comparée à celle qui se<br />
produit dans le bassin du Beth.<br />
Le tableau ci-dessous résume les caracteres érosifs des deux cours d’eau :<br />
Débit solide Volume du dépôt Erosion spéci- Concentration<br />
par an m3/an fique t/km2/an moyenne g/l<br />
Sebou 780.000 t 390.000 175 192<br />
Beth 2.000.000 t 1 .ooo.ooo 445 6<br />
L’aménagement d’un cours d’eau en régime karstique est relativement plus simple<br />
et plus économique que celui d’un cours d’eau de type différent. En effet pour une même<br />
superficie à dominer et irriguer un barrage à construire sur bassin karstique aura :<br />
1. Une retenue moins importante (débit soutenu à l’amont en toute période);<br />
2. Un barrage moins élevé : régularisation sur peu d’années;<br />
290
29 1
3. Des évacuateurs de crue et dérivation provisoire plus économiques (débits maxima<br />
faibles) ;<br />
4. Le laminage des crues est en partie effectué sur le bassin versant même, par sa grande<br />
perméabilité ;<br />
5. Le volume des dépôts solides est réduit;<br />
6. La production électrique profitera, d’un bon CC débit de base ) soutenu; le coût du<br />
km/h sera certainement moins cher.<br />
CONCLUSION<br />
L’étude comparative du bassin karstique du Sebou à Aïn Timedrine, à celui imperméable<br />
du Beth à El Kamera a conduit aux faits suivants :<br />
1. La quabité karstique d’un bassin versant soustrait à l’évapotranspiration des quantités<br />
appréciables de volumes d’eau;<br />
2. Elle exerce une régularisation annuelle des débits;<br />
3. Elle exerce également une régularisation pluriannuelle des volumes écoulés;<br />
4. Elle assure un débit de base annuel soutenu;<br />
5. Les débits moyens annuels extrêmes sont relativement peu accentués;<br />
6. Les débits maxima annuels ou de pointe modérés;<br />
7. Les débits minima annuels sont soutenus;<br />
8. Les débits moyens, mensuels s’exercent de façon G retardée )> quoique trbs soutenus,<br />
résultat de laminage par les terrains karstiques très perméables;<br />
9. Les débits d’étiage sont également par ce fait soutenus, il y a des effets retard et<br />
tampon;<br />
10. Le terrain karstique joue un rôle de barrage et de réservoir en absorbant une partie<br />
des eaux de ruissellement, qu’il restitue de façon retardée, relativement régularisée<br />
en écrêtant les fortes crues;<br />
1 i. Les débits de pointe, instantanés sont par celà même moins importants en terrain<br />
karstique;<br />
12. L’étude hydrologique en terrain karstique concerne non seulement des écoulements<br />
superficiels mais également un écoulement souterrain. Le rôle de l’écoulement<br />
souterrain, sur le régime hydrologique du cours d’eau se manifeste par toutes<br />
les remarques citées ci-dessus;<br />
13. L’aménagement hydroélectrique y est plus intéressant.<br />
292
REsuMB<br />
SYNTmSE DES CONNAISSANCES<br />
GÉO-HYDROLOGIQUES<br />
DES FORMATIONS CALCAIRES EN ITALIE<br />
MORETTI A., PANNUZI L., STAMPANONI G., ZATTINI N.<br />
Servizio Geologico d’Italia-Roma,<br />
Les conditions géo-hydrologiques des principales masses calcaires et calcaréo-<br />
dolomitiques - pour la plupart mésozoïques - des diverses régions italiennes sont<br />
envisagées.<br />
On distingue :<br />
a) Zones constituées par les plus importantes de ces masses, qui correspondent à de<br />
grandes unités stratigraphiques et structurelles (Alpes Apuanes, l’Apennin latial,<br />
abruzzais et campanien, l’Apulie);<br />
b) Zones à calcaires complexes faisant partie de séries lithologiquement différentes<br />
(comme les Alpes de la Lombardie et de la Vénétie et l’Apennin de l’Ombrie et<br />
des Marches), ou ayant le caractère de couvertures (comme les M tacchi» en Sar-<br />
daigne et le haut-plateau des monts Iblei, en Sicile).<br />
L’emmagasinement des eaux dans les masses susdites est rapporté aux conditions<br />
litho-stratigraphiques et tectoniques régionales, aux conditions relatives au karst de<br />
surface et souterrain, ainsi qu’aux rapports entre les nappes et les eaux marines qui<br />
intéressent les calcaires de quelques zones côtières (par ex. dans l’Apulie et au SW<br />
de la Sardaigne).<br />
Finalement les sources de quelque intérêt, comme celles du type e de contact ) et<br />
mainly in thc central and southern Appenincs where they appear niore particularly<br />
on the perimeter of the Mesozoic calcareous massifs surrounded by impermeable<br />
formations.<br />
In the calcareous massifs thcre arc also a number of springs or oyxflows of purely<br />
karstic type, eithcr fracture springs (sometimes intermittent, like Pliny’s Spring”<br />
in the neighbourhood of Como) or the debouchincnts (gcncrally in grottoes) of undcr-<br />
ground rivcrs (Timavo, Fiurnelatte, Imele, Busento, etc.), and submarine springs (Gulf<br />
of Spezia, Gulf of Tarcntum, Sardinia).<br />
PR~FACE<br />
Ce mémoire constitue le premier extrait - bien que schématique - de ce qui<br />
a été acquis jusqu’ici dans cette matière pour ce qui a trait à notre pays.<br />
Les sources bibliographiques utilisées présentent assez souvent zone par zone des<br />
déséquilibres évidents non seulement du point de vue quantitatif, mais aussi - et<br />
surtout - pour ce qui se rapporte aux informations. En effet elles concernent les résul-<br />
tats de recherches scientifiquement non homogènes parce que conduites - avec des<br />
orientations et finalités fort éloignées les unes des autres - indifféremment par l’hydro-<br />
logue, le géographe ou le géologue.<br />
II en dérive divers degrés d’accomplissement et d’élaboration des différents chapitres<br />
régionaux dans lesquels noils avons réparti cette vaste matière (l).<br />
Parmi les œuvres analytiques d’ordre régional - malheureusement limitées à peu<br />
de zones - dont nous nous sommes largement servis, nous mentionnons les Mémoires<br />
illustratifs de la carte hydrographique, les Monographies sur les sources, pour certaines<br />
régions, publiées par le Service hydrographique du Ministère des travaux publics, et<br />
le recueil de mémoires sur la morphologie et l’hydrographie du Carso publiés par le<br />
Conseil national des recherches, ainsi que les feuilles au 100.000e et les notes illustratives<br />
de la carte géologique d’Italie, qui se rapportent à cette carte.<br />
Nous avons aussi utilisé certains essais d’ordre plus général en cette matière, comme<br />
celui sur le karstisme et sur l’hydrologie karstique en Italie, présenté par M. Nangeroni<br />
au XVIII* Congrès géographique italien, et celui sur le même thème préparé par un<br />
groupe de géographes de notre pays pour l’Assemblée générale de l’Association inter-<br />
nationaie d’hydrologje, à Rome. Notre œuvre tend en un certain sens principalement<br />
à la coordination, à l’achèvement et à l’approfondissement de ces partiels éléments<br />
de synthèse.<br />
Afin d’éclaircir ce mémoire, nous avons compilé une petite carte d’ensemble des<br />
masses calcaires distinctes chronologiquement, avec les indications des sources les<br />
plus imposantes.<br />
ARC ALPIN<br />
Le secteur occidental des Alpes, quoique étant constitué en majeure partie par des<br />
roches schisto-cristallines, présente des zones qui sont caractérisées par des reliefs<br />
calcaires et calcaréo-dolomitiques mésozoïques (Alpes maritimes), où il existe une<br />
intense circulation hydrique hypogée, liée généralement à manifestations karstiques.<br />
Ainsi dans la région montagneuse comprise entre les vallées du Tanaro et du Corso,<br />
où les eaux souterraines se canalisent dans les cours souterrains de la grotte de Grazzano<br />
et de la grotte de l’Orco, et dans le groupe Marguareis-Mongioie. Dans celles-c<br />
(l) L’œuvre a été préparée et coordonnée par M.A. Moretti qui a aussi soigné<br />
la rédaction des paragraphes sur les Alpes, sur l’Apennin septentrional, sur l’Apulie,<br />
sur la Sicile, et sur la Sardaigne. Des chapitres restants se sont occupés : M.L. Pannuzi<br />
(Apennin de l’Ombrie et des Marches), M.N. Zattini (Apennin du Latium et des<br />
Abruzzes) et M. G. Stampanoni (Apennin méridional).<br />
294
les eaux absorbées par les roches calcaréo-dolomitiques s’écoulent indifféremment<br />
vers les pentes septentrionales et vers les pentes méridionales. Les sources du type<br />
karstique telles que celles de Pesio, Val d’Ellero, G Vene >) de la gorge des Fascettes dans<br />
le Vallon d’Uprega etc. ont cette origine.<br />
On peut observer des exemples frappants d‘absorption et de circulation hydrique<br />
dans les calcaires karstiques triasico-jurassiques dans les voisinages de Frabosa Sottana,<br />
notamment la grotte de Gaudana avec la résurgence de Dus di Mei alimentée par les<br />
eaux absorbées du mont Pelato. Aussi dans la Val Vermenagna l’intense tectonisation<br />
des calcaires favorise l’énergique drainage des eaux qui sont restituées ordinairement<br />
par des sources au contact des terrains triasiques et des schistes séricitiques imper-<br />
méables sous-jacents du Permien, comme celles du Bandito (820 - 2.400 I/sec) et de<br />
Dragonera (50-460 i/sec), qui jaillissent des grottes homonymes et qui ont des bassins<br />
hydrologiques indépendants.<br />
Digne de mention est aussi la haute vallée d’Ossola, où les schistes lustrés sont<br />
hydrovores et donnent naissance, dans le val Ceirasca, parmi d’autres, à une importante<br />
source karstique avec un débit de 400 Ilsec.<br />
Quoique les formations calcaires des Préalpes lombardes présentent des conditions<br />
géologiques assez uniformes, la connaissance des problèmes géohydrologiques est<br />
fragmentaire et ne permet pas de tenter la synthèse générale du secteur.<br />
La région de Varese est caractérisée par des reliefs calcaréo-dolomitiques méso-<br />
zoïques la plupart desquels sont isolés (Pizzoni di Laveno, Sasso del Ferro, M. Nudo,<br />
Pravello, etc.): on peut admettre que leurs nappes hydriques, spécialement celles des<br />
calcaires triasico-liasiques, soient soutenues par les marnes du Raiblien et du Rhétien<br />
ainsi que par les terrains gréseux et argileux du Permo-Trias en originant de<br />
modestes sources locales de contact. I1 existe des exemples de circulation canalisée.<br />
comme celle de la grotte du Torregion en Valcuvia, de la grotte Cunard0 et de la grotte<br />
Remeron qui alimente probablement une des sources profondes du Lac de Varese.<br />
Les reliefs de la rive occidentale du Lario et de la zone Como-Bellagio-Lecco<br />
sont constitués par une seule formation calcaire, celie du Lias inférieur, OU se développe<br />
un intense drainage et se trouvent plusieurs résurgences, parfois intermittentes, comme<br />
la source Pliniene, entre Torno et Faggeto, et celle de Menaresta, à l’origine du<br />
Lambro.<br />
Aussi dans le groupe des Grignes, comme près de Varèse, l’horizon aquifkre le<br />
plus important est représenté par le calcaire du Ladinien auquel sont liées de nom-<br />
breuses sources.<br />
Une importante source karstique, celle du Fiumelatte, est située un peu au sud<br />
de Varenna et à 100 m au-dessus du niveau du Lac Majeur; elle prend naissance dans<br />
une grotte creusée dans les dolomies ladiniennes.<br />
Nos connaissances sur la circulation hydrique des Préalpes bergamasques, qui se<br />
développe là aussi dans les calcaires du Ladinien et du Lias sont imparfaites. 11 semble<br />
néanmoins que les sources des vallées Brembana, Seriana et Imegna soient dues au<br />
contact des masses calcaréo-dolomitiques et des formations marneuses qui les<br />
entourent.<br />
Dans les Alpes Brescianes, caractérisées par de remarquables phénomènes kars-<br />
tiques, soit superficiels, soit hypogés, I’emmagasinement des nappes hydriques se<br />
vérifie en générai dans la dolomie principale et dans les calcaires du Lias supérieur,<br />
au contact des terrains argilo-schisteux du Raiblien et du Rhétien, comme par exemple<br />
dans les vallées du Cembio, du Garza et du Brenda.<br />
Dans les calcaires du Lias, la formation des nappes hydriques est liée le plus souvent<br />
à la tectonique (synclinaux de la zone de Cariadeghe qui se comportent comme<br />
“compluvium” des eaux souterraines). Les sources sont ici souvent en rapport avec<br />
de grandes failles (par exemple entre Sopramonte et Caiondico).<br />
295
On doit mentionner particulièrement la source de Mompiano, au nord de Brescia,<br />
qui non seulement constitue le débouché des eaux emmagasinées dans les reliefs cal-<br />
caires des Monts Maddalena et Dragone, mais qui restitue aussi celles de la nappe<br />
phréatique renfermée dans les alluvions de Piana di Nava et qui est à son tour alimentée<br />
par la source de Zugno.<br />
Dans les Préalpes véronaises les calcaires karstiques du Jura moyen et de 1’Eocène<br />
moyen sont généralement bien hydrovores.<br />
Par conséquent, toutes les sources périphbriques qui jaillissent sur le versant occi-<br />
dental du Mont Baldo (Navene, Grotte di Truvai et, peu au-dessus du niveau du lac<br />
de Garda, San Carlo del Col et Madonna di Malcesine) sont liées au karstisme.<br />
Dans le groupe des Monts Lessini l’hydrographie karstique profonde favorise en<br />
général l’épanchement des eaux souterraines dans les alluvions de la plaine du Pô,<br />
en y déterminant de nombreuses résurgences au sud et sud-est de Vérone.<br />
Parmi les sources les plus importantes qui se manifestent dans les Lessini moyens<br />
on peut citer celles de Negrar et de Fumane, alimentées respectivement par les eaux<br />
emmagasinées dans les calcaires éocènes et liasiques.<br />
Les conditions hydrologiques du plateau d’Asiago sont aussi strictement liées<br />
au karstisme qui est très développé dans cette région. Les manifestations hydriques<br />
les plus importantes sont dues ici à une nappe profonde emmagasinée dans les dolomies<br />
noriennes, qui a ses issues principales à Oliero, dans la vallée du Brenta (résurgence<br />
d’une grotte avec un débit d’environ 5.000 i/sec) ou dans le Val d’Astico avec les sources<br />
de Camisino utilisées pour l’aqueduc de Padoue.<br />
Le karstisme du M. Grappa et de la région au sud du plateau d’Asiago, entre<br />
1’Astico et le Brenta, favorise une circulation hydrique profonde, d’où, par exemple,<br />
s’alimentent les importantes sources de la vallée du Brenta (S. Nazzario) et du Val<br />
Cismon (Corlo).<br />
Les manifestations hydriques les plus importantes dans les Colli Berici sont ali-<br />
mentées par les eaux emmagasinées dans les calcaires du Tertiaire (Eocène supérieur<br />
et Oligocène inférieur).<br />
Dans le Trentin les conditions hydrologiques sont généralement influencées par la<br />
présence des marnes imperméables généralement rouges, dites ((scaglia ), du Crétacé<br />
autour des massifs calcaires du Lias. Telles conditions sont réalisées par les importantes<br />
sources de débordement, comme on en a à l’ouest de Trente auxquelles on peut ajouter<br />
les sources situées entre la vallée de l’Adige et celle du Sarca (Terlago, Veuano et<br />
Calavino).<br />
Les conditions des sources de Spormaggiore, sur le bord occidental du massif<br />
de Fausior et celles du versant SE du M. Ruber (Cloz et Carnales) sont tout à fait<br />
pareilles.<br />
D’importants niveaux hydriques sont déterminés par les conditions stratigra-<br />
phiques locales. Dans les calcaires dolomitiques du Ladinien, il y a des sources au<br />
contact des terrains sous-jacents imperméables de 1’Anisien-Werfenien (par exemple,<br />
entre la Conca di Surale et la Roggia di Fondo); parfois dans la vallée de l’Adige<br />
(sources Zambana, Fai) et dans le Val di Non, la nappe hydrique se forme au contact<br />
des dolomies du Norien et des marnes sous-jacentes de Wengen.<br />
Dans le versant Nord de la Marmolada (entre Pian Trevisan et le Col de Fedaia),<br />
ainsi que dans le Val di Non jaillissent des sources purement karstiques.<br />
Les eaux absorbées par les calcaires du Crétacé à travers de nombreux gouffres<br />
du Plateau du Consiglio (Belluno), s’accumulent dans une nappe profonde, d’où elles<br />
ressortent, près de Polcenigo, en alimentant la rivière Livenza et jaillissent soit directe-<br />
ment sur les pentes du plateau, soit des alluvions terrassées en se recueillant dans le<br />
rio Livenzetta.<br />
Le Fruili présente des conditions hydrologiques qui sont en général liées au Karst<br />
de la région.<br />
296
Ainsi dans les groupes calcaires mésozoïques du Bernadia et du Natisone (Monts<br />
Mur et Mataiur), on a l’accumulation des eaux dont s’alimentent, parmi les autres,<br />
’ 1<br />
les résurgences des grottes Villanova et Vendroza.<br />
Une circulation de type karstique se présente aussi dans les calcaires dolomitiques<br />
du Norien de l’Arc préalpin et de la haute vallée du Tagliamento, circulation qui est<br />
à l’origine des sources de la vallée Bettigia dans le bassin de Cellina, de celles de Molinat<br />
au S.O. de Barcis, du Fontanon du Toff, près de Tramonti (bassin du Meduna)<br />
de Gorinda et de Vendu! (Vallée Raccolana), tandis que dans le bassin du Tagliamentp,<br />
le Karst est développé dans les calcaires paléozoïques d’où derive l’abondante source<br />
du Fontanon de Thau (N de Paluzzaj.<br />
Sur le versant méridional du groupe Ciampon-Gran Monte-Monte Maggiore on<br />
a des émergences conditionnées par des phénomènes disjonctifs (sources du Cornapo<br />
et du Barman, cette dernière jaillissant du flanc sud du Monte Musi).<br />
A la catégorie des sources de débordement, au contact des masses calcaires avec le<br />
flysch paléogène, on peut attribuer celles du Torlano dans le groupe du Bernadia et<br />
cklles d’Anduins, situées au pied du Mont Asolin et du Mont Prat.<br />
Mais la zone sans doute la plus typique pour les phénomènes de circulation dans<br />
les roches fissurées est celle du Karst de Trieste. “ ‘(I<br />
Parmi ces phénomènes, une importance particulière est attachée à celui bien connu<br />
de l’engouffrement dans les grottes de S. Canziano des eaux du Timavo, qui ressortent,<br />
après un parcours souterrain de 40 kilomètres, en donnant naissance a la source<br />
d’Aurisina, utilisée par l’aqueduc de Trieste.<br />
APENNIN SEPTENTRIONAL<br />
’ Dans ce secteur les roches qui déterminent les conditions hydrologiques importantes<br />
sont les calcaires de 1’Anti-Apennin Toscan, d’âge mésozoique, dont les plus représentatifs<br />
sont les calcaires du Massif Apuan. Ici les calcaires dolomitiques dits ((grezzoni D<br />
et les marbres superposés, ça et la intéressés par les phénomènes karstiques, causent par<br />
leur intense fracturation et fissuration, un abondant hypogé avec formation d’une riche<br />
nappe soutenue par les schistes paléozoîques du socle de la chaïne.<br />
Dans ces conditions, il y a les sources du Forno (200-4000 I/sec) et du Cartaro (158-<br />
495 l/sec) dans la vallée du Frigido, de Carbonara (90-150 Ijsec) et du Carrione de<br />
Colonnata (172 l/sec) dans la vallée du Carrione et des Fontanacce (62-167 ]/sec)<br />
dans la vallée de la Vezza.<br />
Une seconde importante nappe est liée aux calcaires dits caverneux du Rhétien,<br />
et aux calcaires du Jura et du Néoconiien soutenue par un horizon schisteux métamorphique<br />
imperméable (scisti superiori).<br />
On a ainsi les sources Alarone avec 200 ]/sec, Polla dei Gangheri (2001501 l/sec)<br />
et Pollaccia (71-147 Iisec). Cette dernière coule d’une grotte et el!e est considérée comme<br />
une typique résurgence karstique. Dans le bassin du fleuve Magra se trouvent les sources<br />
du Monte Grande (80-100 !/sec) et de Ponte Monzone (2QO l/sec).<br />
De fortes variations de débit de quelques-unes de ces sources font supposer que<br />
les bassins hydrologiques correspondants sont peu profonds et facilement saturables.<br />
On a aussi remarqué que le débit des sources n’est pas, en beaucoup de cas, proportionnel<br />
à la superficie des bassins correspondants B cause des captures souterraines<br />
parfois importantes, telles que le bassin du Frigido qui est peut-être en relation avec<br />
celui du Carrione et le bassin de la Turrite di Gallicano lié k celui de la Turrite Secca<br />
et peut-être de la Turrite Cava. Mais peut-être aussi ces discordances sont-elles dues<br />
à d’insuffisants renseignements sur les quantités de pluie.<br />
Dans le golfe de La Spezia, dans les calcaires du Rhétien, très karstifiés, il y a une<br />
circcilation qui débouche un peu au-dessus du niveau marin ou avec sources dans la mer;<br />
celle de Cadimare est célèbre.<br />
297
Des conditions géo-hydrologiques semblables à celles des Alpes Apuanes sont<br />
présentes dans la région de Siena et dans les Maremmes (K chaîne métallifère»),<br />
où il existe aussi une importante nappe au contact calcaire caverneux-schistes méta-<br />
morphiques sous-jacents.<br />
L’effleurement de cette nappe donne de grosses sources comme celle d’Onci en<br />
Val d’Elsa (1.700I/sec), ou bien faiblement thermales : Ciciano près de Chiusdino<br />
(650-1.200 l/sec), Fosso Luce pr8s de Rosia (220 lisec), Piano d’Orgia (100 i/sec) dans<br />
le bassin du Merse.<br />
Une hydrologie souterraine avec déversement direct dans la mer de l’eau de fond,<br />
est présentée par les masses des calcaires rhétiens du M. Argentario, par celles des<br />
reliefs côtiers limités au sud par la basse vallée de l’Albegna, et à l’est par l’étang<br />
d’Orbetello, et en partie par celles des Monts de I’Uccellina.<br />
I1 est important d’observer le rôle de la vapeur d’origine profonde joué dans le<br />
thermalisme et le liftage des nappes comprises dans les masses calcaires mésozoïques<br />
de la Maremme toscane et les zones voisines.<br />
Parmi les sources thermales de cette catégorie il y a celle de Caldana près de Cam-<br />
piglia Marittima, les sources Lasco della Vena dans le bassin de I’Albegna, et de<br />
Monsummano et Montecatini en Val di Nievole, celles de Bagni de Casciana, de<br />
Bagni di S. Giuliano, de Rapolano, de Chianciano et de S. Casciano dei Bagni. Elles<br />
se manifestent généralement à travers les systèmes de failles dont sont affectées les<br />
masses calcaires susdites.<br />
APENNIN CENTRAL<br />
Les conditions géo-hydrologiques de ce secteur de l’Apennin sont déterminées<br />
par les séries calcaréo-dolomitiques et calcaréo-marneuses qui en forment l’ossature.<br />
A cause des diverses caractéristiques litho-stratigraphiques on distingue divers<br />
Apennins, voire de l’Ombrie et des Marches, du Latium et des Abruzzes.<br />
L’Apennin de l’Ombrie est caractérisé par une série surtout calFaire et calcaréo-<br />
marneuse avec quelques niveaux marneux caractéristiques. Dans cette série les roches<br />
fissurées et hydrovores sont notamment représentées par le calcaire massif du Lias<br />
inférieur, la e maiolica D du Néocomien et subordonnémen t par la ( Scaglia ) du<br />
Sénonien-Eocene.<br />
L’Apennin du Latium et des Abruzzes, par la nature calcaire et calcaréo-dolomi-<br />
tique de ses terrains mésozoïques, généralement très tectonisés et karstifiés (et donc<br />
perméables dans la totalité) offre les plus grandes possibilités pour I’emmagasinement<br />
d’importantes nappes d’eau.<br />
Apennin de l’Ombrie et des Marches<br />
Dans les systèmes montagneux les plus importants, sont inclus les reliefs de l’aligne-<br />
ment M. Nerone-M. Catria-M. Cucco-M. Penna-M. Cavallo, les monts Sibillini,<br />
situés plus à l’est, et plus au sud les monts Reatini.<br />
La circulation d’eau est particulièrement active dans les reliefs où les calcaires du<br />
Lias inférieur sont bien représentés. Presque toutes les importantes sources d’afñeure-<br />
ment du niveau hydrostatique sont liées au phénomène. Elles sont situées à la base<br />
des susdits reliefs et peuvent être considérées comme typiquement karstiques.<br />
Parmi les plus importantes sources on peut citer celle de Ciordano avec un débit<br />
de 250 l/sec, dont l’origine dépend des calcaires du M. Nerone et celles de Capo<br />
d’Acqua, Prata, Vena di Buratti et Bagnara, qui s’alignent autour de la cote 650<br />
environ, dans la zone du Mont Penna et Pennino.<br />
Entre Trevi et Spoleto, en Ombrie, il y a la très connue et classique source du<br />
Clitunno avec un débit de 1.300 Ilsec; dans le bassin de Rieti les sources de S. Susanna<br />
et du Cantaro dont les débits sont respectivement de 5.000 et 4.500 Ilsec.<br />
298
La série stratigraphique présente plusieurs niveaux imperméables qui peuvent<br />
former la base d’autant de nappes phréatiques. Ces dernières cependant, n’ont presque<br />
jamais une grande importance quoiqu’elles donnen t naissance à de très nombreuses<br />
sources avec un débit modeste et situées un peu partout.<br />
I1 est aussi à envisager que l’importance de certaines nappes dépend de compli-<br />
cations tectoniques. Dans les plus grands reliefs, il s’agit de plis anticlinaux, plus OU<br />
nioins étendus et presque toujours renversés vers l’extérieur de l’arc et faillés Jongitudi-<br />
nalement sur le flanc occidental. Transversalement les plis sont coupés par de nom-<br />
breuses failles qui en morcellent la continuité et, par conséquent, diminuen ledébit<br />
unitaire.<br />
Dans ce secteur de l’Apennin il y a aussi des bassins karstiques dont les plaines<br />
de Castelluccio di Norcia, de Colfiorito, de Montelago, de Santa Scolastica, constituent<br />
les exemples les plus frappants.<br />
On a effectué des recherches colorimétriques et bactériologiques pour vérifier vers<br />
quel versant diffluent les eaux.<br />
Par exemple pour le bassin de Colfiorito, dont on a calculé une défluxion moyenne<br />
de 3.017 1/s, on a remarqué qu’une portion de celle-ci alimente les sources du versant<br />
occidental (Radia, Bagnara, Nocera, Capo d’Acqua). La partie restante se disperse<br />
en profondeur en contribuant peut-eitre à l’alimentation d’une nappe plus profonde.<br />
Apennins du Latium et des Abruzzes<br />
Dans cette région des Apennins, avec les Monts Lepini-Ausoni-Aurunci, les<br />
Simbruini, ainsi que les reliefs les plus à l’Est situés entre Aquila et Cassino, le comportement<br />
différent des masses calcaires et des masses dolomitiques, permet la formation<br />
de deux nappes hydriques principales : une nappe supérieure, dans les calcaires<br />
crétacés s’appuyant sur la formation moins perméable des dolomies du Jurassique sup.<br />
et du Crétacé, et une nappe inférieure déterminée par des lolomies du Trias et du Lias<br />
inférieur. Mais il y a aussi d’autre nappes hydriques en positions différentes à cause de<br />
la présence locale de niveaux dolomitiques et marneux, les derniers spécialement<br />
situbs dans la zone de transition avec le facies de l’Ombrie et des Marches.<br />
Les sources sont souvent situées aux bords des massifs calcaires, au contact avec<br />
les terrains imperméables du flysch. Au passage de ces deux complexes affleurent,<br />
par débordement, les imposantes nappes aquifères emmagasinées.<br />
Dans la chaine des Monts Lepini, Ausoni, Aurunci, près du versant occidental,<br />
il semble que les sources de Ninfa (1.500 ]/sec), de Sermoneta (6.000 l/sec), quelquefois<br />
sulfurées, soient liées à la nappe hydrique supérieure, tandis que les sources entre<br />
Sperlonga et Gaeta, qui jaillissent directement à la mer, dépendent de la nappe<br />
inférieure. Sur le versant oriental est située l’imposante source d’Esperia (4.000 lisec),<br />
du type de débordement déjà décrit, et celle karstique du Rio Obbucco (500-1.000 l/sec)<br />
près de Pastena qui constitue un élément d’un typique et complet exemple de groupement<br />
de manifestations karstiques. En effet un petit polje, les gouffres et la grotte<br />
homonyme font partie d’un système hydrique hypogé, qui alimente la susdite source<br />
importante.<br />
La source deTufano près d’Anagni (1 .SO0 ]/sec), située au bord occidental du massif<br />
des Simbruini, peut être référée à la première nappe et classifiée comme une source<br />
de débordement; pres du bord oriental, il y a les sources de Morino (1.800 ]/sec)<br />
et du Liri (2.000 l/sec) dans le Val Roveto. A l’est de cette vallée, il y a les sources<br />
du Fibreno (1.500 ]/sec) et de Molini Cappello (100 i/sec), situées directement à l’ouest<br />
de Sora, a la base du versant occidental des Monts Trani, Cornacchia et Langagna.<br />
Plus au nord, dans la vallée de 1’Aniene (duent de gauche du Tibre), au contact des<br />
calcaires crétacés avec les grès argileux miocènes, sont placées les sources de débordement,<br />
dites d’Agosta (5.700 ]/sec), utilisées par la ville de Rome.<br />
299
Parmi les grandes sources de ce secteur de l’Apennin, il y a celles de Cassino<br />
S. Marco 1-111 et Mastronardi ecc.) avec un débit total de 18.000 l/sec, probablement<br />
alimentées des calcaires du M. Cairo et des reliefs des alentours.<br />
Dans les M. Simbruini, il y a les sources dites du Val Fiume (i.000l/sec), qui<br />
pi ennent naissance au noyau triasique-liasique de Collepardo, probablement alimentées<br />
par la nappe inférieure et à classifier parmi les sources d’effleurement du niveau<br />
hydrostatique.<br />
Cette grande quantité d’eau est due en partie 5 la présence de vastes dépressions<br />
karstiques hydrovores (Camposecco, Campo rotondo et Campo muno, du Mont<br />
Autore, Campo catino et Campo vano à NNW du M. Monna). Encore plus vastes<br />
sont les hautes dépressions qui, comme les précédentes, ont pour la plupart une origine<br />
tectonique, dites de Campofelice et de Pezza dans la chaîne du Velino, de Rocca di<br />
Cambio-Ovindoli entre le M. d‘Ocre et le Sirente, les N piani ) des Cinque Miglia,<br />
de I’Aremogna, des Prati di Rivisondoli, de Quarto di Pescocostanzo et de S. Chiara<br />
dans la chaîne du M. Greco-M. Genzana au sud de Sulmona, et ceux du Campo<br />
Imperatore, d’Ofena et Capestrano (Gran Sasso d’Italia).<br />
Un lac karstique avec desséchements périodiques était autrefois le lac de Canterno<br />
au sud de Fiuggi, actuellement utilisé pour la production hydro-électrique, et le fameux<br />
lac Fucino, artificiellement desséché depuis longtemps.<br />
La relation entre massifs calcaires, perméabilité et circulation souterraine a une<br />
bonne démonstration par l’importante source de débordement du fleuve Volturno<br />
(6.000 I/sec), qui jaillit sur Ie versant oriental du relief de Rocchetta al Volturno, au<br />
contact, généralement, des calcaires mésozoïques et des argiles gréseuses du Miocène<br />
supérieur. Ce relief assez limité et tout entouré par ces terrains imperméables ne suffit<br />
aiicunement à expliquer ce débit imposant. Pour justifier cette énorme disproportion il<br />
est nécessaire d’admettre l’existence d’un socle calcaire continu au-dessous de la masse<br />
iriperméable OU il peut exister une circulation hydrique des zones environnantes. à<br />
laquelle peutMêtre ne devrait pas manquer la contribution des masses calcaires des<br />
Monts della Meta.<br />
Dans les monts Nuria et Nurietta, les plaines de Rascino et Cornino pourraient<br />
contribuer à l’alimentation hydrique des calcaires crétacés qui, en affleurant à l’extrémité<br />
septentrionale de la chaîne Velino-Sirente, au contact avec les niveaux imperméables<br />
du Paléogène, donne origine aux importantes sources de débordement du<br />
Peschiera (17.000~i9.000 l/sec).<br />
Dans la chaîne entre Alfedena et Sulmona (qui comprend le Mont Genzana) les<br />
sources de Sega (300 ljsec) et de S. Cauto (1.000 l/sec) sont celles qui alimentent bien<br />
plus le fleuve Sagittario. Dans la même région il y a la source du fleuve Gizio, avec<br />
un débit de 3.000 ]/sec, probablement originaire du débordement de la nappe inférieure.<br />
Dans le groupe du Gran Sasso d’Italia on peut distinguer, du point de vue de<br />
l’hydrographie karstique, 3 zones caractéristiques :<br />
a) Le bassin du Tirino, avec les sources de Capestrano (5.500 l/sec);<br />
b) La zone de Caporciano et Navelli avec les sources de Capo Pescara-S. Callisto<br />
(1000 l/sec) ;<br />
c) Le bassin de 1’Aterno avec les sources de Tempera-Capovera et du Vetoio avec<br />
un débit total de 16.000 l/sec.<br />
On remarque que, iandis que le bilan hydrologique du bassin de I’Aterno paraît<br />
absolument normal, dans les zones u), b) il y a une disproportion pour l’explication<br />
de laquelle il est nécessaire d’admettre d’abondantes contributions hydriques hypogées<br />
d’autres bassins contigus.<br />
300
APENNIN MERIDION~L<br />
Dans la partie méridionale de l’Italie, il y a une étroite connexion entre les conditions<br />
hydrologiques et les formations calcaires, qui constituent, à l’exception de<br />
l’Apulie, l’ossature apenninique.<br />
Ces formations correspondent grosso-modo chacune à des unités structurales :<br />
la Montagne du Matese, les Monts Lattari, les Monts Picentini, les Alburni, le Cervati<br />
et le groupe du Pollino.<br />
Parmi les formations calcaires, la plus hydrovore, par sa pénétrabilité marquée,<br />
efi ‘(ans aucun doute celle du Crétacé supérieur tandis que les formations calcaréodoilcimitiques<br />
du Jurassique et du Trias, à cause de leur perméabilité réduite,constituent<br />
fréquemment le soutien des nappes aquifères des calcaires crétacés.<br />
D’ailleurs, comme par exemple dans le Cilento et dans le groupe du Pollino,<br />
les calcaires dolomitiques sont en conditions pour permettre la formation d’une<br />
seconde nappe aquifère, soutenue par les schistes siliceux du Trias ou par les phyllades<br />
du socle.<br />
Cependant les réservoirs hydriques beaucoup plus importants sont subordonnés<br />
à la présence de sédiments argileux du Tertiaire (flysch), qui entourent les massifs<br />
calcaires et calcaréo-dolomitiques, déterminant ainsi, au contact des deux complexes,<br />
des nombreuses et parfois importantes sources de débordement.<br />
Les motifs structuraux de chaque massif déterminent d’ailleurs, un morcellement<br />
des divers bassins hydrologiques. Un exemple frappant du phénomène est représenté<br />
par la montagne du Matese, le premier des grands reliefs calcaires de l’Italie méridionale,<br />
qui est caractérisée par un ensemble de blocs monoclinaux, disjoints par un<br />
double système de failles, E-W et NW-SE déterminant en même temps les lignes<br />
principales de l’orographie. Bien que ses sources les plus importantes - celle du<br />
Biferno à la cote 500 environ (1 .O00 l/sec) à la base du versant nord-oriental, et celles du<br />
Torano (3.000 l/sec) et du Maretto (5.000 I/sec) à la cote 200 du versant Sud - peuvent<br />
être envisagées comme génétiquement semblables, parce qu’elles jaillissent du contact<br />
de la masse calcaire et des sédiments imperméables du flysch, leur différence de cote<br />
fait supposer qu’elles sont liées à deux bassins hydriques distincts, dérivés d’une<br />
séparation souterraine due au soulèvement par faille de la formation dolomitique<br />
semi-imperméable sous-jacente.<br />
Pour une utilisation plus avantageuse, les eaux des sources du Biferno seront<br />
amenées, en grande partie, sur le versant tyrrhénien par une galerie.<br />
Même si la perméabilité en grand, qui caractérise les Monts Lattari (Péninsule de<br />
Sorrento) et I’Ile de Capri, due à l’intense fracturation des calcaires et au remarquable<br />
développement dans le sens vertical des phénomènes karstiques, soit à une cote élevée,<br />
soit au voisinage de la mer, permet une intense circulation hydrique, les particulières<br />
conditions morphologiques et la fragmentation des niveaux imperméables consentent<br />
ici seulement de modestes nappes aquifères locales.<br />
Les eaux en effet, affluent en général à la mer ou se perdent, comme par exemple<br />
sur le versant du golfe de Naples, dans les terrains alluvionnaires de la plaine de Pompei<br />
ou dans les niveaux perméables des formations volcaniques du Vésuve. Dans la même<br />
région, les sources minérales de Castellamare di Stabia s’alimentent à la nappe hydrique<br />
dont la minéralisation est liée aux émanations de CO2 d’origine endogène.<br />
Des caractéristiques d’affleurement analogue sont présentées par les sources du<br />
massif des Picentini (le Terminio, le Cervialto, 1’Accellica, le Polveracchio), qui<br />
prennent naissance généralement au contact des formations calcaires mésozoïques<br />
et des formations argilo-gréseuses tertiaires du flysch et qui peuvent être comptées<br />
parmi les plus importantes de l’Italie méridionale, telles que la source de Capo Sele<br />
(3.300 I/sec environ), à la base du massif calcaire crétacé du Cervialto, la source du<br />
30 1
Serino (2.000 lisec), à la base du Mont Terminio et celle de 1’Ausino-Ausinetto (400 i/<br />
sec environ) entre le Mont Accellica et le Polveracchio.<br />
Des monts Picentini prennent naissance finalement les importantes sources Bagno<br />
della Regina et Pollentina, avec un débit d’environ 700 et 1.200 l/sec respectivement<br />
(territoire de Cassano Irpino).<br />
La situation géo-hydrologique générale est déterminée par la nette distinction des<br />
masses calcaires du Terminio et du Cervialto et de la masse dolomitique de I’Accellica,<br />
les premières étant plus hydrovores. Par conséquent, leurs sources donnent le plus<br />
grand débit. Enfin les conditions générales de gisement de ces formations calcaréo-<br />
dolomitiques favorisent un plus fort drainage vers les bords septentrionaux. Des<br />
captures hydriques hypogées peuvent se produire; on admet, en effet, que vers le<br />
bassin du Sele soient drainées les eaux absorbées par la partie la plus élevée du groupe<br />
du Cervialto, qui se trouve, au contraire, dans le bassin hydrographique du Calore.<br />
Très différentes et beaucoup plus complexes sont les conditions géohydrologiques<br />
de la région montagneuse du Cilento, qui s’étend de la vallée du Calore jusqu’à Sapri<br />
et s’identifie par deux grands massifs constitués principalement par des calcaires du<br />
Crétacé : les Monts Alburni et le Cervati. La structure assez fragmentaire de cette<br />
région, où sont situés aussi de larges affleurements dolomitiques ayant à la base les<br />
schistes siliceux du Trias, ne permet pas de dresser un tableau exact de ses conditions<br />
géo-hydrologiques.<br />
Par les caractères surtout karstogènes des masses calcaires et par les caractéristiques<br />
géo-morphologiques locales, la genèse des émergences hydriques ici existantes est<br />
variée.<br />
On a des émergences de déversement liées au contact des calcaires et des sédiments<br />
argileux du flysch, des résurgences correspondantes à des cours d’eau souterrains (résur-<br />
gence de l’Angelo dans la grotte de Pertosa et celle très renommée du Busento près<br />
de Morigerati), des résurgences sous-marines (sources Ruotolo à Sapriì, liées à des<br />
conditions géomorphologiques locales, et enfin des jaillissements dus aux contacts<br />
tantót stratigraphiques, tantót tectoniques entre les dolomies et les schistes siliceux<br />
inférieurs.<br />
Aussi pour le groupe montagneux du Pollino, par lequel se termine le système des<br />
reliefs calcaires de l’Apennin méridional, on trouve des conditions d’emmagasinement<br />
génétiquement analogues à celles du Cilento avec des nappes hydriques dues au contact<br />
entre les dolomies et les schistes du Trias (Lungro, S. Sosti et le haut bassin de 1’Argen-<br />
tino), avec des émergences de débordement alimentées par les calcaires du Crétacé<br />
(source du Mercure sur le versant septentrional du Pollino), ainsi que les résurgences<br />
karstiques et les sources sous-marines le long du littoral thyrrénien.<br />
Rappelons enfin les résurgences d’eau sulfureuse et salée liées aux formations<br />
calcaréo-gypseuses tertiaires de la Calabre (Belvedere, Spinello et Zinga).<br />
APULIE<br />
Les calcaires du Crétacé supérieur à facies de récif et à allure subhorizontale dégra-<br />
dant vers la mer Adriatique, avec une morphologie plate à vastes dàpressions liées à des<br />
systèmes de failles longitudinales (de NO à SE) et subordonnément transversales,<br />
prédominent dans la rdgion (Gargano, Murge et Salento).<br />
L’énergique drainage des eaux météoriques exercé par les calcaires, caractérisés<br />
par de grandioses phénomènes karstiques, soit superficiels soit hypogés, alimente<br />
ce qu’on appelle ( nappe de base N située au niveau minimum hydrostatique déterminé<br />
par la mer.<br />
Les manifestations hydriques, distribuées tout le long de la côte, généralement<br />
situées à un niveau inférieur à 10 m et notablement distancées entre elles, avec un débit<br />
3 02
de quelques centaines de ]/sec, sont probablement conditionnées par l’existence, le long<br />
de la région côtière, au-dessous du niveau de la mer, de couvertures sédimentaires<br />
imperméables, qui empêchent la formation des sources sous-marines.<br />
Les plus importantes sont celles des lacs de Lesina et Varano, à Vieste et Siponto<br />
sur le Gargano et dans les environs de Trani, Brindisi, Lecce et Taranto.<br />
Dans le golfe de Taranto des sources sous-marines importantes (cidri) sont connues.<br />
Les études géophysiques et des sondages ont permis de déterminer l’allure de la<br />
nappe profonde, qui est distribuée en trois grands bassins hydrologiques : le Gargano,<br />
dont la nappe est isolée à cause de motifs stratigraphiques et structurels, vers l’orient<br />
et vers le plateau de 1’Apulie et des Murge (celle-ci peut défluer seulement vers les<br />
zones les plus internes de Ja côte septentrionale et méridionale); les Murge, dont le<br />
bassin est délimité au NW et SW par des grands systèmes de failles; et enfin la région<br />
de S. Maria di Leuca, la nappe de laquelle dimue vers la côte de la péninsule du Salento,<br />
en excluant le trait Lecce-Otranto, où elle est entravée par une large couverture de<br />
terrains récents.<br />
On a rkemment étudié quels sont les rapports entre les eaux marines qui pénètrent<br />
profondément dans la région calcaire de l’Apulie et celles de la nappe (la communi-<br />
cation souterraine entre les mers Adriatique et Ionienne peut être envisagée).<br />
11 en est résulté que la nappe profonde peut être rencontrée jusqu’à une profondeur<br />
égale à 40 fois la cote piézométrique de la nappe elle-même, c’est-à-dire parfois bien<br />
au-dessous du niveau de la mer.<br />
Cette règle permet donc d‘établir la profondeur limite qu’il serait dangereux de<br />
rejoindre à cause de la présence d’eau salée.<br />
D’autres problèmes pratiques concernent la recherche de la nappe profonde par<br />
endroit, où elle est artésienne à cause de couvertures imperméables.<br />
L’exploitation de la nappe profonde doit aussi tenir compte de la variation d’équi-<br />
libre existant dans le système eau salée - eau douce, en conséquence du pompage de<br />
celle-ci. Cette variation est plus rapide à proximité de la côte et dans les zones où les<br />
calcaires sont plus fortement fracturés, tandis qu’elle est plus lente dans les zones<br />
internes, à cause de la plus grande profondeur du niveau de l’eau marine.<br />
SICILE<br />
Les masses calcaires et calcaréo-dolomitiques les plus remarquables en Sicile sont<br />
celles du secondaire des Monts de Palerme, de Castellamare, de Trapani, de la zone<br />
des Monts Sicani et des Madonies. Des formations calcaires font partie toutefois,<br />
de la série tertiaire. Parmi celles-ci, les formations du haut-plateau de Ragusa ont une<br />
importance particulière.<br />
Quant aux conditions géo-hydrologiques des calcaires du secondaire, on doit<br />
observer que l’état fragmentaire assez répandu de leur affleurement, la morphologie<br />
à étroites dorsales d’une grande partie des reliefs constitués par ces mêmes terrains,<br />
le fait que quelques-uns parmi eux atteignent les zones côtières, en déterminant des<br />
sources directement dans la mer, avec les caractéristiques climatiques et météorolo-<br />
giques régionales, constituent des facteurs négatifs pour la formation d’importantes<br />
réserves hydriques hypogées. Ces conditions expliquent aisément le bas rendement<br />
hydrologique des bassins, démontré aussi par les forts déficits de débit total des émer-<br />
gences qui sont comprises dans les bassins mêmes.<br />
En tous cas les sources liées aux roches calcaires constituent la partie la plus importe<br />
du patrimoine hydrologique sicilien (précisément les 21 %), à l’exception du district<br />
volcanique de 1’Etna et du haut-plateau de Ragusa.<br />
On observe que les sources qui sont localisées à l’intérieur de l.ile, ont une origine<br />
souvent par débordement du niveau hydrostatique au contact des masses calcaires<br />
3 03
hydrovores et des terrains argileux du flysch, qui les entourent. Ces conditions sont<br />
celles des sources de la vallée du Rosmarino (Alcara di Fusi : débit 601/sec), des<br />
Madonies (Polizzi Generosa : débit environ 400 I/sec; Scillaro : débit 576 I/sec;<br />
Collesano: débit 84 l/sec), de la zone au N et NE de Corleone (Malvello: débit 67 l/sec,<br />
Drago : débit 103 lisec); des monts de Palerme (Monreale : nombreuses émergences<br />
pour un débit total de 117 lisec); de Partinico et des Sicani (Val du Belice près de<br />
Ponte Partana : débit 265 ljsec).<br />
11 y a des exemples de sources aussi importantes qui jailljsient en peu au-dessus<br />
du niveau de la mer, là OU les masses calcaréo-dolomitiques mésozoiques atteignent<br />
la zone côtière (Favara près de Terranova : débit 65 l/sec; Cefalù: débit 393 l/sec;<br />
Brocato prbs de Termini l/sec: débit 1 I3 l/sec ; Trabia: débit 21 3 l/sec; Favara diVilla-<br />
bate : débit 766 l/sec; Canal de Maredolce, près de Palerme : débit 69 Ikec’.<br />
Pour quelques sources littorales (par exemple pour celles de Cefalù), une légère<br />
salinité de l’eau est caractéristique.<br />
Quant à la géo-hydrologie du haut-plateau de Ragusa on remarque que là OU<br />
entre les calcaires inframioceniques sont intercalés des niveaux marneux, ceux-ci<br />
peuvent former des nappes locales (l), au-dessus de la très étendue nappe de base qui<br />
se forme au contact avec les terrains du Paléogène et qui alimente la serie d’émergence,<br />
même de débit considérable (jusqu’à 1.000 lisec), qui jaillissent dans les bords occi-<br />
dentaux du plateau lui-meme et le long du littoral (sources de Chiaramonte, Comis,<br />
S. Croce, Camerina, Stagno di Guizzi, Ispica, Rosolini).<br />
SARDAIGNE<br />
Les masses calcaires et calcaréo-dolomitiques de 1’Ile sont essentiellement celles<br />
cambriennes du Sulcis et de ce qu’on appelle u Anello metallifero dell’lglesiente »,<br />
du Jurassique-Crétacé de la Nurra, de l’arc d’Orosei, des Monts de Siniscola, des<br />
c Tacchi)) de la Barbagia et du Sarcidano, et du Miocene du Sassarois et Cagliaritain.<br />
Les nappes hydriques emmagasinées dans les calcaires cambriens - où s’explique<br />
généralement un intense karstisme - se forment d’ordinaire au contact des terrains<br />
imperméables sous-jacents. Parmi les sources les plus importantes, qui sont classées<br />
en partie dans celles de contact et en partie dans celles ( de débordement D, on doit<br />
mentionner ; dans le Sulcis celles du groupe du Rio Palmas (débit 42 ljsec), dans<br />
1’Iglesiente ceiles de Caput Aquas (70 [/sec) et de S. Giovanni (151 l/sec) et dans le<br />
Fluminese celles du Mont Serrau (220 ljsec).<br />
A propos de la nappe comprise dans les calcaires de l’« anello metallifero dell’<br />
Iglesiente)) et qui, on pense, déverse une bonne partie de ses eaux directement dans<br />
la mer, il nous semble indispensable de dire quelques mots sur les problèmes qu’elle<br />
détermine pour l’exploitation des nombreux et importants gisements de plomb et<br />
zinc de la zone.<br />
Vers la fin du sibcle dernier, l’eau de fond de ce bassin dont le niveau avait été<br />
rejoint par les mines les plus importantes, opposa un obstacle sérieux au développement<br />
de l’industrie extractive. Pour pouvoir continuer les travaux on dut recourir à l’excava-<br />
tion de la galerie d’écoulement de la mine de Monteponi. Cette galerie, creusée en<br />
grande partie dans les schistes du lit, rencontra en traversant les calcaires, une fente<br />
profonde et large, capable d’engloutir d’énormes quantités d’eau (3.500 ]/sec au début,<br />
réduits ensuite à 650). C’est ainsi que le niveau hydrostatique qui était précédemment<br />
stabilisé à la côte 70 s’abaissa considérablement et non seulement dans cette mine,<br />
mais encore dans toutes les exploitations voisines. Plus tard, toujours à Monteponi,<br />
pour libérer des eaux d’autres parties plus profondes du gisement, on assura cet écoule-<br />
(1) Ces nappes alimentent de nombreuses sources. Parmi les plus importantes, il<br />
y a celles de Modica et environs, de la zone de Ragusa et de Palazzo10 Acreide.<br />
304
ment en organisant des pompages de plus en plus puissants pratiqués à une cote<br />
toujours plus basse. L’installation actuelle, située à la cote 60, assure un écoulement de<br />
1.200 I/sec d’eau saumâtre, provenant de la commixtion des eaux douces de la circulation<br />
karstique normale avec l’eau de mer très fortement aspirée (on calcule 280 ]/sec d’après<br />
le NaCI de l’eau écoulée).<br />
II reste à préciser - et c’est un problème ardu - en quei point de la côte les eaux<br />
de mer sont absorbées par les calcaires. Ce point devrait se situer au nord de Pan<br />
di Zucchero. 11 est évident que la reconnaissance de cette zone et de ses modalités<br />
d’absorption permettrait de résoudre d’après des données concrètes un autre problème<br />
intéressant : celui d’empêcher la pénétration des eaux de mer par l’imperméabilisation<br />
de la fracture ou du système de fractures qui la déterminent. On ne peut méconnaître<br />
les avantages économiques et sociaux qui en résulteraient tant pour l’industrie minière<br />
qui verrait diminuer considérablement les frais d’extraction que pour I’approvision-<br />
nement hydrique de la zone.<br />
L’hydrographie souterraine de la Nurra (en général peu connue) se développe dans<br />
les calcaires mésozoïques qui constituent la fragmentaire couverture résidue du massif<br />
paléozoïque et elle est déterminée par le morcellement morphotectonique de cette<br />
couverture. En tous cas, la circulation de l’eau de fond entraîne directement à la mer<br />
d’abondantes quantités d’eau et en disperse d’autres dans les vastes couvertures<br />
alluvionaires de la région.<br />
Des sources de quelque importance existent, en effet, seulement dans la plaine de<br />
Fertilia, près d’Alghero, et dans la région du fleuve Sato, à l’ouest de Porto Torres.<br />
L’hydrologie des masses calcaires, surtout jurassiques des reliefs escarpés qui<br />
encadrent le golfe d’Orosci, est typiquement liée aux grandioses phénomènes karstiques<br />
de la région et comprend des cours souterrains de remarquable longueur, comme celui<br />
de la grotte du Bue Marino (débit maximum 300 mc/sec), qui débouche directement<br />
dans la mer (Cala Gonone) et celui de la grotte de S. Giovanni, qui alimente la source<br />
homonyme.<br />
Plus à l’intérieur, une imposante circulation hydrique profonde s’explique dans les<br />
calcaires jurassiques des Monts d’Oliena, qui sont aussi visiblement karstiques.<br />
La plus grande partie de ces eaux - qui se recueillent au contact des terrains du<br />
socle cristallin de la région - est drainée vers la vallée du Cedrino. OU se trouvent<br />
les sources de Golegone (les plus importantes de la Sardaigne avec un débit total de<br />
365 litres par seconde) et celles de S. Pantaleo (265 ]/sec).<br />
Des conditions similaires se présentent dans les reliefs calcaires du M. Caterina<br />
(entre Galtelli et Orosei) et du M. Alto, au S W de Siniscola. Dans ce dernier, le drainage<br />
des eaux souterraines a son débouchement principal à l’extrémité NE du massif, près<br />
de Siniscola, dans la grosse source de S. Giuseppe (97 ]/sec).<br />
Aussi, dans la région des ((tacchi », la circulation hydrique hypogée est liée au<br />
karstisme, et répète celle des plus grandes masses calcaires mésozoïques considérées<br />
jusqu’ici, parce qu’elle aussi est conditionnée par l’existence d’un socle géologique<br />
schisteux-cristallin imperméable. Les sources, qui en dérivent (comme celles de Villa-<br />
nova, de Sadali et de Ullassai) doivent donc être classées typiquement parmi celles de<br />
contact.<br />
I1 faut mentionner particulièrement la circulation hydrique dans les calcaires du<br />
Miocène qui constituent les collines de Cagliari et qui ont leur extension maximum<br />
dans certaines régions de la Sardaigne septentrionale (Sassarese, Logudoro, Anglona),<br />
où ils forment des plateaux caractéristiques, morcelés par une teztonique disjonctive<br />
très marquèe et par l’érosion fluviale. Quoique grossiers (détritico-organogenes) ces<br />
calcaires sont sujets à phénomènes karstiques qui, dans des vastes zones, dkterminent<br />
la prévalence de l’hydrographie souterraine sur celle superficielle. Les eaux se recueillent<br />
généralement au contact des sous-.jaCentes formations volcaniques (laves et tufs) du<br />
Miocène inférieur.<br />
305
Dans les sillons de vallees creusés juqus’à ces contacts apparaissent communément<br />
les sources, toujours de débit médiocre. D’autres petites manifestations hydriques,<br />
de type diaclasique, peuvent se produire même en pleine formation calcaire.<br />
RESUME ET CONCLUSIONS<br />
L’âge des masses calcaréo-dolomitiques de l’Italie dont on étudie les conditions<br />
géo-hydrologiques est notamment mésozoïque.<br />
Du point de vue litho-stratigraphique, parmi ces masses mémes, il y a une frappante<br />
différenciation par l’homogénéité de leur composition entre celles du Friuli-Vénétie<br />
orientale, des Alpes Apuanes, de l’Apennin centro-méridional et celles des autres<br />
régions, par exemple la Sardaigne, la Sicile, l’Apennin de l’Ombrie et des Marches.<br />
On a montré de méme, que la complexité structurale des Alpes et de l’Apennin n’est pas<br />
rencontrée dans les grandes plates-formes calcaires assez simples de l’Apulie, de Ragusa<br />
en Sici!e et de la Sardaigne.<br />
Un grand nombre de ces masses est parfois affecté d’un karstisme intense, tant<br />
de surface qu’hypogé, dont on a de grandioses exemples surtout dans la région de la<br />
Vénétie orientale dans l’Apennin central-méridional, en Apulie et en Sardaigne.<br />
La variation des caractères géo-hydrologiques est étroitement liée à la variabilité<br />
des conditions rappelées ci-dessus.<br />
Les niveaux hydriques, plus ou moins indépendants entre eux, doivent leur origine<br />
soit à la saturation des masses calcaires fissurées, soit à la présence d’un basement<br />
imperméable. A ces catégories appartiennent ceux des Alpes, Apuanes, de l’Apennin<br />
central et méridional, des masses calcaires cambriennes de la Sardaigne et mesozoîques<br />
de la Sicile. Les réservoirs hypogés sont souvent déterminés par ces mémes masses<br />
calcaires quand elles sont entourées par des terrains imperméables. Leur volume est<br />
souvent limité par la tectonique surtout de faille. Ils se manifestent par des sources de<br />
déversement.<br />
D’importantes masses d’eau alimentent parfois des systèmes de canalisations souterrains<br />
qui sont, en beaucoup de cas, assez complexes et grandioses (Vénétie orientale,<br />
Alpes lombardes, Sardaigne).<br />
Les caractères géographiques de la partie péninsulaire et insulaire de l’Italie sont<br />
à la base des rapports parmi les eaux méthéoriques et l’eau de mer. A ce sujet on peut<br />
citer les très beaux exemples hydrologiques de l’Apulie, celle-ci étant quasi totalement<br />
calcaire, de la Sardaigne, et de la Ligurie. 11 est aussi à signaler l’alimentation des<br />
plaines alluvionales à la base des massifs calcaires des Alpes centrales et orientales,<br />
avec leurs importantes résurgences.<br />
I1 existe aussi des zones où les phénomènes de thermalité d’origine magmatique,<br />
ont un rôle assez important sur l’hydrologie régionale (Alpes Apuanes, Chaîne métallifère<br />
toscane, etc.).<br />
Les types de sources sont, naturellement, les plus variés. On peut citer à ce propos :<br />
Sources à la base des massifs calcaires karstiques, correspondant à l’affleurement<br />
du niveau hydrostatique (Préalpes lombardes - Vénitiennes, Ombrie, etc.) ;<br />
Sources de débordement liées à la structure et à la stratigraphie (Marches, etc.);<br />
Sources de débordement au contact de failles calcaires-flysch (Apennin central<br />
et méridional);<br />
Sources déterminées par la sortie de cours d’eau hypogés dans les régions karstiques,<br />
avec phénomènes d’intermittence ;<br />
Sources sous-marines (Ligurie, Mer Ionienne) ;<br />
Sources thermo-minérales (Toscane).<br />
Pratiquement les eaux qui sont contenues dans les grands massifs calcaires et qui<br />
sont à l’origine des sources les plus importantes constituent le patrimoine principal<br />
de l’alimentation hydrique dey villes, des industries, de l’agriculture.<br />
306
La meilleure utilisation des eaux est envisagée, ainsi que leur recherche. A ce<br />
propos, l’exemple de l’Apulie aux eaux salées dont sont saturés ses calcaires fissurés<br />
et qui forment la base des eaux douces, est tout à fait remarquable : l’énonciation du<br />
phénomène est bien le résultat de nombreuses recherches soit géo-physiques, soit par<br />
forages.<br />
L’étude et la recherche systématique devraient former le point de départ pour<br />
la captation des eaux des massifs calcaires avant même leur émergence naturelle,<br />
parfois inutilisable, faute de cotes suffisantes, et des cours d’eaux souterrains, cela<br />
surtout en ce qui concerne l’Apennin centro-méridional. li est évident que dans chacun<br />
des cas, les recherches géologiques et géophysiques de grand détail s’imposent.<br />
307
HYDROGEOLOGY OF SOME KARSTIC AREAS OF<br />
GREECE<br />
SUMMARY<br />
David J. BURDON*<br />
FAO Hydrogeologist<br />
Investigations of four karstic areas of Greece by an United Nations Special Fund<br />
Project have yielded many results of general interest; those dealing with the hydro-<br />
geology of fractured rocks are summarized here.<br />
Variations in general permeability indicate some primary porosity in certain litho-<br />
logical units; but the conduits through which the groundwater circulates in the carbon-<br />
ate rocks of Greece are the widespread joint systems and localized fissures induced by<br />
the compressive forces of the Alpine orogeny and the faults of the subsequent relax-<br />
ation tectonics. Solution and enlargement of fractures by circulating groundwater fol-<br />
low two dominant directions-vertical enlargement above, and sub-horizontal enlarge-<br />
ment on and just below, the surface of the zone of saturation. There are marked dif-<br />
ferences between zones of saturation upheld by impermeable formations and those<br />
lying over the sea-controlled base saturation level. Quaternary variations in the relative<br />
levels of sea and land have resulted in several karstified horizons in and below the coas-<br />
tal areas of Greece.<br />
Marine contamination in small amounts has been detected by hydromechanical<br />
methods. To supply the varying amounts of sea-water mixed and discharged with the<br />
sweet groundwater from most coastal and drowned springs, there must be an inland<br />
movement of sea-water. Such movement is reported from many areas, and a “zone-<br />
of-mixing” hypothesis, based originally on observations at Kephalonia, is advanced to<br />
explain this movement of sea-water into the karstic openings of the coastal aquifers of<br />
Greece.<br />
RÉSUMÉ<br />
Hydroge‘ologie de certaines rlgions karst ìqiies de la Grèce<br />
Des recherches effectuées dans quatre régions karstiques de la GrBce au titre d’un<br />
projet du Fonds spécial des Nations Unies ont permis d’obtenir de nombreux résultats<br />
d’intérêt général; on trouvera ci-après un résumé des résultats concernant l’hydrogéo-<br />
logie des roches fissurées.<br />
Les variations de la perméabilité générale indiquent une certaine porosité primaire<br />
dans quelques éléments rocheux; mais les conduits par lesquels les eaux souterraines<br />
circulent dans les roches calcaires de la Grèce sont des systèmes étendus de diaclases<br />
et de fissures localisées produites par les forces compressives de l’orogénie alpine et les<br />
failles résultant de la détente ultérieure des contraintes internes. L’élargissement des<br />
fractures sous l’effet du cheminement des eaux souterraines suivent deux directions<br />
principales : l’élargissement vertical au-dessus de la surface de la zone de saturation et<br />
l’élargissement subhorizontal au niveau de cette surface et juste en dessous. 11 existe<br />
des différences marquées entre les zones de saturation soutenues par des formations<br />
imperméables et celles qui sont situées au-dessus du niveau de saturation de base déter-<br />
miné par la mer. Les variations quaternaires des niveaux relatifs de la mer et de la terre<br />
ont créé plusieurs horizons karstifiés le long des côtes de la Grèce et au-dessous de ces<br />
régions.<br />
Un légère contamination par l’eau de mer a été décelée par des méthodes hydrochi-<br />
miques. Le fait que l’eau douce souterraine fournie par la plupart des sources côtières<br />
et sous-marines contient de l’eau de mer en quantité variable, suppose une pénétration<br />
de l’eau de mer dans les terres. Cette pénétration a été constatée dans de nombreuses<br />
régions et, en se fondant initialement sur des observations faites à Céphalonie, on a émis<br />
I’hypothkse de l’existence d’une
Groundwater and the fractured carbonate rocks through which it moves constitute<br />
a dynamic system in which both the fluid and the container are actively reacting and<br />
changing in time and space. Differential enlargement of fissures by solution will drain<br />
off groundwater from surrounding masses, so that concentrated replace diffused circu-<br />
lation; such water concentration increases dissolution rates and further enlarges the<br />
incipient swallow-holes, caves and caverns. But mineral precipitation and sedimentation<br />
can also reduce the sizeand even block such openings, and then the circulatingground-<br />
water must find, and by using enlarge, new paths as it moves vertically or sub-horizon-<br />
tally down to the sea. Past emergence may have left traces of palaeokarsts; changing<br />
land forms have produced changes in surface and groundwater drainage patterns; while<br />
the changing levels of the Mediterranean Sea during the Quaternary, as well as the til-<br />
ting and faulting of the post-Alpine orogeny, have produced and later deformed zones<br />
of intense karstification, many of them now drowned by the rising sea.<br />
For three years, from 1960 to May, 1963, such karst groundwater phenomena were<br />
investigated in four selected areas of Greece by an United Nations Special Fund Pro-<br />
ject, carried out by the Food and Agriculture Organisation in cooperation with the<br />
Greek Institute for Geology and Sub-surface Research. The purpose of the Project was<br />
“to determine, test and demonstrate methods for the succesful and efficient develop-<br />
ment of groundwater in limestone terrains”. The areas investigated were Parnassos-<br />
Ghiona and Agros-Tripolis, which were studied in detail, as well as Crete and Kephalo-<br />
nia, on which only reconnaissance investigations were made. The full results were<br />
presented to a Technical Meeting held in Athens in March, 1963; here the information<br />
gained on the hydrogeology of the fractured carbonate rocks of these areas is summa-<br />
rized and analysed.<br />
I. EVOLUTION OF FISSURES IN THE LIMESTONES OF GREECE<br />
While it may be accepted that primary, unaltered limestones tend to be impermeable<br />
rocks, still limestones with primary porosity are not unknown. In fact, many limestones<br />
are composed of coarse to fine detrital material of organic or inorganic origin, as calci-<br />
rudites and biohermals, but in the course of lithification the openings have been filled<br />
and cemented with the abundant carbonates of calcium and magnesium. It is the read-<br />
iness with which these carbonates pass into solution and again precipitate in the earth’s<br />
hydrosphere which accounts for the impermeability of so many primary limestones;<br />
this should be contrasted with the low solubility of silica in water, so that permeable<br />
sandstones change to impermeable quartzites only in the metamorphic zones.<br />
In studying the limestones of the Parnassos-Ghiona region of Greece, it was possible<br />
to find some indications of differing primary porosity in the several formations; this<br />
could be related to lithology, after making due allowance for tectonic history, present<br />
topography, groundwater circulation and related factors. The results may be summa-<br />
rized as in Table I.<br />
While the Tertiary orogeny has been dominant in inducing fissuration, both diffuse<br />
and concentrated, into the limestones of Greece, evidence of pre-Tertiary tectonic epi-<br />
sodes and deformations are not lacking. Of these, the emergencies in the Upper Jurassic,<br />
between the upper Jurassic and the Lower Cretaceous, and between the Middle and<br />
Upper Cretaceous, have left their mark in the formation of palaeokarsts and in valu-<br />
able bauxite deposits. But the studies did not find it possible to attribute any special<br />
fissuration to these periods; it is possible that such early openings have been resealed.<br />
Both the Parnassos-Ghiona and the Argos-Tripolis areas lie well within the Tertiary<br />
orogenetic zone. In Parnassos-Ghiona the main Alpine orogeny was marked by intense<br />
compression, giving rise first to folds and then to thrusting; such folding and thrusting<br />
is most marked in the Palamcene-Eocene flysch which formed mobile belts. Compres-<br />
3 O9
TABLE I<br />
Classification of the autochthonous Purnassos- Ghiona Zone<br />
carbonate rocks according to their general permeability,<br />
which appears to be associated with their original facies<br />
and lithology rather than to subsequent,<br />
and more localized, tectonic episodes (after Papastamatiou, I 960).<br />
Age Thickness Facies Lithology Permeability<br />
Upper I50 m Sublithographic Limestone High<br />
Cretaceous Rudistae<br />
Mid-Lr. 400 m Coralline, Oolithic, Limestone Very low<br />
Cretaceous Nerinia<br />
Upper 150 m Coralline, with Limestone Medium<br />
Jurassic Cladocoropsis<br />
Mid-Lr. 700 to Oolithic, with Limestone+ High<br />
Jurassic 1,100 m Cephalopods Dolomite<br />
Upper + 1 ,200 m Megalodonts, Dolomite Nil<br />
Triassic Gyroporells<br />
sional effects within the autochtonous Parnassos-Ghiona series was climaxed by overthrusting;<br />
from the north-east the Subpelagonian limestone overode the Parnassos<br />
flysch and, in turn, the Parnassos-Ghiona limestones were overthrust onto the Olonos-<br />
Pindos limestones around Galaxidion. After this compressional climax, there was a<br />
relaxation phase, marked by faulting, tilting and horst-graben structures; this tectonic<br />
style continues to the present day.<br />
In the Argos-Tripoli area, there is a north-south core or ridge of impermeable crystalline<br />
rocks, onto which the autochtonous Tripolitza Series (700 meters of neritic<br />
limestones, ranging in age from Upper Triassic to Eocene) were deposited. During the<br />
compressional stage, these limestones were not greatly affected by folding, though some<br />
of them have been metamorphosed to marble; but they have been overthrust on their<br />
Oligocene flysch by plastic allochthonous pelagic Olonos limestones and flysch whose<br />
root zone is considered to lie beneath the Plain of Argos. Thrusting was from east-northeast<br />
to west-south-west, and the displacement is measured in tens of kilometers.<br />
The forces causing compression and thrusting were transmitted through the competent<br />
limestone beds, with the soft flysch playing a passive and plastic role. Some of<br />
the limestones yielded and deformed plastically, without exceeding the breaking stresses<br />
of the rock; such plastic deformation was due mainly to the composition of the rock,<br />
in which the presence of marls or clay material appear to have increased plasticity<br />
either in the main body of the rock, or by forming marly layers separating limestone<br />
beds and permitting them to slip easily over each other. Plasticity was also increased<br />
by confining pressures, due to the load of overlying rock; but such confining pressures<br />
were not identified as a major factor inducing plastic deformation.<br />
For the most part, the strains set up in the limestone by the compressive and thrusting<br />
stresses exceeded the shearing and tensile strength of the rocks, and fracturing took<br />
place along the usual sets of shear and tension planes. The patterns established by these<br />
joints could be observed in most outcrops; usually two sets of joints sub-perpendicular<br />
to each other and normally perpendicular to the bedding planes. The spacing between<br />
the joints was commensurable to the thickness of the indiuidual limestone beds. It was<br />
3 10
very clear that in each area, the .joint system was oriented and related to the direction<br />
of thrusting or folding; but it was not possible to make an analysis showing the exact<br />
relationship of the joint pattern to the major structural features of each area.<br />
This general joint patern becomes intensified in areas where for one reason or an-<br />
other, compressive or tensional stress were intensified. Along the crests of the anticlines<br />
tension predominated, and open joints were common; such openings played a dominant<br />
part in the evolution of the topography, with solution-removal predominating on the<br />
anticlines. The synclines were also affected by tension, but modified by confining com-<br />
pression, so that here shear joints at about 45" to the axial piane of the fold are to be<br />
expected. Thrusting itself marks a relief of stress, and there would seem to be no special<br />
jointing or fissuring in the overriding block; the entrainment of the underlying rock<br />
often produced breccias which are weil-exposed at certain types of springs; but the<br />
spring occurs not because of the breccia, but because of the presence (possibly hidden)<br />
of the impermeable formation underlying the trust and brecciated allochtonous bed.<br />
Maximum fissuration is found in and close to the faults, though on surface exposures<br />
this is difficult to verify due to secondary deposition and coatings. Likewise, the sur-<br />
face traces of the faults, especially the younger faults, are marked by sharp topogra-<br />
phical differences, and fault scarps and cliffs are general, and indeed almost universal<br />
at the edges of such graben-type valleys as that of Amphissa in Parnassos and of Spilo-<br />
dhas in Argos.<br />
II. CARBONATE FISSURES AS REACTIVE WATER CONDUITS<br />
The characteristic feature of openings in carbonate rocks is the ability of their sur-<br />
faces to react with the water (more acurately with the bicarbonate anion of the water)<br />
which moves through them. Karstification is produced by the solution of the carbonate<br />
rocks in the waters which come in contact with them; the rate of solution is influenced<br />
primarily by the amount of water and its content of dissolved carbon dioxide, and to a<br />
lesser extent by the pureness of the carbonate rocks, temperatures and the amount of<br />
material already in solution. And while the enlargement of the openings and the disso-<br />
lution of the surfaces of the carbonate rocks is the typical karst phenomenon, the repre-<br />
cipitation of the dissolved bicarbonates can lead to the filling or sealing of openings;<br />
to this refilling, deposition of solids in suspension (as red clay, organic debris etc.) may<br />
also contribute.<br />
Within the fissures of the carbonate rocks, two types of cavity solution and cavity<br />
enlargement have been distinguished; they are important both in the study of the<br />
groundwater circulation and in groundwater development.<br />
Vertical Enlargement, where the water in the fissures is moving downwards from<br />
the zone of infiltration (concentrated or diffuse) to the zone of saturation.<br />
Horizontal Enlargement, where the groundwater meets a barrier of impermeable<br />
rock or the sea-controlled base-level of saturation, and the vertical movement is chan-<br />
ged to a sub-horizontal one.<br />
The dissolution of the carbonate rocks commences at surface, and gives rise to the<br />
typical forms of karst terrains; here also commences an essential feature of karst hydro-<br />
geology-the presence of diffuse and concentrated circulation. Direct infiltration of the<br />
precipitation favours diffuse groundwater circulation, and general enlargement of joints<br />
over a wide area; surface run-off and surface concentration of water leads to concen-<br />
trated groundwater circulation, for the concentrated waters will pass over outcrops of<br />
varying permeability and infiltrate most rapidly into the most fissured zone or point.<br />
In turn,, such localized infiltration will rapidly enlarge th openings, enable local infil-<br />
tration to become unlimited in amount, and so form swallowholes or kathavothres,<br />
down which rivers may flow. Vertical enlargement is associated with such swallowholes,<br />
311
and this is generai in the high areas of Parnassos-Ghiona; but where the surface waters<br />
have been concentrated by an impermeable subsurface formation, horizontal enlarge-<br />
ment may continue underground and such horizontal control affects many of the<br />
kathavethrelocated at the foot of the limestone hills bordering the high plain of Tripolis.<br />
High infiltration and low run-off are characteristic of the hydrology of karst terrains<br />
and it is this high infiltration which place karst formations amongst the greatest reser-<br />
voirs of underground water. For Parnassos-Ghiona, infiltration rates were calculated<br />
by three methods, and the results are of interest; they gave 36.5% infiltration as a mini-<br />
mum (whole area, based on known spring discharge), 51.6 % infiltration (Lilaia spring<br />
data) and 49.5% (Kessler formula of infiltration by months). From the general balance<br />
established for the whole drainage area of 1,774 square kilometres, the figures of Table 2<br />
summarize the estimated water input to the aquifers of Parnassos-Ghiona.<br />
TABLE 2<br />
Summary of ìhe hydrology of ihe different outcrops composing the 1,774 square<br />
kilometres of the Parnassos- Ghiona hydrogeoiogical basin.<br />
Water moaemeni units ure in millions of cubic meters and in percentages.<br />
Hydrolithological Limestone Semi- Flysch<br />
Units aquifer aquifer aquiclude Totals<br />
Areas in km2 1,301.7 224.6 247.7 1,774.0<br />
Precipitation, mm 1,105 1,050 1,112 1,100<br />
Infiltration (M. m3) 651.9 47.1 14.0 713.6<br />
Surface Runoff (M. m3) 51.6 38.0 68.8 158.4<br />
Infiltration 45.2% 20.0 % 5.1 % 36.5%<br />
Surface Runoff 3.6% 16.0% 24.9 % 8.1 %<br />
Evapotranspiration 51.2% 64.0% 70.0% 55.4%<br />
Enlargement of fissures in a predominantely vertical direction is replaced by domi-<br />
nantly horizontal enlargement when the zone of saturation is reached ; underground<br />
rivers replace underground waterfalls. The zone of saturation may overlie either an<br />
impermeable surface or a saturation base controlled by sealevels. In Greece, this im-<br />
permeable surface was often the flysch upholding a nappe in the overlying and usually<br />
overthrust limestone, or the crystalline basement whose presence was well-known in<br />
the Tripolis-Argos zone but had to be postulated at depth beneath Parnassos, to account<br />
for the groundwater divide separating flow lo the Lilaia springs from seaward flow to<br />
the Gulf of Gorinth. The form of this buried impermeable surface wil influence strongly<br />
the movement and concentration of the groundwater in the overlying carbonate aquifer.<br />
The form of the interface will reflect in varying degrees the ancient morphology, the<br />
effects of marine transgressions, as well as superimposed tectonic effects, mainly thrus-<br />
ting and faulting. Groundwater circulating in the overlying carbonate rocks wil tend<br />
to concentrate into the subterranean valleys, and concentrated circulation, with the<br />
formation of subsurface streams, flowing in solution caves and giving rise to high-level<br />
karst springs will result. In any attempt to develop groundwater from the karst in such<br />
areas, a determination of the form of the impermeable surface upholding the nappe is<br />
necessary.<br />
The form of the groundwater nappe upheld above the zone of saturation due to the<br />
presence of the sea is very different. In Greece, the sea may be said to be universally<br />
present, and this applies to all the karst formations which come down to the coasts<br />
312
(Aronis, 1962). Without going into the groundwaterjseawater mixing problems, the<br />
sweet water nappe upheld by seawater in the coastal zone has certain characteristics of<br />
its own which distinguish it from the high-level nappes. The upholding surface is essentially<br />
horizontal, and zones of preperred and concentrated circulation are determined<br />
by the fissuration-permeability of the carbonate aquifer and not by the form of the<br />
upholding surface. As a result, a diffuse nappe appears to be general in the coastal karst<br />
aquifers, and ali the 18 boreholes sunk in the Amphissa-ltea coastal zone of Parnassos-<br />
Ghiona encountered groundwater in the limestones. Again, the upholding medium is<br />
fluid, and will deform under pressure. When the groundwater in storage increases<br />
rapidly after the winter infiltration, not only does its level rise rapidly (as in borehole<br />
No. 2/61 where static water level rose by 50 meters between 25/9/62 and 3/3/63), but<br />
there are strong indications that the interface sinks, so that the groundwater reservoir<br />
swells like a balloon. This is evidenced by the steady discharge of springs outflowing<br />
over this interface-they have a very steady discharge and are not typically karstic<br />
in this respect. Thus, the Lerni Spring at Myloi at 1.5 metres above the level of the sea<br />
and some 500 metres from the Bay of Argos varied from a maximum of discharge of<br />
1,4941itres per second to a minimum of 1,0101itres per second throughout 1962, where<br />
as the Kefalari of Erasinos, at an elevation of 23.8 metres above sea-level, and some<br />
six kilometres away, varied from a maximum of 3,933 litres per second to nil flow over<br />
the same twelve-month period.<br />
The concentration of the new groundwater over the upper surface of the zone of<br />
saturation means that maximum dissolution of the carbonate rock will tend to take<br />
place over a planar surface sloping gently to the sea. If there are zones of concentrated<br />
circulation at certain lines along this sheet of high solution, then long caves and tunnels<br />
wil be formed, which however will continue to lie in the main plane of general dissolution.<br />
Collapses of such caves may often reach surface, and the dolinas of Itea-Galaxidion<br />
are typical of such collapses.<br />
Had sea-level remained constant throughout the Quaternary, and had there been<br />
no relative movement and block tilting of the land with respect to the sea due to tectonic<br />
causes, then the subsurface plane of maximum karst solution in coastal areas<br />
would have remained constant and would form a single plane through any one area.<br />
In fact, the eustatic changes in sea-level associated with the advance and retreat of the<br />
glaciers and the ice-caps have produced some three or four different planes of karst<br />
dissolution. In Greece, this has been further complicated by faulting and by block tilting;<br />
the whole Peloponnesus is sinking in the south and rising in the north-with Kefalari<br />
inland spring at + 23.8 metres, the Myloi spring group at about + 1.5 metres, with<br />
Ay. Georgios of Kiveri at sea-level and at -5 metres, and with the great Anavolos of<br />
Astros at -72 metres, one wonders if their differences of elevation are due to such tilting<br />
and if they originally were at a single horizon before tilting commenced?<br />
The permeability and the transmissibility (T) of the karst aquifers is strongly affected<br />
by the existence of these zones of concentrated karstification. The data from 17 completed<br />
(out of 20 commenced) test-pumpings made at increasing depths on the six fullsize<br />
exploratory horeholes sunk in the Amphissa-ltea area of Parnassos shed much light<br />
on the different permeability of the carbonate aquifers at different horizons. Transmissibility<br />
was calculated by the modified non-equilibrium Theis-Jacob formula, based<br />
on recovery data; the results are given in Table 3.<br />
Tritium tracers were used in the Argos-Tripolis region in 1961 and 1962. Their prime<br />
purpose was to determine which kathavothies on the eastern side of the high-level Plain<br />
of Tripolis fed which coastal or submarine spring on the western border of the Plain<br />
and Bay of Argos. They established that the Parlheni kathavothres fed the Binikovi<br />
spring (with some over-year storage), while the Nestani kathvothres was shown to feed<br />
the Ay. Georgios of Kivori coastal spring. Data was also obtained on flow rates, and<br />
is summarized in Table 4.<br />
313
TABLE 3<br />
Transmissibilities of three forms of aquifer in the carbonate rocks of Amphissa-Itea,<br />
as determined by test-pumpings;<br />
data from aquifer feeding Myloi springs of ltea for comparison<br />
Transmissibility-O. 183 X Q/Aà lit./sec./metre width aquifer<br />
Bore- Test<br />
hole Number General diffused Intermediate True Karstified<br />
Nappe Nappe Horizons<br />
1/61 First 0.0214 - -<br />
Second 0.0256 - -<br />
2/61 First 0.0298 - -<br />
Second -<br />
3/61 Third -<br />
- 2.1731<br />
- 2.6049<br />
4/61 First 0.0193 . - -<br />
Second 0.0116 - -<br />
Third 0.0101 - -<br />
5/61 First - O. 1507 -<br />
Second - 0.1611 -<br />
Third - 0.0907 -<br />
Fourth - - 1.0652<br />
Fifth - - 1 .O845<br />
Sixth - - 1.4820<br />
1/62 First 0.0116 - -<br />
Second 0.0175 - -<br />
Third - - 1.9375<br />
Averages 0.01 84 0.1408 1.7245<br />
Transmissibility of Jurassic aquifer feeding Myloi springs-0.75 to 1 .O0<br />
Tritium introduced at<br />
Elevation<br />
Date<br />
Tritium recovered at<br />
Elevation<br />
First Trace<br />
Peak<br />
Residual to<br />
Second Trace<br />
Maximum Flow Rate<br />
Peak Flow Rate<br />
Gradient<br />
3 14<br />
TABLE 4<br />
Data on flow rates in the karst aquifers<br />
between the Plain of Tripoli and the sea-coast of Argos<br />
~~ ~~<br />
Partheni Nestani<br />
642 metres 636 metres<br />
23/3/1961 5/2/1962<br />
Bini kovi Kiveri<br />
282 metres Sea level<br />
2/41 1961 11/2/1962<br />
5/41 1 96 1 13/2/1962<br />
October 1961 21/2/1962<br />
June 1962 Not observed<br />
~ ~ ~~<br />
420 m/day 4,500 m/day<br />
320 m/day 3,400 m/day<br />
1 in 11 I in 42
111. RESEALING OF OPENINGS IN CARBONATE ROCKS<br />
Carbonate rocks at or close to the surface of the earth show a remarkable ability to<br />
fill and seal any opening which may appear in them. This applies not only to joints<br />
and fractures, which so often are now represented by lines of white calcite crice-<br />
crossing the grey limestone or dolomite, but even by the way in which limestone talus<br />
debris quickly cements itself and begins to form into angular conglomerate or cemented<br />
breccia. This resembles in many ways the primary lithification of the carbonate rocks,<br />
in which what was once an open permeable porous collection of corals, shells or limes-<br />
tone gravel has been converted into a solid impermeable biohermal, cocina or cal-<br />
carenite limestone. The cementing material must have been obtained by dissolution of<br />
carbonate material somewhere else; large scale dissolution and equally large-scale<br />
precipitation of the carbonate minerals is a basic phenomenon of karstic terrains.<br />
The mode of reprecipitation can shed light on past hydrogeological conditions.<br />
Precipitation from supersaturated circulating solutions tends to produce large well-for-<br />
med crystals, drusy cavities, cockccomb and related structures, all with with coarse<br />
crystallisation. Such precipitation takes place in fissures which were filled as they lay<br />
below the water-table. The fine-grained crystallization of stalagmites and stalactites<br />
and of many forms of crusts and coatings takes place by evaporation of the water and<br />
the precipitation of the dissolved solids. Hence such fillings have been deposited at a<br />
water-gas surface and were formed in openings not normally filled with water and so<br />
lying above the water-table.<br />
Though terra rossa and other insoluble material may represent but 2% of the orig-<br />
inal carbonate rocks, nevertheless it is an effective infiller of joints and crevices of karsti-<br />
fied limestone outcrops. Such infilling retards infiltration and promotes surface runoff<br />
and surface concentration of the water; organic debris in the clay infilling must increase<br />
the carbon dioxide content of the infiltrating water. Whileclay, silt and sand are washed<br />
through the larger openings, these in turn are liable to be blocked by reeds, shrubs,<br />
branches and even whole trees swept down and engulfed by the gaping fissures into<br />
which dissolution by the waters have enlarged the original small fractures.<br />
IV. MIXING OF GROUNDWATER AND SEAWATER IN KARST AQUIFERS<br />
The penetration of sea water for long distances inland through the openings in the<br />
karstified carbonate rocks is one of the most striking of all karst phenomena in Greece,<br />
and one which lies at the root of most of the difficulties of developing and using the<br />
abundant sweet groundwater held in these same aquifers.<br />
It is necessary to be able to know with certainty when even a very minute amount of<br />
sea water makes its appearance in these waters, and in Greece the amount of chlorine<br />
present was found to be truly diagnostic of the presence or absence of sea water; and<br />
to have the advantage of being determined readily.<br />
For Greece, it may be accepted that pure limestone water contains less than 20 ppm<br />
of chlorine; since the sea water of the Bay of Argos was found to contain 22,520 ppm<br />
of CI, a mixing of as little as O. 1 % sea water with 99.9 % sweet water would result in a<br />
mixture with some 23 ppm of chlorine andso above that defining sweet water. The prob-<br />
lem is not simple, since in coastal areas, precipitation tends to be higher in chlorine,<br />
and so excess chlorine in coastal groundwaters could be due to local infiltration. The<br />
different ratios of the sulphur isotopes S32 and S34 in sea water and in rain water would<br />
help to resolve this difficulty; some samples were taken in Parnassos but no results<br />
were returned from the laboratory. Hanshaw et al (1965) have recently reported posi-<br />
tive results using carbon-14 to disprove marine contamination in a coastal aquifer.<br />
The fact that sea water is an almost universal component of coastal and drowned<br />
springs issuing from the karst aquifers of the circum-Mediterranean countries means<br />
315
TABLE 5<br />
Chemical composition of groundwater (ppm) in carbonate aquifers<br />
of the circum-Mediterranean countries knouin to be free of any contamination<br />
by sea-water; Jisures for Languedoc are maxima<br />
Country and Aquifer<br />
Morocco - Georgian Limestone<br />
Morocco - Liassic Limestone<br />
Morocco - Turonian Limestone<br />
Syria - Jurassic Limestone<br />
Syria - Mid. Cret. Limestone<br />
Syria - Tertiary Limestone<br />
Cyprus - Hilarion Limestone<br />
Yugoslavia - Coastal Limestone<br />
France - Limestones of Languedoc<br />
Greece - Parnassos-Ghiona L’ste.<br />
Greece - Argos-Tripolis L’ste.<br />
c1 -<br />
180<br />
35<br />
78<br />
37<br />
12<br />
12<br />
17<br />
15<br />
18<br />
12<br />
9<br />
15<br />
N.D.<br />
153<br />
230<br />
248<br />
-<br />
21 5<br />
232<br />
-<br />
21 1<br />
193<br />
SOS<br />
34<br />
13<br />
112<br />
18<br />
54<br />
21<br />
-<br />
18<br />
10<br />
10<br />
12<br />
Ca Mg - I_<br />
77 43<br />
58 36<br />
75 46<br />
48 24<br />
58 25<br />
55 13<br />
-<br />
88<br />
60<br />
49<br />
63<br />
3<br />
20<br />
14<br />
3<br />
NatK<br />
5<br />
49<br />
23<br />
11<br />
19<br />
19<br />
that sea water must flow inland if it is to continue to reappear mixed with the continental<br />
waters of these springs. In generai, such flow of sea water into the openings of<br />
the karst aquifers takes place below sea level. Thus, for the great Almiros spring of<br />
Crete, with some 5 to 20% sea water contamination according to the season, it is reported<br />
that there are two swallow holes in the sea-floor off the mouth of the Almirors river<br />
and that when the sea is calm, vortices can be seen as the sea water is sucked into the<br />
openings (Burdon and Papakis, 1964). Skin-divers have reported movement of sea<br />
water into the fissures of the Vougliameni collapse structure to the south of Athens.<br />
The most striking example of such inland movement of the sea takes place on the Vinaria<br />
peninsula near Argostolion on the island of Kephalonia. Sea water flows inland and<br />
disappears down s-allow-holes in the karst limestone of which the peninsula is composed.<br />
The flow was sufficient to work at least two mills, which were destroyed in the<br />
earthquake of 1953 and have not been reconstructed. The uniqueness of this famous<br />
occurrence lies not in the fact that sea water flows into the land, but in the fact that it is<br />
seen to flow into the land. Such inflow normally occurs on the sea-floor and at some<br />
distance from the shore; at Argostolion, the Vinaria peninsula provides a spit of land<br />
at the zone in the groundwater/sea water interface where such inland movement of sea<br />
water takes place. The “Zone-of-Mixing” hypothesis (Bonnier et al., 1963) has been<br />
advanced to account for the phenomenon.<br />
Finally, it must be accepted that different rates of flow of water in conduits of varying<br />
cross-secticn and frictional resistance, as well as the isolation or semi-isolation<br />
of such conduits Bom the surrounding carbonate rock of low or even nil pcrineability,<br />
means that the interface between the overlying fresh water and the heavier underlying<br />
brackish water is so irregular in karstic coastal aquifers as to constitute not an interface,<br />
but a zone of mixing, where sweet water may be encountered at different depths<br />
with different rates of flow to borehole or well. The samples obtained under different<br />
static and dynamic conditions from the groundwater out by the 14 boreholes drilled<br />
in the Amphissa-Itea area yielded no consistent results on the sea water/groundwater<br />
interface: provided + 100 ppm of chlorine be accepted as certain evidence of marine<br />
contamination, sea water has penetrated as far inland as nine kilometers (boreholes<br />
2/61 and C.D. 1/61), and was noticed even when static water level there was as high as<br />
62 metres above sea level, on 3 March, 1963.<br />
316<br />
-<br />
14<br />
6<br />
10<br />
5
SELECTED REFERENCES<br />
(l) AMBROGGI, R., ARCHAMBAULT, J., BURDON, D.J., RICHARDSON, R., and WAG-<br />
NER, R. (1958), “Investigation of Groundwater Resources in Karstic Limestones,<br />
with Special Reference to Greece” FAO Report FA0/59/8/6114.<br />
(2) ARONIS, G. (1962), “Observations on the Coastal Karst of Greece”, Mein. Inter.<br />
Assoc. Hydrogeologistts, tome V, pp. 256-265.<br />
(3) BONNIER, A., BURDON, D.J. and TSCHELTZOFF, O. (1963), “Sea Swallow Holes of<br />
Kephalonia: The Zone-of-Mixing Hypothesis”. Inst. Geol. ana Subsurface Res.,<br />
March Meeting.<br />
(4) BURDON, D.J. and PAPAKIS, N. (1961), ‘‘ Methods of Investigating the Groundwater<br />
Resources of the Parnassos-Ghiona Limestones”, Inter. Assoc. Sci. Hydro., vol. 51,<br />
pp. 143-159.<br />
(9 BURDON, D.J. and PAPAKIS, N. (1963), “Handbook of Karst Hydrogeology, with<br />
Special Reference to the Carbonate Aquifers of the Mediterranean Region”, Inst.<br />
Geol. and Subsurface Res.. Athens: mimeo u. 276.<br />
BURDON, D.J. aRd PAPAKIS, M. (1963), “The Karst Groundwater Resources of<br />
Parnassos-Ghiona Greece”, Inst. Geol. and Subsurface Res., Athens; mimeo p. 301<br />
plus appendices.<br />
BURDON, D. J. and PAPAKIS, N. (1964), “Preliminary Note on the Hydrogeology<br />
of the Almiros Spring, Iraklion, Crete”, Inst. Geol. and Subsurface Res., vol. IX,<br />
NO. 3, pp. 125-144.<br />
BURDON, D. J., ERIKSSON, S.,PAYNE, B. R., PAPADIMITROPOULOS, T. and PAPAKIS,N.<br />
(1963), “The Use of Tritium in Tracing Karst Groundwater in Greece”, Radioisotopes<br />
in Hydrology, pp. 309-320, Inter. Atomic Energy Agency.<br />
DIMITROULAS, C., PAPADIMITROPOULOS, T. and PAPAKIS, N. (I 962), “ Groundwater<br />
Investigations by the Use of Neutron Activation Analysis”, Mem. Inter. Assoc.<br />
Hydrogeologists, tome V, pp. 83-103.<br />
HANSHAW, B. B., BACK, W., RUBIN, M. and WAIT, R. L. (1965), “Relation of Carbon<br />
14 Concentrations to Saline Water Contamination of Coastal Aquifers”,<br />
Water Resources Research, vol. I, pp. 109-114, Amer. Geophy. Union.<br />
PAPASTAMATIOU, J. (1960), “La Géologie de la Région Montagneuse du Parnasse-<br />
Khiona-Oeta” Bull. Soc. Géol. de France, Ser. 7, t. II, pp. 398-409.<br />
PICARD, L.(1956-1958),“ Development of Underground Water Resources in Greece”<br />
-Five Repqrts. United Nations Tech. Ass. Prog., TAA/GRE/S.<br />
-, (19641, Karst Groundwater Investigations-Greece”, Final Report of the<br />
UNSF/FAO Project; 64/E/12364; mimeo, p. 99, plus maps, FAO, Rome.<br />
317
DIRECTIONAL HYDRAULIC BEHAVIOUR OF<br />
A FRACTURED-SHALE AQUIFER IN NEW JERSEY<br />
ABSTRACT<br />
John VECCHIOLI, Geologist<br />
U. S. Geological Survey, Trenton, N. J.<br />
The principal source of ground water throughout a large part of central and<br />
northeastern New Jersey is the .aquifer in the Brunswick Shale-the youngest unit<br />
of the Newark Group of Triassic Age. Large-diameter public-supply and industrial<br />
wells tapping the Brunswick Shale commonly yield several hundred gallons per minute<br />
each. Virtually ail ground water in this aquifer occurs in interconnecting fractures;<br />
the formation has practically no effective primary porosity.<br />
Numerous pumping tests have shown that the aquifer exhibits directional, rather<br />
than isotropic, hydraulic behavior. Water levels in wells alined along the strike of the<br />
formation show greater magnitude of interference than those in wells alined in trans-<br />
verse directions. Drawdown data evaluated by standard time-drawdown methods<br />
indicate computed coefficient of transmissibility in all cases is least in the direction<br />
of strike. Because of the distribution of observation wells available for the tests,<br />
distance-drawdown methods of evaluation could be used in only one instance-for<br />
just one direction; the computed coefficient compared favorably with that calculated<br />
from the time-drawdown method.<br />
Computed values of transmissibility may be unreliable owing to the departure of<br />
the aquifer from the ideal model. It is even possible that the direction of minimum<br />
computed transmissibility is actually indicative of the alinement of fractures with<br />
greatest permeability. However, the relation of the directional behavior to the structure<br />
of the formation has practical significance when locating new wells near existing wells.<br />
Well interference can be minimized, generally, by alining wells perpendicular to the<br />
strike.<br />
RESUME<br />
Comportement hydraulique directionnel d’un aquifëre situé dans les schistes fissurés du<br />
New Jersey<br />
La principale source d‘approvisionnement en eaux souterraines d’une grande<br />
partie du centre et du nord-est du New Jersey est l’aquifère situé dans les schistes<br />
de Brunswick; il s’agit de l’unité la plus jeune du groupe de Newark, d’âge triasique.<br />
Des puits à grand diamètre ont été forés pour les besoins des services publics et de<br />
l’industrie dans les schistes de Brunswick; chacun débite couramment plusieurs<br />
centaines de gallons par minute (I gallon = 3,785 1). Presque toute l’eau de cet aquifère<br />
se trouve dans des fractures reliées entre elles; la formation n’a pratiquement aucune<br />
porosité primaire réelle.<br />
De nombreux tests de pompage ont montré que l’aquifère a un comportement<br />
hydraulique directionnel plutôt qu’isotrope. Le niveau des puits alignés suivant la<br />
direction de la formation accuse des interférences de plus forte amplitude que le niveau<br />
des puits alignés perpendiculairement à la formation. Les données relatives au rabatte-<br />
ment de la nappe, calculées seton tes méthodes habituelles de mesure de rabattement<br />
en fonction du temps, montrent dans tous les cas que c’est-parallèlement ala direction<br />
des couches que le coefficient de transmissivité obtenu est le plus faible. Etant donné<br />
l’implantation des puits qu’il était possible d’utiliser pour les tests, les méthodes de<br />
mesure du rabattement de la nappe en fonction de la distance n’ont pu être appliquées<br />
qu’une seule fois, pour une seule direction: mais le coefficient obtenu se comparaît<br />
avantageusement avec celui qui avait été évalué par la méthode de mesure du rabat-<br />
tement en fonction du temps.<br />
I1 se peut que les valeurs ainsi obtenues de la transmissivité ne soient pas sùres en<br />
raison des différences existant entre I’aquifere réel et le schéma théorique. I1 est même<br />
possible que la direction de la transmissivité minimale obtenue soit effectivement<br />
révélatrice de l’alignement des fractures de la plus forte perméabilité. Cependant,<br />
le rapport existant entre le comportement directionnel et h structure de la formation<br />
a une importance pratique lorsqu’il s’agit de forer de nouveaux puits au voisinage des<br />
puits déjà existants. Les interférences entre les puits peuvent généralement être réduites<br />
par l’alignement des puits perpendiculairement à la direction des couches.<br />
318
INTRODUCTION<br />
Throughout much of the heavily populated central and northeastern part of New<br />
Jersey, the principal source of ground water is the aquifer in the Brunswick Shale.<br />
Indeed in many places it comprises the only source. The Brunswick Shale is tapped by<br />
numerous large-diameter public-supply and industrial wells, many of which have<br />
sustained yields of several hundred gpm (gallons per minute). Most of the high-capacity<br />
wells penetrate between 200 to 500 feet of rock.<br />
The Brunswick Shale is the youngest unit of the Newark Group which is of Late<br />
Triassic (Keuper) age. The Newark Group crops out in a broad northeast-trending belt<br />
across northern New Jersey (fig. i). It is more than 10,000 feet thick and consists of<br />
shale, sandstone, argillite, conglomerate, and basalt. In the western part of the outcrop<br />
41'<br />
40<br />
30<br />
75 74 "30' 74 o<br />
I 1 I<br />
6 TRENTON<br />
I I l<br />
5 O 5 10 15 20 MILES<br />
t--<br />
Fig. 1 - Map showing outcrop area and structure of the Newark Group in northern<br />
New Jersey (igneous rocks in black), and pumping-test sites.<br />
area in New Jersey, the Newark Group consists, from oldest to youngest, of the fol-<br />
lowing three units (Kümmel, 1897): Stockton Formation, chiefly sandstone; Lockatong<br />
Formation, mainly argillite; and Brunswick Shale. Diabase sills and dikes have intruded<br />
the Newark Group in this area. From New Brunswick northeastward, except for a<br />
narrow exposure of Stockton Formation flanking the Palisade Sill (diabase) along the<br />
State's eastern boundary, the Newark Group consists entirely of Brunswick Shale<br />
interlayered with Watchung Basalt. The Brunswick Shale is by far the thickest and<br />
3 19
most extensive unit of the Newark Group. Deposits of till and stratified drift of the<br />
Wisconsin Stage of the Pleistocene Epoch mantle the Newark Group throughout the<br />
area northeast of New Brunswick.<br />
Lithologically, the Brunswick Shale is mostly a soft red shale with some interbedded<br />
sandstone. The sandstone layers become more abundant and, on the whole, somewhat<br />
coarser toward the northeast, particularly near the northern State line.<br />
The structural trend of the Newark Group is shown by the outcrop pattern of the<br />
generally concordant igneous rocks (fig. 1). The dominant strike is northeastward<br />
with dips ranging from 5” to 15” NW., but locally the strike of the sedimentary rocks<br />
differs markedly from the regional trend. Faulting has caused more complex structure<br />
locally, particularly in the western part of the belt.<br />
Virtually all ground water in the Brunswick Shale occurs in interconnecting fractures<br />
that have resulted from jointing. This phenomena was recognized by Knapp (1904)<br />
where he states.. . “While our knowledge of the Newark beds is not sufficiently detailed<br />
to enable us to forecast the chances of obtaining artesian water at any given point,<br />
or even to assure us that well-defined water-bearing horizons exist, yet experience<br />
shows that a moderate supply of water can usually be obtained anywhere in these beds<br />
at depths of a few hundred feet at most. The fact that the rocks of the Newark system<br />
are thoroughly cut up by several systems of deeply penetrating joints, whose planes<br />
approach the vertical and intersect at various angles, and the further fact that in many<br />
wells the amount of water increases gradually with depth of the boring, apparently<br />
indicates that the water is present more largely in these joints and fissures than in any<br />
well-defined porous water-bearing beds. This inference is supported by observations<br />
made in several long tunnels in the red shale, where frequent streams of water were<br />
found following vertical fissures, while the bedding planes were nearly dry and no<br />
porous layers were observed. ”<br />
Observations of joint set orientation made by the author at Newark and New<br />
Brunswick, by Anderson (private communication, 1963) near Linden, and by Nichols<br />
(private communication, 1964) near Flemington indicate that one set of vertical joints<br />
roughly parallels the strike of the rocks, whereas a second set is generally perpendicdar<br />
to the strike. In places steeply dipping joints transverse to the aforemcntioned<br />
two occur. In addition, bedding piane joints are common in surface exposures. Major<br />
and minor faults also occur in the rocks of the Newark Group, with most of the faults<br />
trending largely northeastward.<br />
HYDRAULIC BEHAVIOR<br />
Regionally, water-table conditions prevail in the Brunswick Shale, but artesian<br />
conditions occur locally where marked differences exist in the vertical permeability<br />
of the formation. Artesian conditions exist also in some lowland areas where the<br />
Brunswick is overlain by relatively impermeable till or lacustrine clay and silt.<br />
Data collected during numerous pumping tests of wells throughout the outcrop<br />
area indicate that the aquifer in the Brunswick Shale possesses directional, rather than<br />
isotropic, hydraulic properties. In describing two pumping tests made in Newark,<br />
Herpers and Barksdale (i951) report that all the wells that were observed to affect<br />
one another lay along lines trending in a generai northeasterly direction. Similar<br />
effects were noted by Anderson íprivate communication, 1961) during pumping tests<br />
conducted at Linden. He found that in an observation well one mile northeast of a<br />
pumped well the water level dropped six feet within two hours of pumping, whereas<br />
pumping at higher rates from other wells located closer to but in different directions<br />
from the observation well had less of an effect on the water level in the observation<br />
well. At both Newark and Linden, the strike of the Brunswick Shale is N 45” E-the<br />
direction of most pronounced well interference.<br />
320
Similar effects have been observed in the central and western part of the outcrop<br />
area. After 24 hours of pumping of a well in New Brunswick, the water level in an<br />
observation well located 500 feet away directly along strike was lowered 87 feet,<br />
whereas that in another observation well located only 280 feet away but in a direction<br />
30" from strike was lowered only 50 feet. Miller (private communication, 1965) reports<br />
that north of Trenton prolonged pumping of a high-capacity well adversely affected<br />
domestic wells about a mile distant along strike but other wells located equidistant in<br />
transverse directions were affected less. At the end of a 48-hour pumping test of a well<br />
near Flemington, the water level in an observation well 1,550 feet away along strike<br />
was drawn down 4.1 feet. The water level in an observation well only 1,200 feet away<br />
but in 3 transverse direction was lowered 3.7 feet.<br />
J<br />
I<br />
/J<br />
New Brunewick<br />
o 200 4oar<br />
u<br />
I<br />
J<br />
Linden<br />
o lo.m z0,ooor<br />
i<br />
Wyckoff<br />
o 5ooo 1o.ooo~<br />
w<br />
Fig. 2 - Directional transmissibilities computed from aquifer tests in the Brunswick<br />
Shale. Strike of formation shown in upper right corner for each site. Transmicsibil-<br />
ity, T, in gallons per day per foot, shown by ladder scale.<br />
Hence, it is obvious that the anisotropic hydraulic behavior of the Brunswick Shale<br />
is not restricted to any particular area. Furthermore, the directional hydraulic behavior<br />
is evidently related to the structure of the formation. In all of the above tests; the wells<br />
alined parallel to the strike of the Brunswick Shale exhibited greatest mutual inter-<br />
ference.<br />
l<br />
321
Because the aquifer behaves anisotropically, the hydraulic characteristics derived<br />
by analyzing pumping-test data by conventional methods are questionable. Further-<br />
more, in all pumping tests that have been run where drawdown observations have been<br />
made in more than one direction, analysis of the data has suggested a smaller apparent<br />
coefficient of transmissibility along strike and a greater one in the perpendicular<br />
direction (fig. 2). This appears to be incongruous with what is generally believed to be<br />
the alinement of the major fracture system.<br />
In all the tests run to date except one, the distribution of observation wells was such<br />
that the data could be evaluated only by use of time-drawdown methods of analysis,<br />
that is, if data from the pumping well are not considered. For the pumping test<br />
conducted at Flemington, it was possible to make a distance-drawdown analysis for<br />
one direction. This test wil be discussed in detail.<br />
O- 2000 feet<br />
Fig. 3 - Map showing location of pumping well (PW) and observation wells (OW)<br />
used in the Flemington, N. J., pumping test.<br />
Flemingion test: The well pumped during this test consisted of a hole 10 inches in<br />
diameter and 300 feet deep of which only the upper 40 feet are cased. A pumping rate<br />
of 500 gpm was maintained continuously for a 48-hour period during which water-level<br />
observations were made on the pumping well, an unused well located 245 feet southeast<br />
of the pumping well, and three domestic wells located 1,200 feet west-northwest,<br />
1,550 feet west-southwest, and 2,350 feet southwest, respectively, of the pumping well<br />
(fig. 3). Water-level measurements were made intermittently on the pumping well<br />
and the domestic wells with an electrical water-level indicator. A continuous record<br />
of the water level in the unused well was obtained prior to, during, and after the<br />
322
pumping period with an automatic water-stage recorder. The specific capacity of the<br />
pumping well at the end of the 48-hour period was 42 gpm/ft. At the test site the<br />
Brunswick Shale strikes N 53" E and dips 25" NW. (Nichols, private communication,<br />
1964).<br />
The stream which traverses the test site apparently was not an effective recharge<br />
boundary. Similarly, a northly trending narrow diabase dike that cuts the Brunswick<br />
Shale about 750 feet east of the pumping well apparently was not an effective discharge<br />
boundary. However, the farthest well observed (OW-4, fig. 3) was located near a tributary<br />
stream and a large pond, and the data from this well suggest some recharge<br />
may have been occurring in this area. Two of the domestic wells were used intermittently<br />
during the test, but the quantity of water withdrawn from them is insignificantly<br />
small compared to the test rate of 500 gpm. The third well, that farthest from the pumping<br />
well, was used intermittently during the first day of the test, but the owner pumped<br />
it continuously during the second day at a rate of about 20 or 30 gpm, thus invalidating<br />
any observations at that well during the last 24 hours of the test.<br />
If a time-drawdown analysis of the data is made (figs. 4 and 5), using the Theis<br />
nonequilibrium formula (Ferris and others, 1962), it is found that the computed coefficients<br />
of transmissibility<br />
i<br />
and storage are, respectively:<br />
Perpendicular Observation well No. 1 - 88,200 gpd per ft; 2.49 x IO-*<br />
strike to Observation well No. 2 - 75,400 gpd per ft; 2.51 x<br />
i<br />
Parallel Observation well No. 3 - 57,300 gpd per ft; 2.51 x<br />
to<br />
strike Observation well No. 4<br />
do. do.<br />
Tf a distance-drawdown analysis of the data is made (fig. 6), using the Theim equilib-<br />
Fig. 4 - Logarithmic plot of time-drawdown data matched to the "Type Curve" for<br />
wells alined perpendicular to strike, Flemington, N. J., pumping test.<br />
323
ium formula (Ferris and others, 1962), it is found that in the direction perpendicular<br />
to strike, the coefficient of transmissibility is about 100,000 gpd per ft-a value which<br />
compares favorably with that given for observation well No. 1 above. As was mentioned<br />
previously, the data from observation well N”. 4 are thought to be affected by recharge;<br />
hence, a distance-drawdown analysis in the direction of strike could not be’ made on<br />
the basis of observed drawdowns. However, if one uses for the drawdown in this<br />
Fig. 5 - Logarithmic plot of time-drawdown data matched to the “Type Curve” for<br />
wells alined parallel to strike, Flemington, N. J., pumping test.<br />
well at the end of one day the value obtained from the “Type Curve” in figure 5 and<br />
the observed drawdown value for observation well No. 3, it is found that the computed<br />
coefficient of transmissibility is about 72,000 gpd per ft. Therefore, both methods of<br />
analyses have yielded comparable pairs of apparent values of transmissibility that are<br />
greatest perpendicular to strike and least parallel to strike.<br />
CONCLUSIONS<br />
That the aquifer in the Brunswick Shale exhibits directional rather than isotropic<br />
hydraulic behavior under pumping conditions is well documented. Furthermore, it<br />
has been demonstrated qualitatively for all parts of the outcrop in New Jersey that the<br />
maximum and minimum directions of anisotropy are related to the structural orien-<br />
tation of the Brunswick. The degree of anisotropy varies from place to place and is<br />
probably indirectly related to the productivity of the aquifer.<br />
The validity of transmissibility values computed by standard methods are question-<br />
able, particularly where the degree of anisotropy is great. Indeed, if one takes the<br />
approach that direct interference in fracture porosity indicates that two wells tap a<br />
single fracture system whereas small drawdown indicate8 poor hydraulic connection<br />
between two wells, then one can conclude that the flow is not equal in all directions<br />
324
and hence that the smaller values of transmissibility indicate the direction of greater<br />
permeability-or the alinement of the major fracture system. A thorough discussion<br />
on the quantitative aspects of transmissibility values computed from pumping tests<br />
in fractured rocks is beyond the scope of this paper. Suffice it to say that extreme<br />
caution must be used when analyzing quantitatively drawdown data in fractured<br />
aquifers.<br />
Distance, in geet<br />
Fig. 6 - Relation of drawdown with distance from pumped well in the direction<br />
perpendicular to strike, Flemington, N. J., pumping test.<br />
Of practical significance, however, is the directional orientation of the hydraulic<br />
anisotropy exhibited by the aquifer. Owing to the apparent relation of the hydraulic<br />
anisotropy to the strike of the Brunswick Shale, it is evident that well interference can<br />
be minimized by alining wells in directions other than parallel to the strike. The local<br />
strike of the Brunswick can be determined readily from geologic maps or by an exami-<br />
nation of outcrops in the area. Finally, it is easy to see how knowledge of the hydraulic<br />
anisotropy of an aquifer can lend considerable insight in the evaluation of existing or<br />
potential ground-water contamination and saltwater encroachment problems.<br />
ACKNOWLEDGMENTS<br />
This paper is an outgrowth of the ground-water investigatory program being<br />
conducted in New Jersey by the U.S. Geological Survey in cooperation with the<br />
State Department of Conservation and Economic Development, Division of Water<br />
Policy and Supply.<br />
The author is grateful to his colleagues in Trenton, N. J. for their critical discussions<br />
and assistance. He is especially thankful to Mr. Henry R. Anderson, geologist, US G S,<br />
Sokoto, Nigeria, who helped formulate early thoughts on this subject during his tenure<br />
in Trenton; however, the author assumes sole responsibility for the conclusions stated<br />
herein.<br />
325
REFERENCES<br />
FERRIS, J.G., KNOWLES, D.B., BROWN, R.H., and STALLMAN, R.W., 1962. Theory<br />
of aquifer tests. 174 p. (U. S. Geol. Survey Water-Supply Paper 1536-E).<br />
HERPERS, H., and BARKSDALE, H.C. 1951. Preliminary report on the geology and<br />
ground-water supply of the Newark, New Jersey, Area, 52 p. (New Jersey Dept.<br />
of Conserv. and Econ. Develop, Special Report IO).<br />
KNAPP, G.N. 1904. Underground waters of New Jersey. Wells drilled in 1903. In:<br />
Annual report of the State Geologist for 1903. New Jersey Geol. Survey. pp. 73-93.<br />
KUMMEL, H.B. 1897. The Newark System: report of progress. In: Annual report of<br />
the Siate Geologist far 1896. New Jersey Geol. Survey. pp. 25-88.<br />
326
HYDROGEOLOGIE DES FORMATIONS VOLCANIQUES<br />
DU NORD-EST DU MAROC<br />
SUMMARY<br />
F. MORTIER, Nguyen QUANG T., M. SADEK(*)<br />
Hydrogeology of the volcanic rock formations of North-East Morocco<br />
In the middle of the Oued Isly basin in Eastern Morocco, Pliocene-Quaternary<br />
basalts and tuffs form a 25 km long conduit for groundwater. Geologic and geophysical<br />
studies established the geologic continuity of the poorly exposed volcanics. Water<br />
well characteristics, water levels and water quality data confirm that the volcanics form<br />
an aquifer. The volcanics conduct groundwater from limestones in the upper part of<br />
the basin, across impervious rocks to the southern Oujda limestones and the Angad<br />
alluvium in the lower end of the basin.<br />
Both gravity and resistivity geophysical surveys were required in order to make<br />
reasonable geologic interpretations in these circumstances.<br />
La région située au Nord-Est du Maroc a fait l’objet, depuis une vingtaine d’années,<br />
d’importants travaux de recherche hydrogéologique: du fait de la pauvreté de cette<br />
région en eaux superficielles, la mise en valeur par irrigation de la grande plaine des<br />
Angad-Oussata et le développement d’Oujda, capitale du Maroc oriental, nécessitent<br />
l’exploitation de ressources en eaux souterraines sans cesse croissantes. Ces travaux<br />
ont mis en évidedce l’importance hydrogéologique des roches volcaniques fissurées.<br />
1. CADRE HYDROGÉOLOGIQUE (FIG. 1)<br />
La région étudiée correspond à la partie orientale du «couloir» Taourirt-Oujda,<br />
limitée au Nord par le massif des Beni-Snassène et au Sud par le domaine des hauts-<br />
plateaux marocains. Elle comprend deux unités principales : au Sud de la plaine<br />
d’Oussata (Beni-Oukil), de Guenfouda jusqu’aux abords d’Oujda, et au Nord-Est la<br />
plaine des Angad, d’Oujda à la frontière algéro-marocaine.<br />
1.1. Géologie<br />
Dans une perspective hydrogéologique, le trait dominant de la géologie de la rkgion<br />
est la présence, à sa limite sud, des Monts de Touissit-Bou Beker : ceux-ci forment une<br />
zone de horsts et grabens à larges affleurements de calcaires karstifiés et de dolomies<br />
d’âge Liasique. La qualité de J’aquifère, sa tectonisation, sa position à haute altitude<br />
donc soumise à une forte pluviométrie, font de ces massifs le véritable château d’eau<br />
de la région.<br />
Les calcaires du Lias ont été retrouvés, par forages profonds, au Sud d’Oujda et<br />
dans la plaine des Angad. Mais il ne semble pas qu’ils soient là en liaison directe avec<br />
les zones d’affleurements calcaires du haut bassin.<br />
Au-dessus, on trouve successivement une épaisse série de marnes miocènes, des<br />
formations volcaniques du Plio-Quaternaire, et enfin des formations alluviales et<br />
lacustres du Quaternaire.<br />
Les formations volcaniques sont disposées en forme d’une coulée, grossièrement<br />
N. S., de plus de 22 km de long : elles commencent à affleurer à Guenfouda, disparaissent<br />
* Le travail, objet de cette note, a été effectué dans le cadre du Service des<br />
Ressources en Eau de l’Office National des Irrigations du Maroc.<br />
327
328
en grande partie dans la plaine d’Oussata sous les formations récentes du Quaternaire,<br />
et réaparaissent en surface dans la région de l’oued Nachef au Sud-Ouest d’Oujda.<br />
On les retrouve dans un grand nombre de puits et forages dans la partie Sud de la<br />
plaine des Angad.<br />
1.2. Hydrologie superficielle<br />
Le bassin versant de l’oued Isly, dans son cours moyen et inférieur, recouvre en<br />
partie la région étudiée. Au «goulet» de Guenfouda, son débit permanent de base<br />
est évalué à 200 I/s; ce. débit correspond au drainage superficiel des formations volvani-<br />
ques qui obstruent le goulet; ces formations volcaniques sont elles-mêmes alimentées<br />
latéralement par la «nappe» des calcaires du Lias des Monts de Touissit-Bou Beker,<br />
avec un débit très probablement beaucoup plus important.<br />
Vers le Nord, suivant les portions, le cours de l’oued Isly draine ou alimente la<br />
nappe phréatique.<br />
1.3. Les différentes nappes aquifères de la région étudiée<br />
Les marnes miocènes constituent le substratum imperméable d’une nappe phréati-<br />
que parfaitement connue dans la plaine des Angad et sans doute reliée sans<br />
discontinuité à celle de la plaine d’Oussata en amont. Cette nappe circule soit dans<br />
les formations alluviales et lacustres du Quaternaire, soit dans les formations<br />
volcaniques du Plio-Quaternaire.<br />
D’autre part, les marnes miocènes servent de toit imperméable à la nappe<br />
profonde des calcaires du Lias de la plaine, qu’elles mettent en charge. Cette nappe<br />
a été reconnue et exploitée dans les secteurs du Jebel Hamra et de l’oued Nachef,<br />
dans la banlieue Sud de la ville d’Oujda. Son débit, y compris celui de la source de<br />
Sidi-Yahya, semble très supérieur au débit d’alimentation par la pluie sur les seuls<br />
affleurements calcaires du Jebel Hamra.<br />
2. HYDROG~OLOGIE<br />
DES FORMATIONS VOLCANIQUES<br />
De nombreux travaux ont été entrepris pour reconnaître le véritable rôle<br />
hydrogéologique de la coulée de formations volcaniques plio-quaternaires dénommée<br />
Guenfouda-Oued-Nachef. I1 est en effet vite apparu que la nature pouvait avoir<br />
réalisé une «conduite» particulièrement perméable entre d’une part les exutoires<br />
probables d’un arrière-pays calcaire formant château d’eau et d’autre part une nappe<br />
aquifère qui conditionnait le développement de la plaine des Angad et de l’agglomération<br />
urbaine d’Oujda.<br />
2.1. Lithologie<br />
Les formations volcaniques comprennent essentiellement des basaltes noirs compacts<br />
ou plus ou moins fracturés, des cinérites à porosité variable et affectées ou non de<br />
fissures, des conglomérats i éléments varies enrobés dans un ciment de cendre<br />
volcanique friable. Toutes les fissures sont tapissées de calcite de néoformation.<br />
L’épaisseur de l’ensemble de ces formations est variable, pouvant atteindre 200 m.<br />
2.2. Travaux de reconnaissance<br />
2.2.1. Géophysique<br />
Les campagnes de géophysique effectuées avaient pour but de déterminer la forme<br />
exacte de la coulée volcanique, sa continuité et l’allure de son mur, autrement dit son<br />
3 29
contact avec les marnes imperméables du Miocène et, éventuellement avec les calcaires<br />
et dolomies du Lias.<br />
Le succès d’une campagne de géophysique de reconnaissance des formations<br />
volcaniques dépend à la fois de la composition de ces formations et du contraste<br />
qu’elles présentent avec les formations encaissantes. Or, dans le cas présent, les<br />
nombreuses roches en présence ont souvent des caractéristiques physiques assez<br />
semblables, ce qui rendait à priori leur distinction difficile.<br />
Deux méthodes furent utilisées successivement : En gravimétrie, la difficulté venait<br />
de la similitude des densités du basalte et du calcaire, environ 2,7, et de celles des<br />
cinérites et de marnes, environ 2,l. Dans l’interprétation on a admis une densité<br />
globale de 2,5 pour les formations volcaniques étant donné l’alternance de basaltes<br />
et de cinérites. OP a pu ainsi déterminer six zones d’anomalie résiduelle négative, qui<br />
pouvaient être interprétées comme des chénaux du substratum miocène comblés par<br />
les roches volcaniques de la coulée. Du point de vue hydrogéologique, ces zones<br />
correspondent au remplissage maximum de l’aquifère volcanique. Cette interprétation<br />
fut confirmée partiellement par les forages.<br />
Une campagne de prospection électrique fut effectuée sur une superficie limitée,<br />
située à l’Ouest de l’anticlinal liasique du Jebel Hamra; elle avait pour but de déterminer<br />
les zones de contact direct entre les formations volcaniques et les calcaires du<br />
Lias du Jebel Hamra, c’est-à-dire les zones de relais hydraulique possible entre la nappe<br />
captive du Jebel Hamra et la coulée volcanique. Une difficulté identique iì celle rencontrée<br />
en gravimétrie se présenta : les cinérites aquifères ont une résistivité souvent<br />
équivalente à celle des marnes imperméables. On arriva seulement à déterminer l’allure<br />
du toit du calcaire liasique, avec les principaux accidents qui l’affectent.<br />
2.2.2. Forages<br />
Les premiers forages entrepris d8s 1950 au goulet de Gueafouda même ont montré<br />
l’importance de l’influence des fissures dans les basaltes et cinérites sur les débits<br />
spécifiques obtenus. Implantés à une distance de 200 à 400 m, les uns des autres,<br />
ces forages ont fourni des débits spécifiques variant de 4 l/s/m à 0,7 l/s/m; certains<br />
sont même inférieurs à 0,l l/s/m.<br />
Les forages de reconnaissance effectués dans la région de l’oued Nachef ont<br />
enregistré les venues d’eau les plus importantes au niveau des basaltes altérés et<br />
fissurés et des cinérites poreuses fissurées. Ces niveaux particulièrement perméables<br />
sont aussi décelés d’une façon précise par les courbes de polarisation spontanée et<br />
de résistivité des carottages électriques. Les débits spécifiques obtenus ont atteint<br />
33 i/s/m.<br />
Le forage à la boue peut colmater les fines fissures et exige parfois un traitement<br />
au polyphosphate pour le développement.<br />
2.2.3. Hydraulique souterraine (jig. 2)<br />
Une étude systématique de la nappe phréatique de la plaine des Angad (dont la<br />
partie sud-est en grande partie occupée par les déjections volcaniques de la coulée<br />
Guenfouda - oued Nachef) a permis d’avoir une idée précise sur la transmissivité et<br />
la perméabilité de ce? formations. Les 24 forages de reconnaissance ont été suivis<br />
d’essais de pompage prolongés. Les terrains se classent comme suit :<br />
- Le meilleur aquifère est représenté par les basaltes altérés fissurés et les cinérites<br />
fissurées avec comme valeurs de la transmissivité :<br />
330<br />
1,1.10-’ < T < 3.10-2 m2/s.<br />
et celles de la perméabilité<br />
1,7.10-4 < K < 2.10-3 mjs.
- viennent ensuite les tufs basaltiques et les basaltes compacts peu fissurés<br />
l,2.10-3 G T < 7,5.10-3 m’js.<br />
1,3.10-5 < K < 1,6.10-4 mjs.<br />
Les coefficients d’emmagasinement varient entre 2.10-2 et 7.10-2. Les cinérites<br />
sont le meilleur aquifère, car elles sont dotées à l’origine d’une perméabilité en petit,<br />
laquelle est doublée d’une perméabilité en grand fournie par les fissures.<br />
2.2.4. Rôle des formations uolcaniques dmis l’hydrogéologie rggionale<br />
2.2.4.1. PiémmPtrie. - La carte isopiézométrique de la nappe phréatique montre<br />
une continuité parfaite des aquifères depuis le goulet de Guenfouda, point de passage<br />
obligé des eaux superficielles et souterraines du haut bassin, jusqu’a la région de l’oued<br />
Nachef limite des deux plaines de Beni-Oukil et des Angad.<br />
La convergence des courbes isopiézométriques au Sud d’Oujda et la pente<br />
exceptionnellement faible de la nappe au Nord-Est d’Oujda mettent en évidence<br />
une alimentation importante de la nappe des Angad par la coulée volcanique et le<br />
drainage effectué par les cinérites et les basaltes fissurés à l’intérieur de la plaine.<br />
Ce drainage est confirmé par les résultats des forages de reconnaissance et des puits<br />
et forages d’exploitation, dont les plus riches sont implantés sur l’axe de drainage.<br />
33 1
C9.000 4.0~~8,000 8,000<br />
LEGEND<br />
DIAGRAMME d' apri.<br />
DIANALYSE Dt EAU n SCHOELLER et<br />
N BERUALOFF Fiqurh no<br />
6,000 -.<br />
5 -- 7<br />
6<br />
4-<br />
5<br />
o<br />
3--4 0<br />
3--5<br />
4<br />
2- o<br />
-3 -<br />
e<br />
3- '<br />
678/12<br />
I133/12<br />
50/ 12<br />
742/12<br />
2<br />
o<br />
2<br />
1,000-<br />
9-<br />
4--* .I_-_ -<br />
2- z 3-7 4 -<br />
6 5<br />
5-<br />
4-<br />
-<br />
143/12<br />
&WO -<br />
9-<br />
0-<br />
7--<br />
9<br />
3--<br />
9-<br />
7- 2-- 2<br />
_J<br />
e- 1000<br />
=-- - ' 1,000- t<br />
8 9- +<br />
4-<br />
3-<br />
-<br />
c 0;<br />
2- CO; + ncoi-<br />
7 EuJ<br />
6--8<br />
7<br />
-<br />
a-<br />
6 71<br />
1.ow-<br />
3-- 5 6--1,000 9-<br />
l.000 2<br />
9- u<br />
- IQ00 0 - u*><br />
6<br />
1<br />
4 6<br />
7 5 10 7<br />
3 4<br />
332<br />
SO<br />
. . . . .<br />
7- u<br />
147/ 12<br />
FIG 1
L’alimentation latérale de la nappe des calcaires du Jebel Hamra par la nappe<br />
de la coulée volcanique n’a pas pu être mise clairement en évidence.<br />
Le dégorgement des eaux de la nappe profonde du Jebel Hamra sur la nappe des<br />
Angad est souligné par le resserement des courbes isopiézométriques au pied de<br />
ce massif.<br />
2.2.4.2. Hydrochimie (fig. 3). - Le rale de relais hydraulique joué par la coulée<br />
volcanique est confirmé d’une part par I’hydrochimie, et mis en lumière d’autre part<br />
dans l’établissement du bilan de la nappe des Angad.<br />
Les faciès des eaux des trois nappes en présence dans la région d’Oujda, celles de<br />
la coulée volcaniques, des Angad et des calcaires du Lias du Jebel Hamra sont presque<br />
identiques. Les eaux des formations volcaniques ont néanmoins une tendance<br />
chlorurée sodique avec un résidu sec depassant toujours 1 g/i, tandis que celles du Lias<br />
sont plutôt bicarbonatées calciques et magnésiepnes, avec un résidu sec bien inférieur<br />
à 1 g/l. Les eaux de la nappe phréatique de la plaine des Angad constituent un mélange<br />
de celles des deux premières nappes dont elles tirent probablement leur origine.<br />
2.2.4.3. Essai de Bilan de la nappe phréatique des Angad. - Dans le calcul du bilan<br />
de cette nappe, on a établi que sur le débit d’alimentation qui s’élève à 1400 ils au<br />
niveau de la courbe isopièze 530 m, la moitié environ doit provenir de la coulée<br />
basaltique.<br />
3. CONCLUSION<br />
Les travaux de recherches effectués sur la coulée de Gucnfouda-oued Nachef ont<br />
montré l’importance hydrogéologique des formations volcaniques, dans la mesure<br />
où elles possèdent des niveaux fissurés. Dans le cas présent, elles jouent en plus un<br />
rôle de relais hydraulique naturel.<br />
D’autres exemples rencontrés au Maroc peuvent également souligner la différence<br />
de comportement des formations volcaniques suivant leur degré de fissuration. Dans<br />
la région d’Azrou, des forages dans une même formation basaltique de Quaternaire<br />
furent des succès ou des échecs suivant qu’ils ont recoupé ou non des zones fissurées.<br />
Dans la vallée du Guijou les basaltes compacts constituent un niveau imperméable et<br />
mettent en charge le sous-écoulement de ce cours d’eau.<br />
333
PHÉNOMÈNES KARSTIQUES DANS LES GYPSES<br />
DE JEZIREH (NORD-EST DE LA SYRIE)<br />
SOMMAIRE<br />
François MORTIER et Chafic SAFADI<br />
Les formations d’évaporites (principalement gypses et anhydrites), qui se sont<br />
déposées en Jezireh (Nord-Est de la Syrie), au cours du Miocène, sont le siège de<br />
circulations aquifères de type karstique. La karstification semble avoir été favorisée<br />
dans les zones tectonisées et dans les zones basses d’affleurement (cuvettes fermées,<br />
vallées).<br />
Un procédé de développement des puits dans les foJmations gypseuses par<br />
accélération de la dissolution est décrit et proposé à l’expérimentation.<br />
SUMMARY<br />
Karstic phenomena in the miocene gypsums of Syrian Jezireh<br />
The evaporite formations (mainly gypsums and anhydrites) deposited in Jezireh<br />
(north-east Syria) during the Miocene era contain groundwater systems of Karstic<br />
type. Karstification appears to have found favourable conditions in the zones of tectonic<br />
activity and the low-lying outcrop areas (closed basins,. valleys).<br />
The paper describes a procedure for developing wells in gypsum areas by accelerated<br />
dissolution and suggests experiment with it.<br />
1. INTRODUCTION<br />
Quand on parle de «karst» ou de «karstification», on pense généralement à des<br />
phénomènes relatifs à des calcaires. Or, les roches sulfatées sont beaucoup plus solubles<br />
que les carbonates; la solubilité du gypse dans l’eau douce est de 2,6 g/l, contre 0,07 g/l<br />
pour le carbonate de calcium et 1,2 g/l après transformation en bicarbonate de calcium,<br />
et les dépôts de gypse et d’anhydrite, sans être aussi fréquents dans le monde que les<br />
calcaires, n’en sont pas moins très répandus : Trias germanique, Ludien du bassin de<br />
Paris, Oligocène et Miocène circum-méditerranéens ...<br />
On peut donc s’attendre à des phénomènes morphologiques et hydrologiques<br />
analogues à ceux souvent décrits au sujet des calcaires. Mais, d’une part, le gypse est<br />
moins solide que les roches calcaires en général, et on n’assiste donc pas au développement<br />
de réseaux karstiques aussi spectaculaires susceptibles d’intéresser les spéléologues<br />
(dont le rôle a été capital dans l’illustration du karst); d’autre part, les eaux circulant<br />
dans le gypse sont souvent impropres à la consommation - donc peu de publications<br />
traitent de l’hydrogéologie des formations sulfatées.<br />
II se trouve que dans le Nord-Est de la Syrie, en Jezireh, des formations à<br />
dominante gypseuse ameurent sur plus de 8 O00 kmz, soit environ 1jS de la superficie<br />
totale; et lors de l’étude des ressources en eaux souterraines effectuée conjointement<br />
par des hydrogéologues de la F.A.O. et de l’Administration Syrienne, une part<br />
importante des efforts de reconnaissance a été consacrée aux circulations aqdfères<br />
dans les gypses.<br />
II. GÉOLOCIE<br />
En Jezireh, les affleurements de gypse et d’anhydrite (voir carte) sont d’âge<br />
Tortonien. Le faciès est équivalent à celui des «Lower Farsn d’Iran et d’Irak (Van<br />
Bellen, 1959), et du Sarmatien d’Europe Sud-Orientale (Gignoux, 1950).<br />
334
Y YI<br />
M<br />
iz
L’épaisseur peut être très grande; elle croit du Nord au Sud de la Jezireh : moins<br />
de 50 m au Nord, 350 m à 400 m au centre du Bassin de Haute-Jezireh, plus de 700 m<br />
au Sud.<br />
Les géologues ont proposé une subdivision de cet étage, en deux termes :<br />
- à la base, une sédimentation chimico-Carbonat&, avec prépondérance de bancs de<br />
gypse, (jusqu’à 75 % de l’épaisseur totale);<br />
- au sommet, une sédimentation chimico-terrigène, principalement argilo-gypseuse.<br />
Les bancs de gypse peuvent atteindre 40 m d’épaisseur, mais le plus souvent, les<br />
bancs individuels ont entre 4 m et 20 m d’épaisseur; ils sont très réguliers; quand ils<br />
affleurent, on peut les cartographier sur des dizaines de kilomètres. Le gypse est le<br />
plus souvent blanc, gris clair ou gris vert, finement cristallisé, massif et compact, mais<br />
quelquefois tendre et friable.<br />
Les formations tortoniennes affleurent principalement autour du grand axe<br />
anticlinal, qui, de la frontière irakienne au Balikh, soit sur 200 km, sépare Haute et<br />
Basse-Jezireh; de direction générale Est-Ouest, ce «bourrelet frontal)) est très continu,<br />
(l’anticlinal du Jebel Abd-el-Aziz a 50 km de long sur 10 à 12 km de large), très<br />
dissymétrique, (témoignant d’une poussée vers le Nord), et assez élevé (l’amplitude<br />
est d’environ 1 500 m). De petites failles transversales ou obliques compliquent cette<br />
structure; mais surtout la grande faille Est-Ouest, qui court le long du Jebe1 Abd-el-Aziz<br />
et qui a en certains points un rejet de plus de 1 O00 m, est l’exagération d’une<br />
importante flexure.<br />
III. MORPHOLOGIE<br />
Les photos aériennes permettent de dessiner très aisement les différents bancs<br />
caractéristiques du Tortonien de Jezireh. Les bancs calcaires apparaissent en bandes<br />
foncées, les gypses et les argiles en longues bandes plus claires. La morphologie traduit<br />
l’alternance de roches plus ou moins dures par une série de petites falaises qui se suivent<br />
sur de grandes distances.<br />
Les photos aériennes révèlent aussi une différence entre le réseau hydrographique<br />
dans les formations gypseuses et les formations détritiques supérieures (Upper-Fars);<br />
alors que le chevelu des vallées est dense dans les premières, il se réduit à quelques<br />
troncs communs qui disparaissent graduellement vers le Sud dans les secondes.<br />
Enfin, les photos aériennes montrent de nombreuses «dollines» en forme<br />
d’entonnoir, d’un diametre de 5 à 100 m et plus et d’une profondeur de 5 à 50 m.<br />
La source d’Ain Hol est un excellent exemple de grande dolline (Burdon, 19591, OU<br />
l’eau a été soutirée par canal et un tunnel, autrement elle serait restée dans un petit<br />
lac, comme on en rencontre plusieurs dans la région du Jebel Tchembe. 11 y a aussi<br />
des trous secs, ou m6me des gouffres plus ou moins profonds, produits par<br />
l’effondrement du toit d’une caverne, comme le gouffre d’El-Houti.<br />
La répartition de ces dollines est apparemment irrégulière; elles sont cependant<br />
plus nombreuses au voisinage des axes et accidents tectoniques et, au Sud-Est<br />
d’aassetche, le début d’une grande faille oblique est marqué par deux dollines.<br />
IV. HYDROGÉOLOGIE<br />
Les points d’eau liés aux formations tortoniennes sont des sources, des puits et<br />
des forages.<br />
Les sources sont nombreuses. 35 ont été relevées. Leur debit est très variable, de<br />
quelques l/lOemes de litres/seconde, à plusieurs centaines de litreslseconde. Les princi-<br />
pales sources sont, outre l’Ain-Hol déjà citée (débit annuel : 28 millions de m3,<br />
336
variant de 0,6 m3/s en été à plus d’un m3/s en hiver), les deux sources sous-lacustres<br />
qui alimentent le lac Khatounnye (200 à 300 I/s?), Tell Tabane (600 l/s) ... Ce sont<br />
alors des écoulements de type karstique dans les gypses. Les autres sources sont de<br />
moindre importance; ce sont des affleurements de «nappe» ou des sources de<br />
débordement, là où les gypses s’ennoient sous les argiles des «Upper-Fan»; elles<br />
sont disposées en auréole autour des structures anticlinales.<br />
Les puits ne sont pas très nombreux. Leur débit est en général bon, surtout quand<br />
ils sont situés au fond de dépressions à gypse sub-affleurant (El-Feidate), ou au voisinage<br />
d’accidents tectoniques, ou encore quand ils sont anciens.<br />
La hauteur d’eau dans ces puits à main est parfois grande, témoignant soit de<br />
variations importantes du niveau aquifère suivant les années, soit plutôt de la rencontre<br />
tardive, au cours du creusement, de fissures aquifères en charge.<br />
Par contre, les forages opt souvent été des échecs, soit à cause d’une grande<br />
proportion de marnes et d’argiles dans la formation, soit même dans des séquences<br />
de gypses massifs, mais non fissurés en profondeur : le forage Y17, qui a traversé<br />
300 m de gypses et argiles n’a donnb qu’un débit négligeable pour un rabattement très<br />
important, alors qu’à moins d’un kilomètre de là, un puits ancien, creusé dans les<br />
gypses affleurants, a un débit spécifique de 85 litres/seconde/mètre, environ 1O.OOO fois<br />
supérieur. Un seul des forages au gypse (Y19) a donné un bon débit (25 I/s, pour 3 m<br />
derabattement); la transmissivitéest de 8,610-2mm”/s, laperméabilitéest de 1,l 10 -%n/s,<br />
et le coefficient d’emmagasinement de 7,2%.<br />
En conclusion, les formations tortoniennes sont en général peu aquifères en Jezireh;<br />
les bancs de gypses quasi impermeables en eux-mêmes (ils forment une excellente<br />
couverture pour les gisements de pétrole sous-jacents) ont acquis par dissolution une<br />
porosité de fissure, variable, mais en général meilleure en surface et au voisinage des<br />
zones tectonisées.<br />
V. HYDROCHIMIE<br />
Les eaux des formations gypseuses du Tortonien de Jezireh sont toutes sulfatées<br />
et presque toutes sulfatées calciques avec un p H voisin de la neutralité; la concentration<br />
en ions bicarbonates est très faible; le rapport SO&I est supérieur à 1 (parfois plus<br />
de loo), et le rapport Mg/Ca est inférieur a 1 (parfois inférieur à 0,2).<br />
La minéralisation totale est en général moyenne, supérieure à 2,5 gil et inférieure<br />
à S g/1. Lorsque la minéralisation augmente (concentration par dissolution ou par<br />
évaporation); on appröche de la limite de solubilité du gypse (30 me/] pour les eaux<br />
douces, 40 pour une force ionique correspondant a SO me/] de CINa, plus de 60 pour<br />
une force de 2SO), et les sulfates ne continuent alors à augmenter qu’en passant à des<br />
eaux sulfatées sodiques ou magnésiennes. A la limite, les eaux deviement chlorurées,<br />
surtout si des bancs de sel se trouvent au voisinage dans la série tortopienne.<br />
Les eaux des formations gypseuses sont souvent buvables, quoique de saveur<br />
amère et elles sont parfois utilisées avec succès pour l’irrigation du coton et des céréales.<br />
VI. EXPLOITATION<br />
L’irrégularité des débits obtenus par puits et sondages dans les formations<br />
gypseuses, nous a poussés à rechercher une méthode de développement appropriée.<br />
Cette recherche a été basée sur deux observations :<br />
- Les sources et ouvrages placés au voisinage de zones tectonisées ont en général<br />
de bonnes caractéristiques;<br />
337
- Les puits peu profonds et anciens, surtout ceux situés dans des dépressions inondées<br />
en hiver, et donc en contact prolongé avec des eaux non saturées en sulfates, ont<br />
de bonnes caractéristiques, alors que les puits neufs et les sondages profonds sont<br />
secs ou peu productifs. Les difficultés rencontrées lors de l’étude d’emplacements<br />
de barrages sur le Bas-Khabow en zone gypseuse vont dans le même sens.<br />
On a donc concu une méthode capable, par action physico-chimique, d’accélérer<br />
ces phénomknes naturels de fissuration par action tectonique et d’élargissement des<br />
fissures par dissolution, de façon à ce qu’un résultat appréciable puisse être obtenu<br />
en quelques heures, ou en quelques jours.<br />
Si la perméabilité initiale est quasi nulle et si l’on a de bonnes raisons de penser<br />
qu’il peut exister des fissures aquifères à faible distance du forage, on peut alors amorcer<br />
cette fissuration dans le forage par fracturation hydraulique ou par torpillage.<br />
Pour accroître la vitesse de dissolution, il apparaît, après étude bibliographique<br />
(Rochmann, 1963), que le procédé le plus simple serait d’augmenter la solubilité du<br />
gypse par adjonction à l’eau du forage de chlorure de sodium; c’est un produit peu<br />
coûteux, facile à trouver, maniable, peu agressif et non dangereux et il se place très<br />
honorablement parmi les sels qui accroissent la solubilité du gypse dans l’eau.<br />
Solubilité du gypse en fonction de la concentration en ClNa :<br />
ClNa Wl) O 2,9 14,6 58,5 131,6 204,7 292,6<br />
S04Ca 2H20 (à 20’) 2,6 4,O 5,O 7,6 9,2 830 697<br />
Le meilleur solvant expérimenté n’augmente pas la solubilité du gypse au-delà<br />
de 12 gil.<br />
Au point de vue pratique, la concentration optimale - à rechercher probablement<br />
entre 10 et 100 gil - est un problkme économique. Le schéma d’exécution comprend<br />
un bassin d’au moins 10 m3 pour la préparation du solvant, deux pompes et trois<br />
vannes pour le brassage du mélange et la pulsation de la solution dans le terrain. En<br />
cours d’opération, on devra contrôler régulièrement la concentration de la solution<br />
en ions C1 et so4. Elle devra être rejetée lorsque la concentration en SO4 cessera de<br />
croître, ou croîtra trop lentement. La réussite pratique de l’opération dépend de la<br />
vitesse de dissolution, éminemment variable suivant les conditions de gisement du<br />
sulfate.<br />
Une telle opération de développement (sans précédent connu de nous) n’a<br />
malheureusement pas pu être réalisée en Jezireh depuis sa conception. Nous espérons<br />
qu’une prochaine publication précisera les résultats.<br />
REFERENCES<br />
R. VAN BELLEN (i 959), Lexique stratigraphique international Asie-Iraq, Congrès<br />
inf., Vol. III. fas. 10.a CNRS Paris.<br />
M. GIGNOUX (1950), Géologie stratigraphique, Masson éditeurs Paris.<br />
D.J. BURDON (1959), Development of the water resources of Lake Khatouney and<br />
Ain Hol, lying East,of Hassetche (Rappor? FA O, inédit).<br />
J. ROCHMAN (1963), Etude technologique du captage des nappes par forages en<br />
Jezireh syrienne (Rapport FA O, inédit).<br />
D. GEAR (1963), The hydrogeology of the North-East Jerizeh (Rapport FA O, Inédit).<br />
J. KHOURY (1963), The hydrogeology of the Lower Jezireh (Rapport FAO, inédit).<br />
338
SPAMSH UNDER-GROUND RIVERS<br />
AN EXPOSAI, OF SOME CHARACTERISTIC CASES<br />
AND PROPOSED STUDIES<br />
FOR THE HYDROLOGIC DECADE<br />
SUMMARY<br />
Mr. Clemente SÁENZ GARCIA<br />
President of the Continental and Scientific Hydrologic Commission<br />
of the Hydrographic Studies Center. (Spain)<br />
Examples of total or partial disappearance of the surface flow into karstic areas<br />
can be observed in many Spanish rivers. The water-feeds vauclusian sources with a<br />
great increase of their discharge generally due to the autoctom flow of the percolations<br />
in the rock.<br />
Descriptions are made of the geographical situation of large-dolomitical and cal-<br />
careous masses existing over the country and remarkable examples are given of under-<br />
ground rivers in Spain as well as those of limey canyons.<br />
The Hydrographic Research Center wil study as a contribution to the International<br />
Hydrologic Decade some experimental basins partial or totally of the karstic type.<br />
As an example, Lobos River Basin, in the high Castilian plateau, as well as other basins<br />
not yet definitely delimited, wil be considered.<br />
LES COURS D’EAU SOUTERRAINS D’ESPAGNE<br />
EXEMPLES TYPIQUES ET ETUDES PROPOSEES<br />
POUR LA DECENNXE HYDROLOGIQUE<br />
INTERNATIONALE<br />
Clemente SÁENZ GARCÍA<br />
Président de la Comisión de Hidrologia Continental y Cientifica du Centro<br />
de Estudios Hidrograficos (Espagne)<br />
RESUME<br />
Les cours d’eau espagnols qui traversent des régions karstiques fournissent, comme<br />
partout ailleurs, des exemples de pertes totales ou parlielies qui vont alimenter des<br />
sources vauclusiennes, dont le débit est parfois notablement accru par des apports<br />
indépendants et par la percolation de l’eau dans les roches traversées.<br />
L’auteur indique la situation géologique des grandes masses calcaires et dolomi-<br />
tiques qui intéressent les cours d’eau étudiés et cite les exemples les plus remarquables<br />
des cours d’eau souterrains et des canons calcaires d’Espagne.<br />
Le Centro de Estudios Hidrográficos se propose d’examiner, à l’occasion dela<br />
Décennie hydrologique internationale, certains bassins de type partiellement ou totale:<br />
ment karstique, notamment celui du rio Lobos, sur le plateau castillan, et d’autres qui<br />
ne sont pas encore définitivement arrêtés.<br />
339
SUMMARY<br />
STUDIES ON THE HYDROLOGY<br />
OF FRACTURED ROCKS 1N JAPAN<br />
Dr. Sôki YAMAMOTO<br />
Professor, Tokyo University of Education<br />
He describes present situation of the study of the hydrology of fractured rocks in<br />
Japan. H e has less studies of hydrology of Karst regions, but has more studies on that<br />
of volcano regions. Studies on hydrology of fractured rocks in Japan is now centerd on<br />
finding out of the mode of occurrence and water balances of ground water in volcano<br />
slopes.<br />
RESUME<br />
Etudes sur l’hydrologie des roches fissurdes du Japon<br />
Cet article expose l’état actuel des connaissances sur l’hydrologie des roches fissurées<br />
du Japon. I1 est question de certaines études sur l’hydrologie des régions karstiques,<br />
mais l’article est consacré principalement aux régions volcaniques. L’ktude hydrolo-<br />
gique des roches fissurées du Japon vise essentiellement à déterminer les conditions<br />
de la présence d’eaux souterraines dans les pentes volcaniques et le bilan hydrique de<br />
ces terrains.<br />
It is noted that large springs in Japan occurred on the slope of volcano and specific<br />
discharge of river water around volcano is extremely large. Those characters above-<br />
mentioned are essential for the water on and around volcano. To develop the water<br />
resources on volcano slope, it is needed to clarify the mode of occurrence and the<br />
hydrology of surface and sub-surface waters.<br />
The author carried on the survey of springs on such volcanoes as Mt. Chokai,<br />
Mt. Iwate, Mt. Akagi, Mt. Fuji, Mt. Yatsugatakc, Oshima Island, Miyakejima Is.,<br />
Hachijoshima Is., Mt. Daisen and Mt. Aso throughout Japan. H e has about 200<br />
volcanoes in Japan. They are mostly so called “central volcano” and are composed<br />
of alternations of lava, volcanic ashes, volcanics sand and gravel and mud flow.<br />
Spring having large quantity of discharge are located on the terminal region of a<br />
lava flow, according to the out crop pattern of each flow. Water from such a spring<br />
may have the character of cavern water or fissure water on its course. He intended<br />
to find out such a subterranean river course underground. The methods adopted by<br />
him are as follows:<br />
(1) Surface geological survey to find out generai geological constitution;<br />
(2) Sub-surface geological survey including electric prospecting, seismic prospecting,<br />
radioactive prospecting, test drilling and various kinds of loggings to find out the<br />
sub-surface topography ;<br />
(3) Survey of springs.<br />
Among those volcanoes, extensive surveys were centred on Mt. Fuji and Mt. Aso.<br />
He describes the survey of Mt. Fuji here. Mt. Fuji is a “stratified volcano” composed<br />
of volcanic ash, volcanic sand and gravel, volcanic detritus and lava.<br />
After Tsuya’s geological and mineralogical study of Mt. Fuji, about 50 sheets of<br />
lava flows were distinguished. Individual lava flows range in thickness from about<br />
340
10 to 80 metres and average about 40 metres. It has many cooling joints and sometimes<br />
has extremely large lava tunnels. The sufficient and constant supply of rain water<br />
reaches to mud flow through this lava and flows out to spring.<br />
Fig. 1 - Index map.<br />
After the result of geophysical survey he obtained the following values and cor-<br />
responding geologica1 classifications.<br />
341
Geology<br />
Velosity of<br />
seismic wave (kmlsec)<br />
Specific resistivity (0 m)<br />
___l_______l<br />
East side Other side<br />
Surface soil<br />
New mud flow<br />
0.2-0.5 10,000 various<br />
íupper)<br />
New mud flow<br />
30-200<br />
(lower)<br />
Volcanic s, & gr. 0.7-1.0<br />
300-800<br />
300-500<br />
Lava 1.3-1.8 2,000-50,000<br />
Old mud flow<br />
Base rock<br />
1.6-2.3 500 700-3,000<br />
(Misaka) 2.8-3.5 3,000<br />
He found that many buried valleys were formed on the Kofuji mud flow (old mud<br />
flow) covered by lava and alnosts of all were reached to the discharge point of springs<br />
(fig. I). Besides those geological surveys, he measured the yield of springs on the slope<br />
of volcano above-mentioned. In the case of Mt. Fuji, he classified two groups of springs<br />
Fig. 2 - Discharge distribution on Mt. Fuji.<br />
by its discharge. The first group, which has average mean discharge of 0.6 I/sec is a<br />
perched type of local one and the second group of 1.100 l/sec is closely related to the<br />
course of buried valley on the Kofuji mud flow (fig. 1 and 2).<br />
By such an investigation above-mentioned, he contributed to the development<br />
of water resources on the higher parts of volcano sloped in Japan.<br />
REFERENCES<br />
(I) H. TSUYA, Geological and petrogical studies of volcano Huji (Fuji), Bull., Earth-<br />
quake Res. Institute (1940).<br />
(2) N. KURATA, Study on the underground river covered by Mishima lava flow,<br />
Mt. Fuji, Joiirn. Geol. Soc. Jupun, No. 666 (1951).<br />
(3) S. YAMAMOTO, The volcano slope springs in Japan, Proc. of IGU regional conference<br />
irr Jupun (1957).<br />
(4) K. SHIMURA, Ground water survey at the foot of the west and the east slopes of<br />
Mt. Fuji. Butsirri-Tanko, vol. 13, No. 1 (1960).<br />
(9 S. YAMAMOTO, N. MIYAMOTO, T. SHIBASAKI, H. TAKAHASHI, and A. HATAKEYAMA,<br />
Geology and ground water of the western foot of Aso volcano, Journ. Geol. Soc.,<br />
Jupun, No. 800 (1962).<br />
342
SUMMARY<br />
THE GROUNDWATER INVESTIGATION<br />
IN THE DEVONIAN LIMESTONES,<br />
EAST OF ISTANBUL, TURKEY<br />
Kemal ERGWANLl<br />
Professor of Applied Geology, Technical University of Istanbul, Turkey<br />
This investigation was carried out in 1959-1965, to provide industrial water from<br />
Devonian Limestones, for light-weight material (Ytong) factory which is built 25 km<br />
East of Istanbul.<br />
In order to provide the necessary water from this limestone area the stratigraphical,<br />
lithological and structural properties of these limestones were examined and mapped<br />
on 1 /5W and l/lOûû scale maps. And then water levels in more than 150 dug wells<br />
were measured and also, NaCl were used to find the flowing direction of underground<br />
water.<br />
From these results the most safe and rantable way of providing 2-3 It/sec. water<br />
for the factory was determined.<br />
I. INTRODUCTION<br />
Istanbul is the largest city of Turkey with a population, of about 2 million, where<br />
the industry develop severy day. The land between Istanbul and Izmit is accepted by the<br />
government to be an industrial area. The catchment area of this region is small with a<br />
rainfall of about 600 mm/year and therefore surface water is scarce.<br />
The possibility of supply of industrial and drinking water to Istanbul from the<br />
Sapanca lake and the Sakarya river, 140 km east of the city is under investigation.<br />
But the realization of this plan will take a long time and great expenses. The factories,<br />
that are being built today, will be supplied from local underground waters.<br />
The present study was made between the years 1959-1965, to provide industrial<br />
water to the Tiirk Ytong light-weight material factory, which is built near Pendik,<br />
25 km east of Istanbul. The investigations in this area are continuing and the region<br />
became a research area for the Applied Geology Department of the Istanbul Technical<br />
University. The author thanks the Turk Ytong Company for their help and permission<br />
of publication of this paper.<br />
Water needs of the Ytong factory and its social establishments are of about 140 m3/<br />
day whereas those for the production of Ytong light material are of about 200 m3/day.<br />
There are no rivers or brooks in the neighbourhood (2-3 km) of the factory.<br />
The necessary raw materials for this factory are limestone, quartzite, water and<br />
special solutions. Geological research began in 1959 with I. Ketin to provide the first<br />
three of these materials close to each other, and the limestone and quartzite regions<br />
around Istanbul were mapped at scale 1/25000.<br />
The area near Pendik was preferred since it had sufficient raw material with the<br />
required qualifications. Then the 1/5000 and l/lOOO scaled geological and hydro-<br />
geological maps were made.<br />
II. GEOLOGY<br />
Quartzite-greywacke series, limestones and andesitic dykes are found on the studied<br />
area. (See map)<br />
343
A<br />
o so loo rn<br />
A-4
A'<br />
NE
The greywackes, seen at the west of the investigated region, are greyish-brown in<br />
colour, clayey and micaceous ; they pass, laterally and vertically, from greywacke<br />
quartzite to coarse feldispathic quartzites and then to finely grained massive quartzites,<br />
which are seen at the upper level of these series. They run from NW to SE with a dip<br />
of 20-35" NE.<br />
The quartzites are white in colour, coarse in the lower level and finely grained in<br />
the upper, with regular bedding, fractured, faulted and making small ondulations.<br />
The age of the greywacke-quartzite series was determined to be Silurian (Llan -<br />
doverian) from the brachiopod fossils (i.e. Meristina furcata SOW., Stricklandia lens<br />
progessa WIL., Plectatrypa imbricata SOW., and Plectodonta.) which are found in<br />
the greywacke-quartzites. (After C. SAYAR'S determination).<br />
The chemical analysis of the quartzites gave the results:<br />
Sioz: 92.6 Cao: 0.3 MgO: 0.8 Fez03: 3.7 AìzOs: 1.9 (Approx.)<br />
and loss due to ingnition: 0.7%. This quality of the raw material is suitable for the<br />
Ytong factory.<br />
Greyish-black limestones lie with unconfirmity (overlap) on the quartzite series.<br />
These limestones are cut by several andesitic dykes and the fractures and faults in<br />
them are filled by residual clay. The lower beds of these limestones are reddish-brown<br />
in colour, sandy, and contain 3 to 4% of feldispathic grains. The upper part of the lower<br />
beds contain corals (Halysites) and brachiopods. Their colour and texture change<br />
towards the upper bads and become greyish-brown and massive. They run in the direc-<br />
tion NW-SE and E-W with small ondulations and with a dip of 30-50".<br />
The chemical analysis of the limestones gave the results:<br />
Cao: 52.97 SiOa: 3.78 FezO3: 1.09 AlaO3: 0.4 MgO: 0.04%<br />
This analysis showed that these limestones are of the required quality.<br />
These limestones are Karstic at the surface and show lapiaz, small caves and solution<br />
channels. After the measurements on the surfaces of the new limestone quarries, it<br />
was found out that Karstic limestones had 50% of the solution channels filled with<br />
reddish plastic clay, to depth of 20 m. This Karstification decreases towards the lower<br />
levels.<br />
Detailed geological study on the i/iOOO topographical map showed that the lime-<br />
stones around the factory area are cut by andesitic dykes running from E to W, NE<br />
to SW and N to S. In the same area faults are observed in the direction of the andesitic<br />
dykes. These two geological factors have a direct effect on the underground water<br />
movement in this Karstic limestone region.<br />
III. GROUNDWATER MOVEMENT IN THE LIMESTONE<br />
Detailed hydrogeological studies and measurement were made to yield the necessary<br />
water to the factory which is erected on the limestones, 300 m far from the quartzite<br />
region.<br />
In this district, which is one of the old vegetable gardens of Istanbul with many<br />
wells, more than 150 wells were examined. The data was used to plot a watertable map<br />
of the region.<br />
Legend from map on pp. 344 and 345:<br />
THE GEOLOGICAL MAP OF THE FACTORY AREA<br />
1. Section - 2. Spring - 3. Well - 4. Quarry - 5. Strike and dip - 6. Fault(f) -<br />
7. Alluvium(a1) - 8. Limestone (L) - 9. Quartzite (Q) - 10. Greywacke (g) - grey-<br />
Wacke-quartzite (gQ) - 11. Andesitic dyke (a).<br />
346
The dug wells, in the limestone, are usually 1-4 m in diameter and mostly lined with<br />
stone. Groundwater occurs at depths varying from 5 to 20 mts., and well yield varies<br />
from O,]-1 '/2 It/sec.<br />
In the first catchment area, NW of the factory, the direction of groundwater flow<br />
is from NW to SE; whereas the direction of the movement is N-S at 1 km east of the<br />
area, sudden changes of flow from E to W are observed at same places, due to andesitic<br />
dykes and faults. Trials were made to determine the direction of flow of the groundwater<br />
-by the NaCI tracer method, but the results obtained were unsatisfactory.<br />
As a result of these dykes and faults the water level is variable in the limestone<br />
areas. One year of observations of the No. 28 and 29 wells near the factory (see map)<br />
gave rather different results. Well No. 28 had a constant water level of 117,50 O.D.<br />
and yielded 0.8 ltlsec., at a temperature 12-15"C, whereas 20 m SE of this well, well<br />
No. 29 had a varying water level at 112.50 O.D. and had very little yield. Pumping<br />
tests showed that these 2 wells had no effect on each other. Similar cases are also<br />
observed at some other of the limestone wells.<br />
In the second catchment area on the karstic limestone, 1 km east of the factory,<br />
dug wells of different depths were measured and plotted on a 1/5000 scale map. As a<br />
result of this detailed work and of pumping tests an ordinary wells (No. 19) located<br />
800 m east of factory was found suitable for the supply. It was deepened to 17 m and<br />
cleaned. Several pump-tests indicated a yield of 1,2 It/sec., the water came to this well<br />
from the fault plane, which is running from N-S. Deepening the well and tunnelling<br />
along the fault plane is being planned to increase the water yield. The temperature of<br />
the pumped water from this well increases to 20-25 "C as it is transferred by pipes to<br />
a reservoir near the factory. It is thus unsuitable for the factory cooling system. Water<br />
from well No. 28 will be used for this purpose and well No. 29 will be used as the reservoir.<br />
The chemical analysis of the water is as follows: total hardness: 24,40"F, pH: 8.2,<br />
C1: 38 mg/lt, SO4 24,0, SiOB: 15, AlsOs: 1.1, FezOs: 4.1, Cao: 209, HC03: 21.42,<br />
02: 7.7 mg/lt. This water is thus suitable for industrial purposes.<br />
IV. CONCLUSION<br />
After these investigations and pump-tests the necessary amount of water for the<br />
factory requirement is obtained from the wells No. 28 and No. 19 as 0.8 lt/sec. and<br />
1.2 It/sec. respectively (173 m3/day). This amount is sufficient for the present needs,<br />
but in the near future when the production of factory will increase twice as much,<br />
the water requirement wil become 200 m3/day. This problem will be solved by building<br />
a small dam (10 O00 m3 capacity), by recycling the used water and by searching for<br />
new sources.<br />
347
CONTRIBUTION TO THE HYDROGEOLOGICAL STUDY<br />
OF LIMESTONE TERRAINS IN U.A.R.<br />
ABSTRACT<br />
ISMAIL MAHMOUD EL RAMLY<br />
Senior Hydrogeologist<br />
Hydrogeology Department - Desert Institute<br />
Mataria, Cairo. Egypt.<br />
Studies done by the author for exploration and exploitation of ground water reser-<br />
voirs in fissured limestones lead to some interesting results in different areas in U.A.R.<br />
Recent results from the hydrogeological and geochemical investigations undertaken<br />
during the search for ground water in several hydrostratigraphic units ranging in age<br />
from upper Cretaceous chalks and limestones to Miocene dolomitic limestones and even<br />
up to Pleistocence formations opened many interesting points which should be taken<br />
in consideration while these studies are undergoing.<br />
It was found that there is a very close relationship between the distribution of the<br />
jointing system and the ground water flow in a certain area. Field pumping test anal-<br />
yses in fracture8 limestones revealed many results in such aspects and helped in locating<br />
areas of higher transmissivity from those of lower ones.<br />
Geochemical analyses showed also the relationships between the water contained<br />
in different fractures.<br />
This paper also deals with the origin of some natural lakes surrounded by fractured<br />
Eocene limestones, distributed along the southern rim of the extensive Qattara Depres-<br />
sion in the Western Desert of Egypt.<br />
RÉSUMÉ<br />
Contribution à l’étude hydrogéologique des terrains calcaires en RPpublique Arabe Unie<br />
Les études effectuées par l’auteur en vue de l’exploration et de l’exploitation des<br />
réservoirs d’eaux souterraines situés dans les calcaires fissurés font apparaître des résul-<br />
tats intéressants pour différentes régions de la République arabe unie.<br />
Les résultats de travaux hydrogéologiques et géochimiques auxquels on a procédé<br />
au cours de recherches d’eaux souterraines dans plusieurs unités hydrostratigraphiques<br />
échelonnées des craies et calcaires du crétacé supérieur aux calcaires dolomitiques. du<br />
Miocène ont permis récemment de préciser nombre de points intéressants qu’il convient<br />
de ne pas négliger dans ces recherches.<br />
11 a ainsi été découvert qu’il existe un rapport très étroit entre la répartition du sys-<br />
tème de diaclases et l’écoulement des eaux souterraines dans une certaine région. Les<br />
analyses des tests de pompage effectuées dans les calcaires fracturéS.donnent à cet<br />
égard de nombreux résultats et aident à localiser les zones de transmissivité relativement<br />
forte et a les distinguer des zones de faible transmissivité.<br />
Des analyses géochimiques ont aussi montré les rapports qui existent entre les eaux<br />
contenues dans différentes cassures.<br />
Cet article traite aussi de l’origine de certains lacs naturels entourés de calcaires<br />
éocènes fracturés, répartis le long de la bordure méridionale de l’immense dépression<br />
de Qattara, dans le désert occidental d’6gypte.<br />
1. INTRODUCTION<br />
Increase in the exploration and exploitation of groundwater reservoirs in U.A.R.<br />
(figure i) led to many problems concerning the development of the different reservoirs<br />
in the country. As an example, exploitation of the extensive Nubian Sandstone<br />
artesian aquifers in the Western Desert of Egypt (Dakhla and Kharga Oases) showed<br />
that extensive development and utilization of this hydrostratigraphic unit by drilling<br />
so many wells in these 2 areas have caused depletion in the discharges and pressures<br />
348
3 49
ofthe flowing wells during the last five years since the project was executed. Accordingly,<br />
the author encouraged the idea of exploring and exploiting other hydrostratigraphic<br />
units such as the limestones (a) quifers which is the aim of this paper.<br />
Studies done by the author in different areas of U.A.R. (Western Desert, Eastern<br />
Desert, and North and Central Sinai) for the limestone reservoirs (surface water reser-<br />
voirs in the form of natural lakes, karst springs, artificial reservoirs along dam sites<br />
built on fissured limestones, and ground water reservoirs in the form of flowing and<br />
non-flowing wells), gave a lot of informations and interesting results concerning their<br />
hydrogeological and geochemical characteristics.<br />
Thus, this study can be divided into two categories, namely groundwater limestone<br />
reservoirs and surface water in the form of natural lakes and springs. Also, the study<br />
includes part of the studies undergoing now for artificial lakes formed due to the con-<br />
struction of control dams along wadi channels (e.g. EI Rawafa D am along Wadi El<br />
Arish, North Sinai) having its banks surrounded by fissured limestones.<br />
2. PHYSIOGRAPHY AND CLIMATE<br />
2.1. PHISIOGRAPHY AND THE EFFECT OF RAINFALL ON DIFFERENT CARBONATE ROCK UNITS<br />
An appreciation of the major surface features of the land (physiographic units) can<br />
be of considerable strategic, and to a lesser extent, tactial significance. Mention of a<br />
particular physiographic unit should, for example, convey a picture of the general<br />
terrain. Certainly the term “basin and range” suggests a definite pattern of mountains<br />
plains, drainageways, soil types, and other elements of the terrain. The concept of<br />
geometry is adhered to in the present study in establishing the major physiographic<br />
units (mountains, plain-and-mountain complexes, hill lands, plateaus, plains, as<br />
illustrated in figure 2); however, it became clear early in the study that exceptions would<br />
have to be made in the subdivision of these units. Certain plains and hill lands, for<br />
example, exhibited important distinguishing characteristics not adequately defined in<br />
terms of form or geometry. ln view of this fact, origin or genesis was chosen as a secondary<br />
bases of physiographic breakdown. However, a maximum of form or geometric<br />
criteria are included in all unit definitions as shown in the legend attached to figure 2.<br />
The nature of the effect of rainfall along the whole country varies according to the<br />
geological character of the districts visited. It is obvious from the surface features along<br />
the northern part of U.A.R. where the Miocene and younger limestone beds predominate,<br />
that the effect of rain reaches its maximum. Deep ravines and sinkholes were<br />
encountered along the extensive Lybian Plateau which extend along the northern,<br />
northwestern, and southwestern part of the Qattara Depression. Also, it was noticed<br />
along the escarpment overlooking the Mediterranean littoral of U.A.R. It can be seen<br />
along the Miocene and younger limestone formations exposed at the eastern and western<br />
coasts of the Gulf of Suez and at some parts of the Western Coast of the Red Sea.<br />
On the other hand, those districts which are occupied by limestone strata of Middle<br />
and upper Eocene are, as the effect of rainfall, largely characterized by (1) plateau surfaces;<br />
(2) valleys bordered by steeply sloping or vertical cliffs; (3) abrupt steps in the<br />
valleys, or sidds, giving rise to fine waterfalls during spates; (4) undercutting by back<br />
splash of the waters; (5) formation of water pools or depressions at the foot of the<br />
waterfall (in the form of sinkholes); (6) the side streams form boulder valleys filled<br />
with blocks (slumps) broken off from the bordering cliffs. All these features are well<br />
seen in the Tih and Egma plateaus in central Sinai, the Maaza plateau in the Eastern<br />
Desert north of Qena, in the neighbourhood of Cairo in the hills to the east of Helwan,<br />
and in the Western Desert along the plateau bordering the Nile Valley on its western<br />
side and extending from Cairo to Aswan. As the Upper Eocene formations are formed<br />
3 50
Fig. 2<br />
RANGES:<br />
Elongate belts of massive mountains.<br />
MASSIFS:<br />
Roughly circular aggregations of massive mountains,<br />
RANGDOM HILLS:<br />
Hils with moderate to steep slopes.<br />
SAND DUNES:<br />
Eolian sand, change shape and position rapidly.<br />
PLATEAUS:<br />
Elevated masses of land bounded on one or more sides by scarps.<br />
ALLUVIAL PLAINS:<br />
Flood plains, terraces and subaerial delta of the Nile River.<br />
COASTAL PLAINS:<br />
Plains bordering the sea.<br />
DEPRESSION PLAINS:<br />
Low lying plains of interior drainage bounded by scaprs.<br />
DESERT PLAINS:<br />
Interior plains formed or modified by eolian deposition or erosion,
of thin limestone bands and softer strata, the results are the same, but on a smaller<br />
scale, and the whole country is broken into minor drainage lines of no great vertical<br />
depth.<br />
The cretaceous limestone strata differ from the Eocene series in the greater abun-<br />
dance of soft members in the succession. South of Qena, where the softer Cretaceous<br />
shales and white limestone rise from underneath the Eocene limestones, the regular<br />
terrace arrangement is replaced by confused foothills, due in large measures to the<br />
sliding of the heavy masses of limestone over the slippery surfaces of the moistened<br />
shales and clays. The effect of these land slides is everywhere visible on both sides of<br />
the Nile between pena and Esna, around Farafra Oasis, north of Dakhla Oasis, north<br />
and east of Kharga Oasis, and also along the southern part of Central Sinai, being<br />
further exagerated by the presence of faulting. They are obviously connected with the<br />
geological structure, being best developed at the junction of the Eocene limestone and<br />
Cretaceous shale series. Every important hard bed tends to form a plateau, but as the<br />
softer formations are rapidly denuded beneath it, the unsupported portions are speedily<br />
broken off and carried away during heavy shower storms. The result is the production<br />
of typical bad-land scenery, where the topography becomes of extraordinary complexity.<br />
These features were observed in many places in Central and northern Sinai; along the<br />
central part of the Eastern Desert and also at the southern Oases of the Western Desert.<br />
In regions formed of Jurassic, Triassic and Carboniferous Limestone rocks as in<br />
northern and centrai Sinai, the general features produced by rain differ but little from<br />
those noted in areas occupied by Miocene, Eocene and Cretaceous formations. This<br />
can be illustrated along El Maghara major fold (Jurassic), Arif El Naga dome (Triassic),<br />
in northern and east central Sinai respectively. Um Bogma district (Carboniferous) is<br />
an example for West Centrai Sinai.<br />
2.2. CLIMATE<br />
It can be noticed that U.A.R. lies for the most part within the temperate zone and<br />
less than a quarter of it, is south of the tropic of Cancer. The whole country forms part<br />
of the great desert belt that stretches eastwards from the Atlantic across the whole of<br />
North Africa, and onwards through Saudi Arabia; and like all the other lands lying<br />
within this belt it is characterized by a warm and almost rainlessclimate (figure 3). The<br />
air temperature in Egypt frequently rises to over 40' centigrades in the daytime during<br />
the summer, and seldom falls as low as 0' centigrade even on the coldest nights of<br />
winter, and the average rainfall over the country as a whole is only about a centimeter<br />
a year. It is clear from figure 3 that even along the Mediterranean littoral, where the<br />
most rain occurs, the average yearly precipitation is less than 200 millimeters, and the<br />
amount decreases very rapidly as one proceeds inland from the coast. Thus while<br />
Alexandria, on the Mediterranean Coast, has an average annual rainfall of 190 milli-<br />
meters, Cairo, some i70 kilometers inland has only 30 millimeters; Asyût, which lies<br />
some 300 kilometers south of Cairo, has but half a centimeter; and Aswan, some 600<br />
kilometers south of Cairo, has practically no rain at all.<br />
With so scanty a rainfall it is not to be wondered at that by far the greater part of<br />
U.A.R. consists of barren and inhospitable deserts. Indeed, if the rain, that falls within<br />
her own borders were the sole source from which U.A.R. could derive water-supplies,<br />
the whole land would be one vast uninhabitable desert. But fortunately the Nile, tra-<br />
versing the entire length of the country on its northward course to the Mediterranean,<br />
continually brings dowp into U.A.R. large volumes of surface water derived from the<br />
heavy rainfall of tropical highlands lying far to the south; and the supplies thus fur-<br />
nished, being led by artificial canais over the narrow strips of alluvial land on either<br />
side of the river within its trough-like valley, and over the broad alluvial expanses of<br />
3 52
353
)-<br />
Y S E A<br />
Fia. 4
the Fayûm depression and the delta, serve to render these tracts (which comprise in<br />
all, however, only about 3 % of the total area of the country) as fertile as any lands in<br />
the World, and thus capable of supporting a dense agricultural population.<br />
3.1. GENERAL GEOLOGY<br />
3. HYDROGEOLOGY<br />
Ground water occurrence in limestone formations is governed by the geology, and<br />
a thorough knowledge of the stratigraphy, lithology, and structure of the area is required<br />
toward its evaluation.<br />
Stratigraphy<br />
Ancient calcareous sedimentary rocks were observed by different geologists to be<br />
exposed in a region from 100-150 kms due east of korosko oat: 22' 45' N and long.:<br />
31' 04' E). This was an indurated quartzose or gritty limestone which have great simi-<br />
larities with the squeezed muddy limestones of the Alps being of probable pre Carbonif-<br />
erous age. These Egyptian calcareous rocks shows evidence of far earlier date, being<br />
formed anterior to the Carboniferous period. Series of crystalline limestone which had<br />
been metamorphosed by the pink granite with which they were associated, were also<br />
encountered in Western Sinai. In Eastern Sinai; no calcareous schists were found. As<br />
there is an almost complete absence of fossils in them, it is impossible to fix their precise<br />
position in the stratigraphical column. No trilobites, graptolites, or other organisms of<br />
well defined geological age have ever been recorded from them, and this negative<br />
evidence weighs heavily in favour of the vast majority of these formations being pre-<br />
Cambrian.<br />
Carbonate rocks encountered either during surface geologic mapping or from sub-<br />
surface drilling information of deep wildcat wells range from Cambrian to Pleistocene.<br />
Figure4 shows clearly the carbonate rocks exposed on the surface all over the country<br />
Surface and subsurface data for the different carbonate rock units ranging in age from<br />
Jurassic to Pleistocene are illustrated by figures 5-1 1 inclusive.<br />
It is worth to mention that the sedimentary column resting over the pre-Cambrian<br />
basement complex is composed of the following lithological divisions:<br />
1. Lower clastic division: Pre-Cenomanian, predominantly clastic with intercalated<br />
calcareous sediments;<br />
2. Middle calcareous division: Cenomanian to top of Eocene, mostly calcareous;<br />
3. Upper clastic division: Oligocene to Recent, predominantly clastic but with organo-<br />
genic limestones.<br />
From this classification, it is clear that predominance of the carbonate percentage<br />
in the middle calcareous division supports the idea that Northern and Central Egypt was<br />
a part of the greater Tethys geosyncline during Cretaceous and early Tertiary times as<br />
the sediments found in north and Central U.A.R. are similar to the other Cretaceous<br />
and early Tertiary sediments of the Mediterranean area.<br />
Figure 12 which is a cross section along the southwestern district of Qattara Depres-<br />
sion shows clearly the distribution of the upper Eocene, and lower and Middle Miocene<br />
having a predominancy of calcareous material than other lithological units. An uncon-<br />
formity between the lower Miocene and the upper Eocene limestones can be noticed,<br />
where the Oligocene is completely missing in this area. Both the upper Eocene and lower<br />
and middle Miocene limestones are two important hydrostratigraphic units in this area<br />
of the Western Desert.<br />
3 56
Fig. 5<br />
3 57
3 58<br />
I,><br />
Fig. 6<br />
-I__-<br />
.---.-
- --<br />
I \ \<br />
I.<br />
.-<br />
Fig. 7<br />
---<br />
I\<br />
359
__<br />
.-<br />
I<br />
360<br />
1"
--<br />
~ li<br />
.<br />
Fig. 9<br />
f<br />
'I<br />
361
362<br />
..,<br />
.r_.<br />
Fig. 10<br />
r/ I<br />
u<br />
P =
--<br />
11.<br />
I<br />
a .",<br />
lc*c Jll<br />
P."<br />
O d<br />
.<br />
,.,.<br />
Fig. 11<br />
".I .<br />
,i<br />
* .I.<br />
7<br />
363
Structure<br />
Structurally, northern and central Egypt are part of the Syrian Arc, showing a<br />
system of folds which crosses Egypt and Syria in a NE-SW direction.<br />
Plate 13 shows the general tectonic picture of an Arabian craton overlapped intermittently<br />
by shallow seas which spread out from elements of the Tethyan geosynclinal<br />
system, north of the country. This craton (the Arabo-Nubian massif) is surrounded by<br />
a shelf area which can be divided into three units: the stable shelf, the Gulf of Suez<br />
taphrogeosyncline, and the Unstable Shelf-Stable and unstable shelves are similar but<br />
in the latter the formations are thicker and more disturbed. The unstable Shelf is<br />
characterized by having a series of asymmetrical folds with steep side to the southeast.<br />
In Sinai the folds are strongest in the north but fade away towards the Stable<br />
Shelf into the Tih Plateau of Upper Cretaceous and Eocene rocks. There are few isolated<br />
faults and faulted-up blocks running in a NW-SE direction, which are probably<br />
caused by the graben and horst movement of the Gulf of Suez region. In the Gulf of<br />
Suez area, the body of water occupies a graben as is attested by faults on both sides<br />
which have most of their downthrown sides toward the Gulf. This faulting was initiated<br />
before the Miocene, and continued probably up to Recent time. The structure of the<br />
Gulf of Aqaba, except for its width, is undoubtedly similar to the Gulf of Suez but faulting<br />
is difficult to see because of the uniformity of the basement rocks on both sides of<br />
the gulf.<br />
In the Eastern desert folding and faulting seem to have occurred along EW or NNE-<br />
SSW directions. The latter direction is probably the result of the clysmic or Eritrean<br />
tectonical activity, while the former is of the Mediterranean direction. Folding, e.g.<br />
is in line with those of Northern Sinai and Western Desert but is not as well developed<br />
here and is much complicated by the faulting.<br />
The Western Desert is more characterized by the presence of folding than faulting<br />
except in its eastern part towards the Nïle Valley and the Delta Basin where faults<br />
predominate. Folding here have the directions of NE-SW, with the Syrian arc or swell<br />
system and are more of less parallel to the geanticlipal welt. Folding seem to have<br />
become stronger at or near, the end of Turonian lime. This may have been the period<br />
when movements took place on the greater number of anticlines. It can be noticed that<br />
not all stresses were relieved by folding, but in places, for example Abu Roash and<br />
Wadi El Natrun area, competent beds broke instead of bending and faulting parallel<br />
to the lines of folding took place.<br />
From the impression gained from field work, the author is inclined to believe that<br />
the faulting is secondary to the folding, coming at a time when the rocks could no<br />
longer stand the stress of folding, so that they sheared during folding, this is borne out<br />
by the fact that some of the faults are almost entirely faults of horizontal displacement.<br />
However, most of the faults are apparently normal, although they arc hidden in nearly<br />
every case by alluvium deposits.<br />
Joint surveys from tectonically complicated arcas are mostly too complex to allow<br />
any trustworthy interpretation, although this has often been attempted. When we<br />
consider regions which are almost unfolded, the patterns are much more simple and<br />
show obvious relations to structural features, and even they may be random strike or<br />
poorly developed.<br />
In different parts of U.A.R. it was noticed that near pronounced anticlines welldefined<br />
joints are formed parallel to the strike of the axial plane of the anticline. Also<br />
there are belts of closely spaced parallel joints which presumably mark zone of shearing.<br />
Studies done by the author in Farafra Oasis in the Western Desert of Egypt showed<br />
that along the steeper side of the anticlines, larger proportion of fractures occur. Fissured<br />
Maestrichtian chalk of Farafra Oasis show clearly the great similarity between<br />
the total joints measured, joint sets and the airphotos linear features. Survey studies<br />
3 64
around Qasr El Farafra, in the Farafra depression indicated the presence of a very<br />
marked consistency of joint patterns and they slowly swing from NW north of Qasr<br />
El Farafra to NE south of it. The joint systems are perpendicular to the bedding plane.<br />
The sets of tension-joints observed are perpendicular to the main stress and might have<br />
developed as an effect of elastic release of the compression of the chalk. A valuable<br />
contribution to the sets of joints in this area which are perpendicular to the bedding-<br />
plane, is that they are joined by “en échelon” gash (tension) points, filled by calcite<br />
which stand on the ground surface as small ridges having a height of about 40 centi-<br />
meters in some places.<br />
Other studies completed in Qara Oasis, Qattara Depression in the Western Desert,<br />
together with the natural lakes existing along the southern rim of the Qattara Depres-<br />
sion showed that jointing is entirely related to the ground water movement in such<br />
districts.<br />
3.2. HYDROLOGICAL REGIME<br />
General Remarks<br />
U. A. R. is charactised by prevailing arid conditions which is marked by the low<br />
amount of precipitation and the extremely high evaporation capacity. The high temper-<br />
atures together with the low relative humidity values and the active wind account<br />
together for the high rate of evaporation. Due to lack of rainfall, aridity increases and<br />
accordingly scanty moisture content and surface vegetation can be accounted for. NO<br />
direct percolation from the ground surface takes place as moisture in the top soil never<br />
exceeds the amount required for infiltration through the dry soil. During occasional<br />
floods, downward percolation takes place in the Wadi beds through fissured rocks and<br />
Wadi fill. In Centrai and North Sinai together with the northern part of the Western<br />
Desert (EI Diffa Plateau), percolation is the only source of ground water recharge, thus<br />
plays an important role in the hydrological regime of these areas.<br />
3.2.1 Groundwater regime<br />
Ground water exploration and exploitation of fractured limestone reservoirs in<br />
U.A.R. has not yet reached its climax. Drilling operations by oil companies and other<br />
organizations in the country showed the existence of proliferous amounts of ground<br />
water in the different formations encountered. Limestones and dolomites having an<br />
age ranging from Jurassic up to Pleistocene comprise several groundwater reservoirs<br />
of great magnitude. The water from each limestone aquifer differ qualitatively from<br />
that of other reservoirs.<br />
From field studies it was noticed that water in fissured carbonate rocks, as in other<br />
aquifers, moves in the direction of the hydraulic gradient, but the direction of movement<br />
was not easy to be determined exactly, especially in the fault zones, because the<br />
configuration of the water surface was not possible to be determined accurately. It was<br />
noted also that the different limestone aquifers contain openings ranging in size from<br />
minute cracks, in which the movement of water is accompanied by a large loss of head,<br />
to caverns through which the water moves freely.<br />
In Farafra Oasis and the area surrounding the Qattara Depression from its western,<br />
southern and southeastern sides the flow lines indicate that the flow is in different directions.<br />
There is a great relationship between the direction of flow and of jointing in these<br />
areas. Water entering the cavernous and honeycomped limestones in these certain areas<br />
of outcrop undoubtedly moves downdip through interconnected solutional cavities.<br />
The large storage volumes in the different formations of these areas permit a long-term<br />
overdraft policy to be adopted. The development of such reservoirs in future should<br />
3 65
~<br />
Fig. 13 - Simplified Tectonic Map of Egypt (after Said, Geology of Egypt, 1963).<br />
366
follow an intense hydrogeological investigation by which safe yield estimates and eco-<br />
nomical mining of the stored water can be done to prevent the permanent depletion<br />
of these reservoirs.<br />
Table 1 shows the hydrogeologic properties of some carbonate reservoir rocks in<br />
selected areas in U. A. R.<br />
Worth to mention, while undergoing the pumping tests in the fissured Maestrichtian<br />
chalk of Farafra Oasis, it was noticed that the fissures supplying the pumped well are<br />
separated from those which supplies the observation wells as there was no effect noted<br />
on the water levels of the observation wells during pumping. This case was not noticed<br />
in Fuka where the water levels in the observation wells were affected while pumping.<br />
3.2.2. Surface Water regime (figure 14)<br />
(Natural lakes, Karst Springs and Artificial reserooirs)<br />
Natural Lakes<br />
One of the interesting scientific problems of the northern part of the Western Desert<br />
of U.A. R. is the presence of 5 natural lakes namely: Sitra, Nuweimisa, Bahrein (2 lakes)<br />
and Arag, which are located south of the Qattara Depression. Their permanence and<br />
origin led the author to make a detailed study as to reach an answer for the question<br />
of their presence. Geologic, hydrologic and geochemical studies were done by the author<br />
in the last 2 years on these lakes.<br />
These lakes are located in an almost rainless region and of a high magnitude evap-<br />
oration rate. They cover an area of 15.6 square kilometers for Sitra, 1.6 square kilo-<br />
meter for Nuweimisa, 2 square kilometers for Bahrein east, 3.2 square kilometers for<br />
Bahrein west, and 0.2 square kilometer for Arag lake. Their surface elevations ranges<br />
between-9 meters and-58 meters relative to sea level. The lakes are surrounded by<br />
fissured limestone of Middle Eocene age. They are situated along a huge syncline paral-<br />
lel to the significant Bahrein-Hassanein Anticline (figure 12). Recent studies by the<br />
author on the shoreline deposits (peat and silt deposits) indicated the presence of the<br />
index fossil Melanin (Eumelania) Tuberculata of a definite Pleistocene age. It is a<br />
brackish water fossil and indicates that these lakes have a pre-pleistocene age. The<br />
author is in favour of the view that these lakes originated from the springs issuing from<br />
the fissured limestones covering this district. These springs were observed by him in<br />
I956 while working there, as they can be noticed to be located in the center of the lakes.<br />
Karst Springs<br />
Springs issuing from Karstic limestones were encountered in many areas in U.A. R.<br />
In the Western Desert these springs are found in the Oasis depressions of Kharga,<br />
Dakhla, Farafra, Siwa, Qara, and Wadi EI Rayan depressions. Examples for the Eastern<br />
Desert is Ain Sukhna, located west of the Gulf of Suez, Helwan sulphur springs, and<br />
springs of St. Paul and St. Antoneys Monastries. In Sinai, the famous Ain Gudeirat,<br />
Ain Qadis, Ain Sudr and Ain Ratama are examples together with some other springs<br />
along El Tih and Egma plateaux.<br />
Springs of the Oases depressions get their water from deep horizons and the water<br />
temperature range from 28OC (e.g. Ain El-Màmal, Siwa Oasis) to 4loC (Ain EI Gabal,<br />
Dakhla Oasis). Siwa springs get their water from middle Miocene fissured limestones,<br />
while at Dakhla, Ain El Gabal gets its water from upper Cretaceous limestones.<br />
Ain EI Gudeirat, Ain Qadis and nearly all the springs of Central and North Sinai<br />
differs from those of the Oases depressions in having their waters from infiltration of<br />
heavy shower storms through the fissured limestone surrounding them. Estimated<br />
discharges for Ain Gudeirat in July 1941 was 871 cubic meters per day and in July 1964<br />
it was estimated to be i O0 cubic meters per day. For Ain Qadis measured discharge for<br />
367
m I s+250 A<br />
O<br />
+ 50 1<br />
Bed 6<br />
PLATEAU 3<br />
' -- MIOCENE<br />
MIOCENE<br />
N m<br />
QUATERNARY<br />
l<br />
A'<br />
Alluvium (Sabakhar silt Dunes E Drift Sand)<br />
TERTIARY<br />
Middle Miocene (Limestone E Shale)<br />
Lower Miocene (Shale, Sandstone E Limestone)
o<br />
Y) o<br />
Upper Eocene (Limestone. Sandstone E Shale)<br />
Middle Eocene (Numrnuitic Limestone E Shale)<br />
3<br />
I<br />
ô<br />
3<br />
I<br />
o<br />
P D1<br />
3<br />
A"<br />
+250 rn i B<br />
+200<br />
+150<br />
Cl00<br />
+so<br />
&O0 sea level<br />
- 50<br />
- 100
3 70
Fig. 14 - Map showing location of natural lakes, karst springs, caves and artificial<br />
lakes U.A.R. -Scale: 1:5,000,000.<br />
37 1
July 1941 was found to be 76 cubic meters per day, while in July 1964 it was found to<br />
be 20 cubic meters per day. Ain Sudr discharge was found to be in August 1941 to be<br />
18 cubic meters per day. In the area of Ain EI Gudeirat and Ain Qadis, it can be con-<br />
cluded that meteoric waters percolate through joints and solution channels of the Gebe1<br />
El Ain (a mesalike upland of considerable areal extent capped by Middle Eocene<br />
limestone), probably to the top of the Esna Shale, which forms an impervious surface<br />
(aquitard), and thence by gravity down dip in a northwest direction, to issue eventually<br />
at both springs.<br />
Artificial Reserooirs<br />
In north Sinai and along Wadi EI Arish channel (north of Gebe1 EI Hala1 by about<br />
8 kilometers, there is an arch dam named El Rawafa Dam. This dam was constructed<br />
in 1946, to be used as a storage reservoir for water conservation and flood control. The<br />
dam has a height of 20 meters above its base and is built on a lower Eocene (Nekhl<br />
formation) fissured flinty limestone. Its reservoir capacity in 1946 was 3 million cubic<br />
meters, but now it never holds more than a million cubic meter as it is already filled<br />
by a great amount of silt carried out by floods along Wadi El Arish during rainy seasons<br />
and depositcd in front of the dam. Studies undertaken by the author recently showed that<br />
a great loss of the water preserved in front of the dam is undergoing from the reservoir<br />
through the fissured limestones surrounding it together with other losses caused by evap-<br />
oration. The fissures have 2 main directions; mainly NE and NW. Interesting results<br />
gave a valuable idea about losses from artifical reservoirs surrounded by fissured lime-<br />
stones.<br />
3.2.3. Formafion of Caves (figure 14)<br />
Caves are not, as a rule, common features in U.A.R. Where they do occur, they are<br />
often of some size, though usually only single chambers extending for short distances<br />
into the hiII-side. Some caves were discovered by various geologists in the Eastern and<br />
Western Deserts. Of most significance are those caves recorded northwest of Qena in<br />
the Eastern Desert along El Maaza limestone plateau and directly north of Nag Hamadi<br />
at Wadi Nefukh and Wadi Gasab. (36'30' N and 32'15' E). Other caves in the Western<br />
Desert, previously recorded in the literature, are those along the limestones plateau on<br />
the camel trail between Idfu and Dush (South of Kharga Oasis) and also on the Camel<br />
trail between Asyût and Farafra Oasis. Those caves were found to be rising in the Oper-<br />
culina Iybgca and Aheolina limestones of lower Eocene age.<br />
During his work in Farafra Oasis, the author discovered another cave in lower<br />
Eocene limestone, near Qaret Sheikh Mohammed Abdalla, on the camel trail Connec-<br />
ting Farafra and Bahariya Oasis (27'40' N and 28'30' E'. Old travertine deposits<br />
surrounds this cave and some calcite and aragonite crystals can be seen hanging from<br />
the ceiling of the cave in the form of beautiful stalactites.<br />
Drilling operations showed many troubles while drilling cavernous limestone for-<br />
mations due to loss of circulation. As an example is Gibb Afia water well, northwest<br />
of Qara Oasis; in which a great loss of circulation was encountered in Middle Eocene<br />
limestone between depths 228 mts and 246 mts where the hole penetrated through top<br />
of a cavern having a height of 18 mts. Also at Bir El Nusswater wells and Burg El Arab<br />
wildcat well, caverns were encountered. To the south-west of Asyût by 100 kilometers,<br />
on the higyway connecting Asyût and Kharga Oasis, a well drilled to a depth of 1141<br />
mts (in L. Senonian) encountered some caverns in lower Eocene limestones between<br />
depth 67 and 299 mts from ground surface.<br />
Accordingly, future drilling in limestones in U. A. R. wil show clearly many areas<br />
having these cave features which owe their origin to the solution of the limestones by the<br />
movement of ground water through its fissures and crevices.<br />
312
i<br />
‘.<br />
‘.<br />
I<br />
- .-. - ,_. - ._ .- *’<br />
Fig. 15 - M ap showing location of water sampled from different sources, U. A. R.<br />
373
TAI<br />
Selected Chemiral Analyses for djffe<br />
Temper-<br />
No. location Source Hydrostratigraphic unit ature pH EC<br />
1. Burg El Arab Dug well<br />
2. El Dabaa Dug well<br />
3. Fuka Bore Hole<br />
4. Ras EI Hekma Dug well<br />
5. Siwa Oasis Bore Hole<br />
6. Qara Oasis Bore Hole<br />
7. Sitra Lake Surface Water<br />
8. Nuweimisa Lake Surface Water<br />
9. Bahrein East<br />
Lake<br />
10. Bahrein West<br />
Surface Water<br />
Lake Surface Water<br />
11. Arag Lake Surface Water<br />
12. Farafra Oasis<br />
13. Ain EI Gabal-<br />
Dug well<br />
Spring<br />
Dakhle Oasis<br />
14. El Maghara Bore Hole<br />
15. El Themada Bore Hole<br />
16. Ain El Gudeirat Spring<br />
17. Ain Qadeis Spring<br />
Pleistocene oolitic L.S.<br />
M. Miocene L.S.<br />
Miocene L.S.<br />
Pleistocene<br />
M. Miocene L.S.<br />
U. Eocene L.S.<br />
M. Eocene L.S.<br />
M. Eocene L.S.<br />
M. Eocene L.S.<br />
M. Eocene L.S.<br />
M. Eocene L.S.<br />
Maestrichtian chalk<br />
U. Cretaceous L.S.<br />
Lower Jurassic L.S.<br />
U. Senonian Chalk<br />
M. Eocene L.S.<br />
M. Eocene L.S.<br />
4. GEOCHEMISTRY<br />
(CO)<br />
25.3 - 11,(<br />
23.4 7.5 3,.<br />
- 7.7 3,<<br />
23.0 7.7 3,:<br />
26.0 8.3 34<br />
24.5 7.8 -<br />
20.0 7.2 360,i<br />
21.6 7.4 260,l<br />
19.0 6.7 470,l<br />
20.0 7.7 350,i<br />
19.0 - -<br />
28.9 8.4 -<br />
41.0 7.65 8<br />
30.0 -<br />
-<br />
29.5 8.2 15,i<br />
23.3 -<br />
23.5 - - -<br />
Table 2 shows clearly the chemical analyses of selected and representative water<br />
samples from different limestone reservoirs all over the country (figure 15).<br />
From field observations, it was noticed that different gases accompany the flow<br />
of water from either springs or water wells issuing from carbonate rocks of the oases<br />
depressions of the Western Desert and also the deep water wells of the Sinai Peninsula.<br />
Between the most important gases are COZ, H2S and methane. As we know, CO2 is<br />
considered to be one of the principal agents of chemical change on the different miner-<br />
als contained in the mother rock. Pressure of this gas if even dissolved from atmo-<br />
spheric air by rain at 0.0003 have the power to dissolve 50 mg of CaC03. Carbonic acid<br />
gas content in ground water varies between 180 and 550 mg. liter and rarely exceeds<br />
600 mg. per liter. It was found that this gas has great effect on the decomposition of<br />
limestones and silicates. Its presence in natural ground waters increases its acidity.<br />
Organic matters (e.g. lignite, Coal and hydrocarbons) have always a tendency to oxidise<br />
and generate carbonic acid gas in great amounts. Also, sulphuric acid produced by the<br />
oxidation of sulphides plays a great role in the decomposition of the limestones and<br />
its effect should noi be ignored. In addition reduction of the sulphates produce H2S<br />
gas and it is considered to be one of our problems as a severe corrosive agent for pipes<br />
and screens of the Oases wells.<br />
Temperature measurements for ground waters from carbonate rocks was found to<br />
be ranging from 19OC to 41OC. This wide range shows clearly if the water is meteoric<br />
314
ural waters in Limestone Reservoirs in U. A. R.<br />
T.S.S. Parts per million Trace<br />
1.p.m.) Elements<br />
Ca Mg Na K cos HC03 sog CI B Fe<br />
8,170<br />
2,100<br />
2,500<br />
2,500<br />
2,280<br />
4,880<br />
04,295<br />
41,294<br />
56,696<br />
98,756<br />
37,000<br />
1,813<br />
288<br />
6,000<br />
9,606<br />
1,640<br />
1,100<br />
393 536<br />
71.2 64.4<br />
125 96.7<br />
107.2 107.0<br />
130 65<br />
296 180<br />
2,500 8,679<br />
2,143 7,594<br />
1,786 8,138<br />
1,429 9,013<br />
1,650 1,650<br />
12 45<br />
36 56<br />
136 120<br />
107 108<br />
150 177<br />
160 56<br />
2825 -<br />
750 -<br />
838 -<br />
838 -<br />
430<br />
1,150 52<br />
67,000 3,340<br />
37,000 2,000<br />
72,000 2,960<br />
42,000 3,200<br />
- -<br />
55 -<br />
71 33.5<br />
- -<br />
4,000 140<br />
491 -<br />
230 -<br />
nil 122<br />
nil 366<br />
12 348<br />
21 537<br />
- 110<br />
- 195<br />
6 153<br />
30 171<br />
nil 189<br />
15 207<br />
- -<br />
18 103<br />
nil 106<br />
- -<br />
1.5 17<br />
- -<br />
- -<br />
-<br />
4,006<br />
97 1<br />
- 1,032<br />
- 971<br />
324 780<br />
862 59<br />
2,674 112,500<br />
3,732 76,000<br />
2,955 143,500 57 0.24<br />
5,411<br />
24,600<br />
47<br />
16.5<br />
1,270<br />
nil<br />
161<br />
171<br />
96,000<br />
260,300<br />
124<br />
49<br />
2,600<br />
3,700<br />
503<br />
355<br />
0.34<br />
O. 3<br />
0.39<br />
1 .O3<br />
-<br />
-<br />
or deep seated one, except for the temperature measurements taken along the shorelines<br />
of the natural lakes south of Qattara Depression as it was not possible to measure the<br />
actual temperature of the springs issuing from the center of these lakes, which are expec-<br />
ted to be higher than the values tabulated (table 2).<br />
It can be noticed from table no 2 that mostly all the water from our limestones reser-<br />
voirs have a high salinity. From these analyses and other more ones obtained from such<br />
ground water reservoirs in different areas of U. A. R., it is clear that there are different<br />
types of waters, as follows:<br />
A. Chloride type waters:-which can be represented by those waters obtained from carbonate<br />
rocks along the Mediterranean littoral zone, due to see water encroachment.<br />
It is also noticed that waters of the natural lakes have a higher chloride content than<br />
any other anion. These waters which can be considered as brines and of a high Na cl<br />
content does not necessarily indicate fossil sea water, but may simply mean that there<br />
has been salt concentration by evaporation. The author is in favour with the latter case<br />
as evaporation factor is high in this region of the Western Desert.<br />
In the case of EI Maghara and EI Themada waters (Sinai), they have also a higher<br />
Na cl content and this case might be due to dissolution by stagnant groundwater.<br />
B. Bicarbanate type waters:-examples for this case are waters from Ain EI Gabal<br />
(Dakhla Oasis) and Ain EI Balad (Farafra Oasis) as their waters have a high sodium<br />
bicarbonate content.<br />
-<br />
375
C. Sulphate type waters:-This can be represented by waters from Qara and Siwa,<br />
Oases, Western Desert, as the limestones from which these waters issue contain<br />
considerable amounts of gypsum and anhydrite.<br />
Analyses done for the estimation of boron in some of the water samples tabulated<br />
(table 2) indicated that the natural lakes, south of Qattara Depression contain a great<br />
amount of boron ranging between 33.5-57 p.p.m., while for waters from El Themada<br />
well indicated the presence of 16 p.p.m. boron. Generally speaking, boron is one of a<br />
group of elements whose abundance in marine sediments and sea water is too great to<br />
be accounted for by a source from weathered igneous rocks. Boron is removed from<br />
sea water by illite, which is the most abundant of the clay minerals. Illite contains<br />
459 p.p.m. B. The average boron content of shales is close to 120-130 p.p.m.B. Some<br />
authors reached a conclusion that boron content in primordial ocean is more than in<br />
the present ocean, and that its content in sea water has not varied significantly for the<br />
last 2 to 3 billion years. The addition of Juvenile water and boron to the ocean has<br />
presumably been most rapid during periods of tectonic activity. However, erosion and<br />
sedimentation and hence boron removal, have also been most active during periods of<br />
increased tectonism.<br />
It is worth to mention that boron can be used as a paleosalinity indicator and quan-<br />
titative boron paleosalinity data can be applied to the reconstruction of paleoenviron-<br />
ments. Thus it gives rise to the possibility of its being a reflection of conditions in the<br />
groundwater origin.<br />
5. ACKNOWLEDGEMENTS AND BIBLIOGRAPHY<br />
5.1. ACKNOWLEDGEMENTS<br />
The author’s acknowledgement is due to his colleagues at the Desert Institute, in<br />
particular Dr. A. Shata and Dr. Ahmad Amin for their benefit discussions and for the<br />
facilities provided during the preparation of this work. My thanks are to my colleagues<br />
at the general Petroleum Co of Egypt for the valuable informations obtained. Also the<br />
author forwards his thanks to Miss Khairia Amir, for her help in the chemical analyses<br />
of some of the water samples. Collection of water samples from the natural lakes,<br />
south of Qattara Depression by the staff of the Geology Dept. of PAN AMERICAN<br />
OIL CO of Egypt, in their concession area, is greatly appreciated as it added valuable<br />
informations to this work.<br />
BIBLIOGRAPHY<br />
1. BALL, J., and BEADNELL, H., 1903. Bahariya Oasis, Its Topography and Geology.<br />
Survey Dept., Public Works Ministry, Egypt.<br />
2. BEADNELL, H., 1901. Dakhla Oasis, Its Topography and Geology. Geological<br />
Survey Report 1899, Survey Dept., Public works Ministry, Part IV.<br />
3. BEADNELL, H., 1901, Farafra Oasis, Its Topography and Geology. Geological<br />
Survey Report, 1899, Survey Dept. Public Works Ministry, part III.<br />
4. BURDON, D. J. et al., 1961. Methods of Investigating the Ground Water Resources<br />
of the Parnassos-Ghiona Limestones. Extract of Publication no. 57 of the<br />
I.A.S.H., Ground Water in Arid Zones, pp. 143-159.<br />
5. BURDON, D.J. et al., 1961. Development of a Karst Limestone Spring in Greece.<br />
Extract of Publication no. 57 of the I. A. S. H. Groundwater in Arid Zones, pp. 564-<br />
585.<br />
6. BURDON, D.J., and SAFADI, C., 1963. Ras-El-Ain, The Great Karst Spring of<br />
Mesopotamia, An Hydrogeological Study. Journal of Hydrology, vol. 1, no. 1,<br />
pp. 58-95.<br />
7. BURCHER, W.H., 1920-1921. Mechanical interpretation of Joints. Journ. of Geo.,<br />
vol. 28, pp. 707; vol. 29, pp, 1-28.<br />
376
8. CROSBY, W.O., 1893. The Origin of parallel and intersecting joints. Am. Geol.,<br />
VOI. 12, pp. 368-75.<br />
9. DE SITTER. L.V.. 1957. Structural Geoloav. Mc Graw-Hill Book CO. Inc.. New<br />
1-<br />
York. U.S.A. '<br />
1 o. EZZAT, M.A. et al., 1962. Preliminary report on the hydrogeology of the New<br />
Valley, Western Desert, Egypt, with special emphasis on Kharga Oasis. Egyptian<br />
Desert Development Organisation.<br />
11. FERRIS, J.G. et al., 1962. Theory of aquifer tests. Groundwater hydraulies, U.S.<br />
Geological Survey Water-Supply Paper 1536-E.<br />
12. HELLSTROM, B., 1940. The Subterranean water in the Libyan Desert. Bulletin no. 26<br />
of the Institution of Hydraulics at the Royal Institute of Technology, Stockholm,<br />
Sweden, pp. 206-239.<br />
13. HEM, J.D., 1959. Study and interpretation of the chemical characteristics of natural<br />
water. U. S. Geological Survey water-Supply Paper 1473.<br />
14. HUME, W.F. 1929. The surface dislocations in Egypt and Sinai, their nature and<br />
significance. Ext. Bull. Soc. Ro.v. de Geographie dlEgypte, Tome XVII, Le Caire.<br />
15. -, 1925-1937. Geology of Egypt. Ministry of Finance; Survey of Egypt. Cairo,<br />
vol. 1 and II.<br />
16. -, 1911. Secular oscillation in Egypt during the Cretaceous and Eocene Periods.<br />
Ext. Quart. Journal Geol. Soc., vol. XVII, pp. 118-148.<br />
17. -, et al. 1921. The Jurassic and Cretaceous Rocks of Northern Sinai. Ext. Geological<br />
Magazine, London, vol. LVIII, pp. 339-347.<br />
18. -, 1922. Recent researches on the Tertiary and Mesozoic Formations in Egypt<br />
and Sinai. Ext. C.R. du XIII" Congrèsgèologique international, Liege 1925, pp. 865-<br />
872.<br />
19. KOTCHINA, E.N. et al., 1960. Principles of the theory of flow of fluids through<br />
fissured rocks. Mathematics and Mechanics division of the Technical Department<br />
of the Academy of Science, Moscow. U. S. S. R., tome XXIV, part 5.<br />
20. LAHEE, F.H., 1941. Field Geology. Mc Graw-Hill Book Co Inc., New York and<br />
London, pp. 200-262.<br />
21. MITWALLY, M., 1951. Some new light on the origin of the artesian water of the<br />
Egyptian Oases of the Libyan Desert. Ext. du Bulletin de L'Institut du Desert,<br />
tome 1, no. 2, pp. 74-83.<br />
22. MURRAY, G.W., 1952. The water beneath the Egyptian Western Desert. Bullefin<br />
no. 34 of the Institution of Hydraulics at the Royal Iiutitute of Technology, Stockholm,<br />
pp. 443-452.<br />
23. PAVAO, M. and ZELJKO BABIC, 1963. Part of Microtectonics in resolving the local<br />
flow of groundwater in Karst. Geoloski Ujeshik, Zagreb, Yugoslauia, no. 16,<br />
pp. 233-242.<br />
24. EL RAMLY, 1. M.. 1964. Some remarks on the hydrogeology of the Bahariya Oasis,<br />
Western Desert, U. A. R. Paper given at the Geological Society of Egypt annual<br />
meeting, May 1964.<br />
25. -, 1964. The Use of Fissured Limestone in locating groundwater resources and<br />
its application to Farafra Oasis, New Valley, Western Desert, U. A. R. (in press).<br />
26. -, 1965. Recent hydrogeological studies on Qara Oasis, Western Desert, U.A.R.<br />
Paper given at the Geological Society of Egypt annual meeting, May 1965.<br />
27. -, 1965. New lights on the origin of the natural lakes, south Qattara Depression,<br />
Western Desert, U.A. R. (in preparation).<br />
28. SAAD, K. F.,1964.New Theories and Methods ofAnalysisfor Determining Hydraulic<br />
Properties of aquifers of Different Flow Systems with applications to some groundwater<br />
reservoirs in U. A. R. Ph. D. Thesis, Alexandria University. U. A. R.<br />
29. SAID, R., 1962. Geology of Egypt, Elzevier publishing Co.<br />
30. SHATA, A., 1961. The geology of the ground water supplies in some arable lands<br />
in the deserts of Egypt.<br />
31. TOLMAN, C.F., 1937. Ground water. Mc Graw-Hill Book Co. Inc., New York.<br />
U.S.A.<br />
32. TODD, D.K., 1959. Ground water Hydrology. John Wiley and Sons Inc., U.S.A.<br />
33. UNESCO, 1963. International legend for hydrogeological maps, I.A.S. H.,<br />
I.A. H. Paris.<br />
34. WJSLER, C.O. and BRATER, E.F., 1959. Hydrology. John Wiley and Sons Inc.<br />
U.S.A. pp. 127-191.<br />
3 77
RESUME<br />
PROBL&MES DE STOCKAGE DES EAUX DANS<br />
LE SUD-EST ESPAGNOL<br />
D. Agustin NAVARRO<br />
D. Antonio Almela SAMPER<br />
La région géographique qui correspond au Sud-est espagnol est excessivement sèche.<br />
La pluviométrie annuelle atteint à peine 225 millimètres. Le climat est très favorable<br />
pour les cultures agricoles de valeur élevée. Pour cela, la dosage des réserves d’eau sou-<br />
terraines est affaire de grand intérêt. Dans la présente communication on donne des<br />
chiffres comparatifs du pourcentage d’eau emmagasinée pour les différentes formations<br />
dans cette région espagnole.<br />
Nous comparons le facteur tectonique, le facteur métamorphique et le facteur<br />
de la composition, comme les trois éléments principaux qui conditionnent les possibili-<br />
tés d’emmagasinage des eaux dans les terrains calcaires. On montre quelques cas con-<br />
crets d’exploitation abusive qui ont produit de graves préjudices à la région. Quoique<br />
leschiffres qu’on donne ont seulement une validité réelle pour la formation géologique<br />
et l’aire tectonique indiquées, elles peuvent servir d’orientation pour d’autres roches<br />
et régions similaires.<br />
SUMMARY<br />
Digest of the problems of groundwater storage in south-easi Spain<br />
The geographical region embracing south-eastern Spain is extremely arid an with<br />
annual rainfall of barely 225 mm. The climate is, however, extremely favourable for<br />
high-value cash crops and accordingly the estimation of the groundwater reserves is<br />
extremely important. The present paper gives comparative figures of the percentages of<br />
water stored in the various formations of this part of Spain.<br />
The tectonics, metamorphism and composition are taken to be the three main fac-<br />
tors determining water storage capacity in calcareous terrains. A few concrete cases are<br />
given of unsound exploitation which has caused grave damage regionally. Although the<br />
figures given are only of real validity for the geological formation and tectonic area<br />
specified, they can provide pointers for other rocks and for similar regions.<br />
INTRODUCTION<br />
La région géographique qui correspond au sud-est espagnol est extrêmement sèche.<br />
La pluviométrie annuelle oscille entre 180mm et 450. Le climat est très favorable<br />
pour les cultures agricoles d’une grande valeur et, de ce fait, le dosage des réserves dis-<br />
ponibles en eaux souterraines présente un très grand intérêt.<br />
Dans la présente communication, on donne des chiffres comparatifs du pourcen-<br />
tage de stockage d’eau, pour toute une série de formations calcaires typiques de cette<br />
région espagnole. O n donne les chiffres, comme comparaison du volume des creux, en<br />
dessous du niveau de l’eau, en rapport avec le volume total de l’aquifère, en pourcen-<br />
tage de celui-ci.<br />
1. MARBRES MÉTAMORPHIQUES DU SILURIEN-DEVONIEN<br />
Le rocher consiste dans une alternance, en bancs de 0,5 a 1 mètre de puissance,<br />
de couches plus ou moins dolomitiques. Les dolomies sont des roches métamorphisées,<br />
avec des grains de dolomite de grandeur moyenne (0,l 0,3 mm) et des textures en<br />
mosaïques, avec quelques lames de muscovite, quartz et magnétite. Les pierres à chaux<br />
critallines (marbres), ont une texture granoblastique saturée, avec intercalation de mus-<br />
covite et quartz.<br />
378
La roche, en section, se présente à l’œil marmorisée. La recristallisation est postec-<br />
tonique, étant donné que les sections de calcite n’ont pas d’extinction onduleuse ou de<br />
macles et plans de glissement courbés.<br />
Les couches marmoréennes sont encastrées entre des paquets très argileux, totalement<br />
imperméables, d’ardoises et phyllades. Elles se présentent comme des dômes anticlinaux<br />
de marbres, entre des formations imperméables, tout près de Mojácar (Almeria). Dans le<br />
flanc nord, la puissance, en horizontale, est de 140 mètres.<br />
La surface de ce dôme anticlinal apparaît avec une rugosité extraordinaire du type<br />
karstique et les conditions filtrantes sont aussi excellentes, comme nous avons pu le<br />
vérifier dans d’autres zones voisines, comme celle d’Aguilas (Murcia) (le rapport eau<br />
infiltrée/précipitations atteint des valeurs de 70/
Extraction de 570.000 m3 approximativement en 8 mois (l’eau se vend aux enchères<br />
au m3 et son volume est connu).<br />
L’extension horizontale de l’aquifère, en dessous du niveau de l’eau, es1 de un million<br />
deux-cents mille m2, approximativement. L’extraction commence à un niveau<br />
donné et à la fin de la saison le niveau a descendu de 6,5 mètres; on retrouve le niveau<br />
initial après les pluies d’automne et d’hiver.<br />
Pendant 9 ans, ce régime d’exploitation, avec quelques variantes, se maintient constant,<br />
ce qui permet de le considérer comme un état approximatif d’équilibre. Le volume<br />
de l’aquifère utilisé est alors de 7.800.000 m3. Le rapport des vides obtenu est de 7 à 8%.<br />
La moyenne des précipitations dans la zone est de 240 l/m2 et l’aire de captation de<br />
4,l km2 environ, ce qui donne un coefficient d’infiltration (eau tombéeleau infiltrée)<br />
d’environ 60%.<br />
Les apports à la zone de stockage se poursuivent pendant une période de six mois;<br />
deux mois correspondent à la période d’extraction, c’est la raison pour laquelle nous ne<br />
les avons pas considérés dans nos calculs. Avec ces considérations, le volume réel de<br />
vide prend une valeur un peu moindre que celle indiquée, ce qui fait qu’on peut accepter<br />
comme valeur moyenne des vides :<br />
6+ 7%<br />
du volume total de l’aquifère.<br />
3. MOLLASSES TERTIAIRES<br />
Au nord de Jumilla (Murcia), on trouve une structure isoclinale miocène (dont<br />
l’affleurement a une extension de 5,6 km2) avec une longueur de 7,4 km et un pendage<br />
nord entre 5 t 10 degrés. Cette structure, isolée entre des marnes et des argiles<br />
imperméables, a une puissance mesurée en direction horizontale de 260 mètres. Le seul<br />
drainage de la formation était réalisé par une ancienne source (Fuente del Rico), qui a<br />
été actuellement approfondie par un puits d’où l’on extrait de l’eau sporadiquement<br />
pendant quatre mois de l’année et le reste du temps ce puits est en repos. Le rocher est<br />
de nature détritique, avec beaucoup de grains silicieux et un peu d’argile. Sa lithologie<br />
varie dans le sens vertical et a des intercalations totalement calcaires ainsi que des sec-<br />
tions de gravier silicieux cimenté dans la mollasse.<br />
Pendant la période d’exploitation, le puits débite un volume d’eau de quelque<br />
70.000 m3, avec une diminution de niveau de 5,25 mètres, comblée pendant l’hiver. L’ex-<br />
traction d’eau se fait de cette manière depuis trois ans, aussi pouvons-nous considérer<br />
le régime comme étant établi. Les pluies dans la région atteignent 420 mm par an,<br />
les apports sont pratiquement nuls durant les mois de pompage.<br />
Avec ces données, le coefficient d’infiltration obtenu est de 3,5/1 .OOO.OOO. Le volume<br />
des vides, en dessous du niveau de l’eau, est de 0,6+ 0,7%.<br />
4. CONCLUSION<br />
Le but du présent travail était de déterminer la
SUMMARY<br />
UN BASSIN-TEMOIN EN TERRAINS CALCAIRES<br />
LE BASSIN DE SAUGRAS<br />
Languedoc (France)<br />
C. DROGUE<br />
Université de Montpellier, Faculté des sciences, Centre d’études<br />
et de recherches hydrogéologiques<br />
An experimental basin in calcareous formations - The Saugras basin (Languedoc,<br />
France)<br />
An experimental basin has recently been installed on a calcareous massif in the<br />
south of France. Complete isolation of the aquifer and the localization of springs wil<br />
enable the run-off factor of the water-balance equation to be measured under the best<br />
conditions. This wil make it possible to calculate the evapotranspiration period charac-<br />
teristic of the type of karst observed here.<br />
It wil be possible to study, on a semi-experimental basis, the various factors that<br />
affect run-off deficit.<br />
La note ci-dessous a pour objet la présentation d’un bassin-témoin sur terrain calcaire<br />
(Bassin de Saugras) mis en place récemment dans le sud de la France, dans le cadre<br />
des travaux de recherches du CERH.<br />
Cette réalisation fait suite aux recherches hydrogéologiques entreprises sur les karsts<br />
languedociens par l’auteur, et répond à la nécessité d’apporter une contribution à<br />
l’étude des problèmes du cycle de l’eau dans les terrains calcaires.<br />
Le choix de ce bassin a été fait, compte.tenu essentiellement :<br />
- du faciès pétrographique uniforme sur toute son étendue;<br />
- de sa structure géologique simple favorisant la localisation d’un petit nombre de<br />
sources;<br />
- de sa situation en climat méditerranéen type;<br />
- de son environnement exclusivement calcaire, ce qui exclut tout effet d’oasis.<br />
I. CARACTERES GÉNÉRAUX DU BASSIN<br />
1.1. Morphologie-Géologie<br />
Situé à environ 30 km de la côté méditerranéenne, le bassin de Saugras, qui est un<br />
mamelon calcaire d’une superficie de 1 kmz est installé à l’intérieur d’un bas plateau<br />
karstique très étendu, à l’altitude moyenne de 250 mètres.<br />
Au point de vue géologique, c’est un synclinal perché de calcaires lacustres lutétiens<br />
reposant sur les marnes argileuses imperméables de I’fiocène inférieur.<br />
Ces marnes, à passées gréseuses localisées, correspondent à une sédimentation con-<br />
tinentale recouvrant les calcaires massifs du Jurassique supérieur.<br />
La présentation de la figure 2, qui au point de vue arrangement des terrains est<br />
valable quelle que soit la direction de la coupe, montre bien que les calcaires du Luté-<br />
cien sont isolés du karst sous-jacent par une épaisse couche de marnes imperméables<br />
(30 à 150 m).<br />
381
Les pendages de 8 à20° sont tous dirigés vers le centre de l’affleurement, sauf dans<br />
la partie sud, OU l’amorce d’une structure en gouttière a favorisé la mise en place de la<br />
source principale.<br />
En surface, les calcaires sont lapiazés et partiellement recouverts de régolites, dis-<br />
position extrêmement fréquente dans la région languedocienne.<br />
ì.2. Pluviarnr‘trie<br />
Fig. 1 - Situation du Bassin de Saugras.<br />
La région est ici soumise au climat méditerranéen type. En ce qui concerne la plu-<br />
viométrie, deux stations installées à plus de 10 km de Saugras indiquent sur 9 et 12<br />
ans, pour la moyenne annuelle en mm d‘eau :<br />
St-Martin de Londres 1.010 mm<br />
St-Gély du Fesc 793 mm<br />
Vraisemblablement, la moyenne annuelle doit être à Saugras voisine de 900 mm.<br />
1.3. Hydrologie<br />
La situation stratigraphique et structurale d’un massif calcaire synclinal isolé sur des<br />
marnes imperméables, a favorisé l’individualisation d’une nappe aquifère qui est à<br />
l’origine de trois sources de débordement.<br />
382
oso<br />
c<br />
/<br />
\<br />
\<br />
kard<br />
1<br />
.<br />
--.<br />
coupe suivant A-B<br />
- Légende -<br />
a Lutetien -Calca¡rcs. (SAUGRAS)<br />
Eocene inF. Marnes.<br />
Jurassique sup.- Calcaires.<br />
/ Faille Pcndage<br />
Fig. 2 - Saugras. Carte géologique sommaire.<br />
383
Situés à la limite calcaires-marnes, ces points d’eau ont les caractéristiques suivantes:<br />
Débits extrêmes<br />
Désignation Altitude en m en m3/s<br />
Source de la Cure<br />
Source de Saugras<br />
Source de Cantagrils<br />
I70<br />
182<br />
195<br />
0,001 - 0,040<br />
nul - 0,250<br />
nul - 0,200<br />
La source la plus basse est donc la seule pérenne. Ses faibles débits instantanés sont<br />
le fait de l’écoulement au travers d’un éboulis peu perméable.<br />
II. RECHERCHES POURSUIVIES<br />
11.1. Le but essentiel de la mise en fonctionnement du bassin de Saugras est le calcul<br />
des différents termes du bilan hydrologique pour un type particulier de karst<br />
(karst à rigolite) très fréquent en Languedoc.<br />
En conséquence, on pourra envisager la comparaison du terme éuapotranspi-<br />
ration, calculée directement par l’équation :<br />
E=P-Q<br />
avec les résultats :<br />
- des différentes formules données par les auteurs;<br />
- et des méthodes nouvelles expérimentales.<br />
11.2. Rôle des différents paramètres météorologiques liés 21 la pluie (intensité-durée) ou<br />
indépendants de l’averse (vent-insolation température) sur le déficit d’écoulement.<br />
11.3. Etablir l‘action de Ia Végétation sur ce même déficit d’écoulement par des déboisements<br />
ou plantations partiels.<br />
11.4. Etude du mécanisme d’écoulement dans ces terrains calcaires (hydraulique souterraine<br />
en terrains fissurés) à partir :<br />
- de l’analyse des hydrogrammes de crues des sources;<br />
- des essais de pompages sur celles-ci et sur des forages.<br />
11.5. Ces travaux permettront d’aborder l’étude de l’état de fissuration - arrangement<br />
et répartition des vides - dans ces terrains (cf. C. Drogue, 1963 - C.R. Acad. des<br />
Sc. -Paris et Réunion de Belgrade AIH).<br />
11.6. Etude des conditions accompagnant l’apparition du ruissellement superficiel sur<br />
les calcaires et hypodermique dans les rigolites (ce phénomène apparaît dans un<br />
thalweg par gros orages). Rôle des facteurs météorologiques et de l’état des versants<br />
(végétation, lapiaz, pente...).<br />
11.7. Mesure des vitesses de circulation souterraine des eaux au moyen d’injection de<br />
traceurs en différents points du bassin.<br />
III. EQUIPEMENT<br />
Du fait de notre ignorance de l’importance et du rôle des divers facteurs en présence,<br />
I’équip ement complet du bassin est prévu en plusieurs étapes.<br />
384
I1 a été tout d‘abord mis en piace un équipement préliminaire qui doit fonctionner<br />
une année environ, ceci afin de disposer un équipement plus complet d’une façon efficace.<br />
L’équipement préliminaire qui fonctionne depuis juin 1965 comprend :<br />
- une station de jaugeage sur chaque source;<br />
- un réseau pluviomètre;<br />
- une station météorologique sommaire.<br />
V<br />
V<br />
. . . . . . .<br />
Cure \, \<br />
\ ’<br />
\ ‘<br />
\ ‘<br />
\ 2<br />
r-<br />
Bassin. v Piuviométre.<br />
o Source. + P1uv;ographe.<br />
Srution de jaugeages.<br />
Fig. 3 - Saugras. Equipement actuel.<br />
111.1. Stations de jaugeages<br />
A l’aval de chaque source, une station de jaugeage mesure d’une façon continue les<br />
débits évacués. Elle est constituée par: un canal en tôle ancré sur unmur de béton étanche,<br />
et muni en bout d’un déversoir triangulaire à 60’.<br />
Un puits en relation avec le canal abrite un limnigraphe.<br />
Le tarage de chaque station se fait à la capacité jaugée pour les faibles débits et au<br />
micromoulinet, à l’intérieur du canai, pour les débits importants.<br />
385
111.2. Stations météorologiques et pluuiométriques<br />
La station météorologique installée au centre du bassin est équipée sommairemont;<br />
elle permet de mesurer et d’enregistrer la température, l’humidité et le pouvoir évaporant<br />
de l’air (Piche).<br />
Le réseau pluviométrique actuel comprend :<br />
- 3 pluviographes;<br />
- 6 pluviomètres.<br />
IV. JUSTIFICATION D’UN TEL BASSIN<br />
I1 est bien certain qu’en toute rigueur, les caractéristiques mesurées et calculées sur<br />
le bassin de Saugras ne seront représentatives que de ce dernier.<br />
C’est à priori ce qui semble réduire considérablement l’intérêt d’une telle entreprise.<br />
I1 faut donc porter un soin attentif au choix du bassin et au but des recherches envisagées.<br />
Ainsi, il faudra à notre sens que les caractères physiques du bassin-témoin soient<br />
extrêmement bien définis et uniformes sur toute étendue, dans la mesure du possible,<br />
de sorte que l’on puisse attribuer, sans ambiguïté, les informations obtenues a des facteurs<br />
bien caractérisés.<br />
Le bassin de Saugras a été choisi dans cet ordre d’idée pour la constance, sur toute<br />
sa surface, de son faciès calcaire couvert de rigolites, soumis à un climat méditerranéen.<br />
De plus, pour utiliser pleinement les renseignements obtenus sur ce bassin, et pour<br />
en vérifier l’utilité, l’étude hydrologique de grands ensembles karstiques du sud de la<br />
France est menée parallèlement.<br />
CONCLUSION ’<br />
Le bassin de Saugras. mis en place récemment sur un massif calcaire, doit permettre<br />
d’obtenir des données quantitatives SUT le bilan hydrologique d’un type de karst soumis<br />
à un climat méditerranéen.<br />
I1 serait souhaitable que d’autres bassins-témoins soient étudiés dans le même ordre<br />
d’idées. Ceci afin que les informations différentes obtenues puissent être comparées<br />
entre elles, compte tenu des facteurs propres à chaque bassin.<br />
L’utilité de telles éludes est évidente puisque les calcaires constituent dans les régions<br />
arides et semi-arides la majorité des aquifhres pouvant être exploités.<br />
386
THE INFLUENCE OF KARST ON THE MAXIMUM<br />
FLOW OF THE RIVERS OF THE EAST EUROPEAN<br />
PLAINS<br />
RESUME<br />
O.L. MARKOVA<br />
(USSR)<br />
L’influence du karst sur le débit maximum des cours d’eau de la plaine de l‘Europe orientale<br />
L’analyse des données recueillies depuis de nombreuses années sur le régime de<br />
plus d’une quarantaine de cours d’eau karstiques de la plaine de l’Europe orientale et<br />
de cours d’eau voisins non karstiques a permis de dégager les conclusions suivantes :<br />
1. La grande capacité d’absorption et d’accumulation des formations karstiques<br />
entraîne une diminution des coefficients de ruissellement (précipitations et fonte des<br />
neiges) ainsi qu’une forte diminution de l’indice de ruissellement et du volume des crues<br />
maximales des cours d’eau karstiques.<br />
2. La diminution de l’indice de ruissellement et des débits maximaux est d’autant plus<br />
forte qu’il y a plus de karst dans les bassins fluviaux: elle est aussi fonction de la corrélation<br />
qui existe entre les eaux de surface et les eaux souterraines.<br />
3. Dans les cours d’eau karstiques qui drainent une grande partie des eaux de ruissellement<br />
de leurs bassins versants (d’une superficie de plus de 500 ou 1.0û0,km2), la diminution<br />
de l’indice de ruissellement ne dépasse pas 50 à 60”. Le débit maximum diminue<br />
proportionnellement à l’indice de ruissellement. En période d’étiage, la diminution est<br />
habituellement plus grande que pendant les hautes eaux. De ce fait, les variations du<br />
débit des cours d’eau karstiques sont un peu plus marquées que celles des cours d’eau<br />
non karstiques.<br />
4. Quand on doit calculer le débit maximum des cours d’eau karstiques non étudiés<br />
(avec une superficie de bassin versant de plus de 500 ou 1.000 km2), la méthode a<br />
employer pour déterminer l’influence du karst sur le débit maximum dépend du schéma<br />
de calcul. Si ce schéma comporte l’indice de ruissellement, c’est en apportant une correction<br />
à cet indice de ruissellement qu’on obtiendra la diminution du débit. Si le<br />
schéma ne tient pas compte de cet indice, la correction est directement introduite dans<br />
la valeur du débit.<br />
5. Du fait de la non-coïncidence des bassins versants et des formations souterraines,<br />
l’influence du karst sur le débit maximum des petits cours d’eau (superficie inférieure<br />
à 500 km2) est plus complexe et peut varier même quand le degré de développement du<br />
karst est analogue. I1 est impossible de déterminer cette influence sans une enquête<br />
préliminaire sur le terrain.<br />
The water regime of karstic rivers is characterized by a number of peculiarities and<br />
differs considerably from the regime of adjacent non-karstic rivers. Karst has an espe-<br />
cially great influence on maximum stream flow. Great losses of rain and snow-melt<br />
water which are characteristic of karst regions and the storage capacity of underground<br />
karst formations give rise to the sharp decrease of runoff depth and maximum<br />
discharges of floods on the most of karstic rivers.<br />
These special conditions of runoff formation are why considerable errors arise in<br />
obtaining the design characteristics of flood runoff of karstic rivers by commonly used<br />
methods, based on zonal runoff maps, runoff formulae and the data of hydrologically<br />
similar rivers.<br />
The improvement of hydrological design techniques for karst regions and the elab-<br />
ooration of corrections for karst is one of the important problems of hydrology.<br />
The investigation presented in this paper is the first attempt at the analysis and gener-<br />
alization of maximum runoff data from more than 40 karstic rivers situated in different<br />
climatic zones of the East European Plains. The rivers drainage areas range from some<br />
ten to 30,000 km2. Quantitative estimation of karst influence on the flood flow of these<br />
387
ivers was made by comparison of the runoff of karstic rivers with the zonal runoff (i.e.<br />
Runoff formed in definite climatic conditions with representative physiographical<br />
factors).<br />
For this purpose data were used from long-term investigations of the maximum<br />
runoff of karstic and non-karstic rivers, mainly obtained at the base network of the<br />
USSR Hydrometeorological Service.<br />
In this paper prime attention is paid to the problem of formation of spring runoff<br />
(i.e. runoff resulting from snow melt) of karst rivers, because of the predominance of<br />
maximum discharges of snow-melt floods over rain floods and because of the better<br />
knowledge of this phase of river regime.<br />
Analysis of the data shows that the degree of karst influence on runoff depth and<br />
maximum flood discharge depends ou the intensity of karst development and upon the<br />
inter-relationship of surface and underground waters in river basins.<br />
The influence of karst is greatest upon rivers with losses to underground, where most<br />
of the absorbed runoff flows out of their catchment areas. Such rivers are wide-spread<br />
and occur in almost all karst regions. They usually have small catchment areas (up to<br />
about 500 km2), a low annual rate of runoff and in dry seasons most of them dry up.<br />
Apart from climatic factors, the depth of the spring runoff depth of these rivers depends<br />
on the rate of losses of snow-melt water and is in inverse relation to the degree of karst<br />
development. Table I shows the spring runoff depths of some rivers of this type and the<br />
degrees of their deviation from the zonal runoff (the depth of spring runoff of neigh-<br />
bouring non-karstic rivers is accepted as the zonal runoff).<br />
Table I shows that the depth of spring runoff of karstic rivers and brooks ranges<br />
from O to 0.63 of the zonal runoff, so depending on the degree of the karst development<br />
of their basins, runoff is less than the zonal value by 37% to 100% (complete cessation).<br />
TABLE I<br />
The depth of spring runoff of karstic rivers with losses to underground, compared<br />
to the zonal depth of runoff<br />
Depth of spring runoff<br />
Area of (mm)<br />
River Catchment karst Period Of for karstic zonai hk<br />
area development investigations rivers runoff -<br />
(in km2> PA> (y e a r s 1 hk hz hz<br />
Kamenka<br />
Uluir<br />
Termenevka<br />
Mejevoy Log<br />
Pokrovsky Log<br />
Sukhaya<br />
S heleksa<br />
Pyarga<br />
Kama rioer basin<br />
68 25 1952-1963 58 140 0.42<br />
327 55 1952- 1961 61 96 0.63<br />
24 34 1952- 1961 61 140 0.46<br />
22 I O0 1954-1959 7 98 0.07<br />
19 1 O0 1954- 1964 O 92 O<br />
Severnaya Dvina rioer basin<br />
270 1 O0 1949 46 200 0.23<br />
246 1 O0 1949 29 200 0.14<br />
As the index of karst development we accept the percentage of catchment area where<br />
surface karst formations are developed.<br />
This index is undoubtedly an approximate index of karst development, especially<br />
for small catchments, as the intensity of karst development and its absorbing capacity<br />
388
may differ considerably between sites of equal area. It would be more correct to accept<br />
the density of karst formations-the amount of karst formations per 1 km2-as the<br />
index of karst development, but unfortunately there arepractically no such data and the<br />
definition of this feature needs special investigations; it is impracticable for large areas.<br />
The spring floods on karstic rivers with underground losses are almost entirely for-<br />
med from the surface runoff, i.e. to the volume of snow-melt water, which has not had<br />
enough time to be absorbed by karst.<br />
The hydrographs of spring runoff of such rivers are reduced versions similar in form<br />
to the hydrographs of non-karstic rivers.<br />
For greater catchment areas and increased depths of erosion karstic rivers tend<br />
to drain most or all of the runoff entering at their catchment areas.<br />
Within the East European Plains, where tectonic breaks are not great, rivers with<br />
drainage areas more than 500-1000 kmz are usually the base of karst erosion and under-<br />
ground waters do not leave the boundaries of their basins. The outflow of karst waters<br />
towards remote artesian basins andzones of tectonic disturbances or the inflow occurring<br />
in some river basins of more considerable area (the Zapadnaya Dvina river at Vitebsk<br />
and Pliavinsk rapids, the Sereja river etc.) is not great in comparison with the total<br />
volume of spring runoff.<br />
The depth of spring runoff of karstic rivers with drainage area of more than 500-<br />
i000 km2 is mainly lowered because of the accumulation of a part of snow-melt water<br />
in underground karstic cavities.<br />
The accumulating influence of karst at some river stretches is also increased owing<br />
to the existence of underflow and sometimes of “subvalley” flow. Such a phenomena<br />
was noted, for example, on the Sylva at the Urals (near the Kungursk cave). The ana-<br />
lysis of the spring runoff data leads to the conclusion that in the most unfavourable com-<br />
bination of the conditions of karst development when: (1) the whole river basin is in<br />
the zone of karst development, (2) the capacity of underground karst collectors is great,<br />
(3) the underflow and “subvalley” flow exist, etc., the depth of spring runoff of such<br />
karstic rivers is usually not lowered by more than 50-607; in comparison with the normal<br />
zonal runoff depth (table 2). The comparison of the spring runoff depth of karstic rivers<br />
of different climatic zones (table 2) shows, that the degree of karst influence depends<br />
slightly on the amount of snowpack and is more or less the same in the regions with the<br />
zonal runoff depth of 200 mm (the Pizhma river) and 15 mm (the Reut river).<br />
Almost the same hydrological effect of karst in different climatic zones can be explai-<br />
ned by the correspondence of the intensity of karst development with the volume of<br />
flowing water, i.e. by the decrease of karst development in the south direction with the<br />
decrease of humidity.<br />
The value of drainage area in the range of 500-30,000 krn2 only slightly influences<br />
the spring runoff depth of karstic rivers.<br />
There is an opinion that karst, because it considerably reduces the depth of spring<br />
runoff in normal years, influences slightly the runoff of high spring floods. In hydrol-<br />
ogical design practice the influence of karst on runoff in the years with a high spring<br />
flood of rare frequency has the greatest interest. For the purpose of the study of this<br />
problem the depths of spring runoff of karstic and non-karstic rivers were compared<br />
at their once in 100 years frequency.<br />
As table 2 shows, the ratios of the runoff depth of 17; frequency of the most<br />
karstic rivers to the zonal depth is a little more than the ratio of their averages. This<br />
means that in spring seasons of high runoff the influence of karst is slightly decreased<br />
(but remains considerable) whilst the intensity of snow melt is great.<br />
Besides the two sorts of rivers mentioned above, one more type occurs in karstic<br />
regions, that is-karstic rivers with gains of underground water, draining areas which<br />
exceed considerably their surface catchments. Usually these are small rivers (with<br />
catchment areas less than 500 km2) and their regime is almost the same as that of springs.<br />
389
390<br />
2<br />
c<br />
E<br />
N<br />
e,<br />
c<br />
b<br />
*<br />
.- v1<br />
5<br />
3<br />
?,<br />
U<br />
i-<br />
- d<br />
ã<br />
M<br />
.-<br />
5<br />
L<br />
O<br />
a<br />
2 0<br />
B<br />
u<br />
5<br />
M<br />
.- C<br />
c,<br />
2<br />
U<br />
s<br />
e
They are characterized by: (1) high annual runoff, which is sometimes 2-3 times<br />
more than the annual runoff of non-karstic rivers, (2) high discharges during the du<br />
season, and (3) the depth of spring runoff which is near to zonai and sometimes higher.<br />
Such rivers often occur on the outskirts of karst plateaus and are rather numerous in<br />
the Leningrad region and in Estonia.<br />
The main feature of spring floods of the rivers of this type is that the waters of frac-<br />
tured-karst rocks have considerable effect upon their formation. Consequently the rise<br />
of flood is gradual, the peak is smoothed and the end of the flood dwindles with the<br />
exhaustion of karst water storage throughout the whole year.<br />
The depth of the spring runoff of some rivers of the mentioned type is given in table 3.<br />
TABLE 3<br />
The depth of spring runoff of karstic riders mith gains of underground water<br />
Depth of spring runoff (mm)<br />
Catchment Period of<br />
River area<br />
(km?<br />
investigation<br />
(years)<br />
karstic<br />
river<br />
zonal<br />
runoff<br />
hk<br />
-<br />
(hk) (hz) hz<br />
Ryadanj 118 1959-1962 159 i 30 1.22<br />
Khrevitsa 316 1944-1962 176 120 1.47<br />
Kunda 3 90 1947- 1962 122 120 1.03<br />
Oredezh 230 1952-1 962 122 130 0.94<br />
It is usually impossible to estimate the area of the underground catchment of these<br />
rivers without special hydrogeological investigations. Besides, the boundary of contri-<br />
butory area is changeable and can shift with change of underground water level.<br />
The quantitative estimation of karst influence on the maximum discharge (rate of<br />
runoff) of spring flood is a more complicated problem.<br />
The dependence of maximum discharges upon various local factors such as relief<br />
forests, swamps, lake storage, velocity of snow melt water, etc.-causes their consid-<br />
erable variety even within small areas and makes it difficult to select analogues for<br />
karstic rivers.<br />
In order to isolate and estimate the influence of karst among other factors the region-<br />
al graphs of relationship between the maximum rate of spring runoff of karstic and<br />
non-karstic rivers (average and maximum of I % frequency) and the drainage area were<br />
constructed:<br />
q/8 = f(F) and s’%/a = f(F),<br />
where<br />
q - maxium rate of runoff in litre per second for square kilometre,<br />
6 - correction factor for excluding the influence of lakes and swamps,<br />
F - drainage area in kma<br />
The correction factor 6 is given by the formula:<br />
6 = 1.0-0.7Igcfi +00.2fs+1),<br />
wherefi andf,-the areas of lakes and swamps, respectively in % of the total drainage<br />
area.<br />
When plotting the graphs (fig. l), the rivers with similar values of the spring runoff<br />
depth, slope and forest area of the basin were selected. The maximum rate of runoff<br />
for each of the rivers if there were no karst in their basins, were computed by the dia-<br />
grams (by drainage area value).<br />
39 1
800<br />
200<br />
roo<br />
50 I00 ruoo<br />
e 1 o 2<br />
/ffOOO<br />
Fig. 1 - Graphs of relationship between 416 and drainage area: 1. non-karstic rivers;<br />
2. karstic rivers; I. the basin of the White and Barents Seas; II. the basin of the<br />
Baltic Sea, (q is the average value of the maximum discharge l/sec/km2).<br />
The analysis of the relationship 418 -f((F) showed that the maximum rates of spring<br />
runoff of karstic rivers of all types are smaller than those of non-karstic rivers; the<br />
influence of karst is greatest on the maximum rates of runoff of small rivers with nega-<br />
tive underground water exchange.<br />
If the karst development of catchments is 100% the relative reduction of the maxi-<br />
mum rates of runoff of such rivers reaches 80-90% (table 4, the rivers Pyarga and<br />
Sukhaya Sheleksa'. In this table qt is the computed discharge for a non-karstic river.<br />
In some cases, as the table 4 shows, the maximum rate of runoff is decreased by<br />
60-70:( (the rivers Kamenka and Termenevka) even in the case when the karst devel-<br />
opment is only 20-30%.<br />
Such an intensive absorption in the basins of the rivers Kamenka and Termenevka<br />
occurs where they cross the zones of tectonic disturbances; many karst formations are<br />
associated with these disturbances.<br />
The influence of karst on the maximum spring flood discharge is relatively less in<br />
deeply-cut river valleys. Karst also is less important when snow melt infiltration is<br />
392
, I. - d-<br />
500<br />
400<br />
$00<br />
.?ou<br />
1110<br />
I l l I I I I I I I I I l<br />
Fig. 1 bi* - Graphs of relationship between qZ/6 and drainage aera: 1. non-karsticriver;<br />
2. karstic rivers; I. the Basin of the White and Barents Seas; II. the basin of the<br />
Baltic Sea. qz is the 1 frequency value of the maximum discharge l/sec./km2.<br />
reduced. The investigation showed that maximum rates of runoff of karstic plain rivers<br />
with a drainage area of more than 500-1000 km2 are not as a rule less than 60-70%<br />
those of non-karstic rivers (table 5).<br />
Such a decrease is observed when the karst development of the catchment is 100%<br />
(the rivers Yemtsa, Kepina). With lesser karst development the maximum rates of<br />
runoff go up and when the karst development is not more than 507; the relative reduc-<br />
tion of the maximum rates of runoff does not usually exceed 30-407:.<br />
The maximum rates of runoff of rivers with closed water balance are decreased more<br />
or less in proportion to the depth of spring runoff. The ratios of the maximum rate of<br />
runoff to the depth of runoff during the spring flood (q/h) of the most such rivers vary<br />
within the same range as that of non-karstic rivers (fig. 2, I).<br />
The maximum rates of runoff of karstic rivers with gains from underground water<br />
and with the relatively high depth OS spring runoff are 2 to 2.5 times less than those of<br />
adjacent non-karstic rivers (table 5, the rivers Kunda and Oredezh); this is explained<br />
by considerable participation of underground waters in their maximum runoff.<br />
The ratios q/h of such rivers are considerably lower than of non-karstic rivers (fig. 2,<br />
II).<br />
393
m 1 o 2<br />
Fig. 2 - Graphs of relationship between q/hS and drainage area: 1. non-karstic rivers;<br />
2. karstic rivers; I. the basins of the White and Barents Seas; 11. the basin of the<br />
Baltic Sea. q is the average value of the maximum discharge l/sec./kmz.<br />
TABLE 4<br />
The maximum rates of spring runoff of karstic ricers<br />
with negatiue underground water chaìige<br />
Maximum discharge in<br />
litre/second per square<br />
Area of kilometre<br />
Catchment karst Period of -<br />
Rivers area develop- observation for computed 4k<br />
km2 ment years karstic qe -<br />
river 4c<br />
Seaernaya Duina riuer basin<br />
Pyarga<br />
Sukhaya<br />
246 100 1949 23 180 0.13<br />
Sheleksa 210 1 O0 1949 42 180 0.23<br />
Kamenka<br />
Termenev ka<br />
68<br />
24<br />
Kama riuer basin<br />
25 1952-1963<br />
34 1952-1 961<br />
- 88 286<br />
124 291<br />
0.31<br />
0.42<br />
394<br />
qk
47%<br />
I 1 1 1 1 1 1 1 J<br />
Fig. 2bia - Graphs of relationship between qz/liS and drainage area: i. non-karstic<br />
rivers; 2. karstic rivers; I. the basin of the White and Barents Seas; II. the basin<br />
of the Baltic Sea. qz is the 1 % frequency value of the maximum discharge l/sec./km2.<br />
The variability of the spring runoff of karstic rivers is determined by the fluctuations<br />
of climatic factors, by the different losses of snow-melt water from year to year and by<br />
the storage capacity of underground karst formations.<br />
The dependence of climatic factors gives rise to fairly synchronous variation of<br />
runoff depths and maximum discharges of floods of karstic and non-karstic rivers;<br />
karst formations decrease or increase the amplitude of these spring runoff variables.<br />
Study of the long-term spring runoff data of about 30 karstic rivers of different types<br />
shows that the coefficients of variation of runoff depth and maximum discharges of<br />
karstic rivers are, as a rule, equal to the coefficients of variation of non-karstic rivers or<br />
may be 10-30% higher (table 6).<br />
The higher range of variation of spring runoff characteristic of many karstic rivers<br />
(Yemtsa, Kepina, Serezha, etc.) is explained by the considerable variability of the snow-<br />
melt losses.<br />
In some springs with small runoff, small intensity of snow melt and slight freezing<br />
of soil, the absorption of snow-melt water reaches large proportions and the runoff of<br />
karstic rivers is decreased sharply. During high, rapid spring floods when the soil is<br />
heavily frozen and karst formations are covered with ice the losses of runoff are smaller<br />
(in comparison to the zonal runoff).<br />
The participation of karstic waters in the formation of the spring good does not<br />
always decrease the variability of its runoff.<br />
395
396<br />
mt-om<br />
Ni-<br />
0 .<br />
bl&<br />
oclomt-<br />
??Y?.<br />
00000<br />
mwmw<br />
wt-O0<br />
i - i c l<br />
mm(u0m<br />
?‘?Y??<br />
00000<br />
Od(ur4<br />
??.?<br />
O000
TABLE 6<br />
The coefticients of vuriution of rrmoff depth, and maximum dischurges<br />
of karstic und adjacent non-karstic rivers<br />
Coefficients of variation<br />
Drainage Area of Number of<br />
River area karst the years of runoff of maximum<br />
(km2) development of depth discharge<br />
(%) investigation* Cvh Cu 4<br />
Yula<br />
Voloshka<br />
Yemtsa<br />
Kepina<br />
Yashtchera<br />
Luga<br />
Khrevitsa<br />
Sista<br />
Oredezh<br />
Sivinj<br />
Pyana<br />
Serezha<br />
Kudjma<br />
Babka<br />
Tulva<br />
Sars<br />
Irenj<br />
1 2 3 4 5 6<br />
4,470<br />
7,000<br />
i ,580<br />
1,170<br />
581<br />
839<br />
316<br />
550<br />
230<br />
1,060<br />
7,880<br />
1,810<br />
1,700<br />
2,020<br />
1,830<br />
1,350<br />
6,060<br />
White Sen and Burents Sed basins<br />
0. 23<br />
O 21<br />
1 O0 27<br />
1 O0 10<br />
Baltic Sea basin<br />
O lo<br />
O 19<br />
65 19<br />
60 17<br />
50 Il<br />
Volga rilier hnsiii<br />
O 26<br />
O 26<br />
76 10<br />
65 22<br />
Kama rirer husiii<br />
O 21<br />
O 12<br />
70 17<br />
55 10<br />
* Short series are adjusted to long-term series<br />
0.31<br />
O. 34<br />
0.46<br />
0.37<br />
O. 37<br />
0.35<br />
0.30<br />
0.26<br />
0.36<br />
0.36<br />
0.46<br />
0.54<br />
0.46<br />
o. 39<br />
O. 30<br />
0.30<br />
O. 30<br />
0.39<br />
0.28<br />
0.50<br />
0.45<br />
0.48<br />
0.52<br />
0.39<br />
0.45<br />
O. 52<br />
0.42<br />
0.49<br />
0.66<br />
0.55<br />
0.54<br />
0.29<br />
0.43<br />
0.30<br />
For instance, the spring runoff of the river Yemtsa in its headwaters is formed of<br />
more than 50% underground karstic water and the variability of its spring runoff depth<br />
and maximum discharges is the greatest within the Onega Dvina catchment.<br />
The low regulation of karstic waters is explained by their close correlation with sur-<br />
face runoff.<br />
The variability of spring runoff is decreased only in those cases when spring runoff<br />
includes deep-level karstic waters (e.g. the rivers Sista and Khrevitsa).<br />
The coefficients of variation of runoff depth and of maximum flood discharges<br />
(resulting from snow melt) of such rivers are 10-20:< lower than the coefficients of<br />
adjacent non-karstic rivers (table 6).<br />
Maximum discharges of floods resulting from rain within the East European Plains<br />
usually exceed the maximum discharges of spring ñood only in the case of rivers with<br />
drainage area of 500-1000 km2, and less.<br />
397
9<br />
4. tM**ri<br />
300<br />
7964 E.<br />
........ 2<br />
250<br />
200<br />
1 M<br />
100<br />
50<br />
80<br />
60<br />
Co<br />
20<br />
0<br />
Fig. 3 - Hydrographs of rain floods: 1. non-karstic river; 7. karstic river; I - 1. Ka-<br />
menka, F (drainage area) = 44 km2; I - 2. Kamenka, F = 68 km2; II - 1. Iacht-<br />
chera, F = 58/km2; II - 2. Oredezh, F = 730 km2; III - 1. Aavoya, F = 31 .5km2;<br />
III - 2 - Pyarnu, F = 67.0 km2.<br />
398
The conditions of formation of rain-derived floods in karstic rivers are in a general<br />
way the same as those of spring runoff (resulting from snow melt). The considerable<br />
absorption of precipitation by karst, the partial accumulation of rain waters in underground<br />
collectors and so the decrease of maximum discharges and runoff depth.<br />
The degree of karst influence on rain-derived runoff of small rivers is diverse; it<br />
depends on the nature of their sources.<br />
At rivers which do not drain karstic waters the decrease of runoff resulting from<br />
rain is somewhat more intensive than that of runoff resulting from snow melt.<br />
The observations carried out at the river Kamenka showed that the depth of flood<br />
runoff in its mouth after crossing of the karstic belt is reduced from 110 rnm to 36 mm,<br />
i.e. is 3.1 times as small (based upon the long-term average), and the depth of runoff<br />
resulting from snow melt goes from 140 mm to 58 mm, i.e. is 2.4 times as small.<br />
The flood resulting from rain in the basin of this river was extremely high in July<br />
1964. The maximum rate of runoff of the river Kamenka then reached 720 ]/sec. krn2 in<br />
the upper non-karstic part (drainage area 44 kmz) and it was 342 lisec. km2 at the mouth<br />
(drainage area 68 km”, only half as great, in fact.<br />
Rain floods in the rivers with considerable karstic sources (the rivers Oredezh,<br />
Krevitsa, Kundaì are superimposed upon their high base flow. As a result, and despite<br />
the low rain runoff coefficient in their basins, the depth of flood runoff and of the maximum<br />
discharge of such rivers is higher than occurs in rivers with loss to underground<br />
water.<br />
The comparison of the flood flow of karstic and adjacent non-karstic rivers shows<br />
that during high rain floods the depths and maximum discharges of the rivers Oredezh.<br />
Khrevitsa and Kunda are 1.5-2.0 times less than in the rivers with non-karstic basins.<br />
During low floods the decrease is less and in some years the total of rain runoff and<br />
base flow of these rivers is even higher than for non-karstic rivers.<br />
For correct estimation of the influence of karst on rain runoff the volume of the<br />
flood flow of such rivers must be determined by excluding the base flow. In some rivers,<br />
fed by deep karstic spring waters, rains generally do not cause floods-there is only an<br />
insignificant increase of runoff in some time after intensive rainfall (e.g. river Pyarnu<br />
in its upper course).<br />
To illustrate the above facts figure 3 shows the hydrographs of rain floods of the<br />
rivers Kamenka, Oredezh and Pyarnu in comparison with the hydrographs of adjacent<br />
non-karstic rivers.<br />
The analysis carried out above shows the rather diverse karstic influences on flood<br />
flow.<br />
Whilst discussing karstic influence it is necessary to distinguish those rivers with<br />
more or less closed water budget and karstic rivers with positive or negative water<br />
exchange caused by the difference in their surface and underground drainage basins.<br />
The reduction in depth of spring runoff of karstic rivers with closed water budget is in<br />
proportion to the karst development of their drainage basins. This allowed an estimate<br />
of the relationship between the ratio hrih,, and the degree of the karst development of<br />
drainage basin-Fr% (hk-the runoff depth of a karstic river, hz-the zonal runoff<br />
depth).<br />
These correction factors may be used for plain karstic rivers of any climatic zone<br />
with drainage area from 500 km2 to 30,000 km2.<br />
The ratios hk/h, = f(F2) of figure 4 are calculated for mean long-term values and<br />
maximum values of 1 % frequency of the depth of spring runoff.<br />
The h ~ Jratio h ~ of maximum runoff depths is somewhat higher than of the long-term<br />
means. However this difference is not great and doesn’t exceed 10%. For the estimation<br />
of correction factors it is more convenient to use the ratio (h& 1 %)/(hz 1 %) = f(Fk).<br />
Finally, the following technique may be recommended for estimation of spring<br />
runoff in karstic rivers with insufficient hydrometric data.<br />
399
At first the value of the zonal runoff depth is estimated (by the maps of average<br />
runoff depth or of the depth at 1% frequency using regional diagrams or analogous<br />
rivers).<br />
Fig. 4 -- The relationship between hr/hz and the degree of karst development of thc<br />
drainage hasin (Fk”,);<br />
a: averages foia long-term period,<br />
6: maximum values of 1:); frequency.<br />
Then the karst area of the drainage basin is estimated; according to this the value<br />
of the correction factor tothezonal runoff depth is taken from the graph (hic 1 %)/(hz 17;)<br />
= fíFk).<br />
400
Approximately the correction factor is as follows:<br />
Fk, Area of karst development in %<br />
0-25<br />
26 - 50<br />
51 - 75<br />
76 - 100<br />
Correction factor<br />
1.0 -0.90<br />
0.89 - 0.80<br />
0.79 - 0.65<br />
0.64 - 0.55<br />
Maximum discharges of the springtime flood of the most karstic rivers with closed<br />
water budget are decreased in proportion to the runoff depth during the flood.<br />
For estimation of the maximum discharges of snow-melt water a reduction scheme<br />
is usually used.<br />
Two variants of this scheme are possible. One variant is based on the reduction of<br />
the spring flood coeffitient k = q/h =f(F), another is based on the reduction of the<br />
maximum rate of runoff q = f(F).<br />
In the case of using the calculation scheme which includes the spring runoff depth<br />
the correction factor is multiplied by the value of the zonal runoff depth. In the second<br />
variant the same correction factor is directly introduced to the value of the maximum<br />
discharge calculated by the formula.<br />
In order to convert the average of 1 % frequency discharge (or runoff depth) to the<br />
discharges (or runoff depth) of given frequency the values of variation and asymmetry<br />
coefficients and conversion factors are determined in the same way as for the rivers with<br />
non-karstic basins.<br />
The correction for karst development allows for the higher variability of the maxi-<br />
mum discharges and the runoff depth of the most karstic rivers.<br />
40 1
ABSTRACT<br />
FLOW PROBLEMS IN LIMESTONE PLAINS,<br />
JAMAICA, W.1.-A PROGRESS REPORT<br />
D.H. WOZAB and J.B. WILLIAMS<br />
The Pedro Plains, located on the southwest coast of Jamaica, comprise a low-lying<br />
area of partially karstified limestone terrain which slopes northwards into a wide area<br />
of swamp. The limestones are of Lower Miocene age, show a variable lithology, and<br />
are extensively faulted along NNW-SSE alignments. Structurally and hydrologically the<br />
Plains and the swamp can be considered as a single unit. Rainfall on the Plains average<br />
50 inches, but there is practically no surface drainage. The water table, showing no<br />
relationship to topography, is virtually flat, with the exception of mounds along several<br />
of the faults. These mounds, together ,with a marked concentration of groundwater<br />
flow towards the north emphasize the influence of structural control on groundwater<br />
movement in the Plains. It is tentatively concluded that the source of recharge is external,<br />
and reaches the Plains under confined conditions through a faulted and karstified<br />
limestone horizon. The unconfined distribution of groundwater is also apparently fault-<br />
controlled, although some movement takes place through a previously established<br />
system of karst drainage.<br />
RESUME<br />
Les problèmes de I’écoulernent dans les plaines calcaires, ù lu Jamaïque, W.I. (Rapport<br />
sur I‘état d’avancement des truraux)*<br />
Les plaines de Pedro, situées sur la côte sud-ouest de la Jamaïque, comprennent une<br />
région basse, de terrain calcaire, à configuration partiellement karstique, avec une<br />
dépression marécageuse au nord. Les calcaires datent du miocène inférieur, leur com-<br />
position lithologique est variable, et ils présentent de longues failles orientées NNO-<br />
SSE. D u point de vue structurel et hydrologique, les plaines et les marécages peuvent<br />
être considérés comme formant un seul système. La pluviosité moyenne est de 1.400 mm<br />
dans les plaines, mais le drainage superficiel est presque inexistant. La nappe qui ne<br />
présente aucun rapport avec la topographie, est pratiquement plane, à l’exception<br />
d’éminences le long de plusieurs failles. Ces éminences, combinées avec une nette con-<br />
centration de l’écoulement des eaux souterraines en direction du nord, font apparaître<br />
l’influence des facteurs structurels sur le mouvement des eaux souterraines dans les<br />
plaines. On en a conclu à titre provisoire que l’alimentation est d’origine extérieure,<br />
et qu’elle atteint les plaines par infiltration a travers un horizon calcaire faillé et karsti-<br />
fié. I1 semble que la répartition des eaux souterraines en écoulement libre soit déter-<br />
minée aussi par les failles, mais certains mouvements se produisent à travers un réseau<br />
déjà ancien de drainage karstique.<br />
INTRODUCTION<br />
The geographical expression “Pedro Plains” refers to a roughly quadrilateral area<br />
of some 70 square miles lying at the foot of a major fault scarp known as the Santa<br />
Cruz Mountains. This region is located in the southwestern part of Jamaica, approxi-<br />
mately i00 miles from Kingston, the capital (figure 1). The term “Plains” as a description<br />
is something of a misnomer, since the relief is undulating, with low hills and ridges<br />
rising to about 500 feet above sea level, and includes an area of rough limestone karst<br />
in the south-west.<br />
Physiographically the boundaries are well-defined. To the north are the swamps of<br />
the Lower Morass, a broad area of marshland interrupted briefly by areas of firmer<br />
* Fonds spécial FAO-ONU, Étude des eaux souterraines effectuée par le Gouvernement<br />
de la Jamaïque.<br />
402
ground based on limestone, and drained, if such an expression can be used, by sluggish<br />
meandering rivers. To the east rises the impressive fault scarp of the Santa Cruz Moun-<br />
tains, and to the south and west is the Caribbean Sea. Any structural and hydrological<br />
study must however include the Morass, which adds another 35 square miles to the<br />
area under review.<br />
1<br />
PHYSIOGRAPHY<br />
TM PEDRO PLAINS<br />
JAHAICh *.l.<br />
LOCATION MAP OF STUDI AREA<br />
FIO I m. Du.<br />
The principal surface features of the Plains reflect a high degree of structural control<br />
(figure 2). The narrow strip of low ground along the southwestern coast is a downfaulted<br />
area, as is the broader zone of comparable elevation between Starvegut Bay<br />
and Salt Spring. Within the Plains proper the relief is noticeably linear, the most prominent<br />
features being a series of parallel ridges trending NNW-SSE which decrease in<br />
elevation northwards. These ridges are in fact west-facing fault-line scarps. In the centre<br />
and south of the Plain the essential roughness of this karstic terrain is masked by a<br />
cover of terru rossa from beneath which the ridges emerge: towards the west and southwest<br />
the superficial deposits are thinner. South of Fort Charles where the Plains proper<br />
attain an elevation of 473 feet, a cockpit karst is fully exposed. Similar country is found<br />
on the southern side of the range of hills which form the foothills of the Santa Cruz<br />
Mountains around Flagaman.<br />
North of a line through Mountainside-Pondside, the landscape is undulating,<br />
with few rock outcrops, and merges imperceptibly into the valley of the Broad River.<br />
This is the edge of the Morass. In the centre of the swamps is an island of higher ground<br />
on which stand the three villages of Slipe, Cataboo and Frenchman. To the south of<br />
this island is the Styx-Cashew-Broad River, and to the north the Black River and its<br />
principal tributary the Y.S. River. All these rivers are characterized by extremely low<br />
gradients and pursue intricately meandering course through the swamps. The main road<br />
403
from Lacovia to Black River skirts the Morass in a wide semicircle and marks its<br />
northern limit; beyond the road the limestone terrain rises steeply to the Lacovia and<br />
Middle Quarters Mountains.<br />
404
STRATIGRAPHY<br />
Virtually the whole of the Plains and the Morass are underlain by Lower Miocene<br />
limestones assigned to the Newport member of the Tertiary White Limestone Formation<br />
(Versey, 1959 and Zans et al, 1962). There are, however, significant differences in litho-<br />
logy within the succession.<br />
The lower part of the succession outcrops in the south, around Watchwell, New-<br />
combe Valley and Beacon, and on the southern foothills and western flanks of the Santa<br />
Cruz Mountains. It consists of a hard, compact generally recrystallised skeletal limestone<br />
with secondary permeability. Vuggy porosity is evident in sections and boreholes, and<br />
there is some evidence that karst drainage may he developed to a considerable depth. The<br />
younger beds, outcropping north and northwest of Newell comprise tight chalky lime-<br />
stones with primary permeability; there is an increase of porosity in the Mountainside<br />
area where a nodular facies is developed, but towards the Morass the tight chalky type<br />
again predominates. The uppermost member of the bedded succession is a soft grey<br />
limestone of lagoonal aspect and virtually nil permeability; this underlies the coastal<br />
alluvium from Starvegut Bay northwards towards the Morass. In this southern sector<br />
its deposition was evidently controlled by the Wallywash fault, hut beyond Fullerswood<br />
it apparently extends further east, being recorded in a borehole at Frenchman. The age<br />
of this material is not yet determined; it may be Pliocene. Superficial deposits include<br />
terra rossa bauxites in the south-central district, blown sands along the coastal fringes<br />
and soft alluvial clays patchily distributed in the swamp areas.<br />
STRUCTURE<br />
The structural theme of the whole area is NNW-SSE faulting (fig. 3). This direction<br />
is demonstrated in the alignment of the Santa Cruz fault scarp, a major dislocation<br />
which forms the eastern boundary of the Plains and to a large extent the Morass. The<br />
escarpment is basically a large normal fault, hading at about 60", with a number of<br />
subsidiary breaks aggregating to a wide zone of brecciation; throw is of the order of<br />
7,000 feet. As a structural feature this fault is traceable for another 25 miles north of<br />
the study area.<br />
The Pedro Plains-Morass area is thought to be one structural entity, consisting<br />
of a gently tilted block, traversed by a number of normal faults which produce a series<br />
of WSW-facing escarpments. It seems likely that some of these dislocations continue<br />
under the superficial deposits of the Morass; this remains to be confirmed. The whole<br />
block appears to he tilted to the north along an axis passing WNW or NW through<br />
Mountainside; the date of the tilting is probably the same as the faulting, i.e. Middle1<br />
to Late Miocene. It is of course possible that small adjustments have taken piace since<br />
then within the established structural framework. Along the southwest coast of the<br />
Plains is a Quaternary coral reef standing at approximately 25 feet above m.s.1. Whether<br />
this results from Pleistocene eustatic changes or is a reflection of relatively recent tilting<br />
of the Pedro Block remains to be determined.<br />
HYDROLOGY GENERAL<br />
For the purposes of this study the Pedro Plains is taken as a hydrologic unit bounded<br />
on the east by the Santa Cruz Mountains, a hydraulic divide to the south, the Caribbean<br />
Sea to the west and the Lower Morass to the north. The Plain has no developed catch-<br />
ment area, except the plain itself. The nature of the groundwater reservoir is unknown<br />
except for two pertinent features:<br />
405
a) The block faulting of the plain with a general northwest tilting; and<br />
b) Karstification with the apparent establishment of a sub-surface drainage system.<br />
406
RAINFALL-RUNOFF<br />
Rainfall averages about 50 inches annually in the Plains. However, there is a marked<br />
variation from 35 inches in the south to about 57 inches to the north. This large differ-<br />
ence in rainfall distribution may be attributed to the orographic influence of the Santa<br />
Cruz Mountains. It also appears that little if any of the rainfall runs off. No surface<br />
drainage system of any magnitude has been established within the Plains. There are<br />
however, a number of small interior drained areas which serve to concentrate the surface<br />
runoff. The resulting ponds may therefore be a source of groundwater recharge. In as<br />
much as such interior-drained areas are generally situated along fault lines they may<br />
hydrologically be important.<br />
Land-use in the Pedro Plain has been moderately developed, but along non-irri-<br />
gation lines. About four years ago a well was drilled for a small experimental farm,<br />
and constituted the first attempt at development or the use of water from the ground-<br />
water reservoir other than a number of dug wells for domestic use. Within the past<br />
three months the experimental farm has been enlarged to about 1,000 acres and three<br />
additional wells have been drilled.<br />
UNCONFINED WATER CONDITIONS<br />
As noted in figures 2 and 3, the water table, contrary to that of a normal coastal<br />
plain, does not conform to the topography. The Plains, in general, slope to the west<br />
and north, whereas the unconfined water table is essentially flat, but sloping to the<br />
north and southwest with a gradient of approximately 1 foot per mile. The nature of<br />
the water table is obviously influenced by faulting, and the direction of flow may be<br />
determined or controlled by the occurrence of groundwater mounds along several of<br />
the faults. It varies in depth from about 480 feet in the south to less than one foot in the<br />
north. In the latter area, in some localities during the dry season, due to evapotran-<br />
spiration, the water table may drop as much as 3 feet below sea level. From the charac-<br />
ter of the water table, that is its non-conformity with topography, and the occurrence<br />
of mounds, it may be concluded that the principal source of recharge to the Pedro<br />
Plains is from outside the area and that recharge to the Plains from local precipitation<br />
is meagre in view of the low water table gradient. It is also apparent that the mounds<br />
serve to recharge the unconfined water zone, though the quantity of such water is<br />
unknown.<br />
From figure 3, and the block faulted nature of the Plain, it is noted that the ground-<br />
water flow, supplemented from the mounds, is concentrated along the foot of the Santa<br />
Cruz Mountains and is directed to the north. It is further believed that the possibilities<br />
of irrigation development will be a function of total recharge from all sources. These<br />
sources however, must be studied in detail for quantity and groundwater movement<br />
data to enable the location of production wells, and to prevent possible areas of over-<br />
production or sea water intrusion.<br />
Very little information is available on well capacity, but from the recently drilled<br />
wells which vary in depth from 150 feet to 200 feet, discharge varied from less than<br />
200 U.S. gallons per minute (gprn) to more than 2,000 gpm (45 to 450 cubic meters per<br />
hour). This represented specific capacities of from about 5 gpm per foot of drawdown<br />
to 200 gpm per foot of drawdown.<br />
CONFINED GROUNDWATER CONDiTlONS<br />
As previously described it appears that the groundwater mounds found in the centre<br />
of the Pedro Plains represent a source of recharge from outside which arrives under<br />
407
confined conditions. The mounds, occurring along faults, indicate that the confining<br />
zone has been subsequently disrupted by the faulting. This confined zone is likely to<br />
have the character of a cavernous hard limestone (karst zone) overlain by chalk or<br />
chalky limestone. For the present, no information is available as to the source of the<br />
recharge but it may in part be from the upper portion of the Black River, which occurs<br />
to the northeast, and/or the Upper Morass. The development potential of the confined<br />
water at this stage of investigation is unknown, but the gradient of the mounds vary<br />
from about 4 feet per mile to 7 feet per mile, and if the source is sufficiently large,<br />
conveyed by a cavernous zone, then it may be sufficient to irrigate a relatively large<br />
portion of the Plain.<br />
SURFACE WATER<br />
As noted previously, no surface water drainage system has been developed within<br />
the Pedro Plains. However, to the north, wherein lies the Lower Morass, the Broad<br />
River begins to flow (from springs) in the vicinity of the Santa Cruz Mountains. This<br />
river, without a catchment area, has an estimated minimum discharge of about 100<br />
cubic feet per second (2.8 cubic meterslsecond) and flows approximately six miles<br />
westward before joining the Black River which then flows to the sea.<br />
EVAPOTRANSPIRATION<br />
Evapotranspiration and evaporation from open water have been estimated at an<br />
average of about 60 inches annually for the Pedro Plains (Grontmij 1964), or at a rate<br />
of 1.2 times the precipitation. However, due to the occurrence of relatively high intensity<br />
rain storms and by accumulation of surface runoff in ponds, some recharge to the water<br />
table does occur. It is interesting to note, that in the area south of the Broad River<br />
there occurs approximately 10 square miles of swampy land. The evapotranspiration<br />
rate from this area alone amounts to about 44 cubic feet per second. Within the scope<br />
of this paper the even larger swampy area north of the Broad River (area of the Black<br />
River) is not considered.<br />
CONCLUSIONS<br />
It is clear from these preliminary studies that the volume of groundwater arriving<br />
under the Plains is quite unrelated to that of the apparent catchment recharge, and<br />
therefore the major portion of recharge must originate externally, reaching the Plains<br />
by sub-surface flow. It follows that the geological factors of structure and lithology<br />
will be decisive in determining the occurrence and distribution of groundwater in the<br />
area. The unfavourable permeability characteristics of the upper part of the Newport<br />
succession suggest that rechargz is taking place through the older limestones, whose<br />
lithology favours the development of a karstic drainage system.<br />
There is obviously a close correlation between the disposition of the fault system<br />
and the distribution of highs in the pattern of groundwater contours. This suggests<br />
that deep recharge flow is heavily influenced by the fracture zones associated with the<br />
structural features. It is also believed that the distribution of this groundwater rising<br />
from deep sources is likewise guided by the fault pattern, although some local movement<br />
presumably occurs through an older karst drainage system. Some evidence is available<br />
to suggest that such a sub-surface drainage pattern was established at some time in the<br />
past, and in view of the time factors involved it is likely that this previous karstification<br />
408
took place during a phase of lowered sea-level. In any case, this too wil reflect structural<br />
influence. The question of whether the direction of drainage through this older karst<br />
has been affected by subsequent movements of the Pedro block remains an open one.<br />
In summary, it is these factors which must form the basic criteria upon which wil<br />
depend the successful and economic development of the groundwater resources of<br />
the Pedro Plains, both with respect to safe yield and protection against sea water<br />
intrusion.<br />
be<br />
1.<br />
2.<br />
3.<br />
4.<br />
5.<br />
(1)<br />
(2)<br />
(3)<br />
Author's Note: Since preparation of paper, the following qualifications should<br />
made:<br />
Newport Formation is more than 1,000 feet thick and underlies the Pedro Plains.<br />
This formation is of Miocene age but in the north and northwest of the Plains<br />
including the Morass, deposition continued into the Pliocene;<br />
Re-leveling of index wells indicated the existence of only one groundwater mound.<br />
This mound is more extensive but includes the northern most mound of figure 3;<br />
Drilling in mound to a depth of 600 feet indicated an almost impervious zone.<br />
Only indication of solution was above the water table;<br />
Exploratory drilling and testing indicate that recrysíallized limestone is present<br />
to a maximum depth of 300 feet; three zones of solution drainage occurs between<br />
a depth of 200 to 300 feet. No confined water was encountered; the fault zones are<br />
the main avenues for groundwater movement except in south where karstification has<br />
been extensively developed. In such areas and zones groundwater movement may<br />
be turbulent and recharge from precipitation may be almost immediate. In<br />
remainder of the groundwater reservoir permeability is so low that water table<br />
in some areas shows barometric effect;<br />
Sea water intrusion has occurred as much as three miles in land in the zone(s)<br />
of solution.<br />
REFERENCES<br />
GRONTMIJ, 1964, Black River Morasses Reclamation Project, Government of<br />
Jamaica.<br />
VERSEY, H.R., 1959, The hydrologic character of the White Limestone Formation<br />
of Jamaica; Transactions of the Second Caribbean Geological Conference, University<br />
of Puerto Rico, January.<br />
ZANS, V. A., CHUBB L. J., VERSEY, H. R., WILLIAMS, J. B., ROBINSON, E. and COOKE, L.,<br />
1962, Synopsis of the Geology of Jamaica, an explanation of the 1958 Provisional<br />
Geological Map of Jamaica; Geological Survey Department, Jamaica.<br />
409
ABSTRACT<br />
SUR LA RECHERCHE DES RESSOURCES<br />
EN EAUX KARSTIQUES SOUS RECOUVREMENT<br />
MIO-PLIO-QUATERNAIRE<br />
DANS LE BASSIN MEDITERRANEEN<br />
ET SON IMPORTANCE D’APRÈS QUELQUES<br />
EXPRÉRIENCES RÉCENTES DANS LA RÉGION<br />
LANGUEDOC-ROUSSILLON (FRANCE)<br />
Jacques AMAS<br />
Directeur du C. E. R. H. - Université de Montpellier - France.<br />
The pyreneo-alpine and alpine movements which have affected the Basin of the<br />
Mediterranean sea, joined to variations of level of this latest sea, and to the dolomjtization<br />
which often affects limestone massifs in this region, make the calcareo-dolomitic<br />
massifs from this region be unusually fissured and karstified. This fact, added to the<br />
mediterranean climate (concentration of rainfalls) gives rise to the constitution by those<br />
massifs of excellent “water” traps.<br />
The result is that the parts of these massifs hidden under, the mio-plio-quaternary<br />
sediments, often constitute exceptional water reserves, and this explains the interest of<br />
their searching by geological, geophysical, hydrological, hydrochemical methods and<br />
by direct exploring (trial-borings). The use of these methods by the C. E. R. H. has given<br />
excellent results in the Languedoc-Roussillon (district of Nîmes, Montpellier and so<br />
on.. .), where it has permitted to discover new important water resources.<br />
I. INTRODUCTION<br />
Parmi les ressources majeures en eau souterraine des pays du pouriour de la Méditerranée,<br />
figurent au premier chef les ressources en eaux karstiques. Les étendues calcaires<br />
jouent en effet en climat méditerranéen, c’est-à-dire en climat caractérisé par une<br />
concentration extrême des précipitations, un rôle particulièrement efficace de “pièges à<br />
eau” lorsque la fissuration et la karstification y sont suffisantes. Ce fait explique toutes<br />
les études qui ont été, ces dernières années, entreprises sur le pourtour de la Méditerranée,<br />
telles celles par exemple de la F.A.O. en Grèce (United Nations special fund,<br />
karst groundwater investigations) ou celles du C. E. R. H. de l’Université de Montpellier<br />
dans le Languedoc-Roussillon (travaux de C. Drogue - P. Dubois - H. Paloc -<br />
R. Plegat - H. Salvayre - P. Verdeil, etc...).<br />
L’importance des mouuements tectoniques pyrénéens, alpins ou plus récents ayant<br />
affecté les masses calcaires principalement jurassiques ou crétacées des zones bordières<br />
de la Méditerranée, explique l’intense ,fissuration de la plupart des massifs calcaires de<br />
ces régions. Ces mouvements tectoniques combinés aux variations du niueau de buse,<br />
de la fin du Crétacé à nos jours, expliquent par ailleurs l’existence dans ces massifs de<br />
plusieurs importants réseaux d’érosion karstique à divers niveaux et de divers âges<br />
(crétacés, oligocènes, miocènes, pliocènes, quaternaires, actuels) dont certains sont<br />
“fossiles” (ennoyés ou surélevés) d’autre encore “vivants”. Il résulte de tous ces faits,<br />
joints à la fréquente dolomitisation (génératrice de porosités d’interstices élevées) des<br />
massifs que les ressources en eau des massifs karstiques méditerranéens sont sans doute<br />
les plus importantes ressources en eaux karstiques du monde.<br />
Nous voudrions ici, attirer l’attention sur l’intérêt particulier que présentent pour<br />
les pays souvent presque semi-arides des régions circum-méditerranknnes, les ressour-<br />
410
ces en eaux karstiques, des karsts non ofleuranis. sous recoitcrement mio-plio-quuter-<br />
naire.<br />
Cet intérêt particulier découle des faits suivants:<br />
1 o Beaucoup de massifs culcuires du bassin méditerranéen s’ennoient sous des sédiments<br />
mio ou plioquuteriiaires et ce tout particulièrement en bordure des côtes et dans les<br />
anciens fossés d’efondrement d’âge principalement oligocène, aujourd’hui remplis<br />
de formations mio-plioquaternaires;<br />
2O Ces zones (côtes et plaines) sont généralement les lieux des plusgrandes concentrations<br />
humaines et donc des plus grands besoins en eau;<br />
3O Les affaissements ou les érosions qui ont permis l’ennoiement sédimentaire ultérieur<br />
de ces massifs calcaires ont amené d’“anciens systèmes karstiques” en position basse<br />
par rapport aux massifs karstiques encore ajîeurunts. Les inter-relations de ces sys-<br />
tèmes avec les massifs karstiques actuels affleurants et “captants” y entraînent<br />
souvent une véritable concentration des eaux et expliquent entre autres la genèse<br />
de nombre de sources sous-marines côtières célèbres, malheureusement le plus<br />
souvent très difficiles à capter en raison du mélange plus ou moins poussé de leurs<br />
eaux avec l’eau de mer;<br />
4O Dans ces systèmes karstiques la position basse et l’existence d’un recouvrement mio-<br />
cène ou plioquaternaire à haute porosité et haute perméabilité relative fréquentes,<br />
expliquent qu’aux ressources en eaux descendantes des massifs karstifiés s’ajoutent<br />
aussi les ressources en eaux drainées à partir des formations recouvrantes qui s’y<br />
trouvent, ce qui entraîne que les réserues en enir que l’on peut y trouver sont les plus<br />
pérennes des réserves en eau des pays méditerranéens.<br />
L’intérêt particulier de ces réserves en eau, explique en conséquence I’exeptionnelle<br />
importance dans la conjoncture actuelle de lu recherche de ces ressources en eaux kars-<br />
tiques
cartes en courbes d'isoteneurs chimiques dont le seul aspect permet dans de nombreux<br />
cas de déceler les apports souterrains d'eaux karstiques (cf. exemples cités<br />
plus loin, figures 2 à 4);<br />
4" Les méthodes d'exploration directe, combinées aux tnéthodes k.vdromCtriques. Dans<br />
ces méthodes on fait appel à des sondages de reconnaissance ou à des forages à<br />
travers les formations recouvrantes. Une fois le subtratum calcaire atteint, on en<br />
étudie la karstification éventuelle. Puis par enregistrement des variations comparées<br />
des niveaux d'eau naturelle ou artificielle (essais de pompage) on en déduit les corrélations<br />
possibles avec les massifs affleurants et les caractéristiques hydrologiques<br />
des karsts éventuellement atteints.<br />
Pl.I.
413
cì Dans la zone bordière des Corbières orientales au niveau de Caves-La Palme (zone 3<br />
de la carte 1 et figure 8).<br />
A. Région de Nîmes<br />
Dans cette zone un massif karstique calcaire (Crétacé) borde au Nord la plaine mio-<br />
plio-quaternaire du Vistre. Le contact correspond à une très importante faille d’effon-<br />
drement : la
(C. G. C.) (1) ont permis de localiser une importante remontée de calcaires jurassiques<br />
dans cette région. (fig. 5) Ces calcaires de résistivité égale à 150 ohm/m se différencient<br />
particulièrement bien des argiles sableuses pliocènes (astiennes) qui les recouvrent et<br />
dont la résistivité est de seulement 10 a 30 ohm/m. (cf. fig. 7)<br />
Depuis 1963, ont pu être effectuées des forages de reconnaissance puis un forage<br />
d'essai dans cette structure qui s'est avérée exceptionnellement aquifère. Le calcaire<br />
jurassique sous un recouvrement plio-quaternaire d'argiles sableuses pliocènes sur-<br />
Fig. 5 - Coupes Schématiques A à C (voir emplacement sur fig. 6) interprétant l'allure<br />
du substratum secondaire de la région de Montpellier (3 coupes parallèles NW-SE)<br />
(En pointillé le recouvrement mio-plioquaternaire d'après B. GEORGE.<br />
(I) La figure 6 montre la carte structurale du toit du Jurassique supérieur sous ses<br />
recouvrements, d'âges postérieur, dans la région de Montpellier. Cette carte a été<br />
synthétisée par mon collaborateur F. BEL d'après les études géologiques et géophysiques<br />
(séismiques et électriques) effectuées dans la région.<br />
41 5
416<br />
ic<br />
c<br />
G
montées d'alluvions quaternaires, a été atteint à la cote -39 m et le forage (en 350 mm)<br />
poursuivi jusqu'à la cote -55 m. Le calcaire (blanc à grain tin et à veinules de calcite)<br />
a montré lors du sondage l'existence au sein du calcaire d'importantes fissures dans les-<br />
quelles le trépan ( tombait n brusquement. Les carottes ont permis de voir que beau-<br />
coup des fissures ou anciens chenaux de dissolution du calcaire étaient pratiquement<br />
bouchés par un silt argileux rougeatre ou par un silt à ciment calcaire. Les essais de<br />
Ohia ter no ire<br />
.l,OCè"E<br />
continental<br />
_- - .<br />
.- , d -<br />
O - C J - ' . . .<br />
u -<br />
' e,<br />
débit à l’émulseur sur ce forage on donné d’abord des résultats décevants : moins de<br />
5 m3/heure de débit pour un rabattement de plus de 30 mètres. Après une lere acidification<br />
(1400 kg d’acide : HCI) le débit est monté à 60 m3/heure, après une 2eme<br />
(2700 kg) à 130 m3/heure, après une 3e (3000 kg) à 150 m3/heure, chiffre resté constant<br />
après une 4e acidification (3000 kg sous pression). Ont alors été entrepris des essais de<br />
pompage (avec une pompe à turbine immergée Alta) par paliers de débit croissant pour<br />
finir à un pompage au débit maximum (268 m3/heure) pendant 31 heures : le rabattement<br />
se stabilisant aux environs de -9 m.<br />
Le dépouillement des mesures (1) (au forage et dans les piézomètres annexés) à<br />
donné une transmissivité de T = 10-3 mz/s. et un coefficient d’emmagasinement S<br />
d’environ 1,5.10-3% (nappe captive). Les eaux très chargées au début d’éléments fins,<br />
ne sont devenues limpides qu’après 26 heures de pompage.<br />
La courbe caractéristique du forage montrant par ailleurs que le débit critique était<br />
loin d’être obtenu, un nouvel essai de pompage fut effectué avec une pompe plus puissante<br />
et poursuivi 122 heures a 430 ms/heure. Le niveau s’est stabilisé A 11,60 mètres<br />
ce qui indique que là encore le débit maximum n’a pas été obtenu. En conséquence, de<br />
nouveaux essais doivent être prochainement effectués à plus gros débit. Quoiqu’il en<br />
soit d’ores et déjà, ont donc été prouvés plus de 120 liseconde, d’une eau karstique un<br />
peu dure mais rentrant dans les normes des eaux potables et rien n’empêche de supposer<br />
que les possibilités du dôme calcaire ennoyé ne soient très supérieures, atteignant ou<br />
dépassant peut-être le metre cube par seconde, une synthèse géologique et géophysique<br />
de la région montrant que le dôme jurassique ennoyé sous le plio-quaternaire du Pont<br />
Trinquat, se raccorde aux grands massifs karstiques de la région, notamment au massif<br />
de la Gardiole (fig. 5 et 6).<br />
Pour terminer, nous attirerons I’attention sur le fait que ces grosses ressources en<br />
eau n’ont pu être mises en évidence qu’après de très importantes acidifications (10<br />
tonnes d’HC1 au total) nécessaires au a débourrage ) des fissures du karst plus ou moins<br />
oblitérées au voisinage du contact avec leur recouvrement plio-quaternaire.<br />
C. Région de la plaine côtière bordant les corbières orientales (Airde)<br />
Dans cette région très dépourvue de ressources en eau, a été réalisée pour le compte<br />
du Ministère de l’Agricu!ture (Service du Génie Rural de l’Aude) une étude géophy-<br />
sique du recouvrement plio-quaternaire côtier et ont été mis en évidence par la géo-<br />
physique électrique des massifs calcaires ennoyés sous le plio-quaternaire. Des forages<br />
en cours dans la zone karstique ont déjà donné des résultats encourageants et la cam-<br />
pagne de recherches se poursuit. La zone semble cependant moins favorable vu la proxi-<br />
mité de la mer et les risques d’invasion par l’eau salée en cas de pompages trop intenses.<br />
CONCLUSION<br />
En conclusion, nous insisterons seulement sur i‘intérét tout spécial de la recherche<br />
dans le bassin méditerranéen, des eaux karstiques des massifs calcaréodolomitiques<br />
ennoyés sous les sédiments mio-plioquaternaires, à la seule condition que ces massifs<br />
ne soient toutefois pas trop proches de la mer.<br />
BJBLIOGRAPHIE<br />
AVIAS Jacques, 1963, Méthodes d’études et mise en valeur des Ressources en ,Eaux Karstiques<br />
du Midi Méditerranéen Français. In Contribution to the investigation and<br />
development of the karst aquifers of the circum-mediterranean countries, 29 p.,<br />
5 fig., 4 cartes. F. A. O. ground. Water project in Greece. Technical meeting. Athenes.<br />
(l) Effectué par le BURGEAP en liaison avec le C.E.R.H. pour le compte du Ministère<br />
de la Construction.<br />
418
C. E.R. H. 1964 (AVIAS, BEL, LEMPERIERE et alii), Étude hydrogéologique en.vue de l’alimentation<br />
en eau du littoral de lu région Languedoc-Roussillon. I. Géologie et Hydrogéologie<br />
générale. Rapport au Ministère de la Construction pour la Mission interministérielle<br />
d’aménagement du littoral (texte Montpellier et carte I. G. N. Paris).<br />
COUDRAY Jean, 1965, Contribution à ì‘étude hydrogéologique de la moyenne plaine du<br />
Vistre. Thèse 3 O cycle. Ronéo, 93 p., 10 cartes hors texte. Montpellier.<br />
GEORGE<br />
Bertrand, 1963, Etudes hydrogéologiques de la région Montpelliéruine. Thèse<br />
3O Cycle. Ronéo. 200 p., 50 fig., 12 pl. Montpellier.<br />
419
RESUME<br />
CIRCULATION DES EAUX SOUTERRAINES<br />
DANS LES CALCAIRES KARSTIQUES DE KOPAIS<br />
G. ZERVOYANNIS et J. BARBEAU<br />
Dans le cadre des recherches d’hydrogéologie appliquée dont il est chargé, le Service<br />
des Améliorations Foncières de la Grèce (Ministère de l’Agriculture) a entrepris avec<br />
l’aide de la Mission FAO une étude systématique des ressources aquifères du bassin<br />
du Céphise Béotien et en première phase de la plaine autrefois occupée par l’ancien<br />
lac de Kopais qui constitue l’extrémité orientale de ce bassin.<br />
Après un historique rapide de l’ancien lac, la note expose les grandes lignes de<br />
l’étude, les résultats des premiers sondages et essais de débit. L’accent est mis sur la<br />
circulation de l’eau dans les calcaires karstifiés aui bordent la plaine et dont les réserves<br />
considérables offrent des possibilités très larges pour l’amélioration des conditions<br />
d’irrigation actuelles.<br />
SUMMARY<br />
Within its designated realm of applied hydrogeological research the Land impro-<br />
vement Service of Greece (under the Ministry of Agriculture), with the aid of the FAO<br />
Mission, has undertaken a systematic study of the ground-water resources of the basin<br />
of Cephise in Beotia. In its first phase the study was of the plain previously covered by<br />
the former Lake Kopais, which area forms the easíern extremity of the basin.<br />
After a brief history of the lake which used to exist there, the paper describes the<br />
broad lines of the study and gives the results of the first drilling and pumping tests. Stress<br />
is laid on the circulation of water in karstic limestones at the edge of the plain, whose<br />
considerable reserves offer great opportunities for improving present day irrigation<br />
conditions.<br />
420
(B 628) Imprimé en Belgique par Ceuterick c.a.<br />
Brusselsestraat 153 Louvain<br />
Adm.-dir. L. Pits¡ Bertemsebaan 25 Veltem-Beisem
Actes du colloque de Dubrovnik, octobre 1965<br />
Proceedings of the Dubrovnik Symposium, October 1965<br />
Hydrologie des roches fissurées<br />
Hydrology of fractured rocks<br />
organisé par l’Unesco<br />
dans le cadre de la Décennie hydrologique internationale<br />
avec la collaboration de l’AIHS, de la FAO et de 1’AIH<br />
organized by the Unesco<br />
in the framework of the International Hydrological Decade<br />
with the support of IASH, FAO and IAH<br />
vol. II<br />
Association internationale d’hydrologie scientifique<br />
Organisation des Nations Unies pour l’éducation, la science<br />
et la culture
Publié en 1967 par l’Association<br />
internationale d’hydrologie scientifique<br />
et par l’Unesco, place de Fontenoy, Pari~-7~<br />
Imprimé par Ceuterick, Louvain (Belgique)<br />
Published in 1967 by<br />
the International association<br />
of scientific hydrology and<br />
by the Unesco, place de Fontenoy, Pa1-is-7~<br />
Printed by Ceuterick, Louvain (Belgium)<br />
0 Unesco 1967<br />
Printed in Belgium<br />
SC 67/D52/AF
Actes du colloque de Dubrovnik,<br />
Hydrologie des roches fissurées, II<br />
Proceedings of the Dubrovnik Symposium,<br />
Hydrology of fractured rocks, II
Les volumes I et II des Actes du colloque de Dubrovnik constituent également,<br />
sous couverture spéciale, les publications nos 73 et 74 de l'Association interna-<br />
tionale d'hydrologie scientifique, L. J. Tison, secrétaire, Braamstraat 61, Gentbrugge<br />
(Belgique).<br />
The volumes I and II of the Proceedings of the Dubrovnik Symposium are also,<br />
under special cover, the publications 73 and 74 of the International Association<br />
of Scientific Hydrology, L. J. Tison, Secretary, Braamstraat 61, Gentbrugge<br />
(Belgium).
TABLE DES MATIÈRES - CONTENTS<br />
TOME I - VOLUME II<br />
r.4. INTRUSION D’EAUX SALINES DANS LE KARST<br />
1.4. SALT ENCROACHMENT IN KARSTIC REGIONS<br />
V. MAURIN and J. ZOETL - Salt Water Encroachment in the Low Altitude Karst<br />
Water Horizons of the island of Kephallinia (Ionian Islands) . . . . . . .<br />
G. E. SIPLE - Salt-Water Encroachment of Tertiary Limestones along coastal<br />
South Carolina . . . . . . . . . . . . . . . . . . . . . . . . . . . 439<br />
R. HAZAN - Contribution à l’étude de l’invasion de nappes par les eaux marines 454<br />
F. MACAU VILAR - Détermination des niveaux phréatiques des eaux douces dans<br />
un massif calcaire de la Costa Brava ) (Espagne) à partir d’une exploration<br />
sous-marine préalable . . . . . . . . . . . . . . . . . . . . . . . 455<br />
1.5. RECHARGE NATURELLE ET ARTIFICIELLE DANS LES TERRAINS KARSTIQUES<br />
1.5. NATURAL AND ARTIFICIAL RECHARGE IN KARSTIC REGIONS<br />
M. G. GREEN - Artificial Recharge to the Edwards Limestone Aquifer in South<br />
Texas.. . . . . . . . . . . . . . . . . . . . . . . . . . . . . . 465<br />
J. VI LIMO NO VI^ -A Contribution to the Study of Groundwater intake Recharge<br />
inKarst.. . . . . . . . . . . . . . . . . . . . . . . . . . . . . 482<br />
K. ZIMA - Quelques connaissances sur la circulation des eaux souterraines dans<br />
les formations fissurées non karstifiées en Tchécoslovaquie . . . . . . . . 489<br />
R. AMBROGGI et R. HAZAN - Alimentation artificielle de nappe aquifère dans les<br />
grès fissurés. Tanger (Maroc) . . . . . . . . . . . . . . . . . . . . . 496<br />
1.6. HYDROLOGIE KARSTIQUE DANS LES ROCHES VOLCANIQUES<br />
1.6. KARSTIC HYDROLOGY IN VOLCANIC TERRAINS<br />
L.A. HEINDL - Ground Water in fractured volcanic Rocks in Southern Arizona 503<br />
423<br />
V
1.7. EXPLOITATION<br />
J. VELIMONOVIC and V. CUBRAKOVIC - Problèmes hydrogéologiques de la région<br />
c8 tière karstique . . . . . . . . . . . . . . . . . . . . . . . . . . 5 i 7<br />
C. CASTANY - Exploitation des eaux souterraines et bilan hydrique dans les<br />
calcaires de Tunisie . . . . . . . . . . . . . . . . . . . . . . . . . 5 1 8<br />
H. LESSER JONES - Confined fresh Water Aquifers in Limestone, exploited in the<br />
North of Mexico with deep Wells below Sealevel . . . . . . . . . . . . 526<br />
1.8. INFLUENCE SUR L’ÉCOULEMENT SUPERFICIEL<br />
1.8. INFLUENCE ON RUNOFF<br />
N. BOYADJIEFF - Utilisation des bassins karstiques pour la régularisation des<br />
débits hydrologiques . . . . . . . . . . . . . . . . . . . . . . . . 543<br />
- On the Problem of the Influence of Karst on the Hydrological<br />
A. M. GAVRILOV<br />
Regime of Rivers . . . . . . . . . . . . . . . . . . . . . . . . . . 544<br />
II - L ACS KARSTIQUES - KARSTIC LAKES<br />
M. PETRIK - Lakes in the Croatian Limestone Region<br />
S. MIKULEC - Problèmes de construction des bassins de retenue dans I’Hercé-<br />
. . . . . . . . . . 565<br />
govine de l’Est . . . . . . . . . . . . . . . . . . . . . . . . . . . 590<br />
III - G EOCHIMIE - EROSION - G EOCHEMISTRY - EROSION<br />
B.B. HANSHAW, W. BACK and M. RUBIN - Carbonate Equilibria and Radiocarbon<br />
Distribution related to Groundwater Flow in the Floridan Limestone<br />
Aquifer, U.S.A. . . . . . . . . . . . . . . . . . . . . . . . . . . 601<br />
D. ZOGOVIC - Sur le rapport de la solubilité des calcaires et des dolomies . . 61 5<br />
M. PETRIK - Characteristics of Water from Springs in the LimestoneRegion of<br />
Croatia. . . . . . . . . . . . . . . . . . . . . . . . . . . . . . 624<br />
N. MILOIEVI~, B. FILIPOVIC and N. DIMITRIJEVI~ - Hydrochemical Characteristics<br />
of Ground Waters in Sarmatian and Mediterranean-II Limestone<br />
in thevicinity of Belgrade . . . . . . . . . . . . . . . . . . . . . . 635<br />
J. MLADENOVIC - Influence de la structure géologique sur la composition<br />
chimique des eaux souterraines dans la zone de Popovo Polje. . . . . . . . 645<br />
VI
T. DINCER and B.R. PAYNE - An Isotope Survey of Lakes in the Karst Region<br />
of Southern Turkey . . . . . . . . . . . . . . . . . . . . . . . . . 654<br />
S. MANDEL -A Conceptual Model of Karstic Erosion by Groundwater . . . . 662<br />
I. SAINZ ORTIZ - L’affaissement du soi de Mexico par suite du pompage excessif<br />
de la nappe . . . . . . . . . . . . . . . . . . . . . . . . . . . . 665<br />
H. R. LANGGUTH - On the Local and Regional Mineralisation of Karst Ground-<br />
waters and their Variations from Devonian Limestones of the Rhenish<br />
Shiefergebirge (Western Germany) . . . . . . . . . . . . . . . . . 672<br />
1. GAMS - On the Types of tufa-depositing Waters and on the Corrosion Intensity<br />
in the North-western Dinaric Karst . . . . . . . . . . . . . . . . . . 684<br />
VI1
1.4<br />
Intrusion d’eaux salines dans le Karst<br />
Salt Encroachment in Karstic Regions
SUMMARY<br />
SALT WATER ENCROACHMENT IN<br />
THE LOW ALTITCJDE KARST WATER HORIZONS<br />
OF THE ISLAND OF KEPHALLINIA<br />
(IONIAN ISLANDS)<br />
V. MAURIN and J. ZOETL<br />
Vereinigung für hydrogeologische Forschungen Graz, Austria<br />
In order to re-examine the validity of that knowledge of the mechanism of subter-<br />
ranean karst drainage that was gathered in Alpine territory, investigations were<br />
extended to the Mediterranean region. Thus a hydrogeological survey of the island of<br />
Kephallinia was made in 1959 and 1961.<br />
Kephallinia is known above all for its phenomenon of the sea-katavothres of<br />
Argostolion. The reappearance of the salt water that disappears into the rocks there<br />
had not been explained in spite of repeated experiments. In principle it was conceivable<br />
that the salt water entering the land there emerged again in submarine springs as well<br />
as in the brackish water springs of the coast.<br />
After careful preparation 160 kg of uranin were dissolved in the water of one of<br />
the katavothres. This colouring substance could be ascertained in the brackish water<br />
springs of the eastern coast, which is 15 km distant.<br />
The hydrogeological explanation of this movement of water is this. The polje<br />
that existed in the present Gulf of Livadi during the eustatic reduction of the sea<br />
level in the Pleistocene drained subterraneously towards the lower leve! of the eastern<br />
coast. The fresh water that even today drains off from the main massive to the east,<br />
and the old, lower-levelled karst holes that have been inundated by the sea, are the<br />
most important factors for the hydraulic processes, which resemble those that can be<br />
observed where an ejector is installed.<br />
RESUME<br />
Infi[rration de t’eau de mer dans Ies horizons aquifères karstiques de faible attitude de<br />
i‘lle de Cephalonie «Iles Ioniennes»<br />
Afin de vérifier à nouveau la valeur des connaissances acquises dans les régions<br />
alpines sur le mécanisme du cheminement des eaux souterraines dans les karsts, on<br />
a étendu ce champ d’études à la zone méditerranéenne. C’est ainsi qu’une enquête<br />
hydrogéologique a été effectuée dans l’île de Céphalonie en 1959 et en 1961.<br />
Céphalonie est connue surtout pour le phénomène des katavothres d’Argostoli.<br />
Malgré de nombreuses expériences, on n’avait pas encore pu expliquer comment<br />
réapparaît l’eau de mer qui s’engouffre à cet endroit dans les roches. En théorie,<br />
on pouvait concevoir que l’eau de mer qui pénètre dans la terre à cet endroit resurgit<br />
en sources sous-marines et en sources d’eau saumâtre sur la côte.<br />
Après des préparatifs minutieux, 160 kg d’uranite ont été dissous dans les eaux<br />
de l’un de ces katavothres. Cette matière colorante a été reconnue avec certitude dans<br />
les sources saumâtres de la côte orientale, a 15 k m de distance.<br />
L’explication hydrogéologique du mouvement de ces eaux est la suivante : le polje<br />
qui existait dans le golfe actuel de Livadi au moment de l’abaissement eustatique du<br />
niveau de la mer, au pléistocène, drainait les eaux souterraines vers la côte orienta!e<br />
située à un niveau inférieur. L’eau douce qui, aujourd’hui encore, s’écoule du massif<br />
principal vers l’est, et les anciens avens karstiques de niveau inférieur qui ont été<br />
envahis par la mer sont les facteurs les plus importants de ces phénomènes hydrauliques,<br />
semblables à ceux qu’on peut observer quand on installe un éjecteur.<br />
1. INTRODUCTION<br />
From the beginning of karst research Austrian scientists have played a major share<br />
in this field of study, as the classic karst lay within the boundaries of the former Austro-<br />
Hungarian Monarchy.<br />
423
Among the central problems of karst research is karst-hydrology, whose progress<br />
is inseparably connected with the names of A. GRUND, F. KATZER, J. CVIJIC, H. BOCK,<br />
N. KREBS, A. E. MARTEL, and O. LEHMANN. Already in its early years investigations<br />
were extended beyond the Dinaric karst to include Alpine and Mediterranean regions.<br />
Systematic karts-hydrological investigations carried out by the authors in Alpine<br />
regions for more than a decade have brought results that led to the revision of formerly<br />
current theories on principles of the water-bearing of karstic mountain systems. in<br />
order to enlarge experience, investigations have been extended to the Mediterranean<br />
region, chiefly to study those modifications of the genetic process of karst that are<br />
either conditioned by the climate or caused by the eustatic fluctuations of the sea-level.<br />
The island of Kephallinia offered itself for a suitable object of research. Its main<br />
massive is a largely compact karst body of about 350 km2, which allows, in the prevailing<br />
climate, for the formation of an extensive fresh water reservoir.<br />
Besides general karst-hydrological problems the island of Kephallinia has its<br />
particular phenomenon, which has been termed "The Sea-Mills of Argostoli" in the<br />
international technical literature of more than a century. It is the phenomenon-long<br />
known to the islanders-of the inflow of salt water into the rock-fissures of the northern<br />
part of the peninsula named after the town of Argostolion.<br />
The authors made a hydrogeological survey of the entire island in the summer<br />
months of 1959 and 1961. On the strength of the results obtained and by means of<br />
a large-scale colouring experiment lasting from February to April 1963 the enigma of<br />
the salt water disappearing near Argostolion was solved. The considerable expenses<br />
of this experiment were borne by the Austrian Research Council, to which we wish<br />
to express our thanks also here. For the support of our work we are also obliged to<br />
Dipl.-Ing. Dr. K. ZACHOS, General Director, Institute for Geology and Subsurface<br />
Research in Athens. Dip1.-Ing. S. MATTHEOS (Athens), and Professor Dip1.-Ing.<br />
Dr. A. POLLAK (Institute for Mineralogy and Technical Geology, Technische Hochschule,<br />
Graz).<br />
2. THE AREA OP INVESTIGATION<br />
The island of Kephallinia is the largest of the Ionian Islands (about 750 kmz).<br />
It lies between 38"4' and 38"29' north latitude and 20"20' and 20"49' east longitude.<br />
Accordingly, the island has the typical Mediterranean climate, dry and warm<br />
summers and damp and mild winters (July average 26,3 "C., January average 1 I,O"C).<br />
The rain, falling mostly in the winter half-year, rises in the coastal region of Argostolion<br />
to an annual average of 860 mm (fig. 1).<br />
Formerly there were, besides oak-woods, large fir-woods (Abies Cephnìonica),<br />
covering the main mountain massive down to about 600 m above sea-level. Today only<br />
the summit of the Aenos has a dense fir-wood, while the lower karst areas are occupied<br />
by the Frigana. Gardens, some of them lush, exist only in the irrigated Tertiary areas<br />
and Alluvial deposits; economic emphasis is on the olive crops. Besides, there is scant<br />
cultivation of corn ; wine-growing is still common. Goats are reared everywhere.<br />
The main part of the island is rather compact apart from small peninsulas as that<br />
of Argostolion. It is only the two large peninsulas Erisos and Palikki that give Kephallinia<br />
its striking outline (fig. 2).<br />
The core of the main body of the island is a mountain chain stretching from the<br />
Ag. Dynati (1,131 m) in the north-west to the Aenos (1,628111) in the south-east.<br />
It consists of limestones and dolomites ranging from the Cretaceous to the Palaeogen.<br />
In the south and south-east Tertiary sediments extend in front of these older carbonate<br />
rocks. Large parts of the eastern coast, i.e. the Kokkini Rachi (1,082 m), consists<br />
of Triassic and Jurassic limestones and dolomites.<br />
424
The peninsula of Erisos and the west and north of Palikki also consist of the<br />
Cretaceous-Palaeogen limestone series, while the east and south of Palikki correspond<br />
to the younger Tertiary sediments of the main Massive.<br />
10° 13O 16O 19O 22O 25O 28OC<br />
Fig. 1 - Diagram of temperature and precipitation at Argostolion.<br />
Tectonically speaking, the eastern part of the island, the coastal mountain system<br />
of Kokkini Rachi, is (according to RENZ 1940, 1955) within the Adriatic-Ionian zone,<br />
while the main massive belongs to the Paxos zone, which must be considered as the<br />
eastern extension of the Apulian Table.<br />
The wide distribution of the carbonate rocks makes for the karst landscape character<br />
of the island. Especially liable to be turned into karst are the well-benked Upper<br />
Cretaceous limestones; the development of the subterranean karst cavities is mainly<br />
influenced by the banking-,joints.<br />
As for the surface karst development, Rillenkarren and especially Kluftkarren<br />
are widely distributed all over the island. Solution dolines were seldom found. Sunk<br />
dolines and shafts are among the most striking karst phenomena in the island, especially<br />
in the hinterland of the Gulf of Sami. Some of them bear brackish water. The most<br />
impressive sunk doline is that of Melissani (50 m long, 35 m wide), which contains,<br />
at a depth of about 20 m, a brackish water lake of 160 x 40 m. A number of brackish<br />
water springs rise to the surface on the immediately adjacent coast between Sami and<br />
Ag. Evphemia (fig. 2, 3). A larger polje is to the west at the foot of the Aenos about<br />
390 m above sea-level. It has originated from an old valley system, which discharged<br />
south-eastward.<br />
The most peculiar karst phenomenon of the island is, however, the sait water<br />
encroachment in the northern part of the peninsula of Argostolion. In this section<br />
of the neck of land the groundwater level is permanently below sea-level, which causes<br />
42 5
a permanent inflow of salt water into the fissures of the carbonate rock. The then<br />
British tax-collector, STEVENSON, was the first, in 1835, to make use of this phenomenon<br />
for the running of a cornmill by widening out some of the water entrances and closing<br />
up adjacent sink holes. Later a second mil was established several hundred metres<br />
farther south. In the 1930’s the mills fell into disuse; they were totally destroyed by<br />
42 6<br />
- present<br />
brackish water spring<br />
sea bmaavothre<br />
coast line<br />
present 100 rn - rsobath<br />
-»C drrecnon of uramn flow<br />
Fig. 2 - Kephallinia and Ithaka. The results of the colouring experiment 1963.
the catastrophic earthquake of 1953. At present they are being restored to attract<br />
tourists.<br />
Scientists of various countries have endeavoured to explain this phenomenon for<br />
nearly a century. Besides theoretical reasonings, experiments were carried out in order<br />
to ascertain, by means of oil, pieces of wood, colour etc., the places in which the salt<br />
water that disappears in the sea katavothres oozes to surface again. The last of these<br />
experiments was carried out in 1957 by the American, Dr. PANE, who used 40 kg<br />
of fluorescein and small coloured sticks of wood. All these experiments failed.<br />
3. THE RESULTS OF THE HYDROGEOLOGICAL SURVEY<br />
During investigation in the summer months of 1959 and 1961, 243 springs, borings<br />
and wells were mapped out. As far as possible, their yield was measured or estimated,<br />
their water temperature taken, carbonate hardness, total hardness, pH-value and<br />
electrolytic conductivity determined. The results of these physical and chemical investi-<br />
gations were utilized in the form of synoptical cartograms and diagrams and made it<br />
possible to demarcate the coherent hydrogeological areas and especially the brackish<br />
water regions. We can, however, not go into details here.<br />
Apart from a few local groundwater fields in Neogen or Pleistocene sediments,<br />
the main massive of the island is largely waterless. Overfall springs only form where<br />
the water-damming Tertiary deposits extend in front of the foot of the limestone<br />
mountains, as on the southern and south-eastern slope of the Aenos and in the south<br />
of the Kokkini Rachi (“Big Akoli”). The karst water springs accumulate where the<br />
AG €VPH€M/A<br />
I<br />
PHRIDI<br />
-- MELISSANI<br />
KARAVOMYLOC<br />
VLACHATA<br />
I . - . .<br />
O SO 700 150 200 G.D.<br />
Fig. 3 - Diagram of total hardnesses of the brackish water springs in the Gulf of<br />
Sami-Ag. Evphemia.<br />
427
limestones reach the coast in the Gulfs of Sami-Ag. Evphemia and of Livadi. It is<br />
therefore in this latter area, in the laguna named “Kutavos”, near Argostolion, that<br />
we find the largest fresh water springs of the island (one spring yields above 100 i/s),<br />
which also form the basis of the town’s water supply. To the north the spring waters<br />
become brackish, but their yield decreases considerably. There are smaller brackish<br />
water areas at the north end of the Gulf of Livadi.<br />
The largest springs of the island altogether are in the Gulf of Sami. Phridi, Palae-<br />
omylos, and Karavomylos are well-known spring names here. Even during periods of<br />
drought some ofthem yield more than 100 1/s. At the Karavomylos the average summer<br />
yield was more than 300 l/s in August 1963; until the great earthquake of 1953 this<br />
spring was used to run a mill. The elevation of all springs on the coast between Sami<br />
and Ag. Evphemia are around sea-level and these springs are brackish; their salt water<br />
content shows certain local gradations (fig. 3). A larger number of submarine brackish<br />
water springs could also be observed here.<br />
The island’s third brackish water area worth recording is at the bluff near Poros.<br />
The peninsulas of Paiikki and Erisos are hydrologically independent areas.<br />
4. THE COLOUR~NG EXPERIMENT OF 1963<br />
The hydrogeological survey of the island of Kephallinia resulted in a synopsis<br />
of the water occurrences, but left the phenomenon of the sea katavothres of Argostolion<br />
unexplained. On the other hand we hoped that our precise knowledge of the hydrographic<br />
conditions would provide the basis of an experimental solution.<br />
In principle submarine springs and the brackish water springs on the coasts of<br />
Kephallinia had to be envisaged as the points where the salt water, entering into the<br />
peninsula of Argostolion, oozes to the surface again. If the re-surfacing was to be found<br />
in the accessible brackish water springs, our attention was, in view of the quantity of<br />
the disappearing salt water, to be focused first of all on the large spring area in the Gulf<br />
of Sami. Since, however, brackish water springs are normally the result of local circulation<br />
and mixture, our first task was a close investigation this area. Thus, in the<br />
summer of 1961, the Salzburg divers, W. TISCH and A. REISINGER, were employed to<br />
check conditions on the coast between Sami and Ag. Evphemia. But they could nowhere<br />
ascertain any submarine entrance of salt water. It appeared, on the contrary, that in<br />
the whole Gulf there are numerous brackish water discharges also under the surface<br />
of the sea.<br />
Permanent observation of the most important springs of this area was another<br />
preparatory step. This meets with great difficulties in so remote a region. All the more<br />
we have to thank N. NIKOLAKOS, the agriculturist, who controlled for more than a year<br />
the total hardness and yield of Phridi, one of the most important springs in the Gulf<br />
of Sami. Added to our own measurements taken during our experiment in the spring<br />
of 1963, this provided very valuable insight into the interplay of precipitation, yield<br />
and chemistry (fig. 6, 7).<br />
Another question was which method to choose for the explanation of this phenomenon.<br />
As we had to make do with a minimum of staff and apparatus, the use of<br />
radioactive material and the activation analysis method as well as the use of lithiumchloride<br />
had to be counted out. The use of dyed lycopodium spores would have made<br />
observation very simple, as this method involves the control of each spring by means<br />
of a plankton net. It was, however, to be feared that the lycopodium spores would be<br />
filtered off, as large quantities of dulse are continually being washed into the sea<br />
katavothres. Besides, the observation of the springs by means of plankton nets would,<br />
in places, have been jeopardized by the beating of the waves. Therefore we finally<br />
decided on the use of fluorescein (uranin).<br />
428
The attempt at least roughly to calculate the necessary quantity of colour was<br />
extremely difficult, for neither could the yield of the brackish water springs (especially<br />
the submarine ones) nor the presumptive time of passage be determined. Financial<br />
reasons, too, limited the quantity of the available colour. Finally, we chose for standard<br />
the largest known brackish water area, i.e. the yield of all springs of the Gulf of Sami-<br />
Ag. Evphemia. At the time of our investigations, of the 35 springs mapped out in the<br />
coastal area, 25 yielded less than 20 l/c. only three more than 100 I/s. For the winter<br />
months we had been given estimations of 3 m3/s and had been informed of 5 stronger<br />
submarine springs. All our own observations as well as the carefully checked information<br />
tended to justify the suppositon that the late winter yield in this largest brackish<br />
water area of Kephallinia does not exceed IO m3/s. A rough calculation of the interplay<br />
of precipitation, run-off, infiltration, and salt water addition, yielded no higher values.<br />
Fig. 4 - Plan of the northernmost sea katavothre on the Argostolion peninsula.<br />
Of the “Old Mill” destroyed by the 1953 earthquake, only the mill conduit remains.<br />
The whole terrain has been worked on for purposes of tourist traffic. The injection<br />
of 160 kg of uranin wa5 performed at the sinkhole E. M = mill-wheel.<br />
429
Thus we had to reckon with colouring a total discharge of 8.6 mill. m3 of water during<br />
ten days, or 17.2 mill. m3 of water during 20 days, respectively. Therefore a quantity<br />
of 160 kg of uranin (our financial limit) seemed to us to guarantee the ascertainment of<br />
a minimum concentration of With the apparatus at our disposal (UV-lamp)<br />
the uranin could be ascertained without doubt to a dilution of 10-1O. Exact quantitative<br />
gradation of dilution degrees between and by means of comparative solutions<br />
is indeed impossible.<br />
On Tuesday, 26 February 1963, from 14.30 to 17.30 hrs., two native workers, controlled<br />
by the Greek geologists, A. DOUNAS and A. MORIKIS, injected 160 kg Uranin<br />
AP conc. into one of the sea katavothres. The colouring material had been shipped by<br />
Messrs. E. MERCK of Darmstadt, Germany, direct to Kephallinia (via Athens) and<br />
was taken from its original emballage only on the spot. The injection was carried out<br />
by persons that had nothing to do with the observation of the springs. The uranin<br />
was injected by means of a 200 1-barrel, the bottom of which had been replaced by<br />
a dense wire net.<br />
The katavothre thus fed is at the northern point of the peninsula of Argostolion.<br />
Here stood the mill erected by STEVENSON in 1835. The salt water is conducted there<br />
by a stone-walkd conduit, 46m long and, on an average, 2m wide; it sinks off<br />
into the artificially extended fissures and tubes of the Cretaceous limestone. Its present<br />
condition, with the mill-wheel installed for the tourists, can best be seen from figure 4.<br />
The quantity of the inflowing water depends on the fluctuations of the sea-level<br />
(which amount to 40 cm here) and can, according to our observations, range from a<br />
few litres to several hundred ljs. Whenever considerable inflow exceeds the sucking<br />
capacity of the rock fissures, the water level in the sinkholes rises, but never quite to<br />
sea level. To maintain the running of the mili-wheel, sluiceboards have therefore been<br />
installed for the regulation of the inflow. According to our own measurements taken in<br />
the spring of 1963 the greatest level difference was, on complete shutting off, 73 cm.<br />
WIEBEL (1874) gives the maximum difference as 137 cm (4,4 ft.). When the conduit<br />
is closed, it can also be observed that small quantities of fesh water are flowing into the<br />
katavothres from rock fissures.<br />
Besides this main katavothre there are on the east coast of the peninsula numerous<br />
smaller sinkholes scattered over a stretch of about 1 km. We could therefore, in 1959,<br />
observe in this area 10 additional active entrance points, the largest of which received<br />
then 10 ijs. These coastal ponors are, however, subject to permanent change, as we<br />
noticed on later controls. Thus, also the large mil conduits (more than 200 m long) of<br />
the so-called “New Mill” are entirely without water today. Here D. MIGLIARESSI had<br />
in 1859 established a similar mil about 400 m south east of the “Old Mill”.<br />
The west side of the peninsula consists mainly of a bluff of 3 to 5 m in height,<br />
at which, along the gradually eastward-sloping calcareous banks, deep surf holes have<br />
formed. It may be assumed that here, too, are numerous entrance points which can,<br />
however, not be observed under present conditions.<br />
Observations of wells and borings have shown that the phenomenon of a groundwater<br />
level permanently below sea-level can be traced from the northernmost point<br />
of the peninsula to the town of Argostolion. Since contradicting figures have been given<br />
for the level difference and no exact observations of its seasonal fluctuation are known,<br />
we installed at the southern mill, 32 m from the coast, a groundwater gauge that was<br />
adapted to a sea-level gauge installed simultaneously. This device, installed by us at<br />
considerable expense, was intended for the observation of the level differences between<br />
sea and groundwater during at least one year. These long-term measurements would<br />
certainly have yielded interesting information. The headmaster of the Argostolion<br />
grammar school offered to look after the gauges, but unfortunately delivered no<br />
measurements after our departure, so that only our own gauge measurements taken<br />
during the experiment are available (fig. 5). They show that the sea-level fluctuated<br />
430
during that period by 34 cm, which is mainly due to the wind pressure. The tides make<br />
themselves hardly felt in this area and are completely superseded by the swells caused<br />
by the wind. The reduced groundwater level joins in the changes of the sea-level,<br />
but not without a certain retardation. This phase shifting also causes, as far as one<br />
can see, the changes in the level difference, whose minimum was, during the period<br />
of observation, 69 cm, and which rose to a maximum of 96 cm. It has not yet been<br />
Fig. 5 - The difference of the salt water and ground water levels in the north east of<br />
Argostolion peninsula and their fluctuations during the period from March 10<br />
to April 3, 1963. Maximum level difference: 96 cm (March 30, 1963), minimum<br />
69 cm (March 20, 1963).<br />
found out if there are any seasonal changes in the level difference. Measurements<br />
taken in August 1959 showed a level difference of 1,2 m.<br />
The re-emergence of the colour was controlled at the springs in the north and east<br />
of the Gulf of Livadi, the springs on the coast between Ag. Evphemia and Sami and<br />
the spring area of Poros, i.e. at all the brackish water springs worth mentioning,<br />
except the submarine ones. Samples were taken once a day. The samples were subject<br />
to UV-light and tested for traces of uranin in the lavoratory installed at Argostolion.<br />
A total of about 580 samples was tested.<br />
The first traces of colour appeared on 12 March 1963, at a spring about 3 km north<br />
of Vlachata, i.e. about half-way between Ag. Evphemia and Sami. On 13 and 14 March,<br />
the uranin also appeared at the brackish water surfacing south of this spring, especially<br />
in the large springs “Phridi” and “Karavomylos” and in the brackish water lake of<br />
Melissani. The most unequivocal evidence was obtained at a group of springs immedi-<br />
ately north of “Phridi”, where the passing of the colour was as follows:<br />
TABLE 1<br />
The uranin concentrations determined in the spring group north of Phridi”<br />
March i4 1963 . . .<br />
March 15. . . . . .<br />
March 16. . . . . .<br />
March 11. . . . . .<br />
March 18. . ....<br />
March 19. . . . . .<br />
traces<br />
10-10<br />
2.10-9<br />
10-9<br />
10-9<br />
10-10<br />
10-10<br />
March 20 . . . . . .<br />
March 21 . . . . . . traces<br />
43 1
Considering the popularity of the phenomenon of the Sea Mills of Argostolion<br />
throughout Greece it was small wonder that the islanders soon knew of the positive<br />
result of the colouring experiment; during the first days, dozens of interested onlookers<br />
watched the samples being subjected to the UV-rays.<br />
The only other spot showing a concentration of<br />
was the brackish water lake<br />
of Melissani; in all the rest of the 8 colour-positive groups of springs concentrations<br />
were less. The colour-positive groups of springs are scattered over a coastal strip about<br />
3 km long.<br />
The first appearance of the colouring material in the spring group near “Phridi”<br />
occurred 16 days after the injection, the passing of the main part of colour 18 days<br />
after it.<br />
The brackish water springs in the entire area of the Gulf of Livadi as well as those<br />
near Poros remained colour-negative. Observation ceased on 3 April 1963.<br />
When the peak was reached, the colouring material was carried along the 15 km-<br />
stretch from the sea katavothres on the peninsula of Argostolion to the large brackish<br />
water springs on the east coast of the island at an average rate of flow of 34 m/h (fig. 2).<br />
Compared with the flow-rates of the karst waters in Alpine mountain systems or in<br />
the south-eastern European karst areas, this rate seems low; such comparisons, how-<br />
ever, are only partly admissible in view of the completely different hydraulic and<br />
hydrogeological conditions prevailing in those areas. In order to appraise the result<br />
of the experiment, viz. the flow-rate as well as the moderate concentrations of the<br />
colouring experiment, the extraordinary meteorological conditions prevailing at the<br />
time of the experiment and during the previous months must, above all, be taken into<br />
consideration.<br />
The precipitation during October, November and December 1962 (1,026 at Argosto-<br />
lion) greatly exceeded the normal annual total and was certainly much higher stil-<br />
in the upper regions of the Aenos massive. The first months of 1963, too, had extraor<br />
rnm<br />
400.<br />
300.<br />
200.<br />
Fig. 6 - The precipitation curves of the long-term annual mean and of the hydro-<br />
graphical years 1961/2 and 1962/3.<br />
432
dinary high precipitation (January, February and March together 493 mm; cf.<br />
fig. 6). Spring yields of an amount unknown till then were the consequence of those<br />
catastrophic rainfalls, which had been unparalleled in previous decades. The spring<br />
“Phridi”, which was kept under permanent observation for a longer period, showed<br />
an ordinary winter yield of 150-200 I/s; at the time of the experiment the yield was<br />
about 1,5 m3/s. “Karavomylos”, the largest spring of the area, has a summer yield of<br />
about 300 1/s and in normal winters a yield of 1-2 m3/s. At the time of the experiment<br />
there was a yield of about 10 m3/s. Some of the submarine springs, hardly visible as<br />
a rule, showed up in the shape of effervescences on the sea-level.<br />
In this connexion the result of the observation of the chemical composition of the<br />
waters is of great interest. Thanks to N. NIKOLAKOS we have at least a complete series<br />
of hardness measurements taken from July 1961 to November 1962 (fig. 7), supplemented<br />
by analyses made on 25 February and 25 July 1962, which were placed at<br />
our disposal by the Greek Ministry of Agriculture (table 2), and our own measurements<br />
of 1963.<br />
G.D.<br />
110’<br />
100.<br />
90<br />
80.<br />
70<br />
60,<br />
50.<br />
40.<br />
30<br />
- 1959<br />
\ \<br />
\ \<br />
\ \ \<br />
‘\<br />
VI1 VI11 IX x XI XII I II 111 IV v Y1 1/11<br />
Fig. 7 - Diagram of total hardnesses at “Phridi” spring (in German degrees).<br />
Figure 7 shows only negligible changes in the chemistry of the brackish water<br />
springs and thus in their respective proportions of fresh and salt water during the<br />
hydrographical year 1961-1962, which was almost an ordinary year regarding waterbearing<br />
(fig. 6); part of those changes surely result from inexact measuring. On comparing<br />
further the measurements of WIEBEL 1874-indeed very old, but exactly taken-one<br />
is justified in concluding that there occur no great changes in the proportion of fresh<br />
and salt water in the large brackish water springs in the Gulf of Sami-Ag. Evphemia<br />
in normal weather. This normal proportion is 3,s : 1 in the spring group of “Phridi”,<br />
and 6 : 1 at the “Karavomylos”.<br />
The catastrophic rainfall in the winter of 1962- 1963 caused a considerable disturbance<br />
of this proportion (fig. 7); it was 6 : 1 at the time of the experiment in “Phridi”,<br />
and 8,5 : 1 at the “Karavomylos”. From this follows that there are certain limits to<br />
the inflow of salt water, which agrees with the observations made at the sea katavothres.<br />
Regarding the ascertained concentrations of colouring material, it must first be<br />
stated that we had to deal with about ten times the amount of the originally estimated<br />
43 3
434<br />
mwm<br />
mob<br />
mmw<br />
N -, '?<br />
*cow
quantity of water. On the other hand it must be taken into account that high-waters<br />
greatly increase the rate of flow. This means that we greatly overestimated the rate of<br />
flow, owing to our lack of comparative figures. In times of normal precipitation it is<br />
probably only a fraction of what we ascertained at the time of extreme high-water.<br />
Ascertainment of the quantity of colour washed out during the time of the experi-<br />
ment in the colour-positive spring groups under observation was impossible, owing to<br />
the moderate concentrations and the fact that their yield cannot be exactly assessed.<br />
Control of the submarine springs was not possible either.<br />
It is further worth mentioning that the temperature of the brackish-water springs<br />
seems to be extremely constant. Of the "Phridi" spring, the following measurements<br />
were taken:<br />
TABLE 3<br />
Water temperatures of" Phridi" spring<br />
15 August 1959 . . . 15,I"C<br />
2 September 1959 . . 15,I"C<br />
30 July 1961 . . . . 15,I"C<br />
24 August 1961 . . . 15,l"C<br />
24 February 1963 . . 15,O"C<br />
26 March 1963 . . , 15,O"C<br />
It is also remarkable that the water temperature of the largest brackish water spring<br />
"Karavomylos", recorded by WIEBEL 1874 (p. 55) on 4 April 1860, was 14,9 "C, which<br />
is exactly the value ascertained by us on 15 August 1959. As most of the water oozing<br />
in the brackish water springs is fresh water, whose increased proportion in the spring<br />
of 1963 caused no considerable change of temperature, it is to be assumed that the<br />
temperature of the large brackish water springs is conditioned not by inflowing salt<br />
water but by the large karst water body.<br />
5. THE KARST-HYDROLOGICAL EXPLANATION OF THE PHENOMENON OF THE SEA KATA-<br />
VOTHRES OF ARGOSTOLION<br />
The result, suprising at first sight, that the salt water disappearing near Argostolion<br />
flows through the entire main massive of the island and surfaces again on the eastern<br />
coast, which is 15 km bee-line distant, is to be explained by the geological structure<br />
and the karst-morphological development of the island during the Pleistocene.<br />
The main massive of the island consists nearly exclusively of Cretaceous limestones<br />
liable to turn into karst, while the south and west (Gulf of Livadi, Palikki) consist of<br />
water-damming Tertiary sediments.<br />
During the glacial periods the level of the world's seas was reduced by the enor-<br />
mous masses of ice. In the Würm, which ended about 12,000 years ago, this reduction<br />
amounted to about 100 m in the Mediterranean.<br />
A glance at the present-day 100m isobath (fig. 2) shows that Kephallinia and<br />
Zakinthos formed a continuous complex during the Würm, while Ithaka was even<br />
then separated from Kephallinia by the sea. In the centre of the Gulf between Ag.<br />
Evphemia and Sami the present 100 m isobath closely approaches the present-day coast.<br />
The Gulf of Livadi, however, today with a maximum sea depth of 28 m, was land in<br />
the Würm and formed a flat and compact trough, on whose watertight basis brooks<br />
could gather, which found a subterranean outlet through the karsted main massive<br />
to the lower level of the coast in the Gulf of Sami. This was then the natural drainage<br />
through the karsted mountainous body to the coast, whose level was about 70 m lower.<br />
435
Such conditions are by no means extraordinary, but are to be found even today in<br />
many karst areas of the world; Yugoslavia’s numerous poljes are among the finest<br />
specimens. There the drainage along the fissures of rock often covers more than 50 km<br />
of subterranean waterways.<br />
After the end of the Pleistocene and the following rise of the sea-level the low-<br />
altitude waterways of Kephallinia were filled with salt water. The rainfalls that sink<br />
into the main massive today still drain off mainly to the east, owing to the general<br />
eastward-sloping of the Cretaceous limestone banks. These great quantities of fresh<br />
water make, together with the old waterways, for those hydraulic factors that will<br />
be discussed in the course of the physical explanation below.<br />
The deliberations presented here are supplemented in a rather interesting way by<br />
the investigation of stalactites from the sunk doline of Melissani near Vlachata. In<br />
this there is a brackish-water lake, whose level is only a little above sea-level. In 1961<br />
we managed to have stalactites hanging from the walls of subterranean caves brought<br />
up from a depth of 3 m and 26 m respectively below sea-level. The age of these stalac-<br />
tites was determined by the Zweites Physikalisches Institut of Heidelberg University<br />
by means of C-14 treatment. The age of the stalactite that was taken from a depth of<br />
3 m was determined as 16,400 & 300 years, while the stalactite from a depth of 26 m<br />
was found to be 20,400 =k 500 years old. This is another piece of evidence, obtained<br />
by means of absolute age ascertainment, for the eustatic reduction of the sea-level<br />
of the Mediterranean during the last glacial epoch, evidence, which in geological<br />
research can only be obtained under extremely fortunate circumstances. For carrying<br />
out the age determination we are very much obligcd to Dr. K. O. MUNNICH.<br />
We are aware of the fact that in this area positive as well as negative shiftjngs of<br />
the shore up to the most recent geological epochs may well have tectonic causes.<br />
The numerous earthquakes are evidence of this instability. In view of the amount<br />
of the eustatic level fluctuations these tectonic movements are, however, likely not to<br />
have changed the principle of the development outlined above. We know many extreme-<br />
ly karsted horizons, today below sea-level, in the carbonatic mountain systems of many<br />
Mediterranean coastal areas. They could be ascertained, among other investigations,<br />
by numerous borings, carried out by the Institute of Geology and Subsurface Research<br />
in Athens in the Gulf of Corinth and on the south coast of the Peloponnesos in depths<br />
of 10-20, 25-30 and about 80 m.<br />
6. THE PHYSICAL EXPLANATION OF THE PHENOMENON<br />
Of the submarine karst ways, ascertained by the colouring experiment, the genesis<br />
from the eustatic sea-level reductions during the glacial periods could be reconstructed<br />
beyond doubt; but the hydraulic aspect of the workings of the sea katavothres needed<br />
physical explanation. This problem was taken up and solved by Dipl.-Ing. H. BERGMANN<br />
and Dipl.-Ing. Th. GLANZ (Technische Hochschule, Graz) theoretically as well as by<br />
the construction of a model. As these calculations and constructions cannot be demonstrated<br />
here, we refer to a special paper by Th. GLANZ published in the “Steirische<br />
Beiträge zur Hydrogeologie”, year 1965.<br />
As the above-mentioned analyses show, the fresh water-salt water proportion of<br />
the large springs in the Gulf of Sami normally varies from 6 : 1 to 3,5 : 1. The main part<br />
of the water masses surfacing here comes therefore from the towering mountain massive<br />
extending between the Amos (1,628 m) and the Ag. Dynati (1,131 m). The storage of<br />
winter rainfalls in this extensive mountain system also explains the high yield values of<br />
the coastal springs in summer and the relatively low water temperatures with their<br />
nearly constant figures throughout the year.<br />
436
In a karsted mountain system the number of waterways decreases from the surface<br />
to the lower regions; the same is true of the sum total of the cross-sections of the karst<br />
tubes through which they flow. That means, however, that the rate of flow of the<br />
draining-off waters increases with depth. Therefore potential energy is progressively<br />
transformed into cinetic. if these karst tubes reach below sea-level, pressure heads may<br />
occur in narrow places, heads that are, however, below sea-level. If in such a place<br />
there is a connexion (of a larger cross-section) with the open sea, salt water flows in.<br />
If the point of its entrance is below the sea surface, it wil normally be inaccessible to<br />
observation. As the sinkholes of the Sea Mills of Argostolion are, however, about 20 m<br />
distant from the shore, the level in these sinkholes indicates, when the conduits are<br />
closed, the piezometric head of the karst tube through which the salt water flows.<br />
This level also coincides with the general groundwater level at the east coast of the<br />
Argostolion peninsula. The pressure head occurring here results from the still lower<br />
pressure head at the entrance point of the fresh water tubes into the salt-water-bearing<br />
base tube and from its friction losses. Thus this phenomenon can be called a natural<br />
ejector working on the principle of the water jet pump (fig. 8).<br />
Fig. 8 - Scheme of hydraulic working of the “Sea-mills of Argostolion”.<br />
K = Schematic karst water body, in reality flowing along numberless clefts.<br />
- .- .- Energy gradient<br />
__-- Hydraulic gradient<br />
.m Zone of hydraulic gradient below sea level<br />
vi 9 v3 > vz<br />
This also offers a natural explanation of the occurrence of brackish-water springs<br />
in the Gulf of Sami, below, at, and above sea-level. For in an ejector there is a decrease<br />
of pressure at the entrance point of the pressure water into the bigger tube, but an<br />
increase of pressure behind it. Thus, the mixed water is lifted. This principle has been<br />
used for decades for the lifting of water.<br />
Of former authors, who dealt with the problem of the Sea Mills, FOUQUE 1867,<br />
LEHMANN 1932, MARKETOS 1963 and WIEBEL 1874 endeavoured after a physical explanation<br />
of the phenomenon. While the three first-mentioned argued in favour of a re-emergence<br />
of water on the west coast, WIEBEL was the only scientist to envisage the possibility<br />
of a connexion with the large brackish-water springs in the Gulf of Sami.<br />
437
REFERENCES<br />
FOUQU~, F. 1867. Rapport sur les tremblements de terre de Céphalonie et de Mételin<br />
en 1867. Archives des missions scientifiques et littéraires, publié sous les auspices du<br />
ministère de l’instruction publique, vol. 4, pp. 445-482. Paris.<br />
GLANZ, Th. 1965. Das Phänomen der Meermiihlen von Argostolion. Eine hydraulischphysikalische<br />
Betrachtung. 14 p. (Steirische Beiträge zur Hydrogeologie, no. 17).<br />
Graz.<br />
LEHMANN, O. 1932. Die Hydrographie des Karstes. 212 p. (Enzyklopädie der Erdkunde,<br />
no. 6b). Wien.<br />
MARKETOS, S. 1963. Fresh Water of Kefallinia Islands and the Phenomenon of the<br />
Sea Mills near Argostolion. Zonios Echo. no. 213, pp. 23-24. Athens.<br />
MAURIN, V. and ZOETL, J. 1960. Karsthydrologische Aufnahmen auf Kephallenia<br />
(Zonische Inseln). 52 p. (Steirische Beiträge zur Hydrogeologie, no. i). Graz.<br />
PARTSCH, J. 1890. Kephallenia und Ithaka. 108 v. (Petermanns Mitteilungen, Ergän-<br />
PETROCHILOS,<br />
de la<br />
RENZ, C. 1940<br />
d’Athènes. vol. 8). Athens.<br />
IlIonie. 70 p. (Bulletin<br />
Lthens.<br />
(Mémoires de l’Académie<br />
REGz,-C. 1955. Di; vorneogene Stratigraphie der normalsedimentären Formationen<br />
Griechenlands. Athens.<br />
WIEBEL, K. W. M. 1874. Die Insel Kephallenia und die Meermiihlen von Argostolì.<br />
Hamburg.<br />
43 8
ABSRACT<br />
SALT-WATER ENCROACHMENT OF<br />
TERTIARY LIMESTONES ALONG COASTAL<br />
SOUTH CAROLINA<br />
George E. SIPLE (+)<br />
Limestone of middle Eocene to early Miocene age and clastic sediments of Pale-<br />
ocene to early Eocene age constitute the major water-bearing Tertiary formations along<br />
coastal South Carolina which have been invaded during Recent and past geologic<br />
epochs by sea water. Deposits of low regional dip, characterised by low permeabilities<br />
and ground-water gradients and attended by sluggish circulation, are probably dis-<br />
charging water of Pleistocene or earlier age. Upper zones of Eocene limestones, incised<br />
by estuaries during Pleistocene and Recent time, are now subject so salt-water encroach-<br />
ment. Encroachment is also thought to occur along the sub-sea contact of the Eocene<br />
and Oligocene deposits. The most extensive encroachment recognized at the present<br />
time occurs both in limestones of Tertiary age and clastic beds of Cretaceous age<br />
extending in an arcuate belt from the Beaufort Basin to areas adjacent to the Cape<br />
Fear Arch. These artesian aquifers have fresh-water heads ranging from altitudes of<br />
-3 meters to +49 meters and maximum chloride concentrations of about 8,500ppm.<br />
RESUME<br />
Infiltration de l’eau de mer dans les calcaires tertiaires le long de la côte de la Caroline<br />
du Sud<br />
Des calcaires étagés de l’éocène moyen au miocène inférieur et des roches clastiques<br />
allant du paléocène au début de l’éocène constituent les principales formations tertiaires<br />
aquifères qui longent la côte de la Caroline du sud et qui, au cours des ères géologiques<br />
passées et récentes, ont été envahies par l’eau de mer. Des sédiments à pendage local<br />
faible, caractérisés par une faible perméabilité et par un faible gradient hydraulique et<br />
dans lesquels la circulation de l’eau est lente, libèrent probablement de l’eau issue des<br />
couches pléistocènes ou d’un âge plus ancien. Des zones supérieures constituées de<br />
calcaires éocènes, entaillées par des estuaires au pléistocène et à une époque récente,<br />
sont maintenant exposées à des infiltrations d’eau de mer. On pense aussi que des<br />
infiltrations peuvent se produire à la surface de contact sous-marine des dépôts éocènes<br />
et oligocènes. Les infiltrations les plus importantes connues à l’heure actuelle affectent<br />
des calcaires tertiaires et des roches clastiques crétacées dont la zone s’étend en un arc<br />
du bassin de Beaufort aux régions voisines de Cape Fear Arch. Dans ces nappes arté-<br />
siennes, la charge piézométrique de l’eau douce est comprise entre -3 et -49 mètres.<br />
La concentration maximale en chlorure est de 8.500 ppm.<br />
Structurai features affecting the salt-water encroachment of Tertiary limestones in<br />
$e Beaufort area include a dome designated as the “Burton High” and an inferred<br />
hinge line” considered as correlative with a steepening of the basement platform,<br />
recognized in other areas of the Atlantic Coastal Plain.<br />
INTRODUCTION<br />
Salt-water encroachment, as defined herein, is that condition wherein the dissolved<br />
chloride concentration of ground water in any specific aquifer exceeds that normally<br />
found in the same aquifer at points distant from present coastal areas and where<br />
unrestricted flow conditions exist. The threshold concentration is arbitrarily selected<br />
here as 250 ppm (parts per million), although it is also recognized that lesser concen-<br />
trations of chloride might also be considered as exceeding those characteristic of<br />
exclusively fresh-water aquifers, and thus indicative of salt-water encroachment.<br />
(*) U. S. Geological Survey, Columbia, South Carolina.<br />
43 9
The purpose of this paper is to describe in general terms the regional geologic and<br />
structural factors affecting the encroachment of salt-water into limestone aquifers of<br />
Tertiary age in South Carolina, and to indicate the geohydrologic environment<br />
peculiar to this encroachment.<br />
Geologic and hydrologic studies of coastal areas by the U.S. Geological Survey,<br />
conducted in cooperation with the United States Navy and the South Carolina State<br />
Development Board, were the source of the data presented herein.<br />
Phosphatic and calcitized limestones of middle Eocene to early Miocene age and<br />
phosphatic sands of Paleocene to early Eocene age comprise the principal water-<br />
bearing units of Tertiary age along coastal South Carolina that have been invaded<br />
during Cenozoic time by saline waters advancing from the sea.<br />
The principal factors influencing the location and extent of salt water encroachment<br />
are : (1) the distribution and structure of geologic units containing the water-bearing<br />
beds; (2) differences in permeability among all units in the stratigraphic column and the<br />
range in static fresh water head among the separate aquifers; (3) present and historical<br />
ground-water gradients and their resultant effect on the extent of flushing; (4) incisement<br />
of confining beds by comparatively deep streams or estuaries; and (5) the depth of any<br />
specific aquifer with respect to present sea level.<br />
A system of water-table or unconfined ground water circulation prevails in those<br />
parts of the limestone in or near outcrop areas in the upper coastal plain, whereas a<br />
system of artesian circulation is characteristic of these aquifers in the lower coastal<br />
plain. Some exceptions occur, as for instance in central Beaufort County, where<br />
recharge is effected from the overlying water table reservoir, moving through the con-<br />
fining beds to the artesian aquifer below. Similar instances of water-table circulation<br />
may also occur in other parts of the lower coastal plain.<br />
Maximum chloride concentrations of about 2,500 ppm have been determined from<br />
the water in the limestone aquifer at Parris Island, where present-day sea water is<br />
thought to be encroaching into the aquifer at shallow depths. In the deeper part of<br />
the aquifer (400-600 feet or 125-115 m) the high chloride concentration is thought<br />
to be derived from old sea water entrapped with the sediments during their deposition<br />
or subsequently intruded by sait-water accompanying inundation of the foreland during<br />
Pleistocene time.<br />
Limestone Aquifer<br />
STRATIGRAPHY<br />
The principal area of limestone occurrence is a modified triangular area in the<br />
southern part of the Coastal Plain (fig. 1). The outcrop area of the oldest and most<br />
extensive limestone unit, the Santee Limestone, forms an arcuate belt approximately<br />
twenty-five miles wide extending across the north and northwestern edge of this area.<br />
Using the altitude of the top in the Santee Limestone at Bowman, Charleston, and<br />
Walterboro, S. C., the strike of this surface is calculated to be about N81 “E and the dip,<br />
7.8 feet per mile (1.5 m/km), towards the south and southeast (coastward) leading to a<br />
basinal structure in the general vicinity of Savannah, Ga. The dips of younger beds are<br />
usually very gentle, barely exceeding that of the land surface.<br />
The principal limestone deposits in South Carolina include the Santee Limestone<br />
of middle Claiborne (Lisbon) age and/or the Castle Hayne Limestone of late Claiborne<br />
(Gosport) age. Although this limestone sequence has been assumed to be continuous<br />
with that comprising the “principal artesian aquifer” of Florida and Georgia (Callahan,<br />
unpublished report, 1961 ; Stringfield, personnal communication, 1962; Counts and<br />
Donsky, 1963; McCollnm and Counts, 1964), this continuity is based upon an apparent<br />
siniilarity in hydrologic and rock-stratigraphic parameters. The sequences are not<br />
440
2' 81'<br />
1<br />
SCALE<br />
80 79'<br />
I l<br />
EXPLANATION<br />
Areas underlain in Pa* by<br />
,- ILO OU ET ERS Tertiary limestone having about<br />
IQ0 feet or less of overburden Ì<br />
J<br />
82'<br />
I<br />
81<br />
l<br />
8V<br />
" ~ i n line p " separating foreland<br />
area (NW) from miogsosvncline (5<br />
,<br />
79"<br />
Fig. 1 - Areal distribution of Tertiary limestone units in South Carolina.<br />
correlative on a time-stratigraphic basis, the greater part of the limestone in South<br />
Carolina being older (Claiborne) than adjacent limestones in Georgia, which are<br />
predominantly Jackson in age (fig. 2). Comparatively thin limestones of Eocene age<br />
occur beneath a mantle of Oligocene to Pleistocene clastic sediments, and extend<br />
northeastward from the outcrop area to the southern limb of the Cape Fear Arch,<br />
above which they were either never deposited or subsequently eroded. Limestone<br />
deposits of similar age and lithologic composition re-occur on the northern limb of the<br />
,\$>,"'<br />
44 1
Arch and continue northeasterly across the lower part of the North Carolina Coastal<br />
Plain.<br />
Beds of limestone, shell hash, and sand having low regional dip and possessing a<br />
sluggish ground-water circulation are, at the present time, discharging unflushed or<br />
incompletely flushed brackish waters that were deposited contemporaneously with the<br />
sediments during earlier geologic epochs. The poor circulation is thought to result from<br />
a combination of factors including low permeabilities or very slight ground water<br />
gradients.<br />
Stratigraphic position may also be a condition of salt-water encroachment in wells<br />
in the Charleston area. Here, salty or brackish water has invaded aquifers in all strati-<br />
graphic units from the surficial sands down to the Black Creek Formation (of Austin<br />
and Taylor age) in which fresh water occurs at depths of from 1,500 to 2,000 feet<br />
(460-600 m). Fresh water also occurs at shallower depths - depending upon the well<br />
location with respect to salty tide water, depth of casing, and intensity of pumping.<br />
Many wells in the Charleston area, drilled to depths of about 500 feet (152 m), are<br />
cased only part way, usually a few feet, into the Cooper Marl. A large proportion of<br />
these wells yield brackish water. One possible reason for their contamination is that the<br />
contact between the Cooper Marl and the Santee Limestone, at about 250 feet (76 m)<br />
below mean sea level, might represent a zone of accelerated solution, whose greater<br />
porosity and permeability might facilitate the conductance of brackish or salty water.<br />
Wells not cased through this zone might thus enhance the degree of salt-water encroach-<br />
ment throughout the aquifer in surrounding areas.<br />
Many of the major streams crossing the Coastal Plain discharge at present into<br />
estuaries of a sea-island geomorphic environment characteristic of the area extending<br />
between Charleston, S. C., and Savannah, Ga. During interglacial stages, these streams<br />
CU: down through the confining beds overlying the shallow Eocene and Oligocene<br />
limestones, thereby affording a means of salt-water encroachment into the underlying<br />
aquifers.<br />
Conjîning Beds - Cooper Marl and Hawthorn Formation<br />
The principal confining bed for the limestone aquifer north of a line positioned<br />
approximately along the 33rd parallel (fig. 1) consists of the Cooper Marl of Oligocene<br />
age. This unit is comprised of tan to greenish-brown, phosphatic, foraminiferal marl.<br />
On the basis of the altitudes of the limestone in the quadralateral area formed by<br />
St. George, Santee Falls, Charleston, and Hollywood, S.C., the strike of the Cooper<br />
Marl lies in an approximate direction of N31"E ond the dip is about 2.9 feet (0.6 m/km)<br />
per mile to the southeast. South of the 33rd parallel the Hawthorn Formation of middle<br />
Miocene age serves as the confining bed for the limestone. This unit consists of phospha-<br />
tic clays and siltstones together with fuller's-earth-type clays and comprises the southerly<br />
outcropping Tertiary unit in the State.<br />
STRUCTURE<br />
Structural features of the principal limestone bed in the southern part of the South<br />
Carolina coastal area (fig. 3) also influence the occurrence or extent of sait-water<br />
encroachment in this aquifer.<br />
Thus, the generally predominant southern to southeastern dip of these limestones<br />
from their outcrop area towards the coast is interrupted by an apparent anomolous<br />
feature in eastern Beaufort County where the top of the limestone comes within 33 feet<br />
(10 m) of the ground surface and from which a component of dip has been observed<br />
from almost all directions, indicating the presence of a local high or dome of limestone<br />
in this general area. For purposes of identification, this feature is designated the<br />
443
“Burton high” in this report, after the nearby town of that name. To the north, south,<br />
west, and southwest, the limestone occurs at greater depths and this in a general area<br />
which, for older units of the stratigraphic section, is characterized by a negative or<br />
basinal structure - variously described as the Beaufort Basin (Richards and Straley,<br />
1953), East Georgia Basin, or Southeast Georgia Embayment (Stringfield and LeGrand,<br />
1964). A pronounced basinal area to the north and west of this high coincides in part<br />
with the probable depositional basin for the Cooper Marl. The presence of a dip towards<br />
the west and southwest together with a similar direction of hydraulic gradient (brought<br />
about by pumping in the Savannah area) enhances the movement of salt-water in that<br />
direction.<br />
The presence of a limestone of Claiborne age to the northwest of Parris Island on<br />
the South Carolina side, in juxtaposition with adjacent limestone of Jackson age to the<br />
southwest in Georgia, may be attributed to structural discontinuities in lieu of the time-<br />
stratigraphic succession indicated above. Thus faulting might account for the abrupt<br />
disappearance of approximately 400 feet (122 m) of Jackson deposits in the Port<br />
Royal Island area, adjacent to Parris Island. Faulting has been attributed to similar<br />
discontinuities of Stratigraphic units to the southwest in the central or north-central<br />
Georgia Coastal Plain. However, if faulting has occurred in this section of middle to<br />
upper Claiborne equivalents in lower South Carolina, analogous discontinuities are not<br />
clearly evident for older formational contacts in the stratigraphic column, meager or<br />
limited as the data concerning these might be. In addition, although in some areas<br />
faulting might facilitate the movement or encroachment of water, in others it might<br />
function as a barrier to such movement. In general it might be said that faults would<br />
affect water circulation through the limestone in a manner similar to that effected by the<br />
presence of joints or other linear fractures in the rock.<br />
It is suggested herein that the rather abrupt steepening of dip for the Ocala Lime-<br />
stone (of Jackson age) in this area is coincident with the presence of a “hinge line” or<br />
flexure separating the foreland area (to the northwest) from a miogeosynclinal basin,<br />
the latter forming an open-marginal type of basin characteristic of the “moble belt”<br />
structual sequence proposed and described by Weeks (1952; 1959) for the Paciñc areas.<br />
Thus this hinge line is probably coincident with a steepening in slope of the basement<br />
platform observed elsewhere on the Atlantic Coastal Plain, exlusive of the South<br />
Carolina Coastal Plain (Siple, 1959). The structural downwarping which thus began in<br />
pre-Triassic time is evidenced as continuing here as late as late Jackson and post<br />
Jackson time.<br />
The Cooper Marl, once considered a time-stratigraphic equivalent of the Ocala<br />
Limestone, was probably either never deposited in the Beaufort area or else had been<br />
removed by erosion before deposition of the Hawthorn Formation. The divergent<br />
alignment between axes of the postulated depositional basins (either transgressive or<br />
regressive) for the Cooper Marl and the Santee Limestone is indicated in a general<br />
manner by the disparity between their strike directions (given above). Based on these<br />
indications and the fact that a structure section parallel to the coast shows the axis<br />
for the depositional basin of the Cooper Marl to be located in the Charleston area. The<br />
probabilities are that this formation was never deposited in Jasper and Beaufort<br />
Counties to the south.<br />
Permeability of Limestone Aquifer<br />
HYDROLOGY<br />
Hydrologic factors considered to have influenced the extent of salt-water encroach-<br />
ment in Tertiary limestones include the primary and secondary permeabilities of the<br />
aquifer itself, the permeabilities of intervening or confining beds (generally clays),<br />
the varient static heads of fresh waters among separate aquifers of the stratigraphic<br />
44 5
column and the steepness of present and historical ground-water gradients throughout<br />
these aquifers. Of additional significance in water-table aquifers is the depth of any<br />
specific discharge point (well screen) with respect to sea level.<br />
The primary permeability of the limestone is, of course, indeterminant but probably<br />
not inconsequential. Shallow deposition of skeletal remains and recrystallization<br />
following some compaction probably facilitated the formation of porous or vuggy zones<br />
in the rock. Where the limestone was later covered by comparatively thin deposits, and/<br />
or when the land mass was subsequently elevated (or the sea level lowered) ground water<br />
circulation would increase, resulting in the development of secondary permeability by<br />
solution. The development of secondary permeability begins in the recharge areas,<br />
extends through the intermediate areas of the aquifer, and terminates at points or areas<br />
of discharge. The initial cause of secondary permeability is attributed largely to theeffects<br />
of diastrophism by which fracture systems such as joints and faults are developed in the<br />
rock and subsequently enlarged by solution.<br />
The transmissibility (Theis, 1935) of the limestone aquifer as calculated from data<br />
obtained during pumping tests in the vicinity of Burton in Beaufort County ranged from<br />
25,000 to 90,000 gpd/ft (gallons per day per foot). At a site approximately midway del<br />
“be” between Burton and Savannah, in eastern Jasper County, similar tests indicated a<br />
transmissibility of about 350,000 gpd/ft whereas in Savannah the coefficient was calculated<br />
to be approximately 250,000 gpd/ft (Warren, 1944).<br />
The greatest volume of discharge through wells is concentrated in the immediate<br />
vicinity of Savannah, resulting in the development of a cone of depression, centered<br />
in that area, with drawdown and pumpage diminishing at proportionately greater<br />
distances from Savannah. A similar but less extensive cone of depression has developed<br />
in the Burton well field (fig. 4), located on Port Royal Island in central Beaufort<br />
County. Logically, onel might expect that areas of concentrated discharge might be<br />
roughly coincident with those in which pumping tests indicate the aquifer to be high in<br />
transmissibility or permeability. This is not apparent however from the data available.<br />
The coefficient of transmissibility is much higher north, east, south, and southeast of<br />
Savannah than at Savannah (Counts and Donsky, 1963). The coefficient of transmissibility<br />
(T) varies directly with the thickness of the aquifer (m), and therefore higher<br />
values of T should be expected in areas coincident with greater aquifer thickness. This<br />
holds true in the general sense to the extent that both m and T appear to increase in a<br />
southwestward direction. Values of permeability (Tim) are not so easily reconcilable -<br />
one reason being that the definition of ’m’ must be assigned on an arbitrary basis and is<br />
therefore subject to a considerable range of values. In the Burton area, where the permeable<br />
zone of the aquifer may have a thickness as little as 50 feet (i 5 m) or as high as<br />
250 feet (75 m), the permeability might range between 100 and 1,000 gpd/ft2 (gallons<br />
per day per square foot) with an estimated average being about 500 gpd/ft2. In the area<br />
immediately west of the Broad River, where T = 350,000 gpd/ft, the thickness is<br />
estimated at 200 to 400 feet and the permeability to range from 800 to 1,800 gpd/ft2.<br />
Counts and Donsky (1963) assigned an average permeability of 400 gpd/ft2 for the<br />
Savannah area and 970 gpd/ft2 for an area about 15 miles east of Savannah. Thus, the<br />
larger values for permeability of the aquifer do not appear to coincide with those areas<br />
in which the greater discharge is taking place and congruently where the greater amount<br />
of solution should be taking place. It is apparent then that other factors, probably<br />
including differences in the lithology of the aquifer, different concentrations of sulfides,<br />
and the range in thickness of the confining bed, and thus indirectly a range in the COZ<br />
pressure, collectively account for differences in the development of secondary permeability<br />
by solution.<br />
The coefficient of storage as determined by the non-equilibrium formula was calculated<br />
at .O001 in the test at the Burton well field, .O005 (average) from the test in eastern<br />
Jasper County, and ,0003 in Savannah (Counts and Donsky, 1963).<br />
446
447<br />
N<br />
m
Another method of determining this coefficient was adapted from Jacob (1940),<br />
who used this formula :<br />
where, S = the coefficient of storage, Vo = the specific weight of water at a reference<br />
temperature, 8 = the porosity, rn = the thickness of the aquifer in inches, B = the<br />
bulk modulus of compression of the water, and B.E. = the barometric efficiency.<br />
The same paper shows the sum of the barometric efficiency and the tidal efficienty (T. E.)<br />
to be unity, so that knowing the tidal efficiency, the value of S can be computed. Thus,<br />
for well BFT-123, the tidal efficiency was measured at 0.35 and thus<br />
-<br />
------= 1<br />
1 - 1<br />
1.54<br />
B.E. 1 - (T.E.) 1 - 0.35<br />
and<br />
S = (0.0361) x (0.35) x (200 x 12) ~ (1.54) = 1.55 x loe4 [ 300,000]<br />
where the porosity is estimated at 0.35 and the thickness assigned a value of 200 feet<br />
(61 m).<br />
Solution of Limestone<br />
Solution takes place in varying intensity throughout this system, assuming the<br />
circulating waters remain unsaturated with respect to calcium carbonate.<br />
The degree of solution is a function of such parameters as the lithologic composition<br />
and primary permeability of thelimestone, extent of water circulation, water volume and<br />
temperature, time and areas of contact, polarity of solvent, and the carbon dioxide<br />
pressure.<br />
Under normal conditions, the partial pressure of COZ in the atmosphere (at 16°C)<br />
would dissolve about 85 ppm of CaC03. Inasmuch as the calcium carbonate concentra-<br />
tions of most ground waters circulating through limestone may be as much as six<br />
times as great, there must be additional enrichment of COZ in order to accomplish this<br />
solution. The principal causitive factor is considered to be the COZ content of the<br />
overlying soil. The COZ exerts pressure on the water passing through the soil to an<br />
extent several hundred times as great as the pressure of COZ in the air (Swinnerton,<br />
1949). This, in effect, increases the solubility of the CaC03.<br />
The solubility of circulating ground water may also be increased by the presence<br />
of acids in the water, generated by bacterial decomposition; the oxidation of carbo-<br />
naceous matter below the water table provides additional COZ.<br />
One might expect the development of solution cavities to take place more readily<br />
in those areas where (1) ground-water circulates rapidly, or (2) the solute is least<br />
saturated in CaC03. These situations are likely to develop in discharge areas and recharge<br />
areas, respectively. Theoretically at least, in areas of comparatively high discharge,<br />
as for example those areas peripheral to Savannah, Ga., or Beaufort, S. C., the continued<br />
increase in well discharge should have enhanced the development of solution cavities<br />
as a feature of secondary permeability; but this development apparently has been<br />
concentrated in the more shallow or upper regions of the limestone. At greater depths<br />
the limestone becomes less porous (and less permeablej and the rock consists more<br />
nearly of a soft marl than a compact limestone.<br />
Natural and Artificial Ground-water Gradients<br />
Figure 4 shows the piezometric contours as interpreted for the principal artesian<br />
aquifer in southern South Caroliria during the summer of 1959.<br />
448
The original piezometric suface in this area was controlled chiefly by the distribution<br />
of recharge and natural discharge. Under these conditions the ground water probably<br />
flowed generally from southern Hampton and northern Jasper and Beaufort Counties<br />
toward the Parris Island-St.Helena Island area where natural discharge from the<br />
limestone aquifer occurred as submarine springs or effluent seepage into the estuaries.<br />
The slope of the hydraulic gradient and the convergeance of flow lines on piezometric<br />
maps (Warren, 1944) representing conditions in the Savannah area for about 1880<br />
confirm this assumption. The gradients indicated on this map ranged from about 1 foot<br />
per mile (0.2 mjkm) in the Savannah area to 4 feet per mile (0.8 m/km) in the northern<br />
part of Beaufort County.<br />
Figure 4 indicates the extent to which pumping at Savannah, Ga., and Beaufort,<br />
S. C., during modern times has affected the configuration of this piezometric surface.<br />
The most pronounced effect results from the pumping at Savannah, where the lowest<br />
point in the cone of depression occurred during the period 1959-1962 and was reported<br />
(Counts and Donsky, 1963; McCollum and Counts, 1964) as 120+ feet (37 m) below<br />
mean sea level. In Beaufort County, the cone of depression, caused by pumping at the<br />
Burton well field, extended slightly deeper than the - 10 foot (- 3 m) contour. A map<br />
of the piezometric surface for the Savannah area, prepared from the water levels<br />
measured in 1961 (McCollum and Counts, 1964) shows an outward expansion of the<br />
Savannah cone in the South Carolina area to accomodate about an additional 5 feet<br />
(1.5 m) of drawdown. (The pumping rate in the Savannah area was about 62 million<br />
gallons per day.) All contours below the zero contour appear to have been affected.<br />
The seeming stabilization of this contour suggests possibly a confirmation of the<br />
postulated recharge in the Broad River-St. Helena Island area.<br />
The small piezometric high (fig. 4) in the area northeast of Burton on the Marine<br />
Corps Auxiliary Air Station is interpreted as an effect produced by absence of a confi-<br />
ning bed (due to stripping during post-Eocene time) coincident with a higher head in<br />
the overlying water table aquifer (than in the underlying artesian aquifer) - and thus<br />
a local recharge to the limestone.<br />
Incisernent of Confining Beds<br />
The stratigraphic position of the limestone at comparatively shallow depths in the<br />
sea island environment of coastal Beaufort County enabled discharge to occur,<br />
under natural or undisturbed conditions, by leakage from the limestone into the<br />
estuaries, there being a natural gradient in that direction. However, subsequent to<br />
increased utilization and development of the aquifer by pumping, the gradient was<br />
(at times) reversed when the artesian head declined to a position near or below mean<br />
sea level, allowing salt-water encroachment to take place in the upper part of the aquifer.<br />
Long-time residents of the Beaufort area reported that many years ago water “boils”<br />
or submarine springs had been sighted in the vicinity of Port Royal Sound. An attempt<br />
to check these by areal photograph interpretation and actual flying over the area failed<br />
to substantiate any present-day occurrence of these springs.<br />
WATER QUALITY<br />
Chemical Composition of Natural and Contaminated Water<br />
For all practical purposes, the principal water-bearing beds in coastal South Caro-<br />
lina can be grouped into two major aquifer Systems - the phosphatic, glauconitic and<br />
quartoze sands of the Cretaceous System and the limestone and glauconitic, pyritiferous<br />
sands of the Tertiary System. Waters circulating through the Cretaceous formations are<br />
449
characteristically of the sodium bicarbonate type, very soft, and high in fluoride; they<br />
have a p H of 8.0 or higher.<br />
Most ground waters in the Tertiary System are circulating through beds of limestone<br />
or dolomitic limestone and the solution of these calcium and magnesium carbonate<br />
rocks controls the chemical composition of the water. Characteristically, this composi-<br />
tion reflects a calcium-magnesium-bicarbonate type water - moderate to very hard,<br />
O c<br />
=<br />
._<br />
.- - 6<br />
E<br />
tJ<br />
- 5<br />
. ,"<br />
-<br />
wc -<br />
ln<br />
._ $<br />
w"-<br />
- 12<br />
- 11<br />
- 10<br />
- 9<br />
- 8<br />
- 7<br />
- 4<br />
- 3<br />
- 2<br />
- 1<br />
i o<br />
CHN-IO1 GHN- 58<br />
- 38<br />
- 36<br />
- i8<br />
- 13<br />
- 3<br />
CHN-108 BFT-22 EFT-108<br />
Fig. 5 - Composition of fresh waters (CHN-101, BFT-22) in the Tertiary limestones<br />
of coastal Sonth Carolina contrasted with waters from the same aquifer after<br />
salt-water encroachment (CHN-58, BFT-108) and contaminated water of the<br />
Tertiary sand aquifer (CHN-108).<br />
450
approximately neutral in pH. In some places the water contains excessive amounts of<br />
dissolved iron or objectionable amounts of hydrogen sulfide gas.<br />
Typical compositions of ground waters from selected wells in the limestones of<br />
Tertiary age are indicated in figure 5. These wells range from 60 to 300 feet in depth and<br />
are located in the southern coastal area. The figure shows the effect of salt-water<br />
encroachment on thenormally low chloride water found in the aquifer. Some of the sand<br />
aquifers of early Tertiary age(under1ying the limestone) have also been subject to saltwater<br />
intrusion both in this area and in the coastal area extending northward towards<br />
Georgetown, S. C. The chemical composition of water from these aquifers is not readily<br />
differentiated from that typical of the Upper Cretaceous formations because it also is<br />
a sodium bicarbonate type. However, some differentiating criteria may be found in the<br />
greater percentage of calcium and sulfate ions in the water from the Tertiary sands. In<br />
addition it is usually harder and more acidic. The typical composition of this water is<br />
indicated in figure 5 by the diagram representing water from well CHN-108. The<br />
aquifer at this point has been subject to salt-water encroachment and the chloride<br />
concentration of the water sampled at this test was 744 ppm.<br />
Salt-water Eitcroachment it2 Tertiary Limestone<br />
The fresh water, salt-water interface is not usually a sharp line of contact but<br />
rather a zone of measurable thickness, and generally referred to as a zone of diffusion.<br />
Early investigators (Ghyben, 1889; Herzberg, 1901) attributed the distribution of<br />
fresh-water, salt-water heads in coastal areas to the hydrostatic balance between the<br />
two fluid densities. Inasmuch as the average specific gravity of sea water is about 1.025<br />
and fresh water about 1.0, they reasoned that the fresh water and the salt water were in<br />
equilibrium and that a vertical column of salt water 40 feet (12.2 m) high balanced a<br />
longer column of fresh water 41 feet (12.5 m) high, giving rise to the general 40 to 1 rule<br />
where one foot (0.3 m) of fresh water head above sea level in an unconfined aquifer wil<br />
balance a column of fresh water 40 feet (12.2 m) deep before the contact between the<br />
fresh and salt water is reached.<br />
The Ghyben-Herzberg principal assumed a steady-state balance between fresh water<br />
and salt water in the coastal aquifers (fig. 6). However, it has been demonstrated<br />
(Hubbert, 1940; Senio, 1951; Todd, 1953) that a state of dynamic equilibrium must be<br />
in effect at the interface else there would be no way for the fresh water to discharge<br />
into the sea. Cooper (1959) describes a movement of salt water from the floor of the sea<br />
into the zone of diffusion and back to the sea, the head losses which accompany the<br />
landward flow tending to lessen the extent to which the salt water occupies the aquifer.<br />
The motivating force for this mechanism is attributed to dispersion - a convective<br />
process involving the mechanical transfer of one fluid into the region of another plus<br />
the effects of molecular diffusion. This may account for the discrepancy, noted in<br />
several areas, between the observed depth to the salt-water interface with that computed<br />
by the static-balance principal (Ghyben-Herzberg). Nonetheless, this principal provides<br />
a fairly accurate approximation of the depth to the interface.<br />
Salt-water encroachment in limestone (and sand) aquifers of Tertiary age has taken<br />
place throughout Tertiary and Quaternary time and is a current phenomenonalong the<br />
South Carolina coast. Unflushed sea water intruded contemporaneously with sedimen-<br />
tation (or at any successive time) and is considered reponsible for the more inland<br />
occurrence of high-chloride water, extending 30 to 50 miles from the coast in the Loris,<br />
Charleston,and Beaufort areas. These areas are associated with negative structural ele-<br />
ments which resulted in the formation of basins in which younger Tertiary and Quater-<br />
nary sediments were deposited.<br />
The most serious effect of salt-water encroachment on potable waters is that<br />
affecting the limestone aquifers of Tertiary age in the area between Charleston and<br />
Beaufort, on the southern part of the South Carolina coast. In the vicinity of Parris<br />
45 1
Island, Beaufort County, salt-water enters the Eocene limestone in the surrounding<br />
estuaries when the piezometric head is reduced to sea level or below. In the lower part<br />
of the aquifer the brackish to salty water is attributed to the presence of geologically<br />
older sea water which at the present time remains unflushed from the sediments.<br />
N<br />
t<br />
J<br />
Scale<br />
IO O 10 20 30 Miles<br />
C I i<br />
Fig. 6 - Areal distribution of maximum observed, or interpolated, chloride concen-<br />
trations in aquifers of the post-paleozoic sediments in coastal South Carolina.<br />
On Parris Island proper, the upper part of the limestone (first 50 feet-15.2 m)<br />
contains water with a chloride concentration slightly in excess of 2,000 ppm. However,<br />
a short distance to the south, on Hilton Head Island, waters of similar salinity do not<br />
occur above a depth of about 600 feet (183 m). On Port Royal Island, Ladies Island,<br />
and St. Helena Island fresh water can be obtained at depths of about 100 feet (31 m),<br />
although in these areas heavy withdrawals from wells located in close proximity to the<br />
surrounding estuaries are likely to induce salt-water encroachment. So far as is know,<br />
no additional fresh water occurs in the stratigraphic section at Parris Island until<br />
depths of about 2,600 feet (793 m) to 2,800 feet (853 m) are reached, where waters from<br />
the base of strata of Austin age and from the top of the Tuscaloosa Formation (fig. 3)<br />
contain chloride ranging from 15 to 70 ppm. Beyond this depth brackish to salty water<br />
452
is again present in the sands to a depth of 3,454 feet (1,065 m), the greatest depth<br />
penetrated by this or any other well in the State. The highest chloride Concentration of<br />
any ground water in this area, 8,500 ppm, was analyzed from a water sample obtained<br />
from the middle Eocene sand at 900 feet (274 m).<br />
REFERENCES<br />
COOPER, H. H., Jr., 1959. A hypothesis concerning the dynamic balance of fresh water<br />
and salt water in a coastal aquifer. Jour. of Geophys. Research, vol. 64, no. 4, pp.<br />
461-467.<br />
COUNTS, H. B., and DONSKY, E., 1963. Salt-water encroachment, geology and groundwater<br />
resources of Savannah Area, Georgia and South Carolina. 97 p. (U. S. Geological<br />
Survey Water-Supply Paper 161 1).<br />
GHYBEN, B., 1889. Nota in verband met de voorgenomen put boring nabij Amsterdam.<br />
Koninski. Inst. Ing. Tijdschr., 1888-89, The Hague, pp. 8-22.<br />
HERZBERG, B., 1901. Die Wasserversorgung einiger Nordseebader [The water supply<br />
on varts of the North Sea coastl. Jour. Gasbeleuchtzmn - und Wasserversorgung,<br />
Munich, vol. 44, pp. 815-19, 842-44.<br />
HUBBERT, M.K., 1940. The theory of ground-water motion. Jour. Geology, vol. 48,<br />
no. 8, pp. 785-944.<br />
JACOB, C.E., 1940. On the ñow of water in an elastic artesian aquifer. Am. Geophys.<br />
Union Trans., July, pp. 574-586.<br />
MCCOLLUM, M. J., and COUNTS, H.B., 1964. Relation of salt-wafer encroachment to<br />
the major aquifer zones Sauannah area, Georgia and South Carolina. 26 p. (U.S.<br />
Geological Survey Water-Supply Paper 1613-D).<br />
RICHARDS, H.G., and STRALEY, H. W., III, 1953. Geophysical and stratigraphic<br />
investigations on the Atlantic Coastal Piain. Short Contributions to the Geology,<br />
Geography, and Archaelogy of Georgia, Ga. Dept. of Mines. Mining, and Geology,<br />
Bull. 60, pp. 101-112.<br />
SENIO, K. 1951. On the ground water near the seashore. Union géod. géophys. Internat.,<br />
Assoc. Interaat. d’Hydrologie Sci. Assemblée gén. Bruxelles [hiternat. Union Geodesy<br />
and Geophysics, Internat. Assoc. Sci. Hydrology, Brussels], vol. 2, pp. 175-177.<br />
S~PLE, G.E., 1959. Guidebook for the South Carolina Coastal Plain field trip of the<br />
Carolina Geological Society, Nouember 16-17. (Div. of Geol., S. C. State Devel. Bd.,<br />
Bull. 24) 27 p.<br />
STRINGFIELD, V.T., and LEGRAND, H. E., 1964. Hydrology of limestone terranes in the<br />
Coastal Plain of the Southeastern States. 54 p. (U.S. Geological Survey Open<br />
File Report).<br />
SWINNERTON, A. C., 1949. Hydrology of limestone terranes. Hydrology, vol. 9, chap. 14<br />
(Physics of the Earth, New York, Dover Pub., Inc.).<br />
THEIS, C.V., 1935. The relation between the lowering of the piezometric surface and<br />
the rate and duration of discharge of a well using ground-water storage. Am.<br />
Geophys. Union Trans., vol. 16, pp. 519-524.<br />
TODD, D.K., 1953. Sea-water intrusion in coastal aquifers. Am. Geophys. Union Trans.,<br />
vol. 34, no. 5, pp. 749-754.<br />
WARREN, M. A., 1944. Artesian water in southeastern Georgia, with special reference to<br />
the Coastal area. (Ga. Geol. Survey Bull. 49) i04 p.<br />
WEEKS, L.G., 1952. Factors of sedimentary basin development that control oil occurrence.<br />
Am. Assoc. Pet. Geol. Bull., vol. 36, no. 11, pp. 2071-2124.<br />
-, 1959. Geologic architecture of the Circum-Pacific. Am. Assoc. Pet. Geol. Bull..<br />
vol. 43, no. 2, pp. 350-380.<br />
453
CONTRIBUTION TO THE STUDY OF THE INVASION<br />
OF AQUIFERS BY SEAWA’JXR<br />
SUMMARY<br />
R. HAZAN<br />
(Morocco)<br />
In the Rabat region-the Souissi-there are pumped wells in great number. The<br />
groundwater recharge is not commensurate with the withdrawals and an investigation<br />
was therefore undertaken with a view to finding adequate remedies.<br />
As the investigation sought to particularize the phenomena occurring when seawater<br />
invades an aquifer, it is of general interest and the procedure can be adapted to other<br />
structures.<br />
The hydrostatic pressure and force transmission phenomena determining salinity<br />
in salt shifts have been “pinned down” introducing a little more clarity into these com-<br />
plex phenomena.<br />
Lastly, a limit figure for withdrawals, arrived at from the results of this study,<br />
regulates the future exploitation of groundwater in a coastal zone of such importance<br />
for the capital.<br />
RÉSUMé<br />
CONTRIBUTION A L’fiTUDE DE L’INVASION<br />
DE NAPPES PAR LES EAUX MARINES<br />
R. HAZAN<br />
(Maroc)<br />
La région de Rabat - le Souissi - est l’objet de pompages nombreux; or l’ali-<br />
mentation de la nappe n’estpas proportionnée aux prélèvements. Aussiune étude a-t-elle<br />
été entreprise pour que des solutions adéquates soient trouvées.<br />
Cette étude a essayé de serrer de près les phénomènes intervenant lors d’invasions<br />
marines dans une nappe. Elle a donc un intérêt général, et peut être adaptée à d’autres<br />
structures.<br />
Les phénomènes hydrostatiques de transmission de pressions et de charges de<br />
N mouvements ) de salure ont été mis en relief qui amènent un peu de clarté dans ces<br />
phénomènes complexes.<br />
Enfin une mesure de limitation de pompages déduite des résultats de cette étude,<br />
ñxe l’exploitation future de cette zone côtière si importante pour la capitale.<br />
454<br />
Cette étude a été publiée dans In revue G Terres et Eaux ».
RESUME<br />
DETERMINATION DES NlVEAUX PHRÉATIQUES<br />
DES EAUX DOUCES DANS UN MASSIF CALCAIRE<br />
DE LA
Le programme de travaux que nous avons fixé pour l’étude a été le suivant :<br />
(I) L’exploration de la zone sous-marine de la côte pour signaler les émergences d’eau<br />
douce sous le niveau de la mer;<br />
(2) L’étude générale de la géologie en surface de la zone;<br />
(3) La reconnaissance à l’aide de sondages de la structure géologique du massif montagneux<br />
et d’une partie de la plaine qui l’entoure;<br />
(4) La mesure et l’observation systématique des niveaux phréatiques à l’intérieur des<br />
sondages exécutés ainsi que dans les puits et sources de la région, préalablement<br />
inventoriés;<br />
(5) L’analyse chimique des eaux souterraines découvertes, avec détermination de leur<br />
degré de salinité et de leur variation en fonction de la profondeur;<br />
(6) La détermination des endroits les plus favorables pour de nouveaux captages et le<br />
procédé pour les mettre en état d’exploitation.<br />
La première partie de ces travaux, c’est-à-dire l’étude sous-marine de la zone côtière<br />
s’étendant de I’Estartit jusqu’à La Escala, à la province de Gerona, a été exécutée par<br />
des équipes d’hommes-grenouilles pendant les mois de juillet à octobre 1963. On a<br />
utilisé des réserves autonomes d’air comprimé de 4.800 litres à 150 atmosphères, des<br />
régulateurs V-2, un compresseur de 20 m3 heure de capacité, des vêtements de néophrène,<br />
un poste complet d’éclairage sous-marin ainsi que des équipes photographiques et<br />
cinématographiques sous-marines.<br />
L’expédition partait de la ville de La Escala et les équipes étaient transportées sur<br />
les lieux de travail par un petit bateau à moteur de 8 m de long, piloté par un des<br />
pêcheurs les plus experts de la région.<br />
Comme nous l’avons déjà dit, c’est la première fois qu’un tel travail est exécuté,<br />
aussi fûmes-nous privés de toute référence antérieure qui aurait pu nous guider: nous<br />
n’avons pas trouvé, en effet, de renseignements sur un cas semblable, et nous avons<br />
du employer des procédés non expérimentés.<br />
Les premières conclusions que nous avons tirées de cette investigation sous-marine<br />
ont été que les signes externes de l’existence des émergences sous-marines d’eau douce<br />
sont, entre autres, les suivants :<br />
(1) L’absence de pêche, par ailleurs très abondante dans toute cette zone;<br />
(2) L’absence de la flore marine normale aux environs des émergences d’eau douce et,<br />
par contre, la présence d’une algue spéciale appelée dans la région ( laitue de la mer H<br />
(N ulva n) ;<br />
(3) Une réverbération spéciale dans l’eau, identique à celle produite dans l’air par les<br />
vapeurs de l’essence quand on remplit le réservoir d’une voiture;<br />
(4) Une remarquable différence de la température, avec des courants d’eau froide jaillissant<br />
de points localisés au fond de la mer;<br />
(5) En beaucoup d’émergences localisées, l’arrivée de l’eau douce se présente sous forme<br />
ascendanteet lecourant qui s’établitpeutse détecter enposant doucement au fond dela<br />
mer des poignées de paille de luzerne mouillée, qui sont aussitót poussées vers le<br />
haut par le courant de l’eau douce émergente. Ce phénomène est visible très nettement<br />
dans le film.<br />
La deuxième conséquence de cette investigation a été la localisation de plusieurs<br />
points d’émergence sous-marine d’eau douce situés aux endroits signalés dans la carte<br />
ci-jointe. (Voir dans la légende de la carte l’indication : “ Manantiales de aqua dulca<br />
en el mar ”).<br />
Le résultat de l’étude géologique de surface a été la délimitation des différentes<br />
couches géologiques que nous représentons sur la même carte et la synthèse géologique<br />
de la région que nous verrons par la suite.<br />
Le massif calcaire de Montgri, qui est l’objet de la présente étude se trouve parmi<br />
La Escala, Torroella de Montgri et 1’Estartit dans l’extrême nord-est de la péninsule<br />
456
Ibérique, baigné à l’est par la Méditerranée, et émergeant au milieu des plaines allu-<br />
viales du Haut et Bas Ampurdan. I1 est limité par les cours d’eau du Ter au sud et du<br />
Fluviá au nord et s’élève brusquement entre ces plaines jusqu’à une hauteur qui dépasse<br />
légèrement 300 mètres.<br />
Du point de vue topographique, il présente surla mer, de I’Estartitjusqu’à LaEscala,<br />
une ligne de crête très escarpée avec des pans verticaux montant jusqu’à 100 mètres de<br />
hauteur, et s’enfonçant vers le fond de la mer avec la même verticalité. Du côté sud le<br />
versant moyen est aussi très prononcé, quoique sans présenter ces falaises continues<br />
et verticales, à la différence des fronts nord et ouest dont les pentes sont beaucoup<br />
plus douces et à l’exception de collines qui dépassent à peine 100 mètres, ils forment une<br />
plaine calcaire d’une hauteur moyenne de 130 mètres, envahie pour la plupart par les<br />
dunes provenant du Golfe de Rosas, aujourd’hui presque complètement fixées par<br />
d’importants travaux de reboisement.<br />
Son extrémité sud-est, quioque fracturée, s’étend en mer où les émergences donnent<br />
lieu aux îles Medas qui ne sont qu’une série de petits îlots formés par des fragments<br />
du même massif.<br />
Sauf sur la ligne de côte qui, comme nous venons de l’indiquer, plonge presque à<br />
pic dans la mer, ce massif se trouve entouré par des formations alluviales déposées par<br />
les fleuves Ter et Fluviá, qui sont cependant détachées de la zone montagneuse propre-<br />
ment dite, de nature calcaire, par une étroite bande de reliefs doux, formés principale-<br />
ment par du grès et des conglomérats de l’Éocène inférieur.<br />
Dans l’ensemble du massif, comme nous le signalons sur la carte géologique citée,<br />
nous trouvons en dehors de cet Éocène des terrains triasiques, jurassiques et crétacés<br />
Les terrains triasiques affleurent dans cette zone sous la forme de petites taches,<br />
dont l’une est coupée au nord de Bellcaire par la route qui va de ce village à celui<br />
d'Albans; dans cette coupe on peut voir sa constitution, qui est formée par des marnes<br />
et du gypse avec diverses colorations OU abondent les {(jacintos de compostela H (petits<br />
cristaux bipyramidaux de quartz, généralement rouge foncé, caractéristiques du Keuper).<br />
Ep raison de sa faible étendue (sa plus grande dimension a à peine 100 mètres) on peut<br />
à peine le cartographier, mais on peut du moins signaler l’existence de grès jaunâtre et<br />
de conglomérats polygénétiques de I’Eocène inférieur qui se trouvent en dessous, enipri-<br />
sonnés comme des morceaux dégagés du socle sur lequel se serait glissée une écaille de<br />
nappe de charriage.<br />
Cet affleurement triasique, correspondant au Keuper, se trouve recouvert par une<br />
masse de conglomérats calcaires très grossiers en relation avec l’Éocène continental<br />
supérieur.<br />
Un autre affleurement triasique formé aussi par des marnes gypseuses avec des<br />
(< jacintos de compostela H de différentes couleurs, et par conséquent appartenant aussi<br />
au Keuper, se trouve à la Pointe Guixeras, dans l’Estartit, s’appuyant aussi sur 1’Eocène<br />
inférieur, mais ici en dessous des séries très puissantes des calcaires liasique-crétacés<br />
concordantes.<br />
Finalement, dans les îles Meda Grande et Chica, se trouve aussi le Keuper avec<br />
les mêmes caractéristiques qu’à Pointe Guixeras.<br />
A l’île Meda Grande et à l’île Meda Chica, de même qu’à la Pointe Guixeras, prk-<br />
ciskrrieni sur ces formations gypseuses du Keuper, il y a des horizons calcaires dolomi-<br />
tiques noires très fétides suivies par des autres plus claires, un peu jaunâtres, quelque-<br />
fois compactes, quelquefois caverneuses, qui, avec une autre série calcaire grisâtre plus<br />
compacte, quoique fossilifère, peuvent être classées d’après Solé Sabaris et San Miguel<br />
de la Cámara dans le Lias inférieur.<br />
Sur ces dernières formations s’étendent, avec une grande puissance et une grande<br />
extension, les formations calcaires crétacées du Cénomanien, qui forment la presque<br />
totalité du massif.<br />
Ces calcaires s’appuient tantbt sur les niveaux liasiques, tantôt, par contre, direc-<br />
457
1<br />
LEY EN DA<br />
HOLOCENO<br />
AIuviaI l j ] Arensr<br />
Diluvial [<br />
! I Arenastarciilas<br />
PLE ISTOCE NO<br />
EOCENO<br />
ñartoniense bx$J Conglomerados. arenisca, arcilla<br />
TRIASICO<br />
Calizas grisas y margas-<br />
Dolomias y carnidos<br />
Keuper Arcillas y marga y-<br />
g,b,p~' Corri rn ienlo<br />
b,b' ,........ Contacto normal<br />
a I a I a I a Sincllnai<br />
-<br />
-fl Falla vilte.<br />
-n-tt+~-<br />
-<br />
Id deducida<br />
Mananiides d. agua dulce end mar<br />
" " "<br />
IlIIIII I Zonas duaosas s.<br />
Manantialsu a@ agua dulce an tiern<br />
0 Pozos do agua dulce<br />
Q Sondeos rializadOl<br />
CABO DE u m e w<br />
Punta de Gukrra OLI Higallo1
tement sur l’fiocène. I1 en résulte qu’il est souvent pratiquement impossible de distinguer<br />
d’une façon relativement concrète ces formations liasiques de celles du crétacé, en par-<br />
ticulier à cause de l’absence de fossiles caractéristiques; cependant, d’après les auteurs<br />
nommés ci-dessus, on peut localiser leur limite sous une bande de calcaires granuleux<br />
brun foncé qui, à certains endroits, apparaissent sur les calcaires fossilifères du Lias et<br />
parfois sur i’Eocène.<br />
Les terrains de l’gocene renferment principalement des bancs de conglomérats poly-<br />
génétiques plus ou moins foncés, souvent de teintes rougeâtres, alternant avec des nappes<br />
d’argile sableuse rougeâtre et même avec du grès.<br />
Son pendage qui est nord-ouest et ouest-sud-ouest se trouve toujours en nette<br />
discordance avec la nappe du crétacé supérieur.<br />
Dans tout cet ensemble, le terrain dominant dans tout le massif correspond à la<br />
masse calcairo-crétacée superposée aux séries liasiques de même nature et aux îorma-<br />
tions gypseuses du Keuper, qui disparaissent souvent par laminage, s’appuient anor-<br />
malement avec une nette discordance sur l’gocène, et forment une grande écaille de<br />
charriage provenant du nord, produite pendant l’orogénie alpine, probablement lors de<br />
sa phase pyrhéenne.<br />
En résumé, tout le massif de Montgri est constitué dans sa plus grande partie par<br />
une puissante série calcaire provenant du nord, qui a formé une nappe de charriage sur<br />
l’gocène inférieur sous-jacent et, par conséquent, a été amenée par diverses failles et<br />
plans de rupture à un état de tectonisatioa très accusé.<br />
Tout ce calcaire est affecté en plus par un haut degré de karsticité constaté lors des<br />
sondages exécutés et que laisse prévoir l’aspect externe du front de la falaise et plus<br />
encore sa prolongation sous le niveau de la mer. Les photographies de la zone émergée,<br />
et plus encore de la zone submergée, qui présentent très souvent de grandes cavernes<br />
et cavités dont certaines pénètrent profondément vers l’intérieur du massif, en sont la<br />
preuve éloquente.<br />
Toutefois, l’existence des niveaux marneux qui, en quelques points isolés de son<br />
côté sud, affleurent en dessous de ce massif calcaire-crétacé, permettait d’envisager à<br />
priori l’existence d’un niveau phréatique captif au-dessus du niveau de la mer, ou du<br />
moins tout près de lui, et même de quelques courants d’eau douce ou des poches plus<br />
ou moins suspendues à l’intérieur.<br />
Après ces études de localisations, nous avons effectué toute une série de sondages<br />
placés sur des profils transversaux au massif, en partant de la côte à proximité des sources<br />
sous-marines d’eau douce les plus importantes et en faisant l’analyse des carottes<br />
obtenues et l’observation et la mesure systématique du niveau phréatique correspondant.<br />
Les niveaux phréatiques et leurs variations de tous les puits inventoriés étaient notés<br />
sur des fiches ad hoc.<br />
D’après les informations obtenues à partir des sondages, on constata l’existence de<br />
fentes et cavités dans la masse calcaire, ce qui confirmait son caractère karstique; aussi<br />
essaya-t-on de rechercher les cours souterrains ou les poches d’eau suspendues à des<br />
niveaux supérieurs; cependant le seul résultat positif a été la délimitation du niveau supé-<br />
rieur phréatique existant, constitué par une lentille d’eau douce flottant sur les eaux<br />
saumâtres et s’infiltrant à l’intérieur du massif sous le niveau de la mer en raison des<br />
formations étanches sous-jacentes du Keuper, qui forment la base inférieure de l’écaille<br />
de la nappe de charriage indiquée à grande profondeur. (Dans la zone nord du massif,<br />
nous considérons qu’elle doit être au moins de l’ordre de 160 à 180 mètres). Ces for-<br />
mations étanches forment un front de calcaire se prolongeant vers la falaise c6tiere en<br />
contact direct avec les eaux de la mer et pénétrant vers l’intérieur du massif où elles<br />
restent sous le manteau d’eau douce du massif.<br />
I1 en résulte que les seules possibilités d’eau douce existant à l’intérieur du massif<br />
de Montgri proviennent soit des pluies qui peuvent tomber directement sur son implu-<br />
vium et celles qui peuvent s’infiltrer éventuellement par quelques points très localisés<br />
460
de son front nord-ouest, mais placées déjà à des cotes très basses, soit des eaux phréa-<br />
tiques des plaines alluvio-fluviales qui l’entourent par leurs flancs (voir carte géologique<br />
de la figure 2).<br />
Après la fin des premiers sondages, des échantillons d’eau ont été prélevés à diverses<br />
profondeurs, à des moments différents, pour déterminer leur degré de salinité et obtenir<br />
ainsi l’épaisseur moyenne de la partie utile du mateau phréatique dontla teneur totale<br />
en sels est inférieure à 2 grammes/litre.<br />
Pour déterminer la position de cette limite, variable à chaque sondage et même sui-<br />
vant la saison de l’année, nous avons tracé sur la verticale de chaque sondage, placé à<br />
leur correspondant profil, les courbes de la salinité portant les valeurs moyennes des<br />
mesures obtenues en chaque série des échantillons à la profondeur correspondante.<br />
Pour la limite de salinité maximum admise, nous traçons la limite inférieure et supérieure<br />
de l’aquifère exploitable (fig. 2).<br />
Finalement, après la reconnaissance des limites de la zone d’eau exploitable et<br />
compte tenu des fluctuations des niveaux observés, nous avonsñxé deuxpoints où ont<br />
été ouverts des puits avec des résultats positifs.<br />
Le fond de ces puits (actuellement en cours de construction très avancée) sera<br />
imperméabilisé avec un bon revêtement de béton étanche sur les deux derniers mètres; à<br />
partir de cette cote on a commencé à ouvrir deux galeries en chaque sondage, suivant<br />
une direction presque horizontale, avec une légère inclinaison vers le puits, comme on le<br />
voit au schéma de la figure 2.<br />
L’eau drainée par ces galeries est recueillie dans le fond imperméabilisé des puits<br />
d’où part l’installation de pompage de sorte que par ce procédé (déjà connu), la succion<br />
sur les eaux phréatiques arrivant au puits s’effectue dans une direction descendante<br />
avec le minimum de risque de rompre l’état d’équilibre existant parmi les nappes<br />
de l’aquifère de différentes salinités.<br />
Comme conclusion de cette étude, indiquons que les puits ont été forés mais qu’il<br />
reste à réaliser l’installation prévue (en raison de l’urgence de l’approvisionnement de<br />
la région pendant l’été); d’importants débits ont été obtenus permettant de pallier au<br />
manque d’eau dans toute cette région qui est une des plus visitées par les touristes<br />
nationaux et étrangers pendant l’été.<br />
462
1.5<br />
Recharge naturelle et artificielle dans les terrains karstiques<br />
Natural and artificial Recharge in Karstic Regions
ABSTRACT<br />
ARTIFICIAL RECHARGE TO<br />
THE EDWAKDS LIMESTONE AQUIFER IN<br />
SOUTH TEXAS<br />
Melvin G. GREEN*<br />
Geologist, U. S. Army Corps of Engineers, Ft. Worth, Texas<br />
The Edwards limestone aquifer is located in south central Texas along a portion<br />
of three major river basins. Ground-water divides, outcrops, and a highly mineralized<br />
water limit the portion of the aquifer under study to a length of about 175 miles and<br />
a width of 5 to 40 miles. The underground reservoir is the area’s prime natural water<br />
resource, providing the only existing water supply to an estimated 8$0,.000 people.<br />
Recharge to the aquifer is furnished by the streams which have their inception in<br />
the hill country to the north and flow southerly across the outcrop of the Edwards<br />
limestone in the Balcones fault zone. The aquifer recharge averages 423,200 acre-feet<br />
annually, but is relieved by discharge from springs located down gradient making the<br />
aquifer comparable to a conduit with open ends. The balance between recharge and<br />
discharge has been disrupted by some 4,000 wells which have been drilled since the<br />
late 1800’s. This resulting imbalance has placed the aquifer on a depletion schedule<br />
and, unless additional recharge is supplied, the reservoir wil soon be unable to meet<br />
its water demands.<br />
Because of this critical condition the Fort Worth District Corps of Engineers, in<br />
cooperation with proper state agencies, was authorized to investigate the feasibility of<br />
providing recharge to the aquifer as part of plans for flood control and water conser-<br />
vation. The study consisted of: (1) a survey of available water for recharge and the<br />
effects of evaporation in surface reservoirs ; (2) the determination of maximum infil-<br />
tration rates along the streams; (3) a further development of the hydrology and geology<br />
of the Edwards limestone; (4) utilization of a radioactive tracer to study the ground-<br />
water movement; (5) fluctuation of the “bad-water” line; (6),methods to control the<br />
springñow; (7) the feasibility of reducing leakage from an existing reservoir built in the<br />
Balcones fault zone; and (8) geologic investigation of ten dam sites.<br />
The proposed plan of improvement resulting from the study would provide for the<br />
construction of five dams. Three dams, to be constructed primarily for recharge, flood<br />
control, and recreation, will provide an additional 63,900 acre-feet of water annually<br />
for recharge. In these reservoirs the excess runoff, i.e., that which otherwise would<br />
escape across the recharge areas in the streambeds, wil be stored and released at the<br />
maximum infiltration capacity of the rock. Two water conservation dams, designed to<br />
provide a supplemental surface water supply for the aquifer, wil provide an additional<br />
89,100 acre-feet annually. The proposed pian of improvement wil meet all of the water<br />
demands in the area to approximately the year 2000.<br />
-<br />
Réalimentation artificielle de raquijière calcaire d’Edwards dans le sud du Texas<br />
L’aquifère calcaire d’Edwards se trouve dans le sud de la partie centrale du Texas.<br />
11 longe une partie de trois grands bassins hydrographiques. Des lignes de partage des<br />
eaux souterraines, des affleurements et une eau fortement minéralisée limitent la section<br />
étudiée à une zone longue d’environ 265 km et large de 8 à 60 km. Ce réservoir soúter-<br />
rain constitue la principale ressource naturelle en eau de cette région, et même la seule<br />
source d’alimentation en eau d’une population d’environ 850.000 personnes.<br />
L’alimentation de cet aquifère est assurée par des cours d’eau qui prennent nais-<br />
sance dans la région accidentée du nord et qui se dirigent vers le sud, à travers l’affleu-<br />
rement calcaire d’Edwards, dans la zone faillée de Balcones. Ces rivières apportent<br />
en moyenne, annuellement, 508 millions de m3 par acre (0,40 hectare); mais des sources<br />
situées à une altitude inférieure réduisent ce volume d’eau, ce qui fait ressembler l’aqui-<br />
fère à une conduite ouverte aux deux bouts. L’équilibre établi entre les apports et les<br />
pertes a été rompu par le forage de quelque 4.000 puits depuis la fin du siècle dernier.<br />
Le déséquilibre qui en est résulté tend à épuiser la nappe: à moins qu’un apport d’eau<br />
supplémentaire ne lui soit fourni, le réservoir sera bientôt incapable de répondre à la<br />
demande actuelle.<br />
465
En raison de cette situation critique, le corps des ingénieurs du district de Fort<br />
Worth, en liaison avec les organismes d’État compétents, a été autorisé à rechercher<br />
la possibilité d’assurer la réalimentation de la nappe dans le cadre des plans de lutte<br />
contre les crues et de conservation des eaux. Les études effectuées ont porté sur les<br />
points suivants:<br />
1) Recherche des eaux pouvant étre utilisées pour la réalimentation et étude des effets<br />
de l’évaporation dans le cas des réservoirs de surface;<br />
2) Détermination du taux maximum d’infiltration le long des cours d’eau;<br />
3) Etude hydrologique et géologique plus détaillée du calcaire d’Edwards ;<br />
4) Emploi de traceurs radio-actifs pour suivre le cheminement de l’eau sous terre;<br />
5) Fluctuations de la limite des eaux inutilisables (bad water);<br />
6) Méthodes de régulation de l’écoulement des sources;<br />
7) Possibilité de réduire les fuites d’un réservoir déjà construit dans la zone faillée de<br />
Balcones;<br />
8) Etude géologique de dix emplacements de barrages.<br />
Le plan d’amélioration proposé à la suite de ces études prévoit la construction de<br />
cinq barrages. Trois de ces barrages, construits principalement pour la réalimentation<br />
de la nappe, la lutte contre les inondations, ainsi que les activités de loisirs fourniront<br />
chaque année 21 la nappe un supplément de 77 millions de m3 d’eau par acre (0,40 hec-<br />
tare). Dans ces réservoirs, l’excédent du ruissellement (c’est-à-dire la quantité d’eau<br />
qui, autrement, traverserait en pure perte la zone d’alimentation pour rejoindre les<br />
cours d’eau) sera emmagasinée pour s’écouler au taux maximum d’infiltration dans la<br />
roche. Deux barrages construits pour la conservation de l’eau et conçus pour fournir<br />
un apport supplémentaire d’eau superficielle à l’aquifère assureront un supplément<br />
annuel de 110 millions de m3 par acre (0,40 hectare). Ce plan d’amélioration permettra<br />
de satisfaire toutes les demandes en eau de la région jusqu’à l’année 2000 environ.<br />
LOCATION AND DESCRIPTION<br />
The Edwards limestone aquifer is one of the most important underground reservoirs<br />
in the southwestern part of the United States, providing the only existing water supply<br />
to many farms and ranches, five large military installations, and 17 cities and communi-<br />
ties. San Antonio, the third largest city in the State of Texas, with an estimated popu-<br />
lation of about 700,000 people, is the largest city in the United States which obtains its<br />
entire water supply from underground sources.<br />
The artesian aquifer extends from west central Texas, near the Mexican border,<br />
eastward and northeastward to Austin in central Texas, a distance of about 250 miles.<br />
Groundwater divides at Brackettville on the west and Kyle on the northeast control<br />
the waterflow in the “San Antonio area”, limiting the portion of the underground reser-<br />
voir with which this paper is concerned to a length of approximately 175 miles. The<br />
width, which varies from about 5 to 40 miles, is controlled by the outcrop of the Ed-<br />
wards limestone to the north along the foot of the Edwards Plateau and mineralized<br />
water downdip to the south and southeast. This southern boundary, a line known as<br />
the “bad water” line, divides the water in the underground reservoir into that with less<br />
than 1,OOO ppm (parts per million) dissolved solids and that with more than 1,000 ppm.<br />
The cause of the poor quality water has been attributed to severely reduced permeabi-<br />
lities and poor circulation in the aquifer.<br />
The area lies within two physiographic provinces, the Edwards Plateau and the<br />
West Gulf Coastal Plain, which are separated by a variable width zone of faulting known<br />
as the Balcones fault zone. The area to the north, the Edwards Plateau, features a young<br />
plateau with a mature margin of moderate to strong relief. Principal streams within the<br />
three major river basins which drain the area have cut narrow canyons into the Lower<br />
Cretaceous limestone strata which comprise the plateau. The West Gulf Coastal Plain,<br />
in contrast to the rugged topography to the north, is flat and featureless except for<br />
occasional low hills formed by shallow intrusive plugs.<br />
The annual precipitation over the area is 27.8 inches, varying from 34 inches in the<br />
eastern part to 22 inches in the western part. Temperature extremes vary from 114<br />
degrees to minus 7 degrees, with a mean of about 68 degrees Fahrenheit.<br />
466
GEOLOGY<br />
Three formations, considered as a single hydrologic unit and referred to as the<br />
Edwards and associated limestones, make up the aquifer. They are, from oldest to<br />
youngest, the Comanche Peak, Edwards, and Georgetown limestones, all a part of the<br />
Comanche series of Lower Cretaceous age. Together they average between 350 and<br />
500 feet in thickness in the artesian portion of the underground reservoir, but thicken<br />
considerably downdip toward the Gulf Coast. The hard, dense, light grey limestone<br />
rock is highly solutioned, as evidenced by the large number of caves of considerable<br />
vertical and horizontal extent found throughout the area. The Grayson shale, a blue-<br />
grey clay and clayey shale, overlies the Edwards limestone aquifer, forming the upper<br />
confining bed. The Glen Rose limestone, an argillaceous limestone, shale and dolomite,<br />
underlies the aquifer and forms the lower confining bed.<br />
The Balcones fault zone, a variable width zone of moderate to intense faulting fea-<br />
turing normal or gravity-type faults downthrown to the south or south east, is the<br />
dominant structural feature in the area. The zone extends east-west across the State,<br />
forming a prominent escarpment at the foot of the Edwards Plateau. Although dis-<br />
placements vary greatly, single faults within the system exhibit displacements up to<br />
700 feet and are traceable for about 50 miles. The maximum displacement across the<br />
zone, about 1,500 feet, occurs in Coma1 County, north of San Antonio. The faulting,<br />
significant in that it has broken and fractured the competent Edwards limestone, pro-<br />
vides ideal avenues for circulating groundwater and accompanying solution activity.<br />
Figure 3 shows generalized geologic sections along and normal to the centre line of the<br />
underground reservoir.<br />
The strata in the Edwards Plateau dip south and southeasterly toward the Gulf of<br />
Mexico at a rate of IO to 20 feet per mile. South of the plateau in the Coastal Plain the<br />
average dip steepens to about 100 to 150 feet per mile.<br />
RECHARGE<br />
Recharge to the Edwards limestone aquifer occurs as rainfall on the Edwards Pla-<br />
teau filters down through the Edwards and associated limestones to the top of the Glen<br />
Rose limestone. The water then moves by gravity flow laterally through the limestone<br />
to reappear as springflow in the valleys that have been formed by the erosive action of<br />
the streams. These springs form the base flow of the streams that drain the area. Because<br />
of the impermeable nature of the Glen Rose limestone, very little water is lost until the<br />
streams begin their flow across the Edwards limestone in the Balcones fault zone. Along<br />
this zone the streams lose virtually all their base flow and much of their flood flow to the<br />
Edwards limestone. Once the water enters the artesian aquifer, the normal southerly<br />
flow is blocked by a combination of major faults and reduced permeability, causing<br />
the water to flow in an easterly direction, generally along the lines of major faulting,<br />
toward San Antonio.<br />
Streams that flow through the area and contribute to the aquifer recharge are in the<br />
Nueces, San Antonio, and Guadelupe River Basins. Eight streams in the Nueces River<br />
Basin, with a drainage area of 3,112 square miles, contributed an average of 231,500<br />
acre-feet of recharge annually for the period 1935-1956. (This 1935-1956 period was<br />
used throughout the study because it represents one complete cycle from a period of<br />
high runoff through a period of critical drought). Four streams in the San Antonio<br />
River Basin, with 1,158 squaremiles of drainage area, contributed an average of 145,800<br />
acre-feet of recharge water annually. The three streams in the Guadalupe River Basin<br />
drain an area of 2,114 square miles and, although they have the highest average annual<br />
water resources above the Balcones fault zone, 374,400 acre-feet, they contributed only<br />
467
A WATERSHED BOUNDARY<br />
LOWaRDS UNDERGHOUNO RESERVOIR<br />
EXISTING RESERW!R<br />
LO CA T ION<br />
SCALE IN MILES<br />
FIGURE I<br />
PWWSLD MULTIPLL-P+WOSE RESERMIR<br />
- EXISTING 5 C 5 DIM II IULI 19641<br />
- AUTHORIZED 5 C 5 DAM 5 0 5- 1 0<br />
t3-ci
CORPS OF ENGINEERS<br />
LOCATION MAP<br />
FOR SECTIONS SEE FIGURI
HAYS\ I
45,900 acre-feet of recharge water to the aquifer. The prir.cipal river in the basin, the<br />
Guadalupe, does not contribute. Combined, the streams in the three river basins drain<br />
an area of 6,384 square miles, have estimated total average annual resources of 940,700<br />
acrefeet upstream of the southern edge of the Edwards outcrop, and contribute an esti-<br />
mated 423,200 acre-feet of recharge to the Edwards limestone aquifer.<br />
DISCHARGE<br />
The Edwards Plateau, along with the Balcones fault zone, is one of the principal<br />
spring-producing regions in the United States. Within the plateau region hundreds of<br />
springs form the base flow of the streams that drain the area. The most spectacular<br />
springs, however, occur in the Balcones fault zone where six major springs serve as<br />
natural outlets for the underground reservoir. The principal springs are, from west to<br />
east, Leona, San Antonio, San Pedro, Hueco, Comal and San Marcos Springs. Their<br />
average annual combined discharge is approximately 352,400 acre-feet, or 67% of the<br />
total aquifer discharge. Two of the springs, Comal and San Marcos, are listed among<br />
the 65 springs of first magnitude in the United States (l)*. The volume offlow from these<br />
springs is dependent on the water level in the underground reservoir.<br />
The remainder of the discharge from the aquifer is through wells. The first well was<br />
drilled into the Edwards limestone in 1884 for a water supply for the city of San Anto-<br />
nio. By 1907 there were over 100 artesian wells in Bexar County alone, some with a<br />
natural flow of about 30 million gallons per day. Today there are about 4,000 wells<br />
drawingwater from the reservoir in the five-county area which includes Uvalda, Medina,<br />
Bexar, Comal, and Hays Counties. The 1962 use from wells was 268,200 acre-feet, of<br />
which 212,000 acre-feet were pumped in Bexar County.<br />
AQUIFER STORAGE<br />
The total capacity of the underground reservoir is unknown, but by use of the water<br />
budget equation “inflow minus outflow equals change in storage”, a reasonable esti-<br />
mate of the storage within the historic high and historic low stages of the reservoir was<br />
obtained. Water levels have been observed and recorded for the last several years over<br />
the entire length of the underground reservoir. A study of these water levels has shown<br />
that a good correlation exists between the average elevations in these wells and the ele-<br />
vation of a single well, H-26, located in San Antonio. The lower water level (elevation<br />
612) was recorded in well H-26 in August 1956, at which time all the springs except San<br />
Marcos ceased to flow. The highest level (elevation 685) was recorded in October 1942.<br />
Studies have indicated that, above elevation 612, a change of one foot in the water level<br />
in this well reflects an average change of storage in the aquifer of about 38,400 acre-feet.<br />
In the recorded range of elevation (612 to 685), it is estimated that about 2,800,000 acre-<br />
feet of water is in storage. There is PO way to accurately determine the storage in the<br />
aquifer below the recorded low of 612; however, an extrapolation of the lower part of<br />
the curve, the accumulated annual differences in recharge and discharge versus the<br />
year and elevation of well H-26, shows that about 30,000 acre-feet of water per foot of<br />
drawdown are available.<br />
INVESTIGATIONS AND STUDIES<br />
Investigations and studies included (I) Geologic studies of the area in general and<br />
the Edwards limestone aquifer in particular; (2) locating and investigating ten potential<br />
* The number (i), etc. pertain to specific references in the bibliography.<br />
472
47 3<br />
AIN003 3OlVAn<br />
AlN003 AINNIY<br />
INfl03 VN103W<br />
-. hlNn03 - VN103W<br />
~<br />
hitino3 3ainhn<br />
.UN003 YVX38<br />
AIN003 VN103A ~-<br />
AIN003 lVA03<br />
~<br />
AINn03 YWX38<br />
C133NnW!dE M3N<br />
AIN003 - SAVH -. -.<br />
AIN003 lVAO3
dam and reservoir sites for flood control, recharge, water conservation, and recreation<br />
purposes; (3) investigation of an existing dam on the Medina River; (4) radioactive<br />
tracer studies to study groundwater movement in the aquifer; (5) hydrologic investi-<br />
gations to determine the quantity of additional water resources for recharge and other<br />
water conservation purposes and to determine the flood-control and structure require-<br />
ments ;(6) the effects of evaporation in surface storage reservoirs; (7) methods to control<br />
flow from the large springs issuing from the aquifer; and (8) fluctuation of the “bad<br />
water” line.<br />
GEOLOGIC STUDIES<br />
Approximately i8 miles northeast of San Antonio the Edwards Underground<br />
Reservoir narrows to a width of about five miles between the outcrop area and the<br />
“bad water” line. Since virtually all the springflow from Coma1 and San Marcos Springs<br />
must pass through this restriction, it was decided to explore the zone by core boring<br />
through the Edwards limestone. After completion of drilling, the boring was electric<br />
logged and photographed with a bore hole camera. The investigation showed a total<br />
thickness of 482.5 feet of Edwards limestone. The rock was found to be highly broken<br />
and solutioned with cavities up to two feet in diameter, separated by intervals of rela-<br />
tively impermeable limestone. The bore hole camera was used in the boring to supple-<br />
ment the information obtained from the cores and to show the condition of the rock in<br />
place.<br />
To further study and define the limits of the Edwards aquifer electric logs were made<br />
in the exploration borings at all the investigated dam sites and in a number of old and<br />
new water wells in the area. Local water well drillers co-operated in the investigation<br />
by supplying pertinent data on new wells drilled in the area.<br />
Geologic mapping was completed on portions of the major rivers and streams that<br />
drain the Edwards Plateau and contribute recharge to the Edwards limestone aquifer.<br />
This mapping was necessary to locate suitable dam sites, as well as evaluate the recharge<br />
capabilities of the streams. The requirements of the various proposed structures (i.e.<br />
water conservation or recharge and flood control) controlled the final selection of the<br />
site. Proposed dams with water conservation requirements were located above the heavy<br />
seepage loss areas in the Balcones fault zone. Other recharge structures proposed for<br />
operation as “dry pool reservoirs” were located in the Balcones fault zone on the<br />
Edwards outcrop.<br />
Geologic conditions at ten dam sites were investigated by core drilling, electric<br />
logging, pressure testing, and geologic mapping. Seven of the sites, located in the Nue-<br />
ces and San Antonio River Basins, were investigated primarily as sites to provide arti-<br />
ficial recharge. The remaining three sites, located in the Guadalupe River Basin, were<br />
investigated primarily for flood control and for water conservation rather than direct<br />
recharge.<br />
MEDINA DAM<br />
Medina Dam, a concrete gravity structure on the Medina River about 25 miles<br />
northwest of San Antonio, is the only structure in the area located within the Balcones<br />
fault zones. The dam and a diversion dam, located some four miles downstream, were<br />
constructed in 191 1 for irrigation and water conservation; however, due to excessive<br />
leakage to the Edwards Underground Reservoir, estimated at 42,700 acre-feet annually,<br />
the project has never had a dependable yield. Because the project is essentially a proto-<br />
type of those planned by the Corps for artificial recharge to the Edwards aquifer, detai-<br />
474
DRPS Gï EkGiNEERS US. ARM'<br />
(64.500AC.FT/YR)<br />
(197,800 AC. FT./YR)<br />
DOMESTIC, STOCK, MISC.<br />
25.7 MGD<br />
(22.900AC.FT.IYR)<br />
DATA FROM<br />
EDWAFEDS UNDERGROUND<br />
WATER DISTRICT<br />
BULLETIN Y2,JULY 1963<br />
AND U.S. GEOLOGICAL<br />
SURVEY<br />
BY COUNTIES<br />
FOR PURPOSE5<br />
(200 AC.FT./YR)<br />
(ZZO.lOOAC.FT./YR.)<br />
(321.500AC.FT/YR)<br />
TOTAL DISCHARGE<br />
525.9 MGD<br />
589,500 AC.FT/YR<br />
DISCHARGE FROM THE<br />
EDWARDS UNDERGROUND RESERVOIR (1962)<br />
~ ~~<br />
FIGURE 4<br />
475
led geologic and hydrologic investigations were conducted. From these investigations<br />
the following conclusions were reached: (1) the Edwards limestones, if properly explored<br />
and treated, is a suitable foundation rock for the size structures proposed; (2) leakage<br />
from the reservoir through the abutments and foundation occurs through well-devel-<br />
oped joints and fractures resulting from the faulting in the Balcones fault zone. This<br />
leakage could possibly be controlled if necessary by extensive grouting; (3) sedimen-<br />
tation in the reservoirs has not affected the capability of the rock to accept recharge<br />
water; (4) a project in the Balcones fault zone is well suited for a flood control structure<br />
as well as recharge; (5) an additional 20,900 acre-feet of recharge water per year could<br />
be realized if the Edwards Underground Water District could obtain the structure and<br />
cease diversion for irrigation.<br />
RADIOACTIVE TRACER STUDY<br />
An investigation of scientific methods for obtaining information regarding move-<br />
ment of underground waters revealed that satisfactory results had been found in some-<br />
what similar circumstances by the " tritium analysis method". This method involves<br />
the laboratory analysis of natural water molecules. Tritium, a natural isotope of the<br />
hydrogen atom, is present in the atmosphere and in water at all times, due to the inter-<br />
action of the atmosphere with cosmic rays from the sun. In recent years its concentra-<br />
tion has been increased by the nuclear bomb testing programme.<br />
A small scale pilot programme designed only to test the feasibility of the use of tri-<br />
tium was initiated in 1963 by completing analysis on samples collected from 100 wells,<br />
streams, and springs throughout the aquifer area. The results of the programme were<br />
encouraging but not conclusive. Only about one-third of the water samples collected<br />
showed tritium activities high enough to be measured without an enrichment process.<br />
The range of activity in the river samples varied from 118 to 441 T.U. (Tritium Units).<br />
This wide range of tritium activity is surprising since all the streams receive essentially<br />
the sanie rainfall. It was felt the range indicated a more complete mixing of the precip-<br />
itation and base Bow in some streams than in others. The only wells containing watei,<br />
with measurable tritium activities are located in Medina County. These wells produce<br />
from a depth greater than 600 feet, indicating the runoff water in that portion of the<br />
aquifer proceeds to considerable depths with little dilution. On the basis of the initial<br />
programme, it is believed that detailed tritium tracer studies could be very useful in<br />
defining the groundwater movement in the aquifer, especially with the new refined<br />
methods of laboratory analysis.<br />
HYDROLOGIC INVESTIGATIONS<br />
Hydrologic investigations were made to determine the quantity of additional water<br />
resources that could be developed for recharge of the Edwards aquifer and other water<br />
conservation purposes by the construction of surface reservoirs on the streams of the<br />
Edwards Plateau. Studies were made to determine the best method of regulating the<br />
surface reservoirs for recharge. They included holding the water in surface conservation<br />
pools and the rapid release of all storage following each runoff period. A number of<br />
hydrologic routings of water resources through the aquifer were made under existing<br />
and modified conditions to determine the dependable yield of the aquifer and to eval-<br />
uate the effects of the recharge structures. To determine the yield of the aquifer which<br />
might be associated with various levels of drawdown, routings were made assuming<br />
several constant pumping rates. However, because of the risk of pollution of the aquifer<br />
if the water level is drawn down below its historic low of elevation 612, this minimum<br />
control elevation was adopted.<br />
47 6
Other hydrologic investigations were made to determine the storage requirements<br />
for all investigated projects to control the floods of record on the individual streams<br />
and to determine structure requirements for spillways and outlet works.<br />
THE EFFECTS OF EVAPORATION ON SURFACE RESERVOIRS<br />
The very high evaporation rate in the semi-arid Edwards Plateau precludes the stor-<br />
age of any large body of water for an extended period of time for efficient recharge.<br />
This condition is especially true in the western portion of the area where the net annual<br />
loss from surface reservoirs varies from 35.7 inches at San Antonio to 55.3 inches on<br />
the Rio Grande at Del Rio. Asur face reservoir in this region covering an area of 5,000<br />
acres would lose from 15,000 to 23,000 acre-feet per year by evaporation.<br />
CONTROL OF SPRINGFLOW<br />
Although the Edwards limestone aquifer is a vast complex of relatively permeable<br />
strata receiving recharge from several drainage basins, the high rate of uncontrolled<br />
springflow at the lower end preclude it from being classified as an ideal groundwater<br />
reservoir. Approximately 65% of the discharge from the aquifer during the period 1936<br />
to 1956 has been through major springs located in the Balcones fault zone. Two of the<br />
springs, Comal and San Marcos, account for about 83 % of the total spring discharge.<br />
If the flow from these two springs could be regulated, an additional 292,900 acre-feet<br />
annually would be available for pumping.<br />
Ideally the most logical way to control the springflow would be to control the re-<br />
charge, thereby controlling the water level in the underground reservoir. However, this<br />
would require impounding water in surface reservoirs upstream from the Balcones<br />
fault zone and controlling releases. As previously noted, evaporation losses are too<br />
great for this type reservoir regulation. Evaporation losses also preclude a similar meth-<br />
od whereby large pump stations located “up-reservoir” between Comal Springs and<br />
San Antonio could intercept the water and store it in “pump-up” reservoirs before it<br />
emits from the springs.<br />
Physical methods of controlling the springflow are equally problematical. Coma1<br />
Springs, for example, is the largest volume-wise of any known spring in the southwest-<br />
ern part of the United States. Water issues from openings in the Edwards limestone<br />
along the trace of the Comal Springs fault for a distance of about 500 yards. Conceiv-<br />
ably, ring dikes could be constructed around the springs to equalize the hydrostatic<br />
head, but eventually breakouts would probably occur elsewhere along the fault. A<br />
grout curtain across the Edwards limestone aquifer a few miles “up-reservoir” from<br />
the springs at a location where the underground reservoir narrows to a width of about<br />
five miles was also considered. However, information from the boring through the<br />
Edwards limestone located in the general area showed the rock to be so intensely broken<br />
and permeable that grouting would be ineffective. In addition, hydrostatic pressure<br />
within the aquifer would prevent a successful grouting programme.<br />
‘* €3 AD WATER ” LINE<br />
The historic low of elevation 612 in the Edwards limestone aquifer is significant in<br />
many respects. If the reservoir could be drawn down to a point where the major springs<br />
would stop flowing, then the entire recharge would be available for pumping. However,<br />
the presence of highly mineralized water in the reservoir to the south and southeast<br />
is a major deterrent factor. A study by the US Geological Survey of this transition zone<br />
477
etween the good and bad water has shown that there is a correlation between the chan-<br />
ge in the water quality and the storage change in the aquifer (4). From 1955 to 1962 the<br />
water level fluctuated from its historic low to a near record high and during this period,<br />
a close survey of wells along or adjacent to the “bad water” line was maintained. Three<br />
zones of different quality water were sampled. Zone 1 was in an area of good quality<br />
water (about 300 pprn), Zone 2 was near the “bad water” line and contained water<br />
with about 1,000 ppm, and Zone 3 was in an area downdip with highly mineralized<br />
water (+3,000 ppm). The water from Zone 1 showed no significant quality change<br />
during the study period. In Zone 2 the quality of water became poorer during the pum-<br />
ping seasons from May through October, but improved as pumping diminished during<br />
November through April. Overall, the quality of the water in Zone 2 changed almost<br />
13% from the median. The quality of water in Zone 3 exhibited opposite results from<br />
those achieved in Zone 2. In this case, the water quality improved with increased pum-<br />
ping and became poorer when pumping was lightest. The total chemical quality change<br />
in Zone 3 was less than 5%.<br />
It is not known to what extent the reservoir can be lowered before the intrusion of<br />
poor quality water would begin. However, in view of the possible serious consequence<br />
and possible permanent loss of the uncontaminated portion of the aquifer, it is consid-<br />
ered that the water level should not be lowered appreciably beyond its historic low.<br />
PLAN OF OPERATION<br />
From extensive studies and investigations made over the past 65 years by a number<br />
of Federal, State, and local governmental agencies, consulting engineers, and ground-<br />
water hydrologists, and from investigations and studies by the Corps, it has been con-<br />
cluded that additional recharge can best be provided by an system of dams on the prin-<br />
cipal streams in the drainage area that contribute to the Edwards limestone aquifer. The<br />
base flow of most of the streams in the Edwards Plateau is lost to the underground reser-<br />
voir where the streambeds cross the outcrop of the Edwards limestone in the Balcones<br />
fault zone. Additional water for recharge, therefore, must come from the flood flows<br />
which cannot be absorbed into the underground reservoir as they flow past the loss<br />
zone. From gauge records it has been estimated that the infiltration rate along the<br />
streams in the Nueces River Basin where they cross the fault zone varies from about<br />
500 to more than 1,000 second-feet. Along the streams in this basin, which contribute<br />
about 64% of their flow to the natural recharge of the aquifer, about 128,000 acre-feet<br />
per year of water resources pass the lower edge of the loss zone. In the San Antonio<br />
River Basin only about 8 %. or 15,900 acre-feet per year, of the average annual resources<br />
pass the lower edge of the loss area. In the Guadalupe River Basin only one stream is<br />
a major contributor to the underground reservoir. This stream has an average of only<br />
8,400 acre-feet annually of its resources passing the loss area. Surface water reser-<br />
voirs, constructed upstream from and in the Balcones fault zone, would provide regu-<br />
lation of the recharge to the underground reservoir. The water would be released from<br />
the surface reservoirs at rates not to exceed the infiltration rates along the streams and<br />
allowed to enter the aquifer through existing natural recharge channels downstream<br />
from the dams. Under this plan of operation evaporation losses would be held to a min-<br />
imum. Since only a very small percentage of water resources of the San Antonio River<br />
Basin passes the lower edge of the Balcones fault zone and since there are no appreciable<br />
flood damages in this area, no additional water resource development could be justified<br />
at this time. However, in the Guadalupe River Basin, although it contributes very little<br />
recharge to the Edwards limestone aquifer, two projects were found to be economically<br />
justified for purposes other than recharge. Water conservation storage potential was<br />
computed for both these reservoirs in order to present the complete picture of both the<br />
478
surface and groundwater resources which are possible of development within the study<br />
area.<br />
To provide controlled recharge storage for the underground reservoir, additional<br />
water supply storage and recreation facilities for the people of the Edwards Reservoir<br />
area, and to provide flood protection for the downstream areas of the Guadalupe and<br />
Nueces River Basins, the following plan of improvement has been found to be justified<br />
at this time.<br />
(a) For authorization and construction by the Federal Government<br />
1. Montell Reservoir on the Nueces River (Nueces River Basin) for flood control,<br />
water supply, recharge, and for recreation and fish and wildlife purposes. The reservoir<br />
would have a total controlled storage of 252,300 acre-feet and would increase the average<br />
annual recharge to the aquifer by about 26,600 acre-feet.<br />
2. Concan Reservoir on the Frio River (Nueces River Basin) for flood control,<br />
recharge, and recreation purposes. Total controlled storage would be 149,000 acre-feet<br />
and would provide about 21,500 acre-feet of increased recharge annually.<br />
3. Sabinal Reservoir on the Sabinal River (Nueces River Basin) for flood control,<br />
recharge, and recreation purposes. Total controlled storage would be 93,300 acre-feet<br />
and would provide about 15,800 acre-feet of increased recharge annually.<br />
4. Cloptin Crossing Reservoir on the Blanco River (Guadalupe River Basin) for<br />
flood control, water conservation, and for recreation and fish and wildlife purposes.<br />
The proposed reservoir would have a total controlled storage of 4O3,OOO acre-feet with<br />
274,900 acre-feet of that amount to be water conservation storage. The water conser-<br />
vation provision would fully develop the resources of the Blanco River upstream from<br />
the site and provide a dependable yield of 42,700 acre-feet yearly (38 million gallons<br />
per day).<br />
(b) For construction by local interests<br />
Dam no. 7 Reservoir on the Guadalupe River for water conservation. This project,<br />
having a total controlled storage of 658,000 acre-feet and operated in conjunction with<br />
the existing Corps of Engineers Canyon Reservoir some 48 miles downstream, would<br />
fully develop the resources of the river above the lower dam. D am no. 7 would increase<br />
the dependable yield about 46,000 acre-feet per year over that of the existing project.<br />
It should be noted the development of the recharge was limited to streams where it<br />
was considered feasible to justify flood control for Federal interest. Additional recharge<br />
can be realized if local interests desire to expand the programme to provide small,<br />
locally-financed structures to control the runoff in the small streams in the areas.<br />
PHYSICAL EFFECTS OF THE PLAN ON THE EDWARDS LIMESTONE AQUIFER<br />
Construction of Montell, Concan, and Sabinal Reservoirs in the Nueces River Basin<br />
and operation of the projects as proposed would result in a net increase in recharge to<br />
the Edwards limestone aquifer of about 63,000 acre-feet per year (57 million gallons<br />
per day).<br />
For analysing the effect of the increased recharge on yield and water levels of the<br />
underground reservoir, hydrologic routings were made of the recharge through reser-<br />
voir storage in the aquifer for the period 1935-1962. These routings were made under<br />
existing and modified recharge conditions. As graphically shown (fig. 51, the safe yield<br />
for pumping may be increased from 234,000 to 263,000 acre-feet per year (235 million<br />
gallons per day) without depleting storage in the underground reservoir below elevation<br />
612 at San Antonio. This represents an increase of 29,000 acre-feet per year (26 mgd).<br />
The remainder of the increased recharge, 34,900 acre-feet per year (31 mgd) under this<br />
479
480
plan, would be discharged from the aquifer principally through the major springs. Under<br />
assumed conditions of constant pumping of 234,000 acre-feet per year during the 1935-<br />
1956 period, the average annual springflow would be about 292,900 acre-feet. With the<br />
recharge projects in operation, this quantity would be increased to 327,800 acre-feet.<br />
EFFECTS OF SURFACE STORAGE FOR DEPENDABLE WATER SUPPLY<br />
Three reservoir projects, Montell, Cloptin Crossing, and D am no. 7 are proposed<br />
to provide Conservation storage. Montel1 would contain 1,000 acre-feet of conservation<br />
st orage to meet downstream commitments. Cloptin Crossing and D am no. 7 would<br />
p rovide a total of 915,400 acre-feet additional conservation storage in the Edwards area.<br />
T hese projects could supplement the groundwater supply and prevent its rapid deple-<br />
ti on if area-wide agreement on development of water resources can be obtained.<br />
CONCLUSIONS<br />
The proposed plan of improvement would meet the municipal, rural, industrial,<br />
military, thermal power, and irrigation demands of the area to about the year 2,000.<br />
To meet the anticipated future water demands beyond these dates wil require more<br />
adequate use of return Aows and development of ad&itional water supplies outside the<br />
Edwards Reservoir area.<br />
BACKGROUND BIBLIOGRAPHY<br />
1. A.H. BELO CORP., The Dallas Morning News: 1962, “The Texas Almanac”.<br />
2. DECOOK, Kenn;th J., 1960, Geology and Ground-water Resources of Hays<br />
County, Texas: Texas ?ter Commission Bulletin 6004.<br />
3. GARZA, Sergio, 1962, Recharge, Discharge and Changes in Ground-Water<br />
Storage in the Edwards and Associated Limestones, San Antonio Area, Texas;”<br />
A Progress Report on Studies, 19S5-591 Texas Water Commission Bulletin 6201.<br />
4. GARZA, Sergio, 1962, “The Zone of Transition Between Water of Good Quality<br />
and Saline Water in the Edwards and Associated Limestones in the Balcones<br />
Fault Zone, Texas:” Paper presented to the 1962 annual meeting of the Geological<br />
Society of America and associuted societies, Houston, Texas.<br />
5. GEORGE, W.O., 1952, “Geology and Ground-water Resources of Coma1 County,<br />
Texas:” U. S. Geologici! Survey Wuter-Supply Paper IJ38.<br />
6. GUYTON, W. F., 1955, The Edwards Limestone Reservoir:” Consulting Hydrologist<br />
report to San Antonio City Water Board.<br />
7. GUYTON, W.F., 1959, “Progress Report on the Edwards Limestone Reservoir:”<br />
Consulting Ground- Water Hydrologist Report to the San Antonio Cit.v Water<br />
Board.<br />
8. HOLT, Charles +;R., Jr., 1959, “Geology and Ground-water Resources of Medina<br />
County, Texas: U. S. Geological Surcey Water-Supply Paper 1426.<br />
9. LANG, Joe W., 1954, Ground-water Resources of the San Antonio Area,<br />
Texas: ” A progress repzrt of current studies1 Texas Water Commission.<br />
10. LOWRY, R.L., 1955, Recharge to Edwards Ground-water Reservoir:” Consultinq<br />
Engineer report to San Antonio City Water Board.<br />
11. PETITT, B.M., Ir., and Ge:rge, W.O., 1965, “Ground-Water Resources of the<br />
San Antonio Area, Texas: A progress report on current studies Texas Water<br />
Commission Bulletin 5808.<br />
12. San Antonio City Water Boar$ 1963, “The San Antonio Water Problem.”<br />
13. VANDERTULIP, John J., 1958, Surface Runoff That Passes the Lower Edge of<br />
the Edwards Limestone Outcrop Between the Nueces River and the Blanco<br />
River:” Memorandum report to William F. Guyton, Consulting Ground- Water<br />
Hydrologist, San Antonio City Water Board.<br />
481
SUMMARY<br />
A CONTRIBUTION TO THE STUDY OF<br />
GROUNDWATER INTAKE RECHARGE IN KARST<br />
J. VI LIMO NO VI^<br />
The Institute for Geological and Geophysical Research, Beograd<br />
The problem refering to the infiltration of rainfall and recharge of ground water<br />
bodies has been dealt with both in the literature and in practice only for the loose rocks<br />
(sand, gravel, loess). By the laboratory and empiric tests, the corresponding values of<br />
the coefficient of infiltration, being applied in practice for the determination of ground<br />
water balance in rock masses of intergranular porosity, have been found.<br />
By the lately performed geological, hydrogeological and geophysical investigations,<br />
the considerable reserves of fresh ground waters have been found in the Adriaticcoast-<br />
al belt in Dalmacia. They represent considerable water supply sources which are uti-<br />
lized for the water supply purposes of the surrounding settlements. Consequently,<br />
in practice arose the question to determine the maximum quantity of ground waters<br />
in karst intersticial ground water body.<br />
The reserves of ground waters in karst ground water body directly depend on the<br />
infiltration properties of solid carbonate rocks building up the catchment area. To<br />
determine the discharge of ground waters in a zone of captage or at one particular<br />
profile in the karst ground water body, the coefficient of infiltration for that particular<br />
karst area should be known.<br />
In addition to the determination of the coefficient of infiltration, this paper also<br />
deals with the influence of the rainfall on the regime of ground waters in karst.<br />
RESUME<br />
Contribution à la connaissance de l’alimentation en eau des karsts<br />
Le problème de l’infiltration des eaux de pluie et de la réalimentation des nappes<br />
souterraines n’a guère été traité, dans les ouvrages spécialisés et en pratique, que pour<br />
les roches non consolidées (sables, graviers et loess). Par des tests empiriques et des tests<br />
de laboratoire, on a calculé les valeurs correspondantes du coefficient d’infiltration.<br />
Ces coefficients sont appliqués dans la pratique pour déterminer le bilan hydrique de<br />
masses rocheuses à porosité intergranulaire.<br />
Des recherches géologiques, hydrogéologiques et géophysiques ont récemment révélé<br />
l’existence de réserves considérables d’eau douce dans le sous-soi du littoral dalmate<br />
de l’Adriatique. 11 s’agit là d’une source d’approvisionnement très importante qui est<br />
utilisée pour alimenter en eau les localités des environs. Un problème se trouve donc<br />
posé sur le plan pratique : déterminer la quantité d’eau maximale contenue dans les<br />
interstices d’un massif karstique.<br />
L’importance des réserves d’eau emmaganisées dans un karst dépend directement<br />
du coefficient d’infiltration des roches carbonatées compactes qui forment le bassin<br />
de réception. Pour évaluer le débit en eaux souterraines d’une zone de captage ou d’un<br />
profil particulier du réseau karstique, il faut donc connaître le coefficient d’infiltration<br />
de cette zone karstique.<br />
Outre la détermination du coefficient d’infiltration, cet article étudie aussi l’influence<br />
des précipitations sur le régime des eaux karstiques.<br />
The ground water recharge in karst depends mainly on the absorption properties of<br />
the catchment area and the degree of influence of atmospheric precipitation on the<br />
regime of karst groundwater bodies.<br />
Extensive hydrogeological investigations were performed and some concrete water<br />
economy problems were solved in the Dinaric karst during the post-war period, but<br />
the coefficient of infiltration of atmospheric przcipiíation was not studied in detail.<br />
‘Io determine the catchment area for a spring or a rate of inflow, values ranging from<br />
0.3 to 0.4 were usually used. No attempt was made to see whether these values corres-<br />
482
ponded, and if they did to what degree, to the hydrogeological properties of the karst<br />
area under investigation.<br />
Recent experience revealed that the forementioned values did not correspond as<br />
they were too low. Therefore at some localities of Dinaric karst, the coefficient of infiltra-<br />
tion was considered in relation to the hydrogeological properties of the catchment area<br />
in question, on which they really depend. Hence, the coefficient of absorption was deter-<br />
mined indirectly. One of these localities, which wil be dealt with in further text, is the<br />
broader area of Zadar where a source of a Zadar aqueduct is situated.<br />
In 1964 the capacity of wells of the Zadar aqueduct began rapidly to decrease due<br />
to a gradual and constant decline of groundwater levels at the source in BokanjaEko<br />
blato swamp. The usual pumping in a dry period was 180 l/sec. Now 140 l/eec was<br />
pumped and the water level fell continuously (from 13.5 m to 8.3 m).<br />
In addition to a study of hydrogeological causes of decreased exploitable ground-<br />
waters there arose a practical question from the standpoint of future increase of the<br />
capacity of the aqueduct: what is the optimal quantity of groundwaters in the existing<br />
source (in a dry period) and further, indirectly, what is the value of the coefficient of<br />
absorption in the karst area in question which would enable a determination of optimal<br />
groundwater discharge at the profile of existing wells.<br />
To answer the forementioned questions it was necessary to learn the hydrogeological<br />
properties of the catchment area* on the source, and its hydrogeological parameters.<br />
The hydrogeological conditions of groundwater occurrences on the source in Bokan-<br />
jac swamp are simple. The karst groundwater body was formed in a system of longi-<br />
tudinal, diagonal and transversal karstified fissures developed at the angular point of<br />
perpendicular anticline oî Senonian and Eocene limestones. The anticline is very<br />
clearly limited from both sides by Eocene Flysh representing quite an impermeable<br />
rock complex (fig. 1). In this way, the groundwater movement in a karstified rock<br />
mass of limestones is clearly directed towards the strike of the anticline and the<br />
morphological inclination of the catchment area, north west.<br />
The space relation between the permeable and impermeable rock masses in the<br />
broader background of Zadar, conditioned the clear boundaries of the catchment area<br />
of the source in the Bokanjac swamp. The north western and south western boundaries<br />
of the catchment area cover the geolithological boundaries of rock masses. The south<br />
eastern one has a morphological character and it covers the surface drainage divide.<br />
The catchment area is, from the orographic standpoint, very poorly developed and it<br />
represents a plane whose elevations increase towards south east from 20 m in Bokanjac<br />
swamp to 90 m at the south eastern boundary of the catchment area. It is almost of<br />
rectangular shape, 12.5 km in length and average width of 4 km comprising an area<br />
of 50 square kilometres. The catchment area is developed in limestone rocks which are<br />
quite karstified at the surface and have no characteristic karst shapes (sink holes, clints<br />
etc.). The limestone complex is partly covered by very thin and regularly arranged layers<br />
of terra rossa and vegetation. Due to this the area has no obvious karst shapes. How-<br />
ever, below the surface zone, characterized by remarkable karstification and fissibility<br />
to 0.30 m in depth (fig. 2) and representing a crushed limestone zone, the limestone<br />
mass is dislocated by larger defts which werelater widened into channels and caverns of<br />
different dimensions and shape by the process of karstification. The number of channels<br />
and caverns in unit volume decreases going from the surface towards the inside of<br />
the limestone mass and their permeability increases. In addition, the limestone mass is<br />
intersected by short faults going from north to south followed by a developed system<br />
of fissures. At the interlayered zones where karstification also took place, the perme-<br />
ability of the limestone complex is exceptionally increased. Thus still closer connexion<br />
existed among the karst shapes in the limestone mass, i.e. the permeability of limestone<br />
complex, as a whole, was increased which means that its infiltration properties were,<br />
consequently, also improved. As the catchment area is lithologically homogeneous it<br />
483
LEGEND<br />
m3<br />
1 5<br />
/6<br />
484<br />
Q 16<br />
Fig. 1 (Legend see next page)
is supposed that such porosity distinguishes the whole limestone complex making up<br />
the catchment area.<br />
There is no constant surface flow in the whole catchment area. In the morphology<br />
of the terrain, a remarkable erosional valley stretches through the middle part of the<br />
catchment area. As there has been no surface flow in its bed for the last twenty years,<br />
even ;after maximum height of precipitation, it can be consequently considered that<br />
there is also no periodic flow.<br />
Fig. 2 - Karstified Eocene limestone in the cutting of motor road near Zadar<br />
About 80 per cent of the catchment area is covered by low forest and bushes and<br />
the rest has no vegetation.<br />
The annual changes in humidity correspond to the occurrence of precipitation. The<br />
maximum humidity is during the wet period and the minimum during the dry period.<br />
The average annual humidity in a period from 1952 to 1958 was 74.5 per cent and the<br />
temperature 14.5 "C. The atmospheric pressure for the same period was 761.3 mm.<br />
Fig. 1 - The ratio between the permeable and impermeable rocks in the broader area<br />
of the source in Bokanjac swamp.<br />
Legend:<br />
1. Cretaceous and Eocene limestones; permeable rock.<br />
2. Eocene Flysh; impermeable rock.<br />
3. Cretaceous dolomites: impermeable rock.<br />
4. Quarternary sands; permeable rock.<br />
5. Quarternary clays; impermeable rock.<br />
6. Fault<br />
7. Local direction of groundwater movement.<br />
8. Main direction of groundwater movement.<br />
9. Supposed boundary of catchment area.<br />
1 o. Determined boundary of catchment area.<br />
11. Surface water parting.<br />
12. Zone of influence of sea.<br />
13. Coastal spring.<br />
14. Resurgent spring.<br />
15. Source.<br />
16. Sink hole.<br />
48 5
Observing the distribution of annual precipitation it can be clearly noticed that there<br />
are two periods: a wet one from November to May and a dry one from May to Novem-<br />
ber. The average annual atmospheric precipitation was 953 mm for the last 30 (thirty)<br />
years.<br />
It should also be added that the groundwater discharge was observed at a section<br />
of existing interceptors in the Bokanjac swamp. O n the basis ofpresent hydrogeological<br />
studies in karst of Dinarides, the ratio of the minimum, average and maximum ground-<br />
water discharge for the period mentioned is 1:3:15 and it served as a basis for further<br />
observations of the values of the coefficient of infiltration.<br />
When we calculate the corresponding average annual groundwater discharge for<br />
a certain number of adopted values of the coefficient of infiltration, using the above-<br />
mentioned ratio, the corresponding minimum discharges can be determined at the<br />
observed section. The data obtained are as follows:<br />
~~<br />
Flow Flow<br />
Coefficient of infiltration<br />
C average l/sec minimum Ilsec<br />
0.20<br />
0.25<br />
0.30<br />
0.35<br />
0.40<br />
0.45<br />
0.50<br />
0.55<br />
0.60<br />
0.65<br />
0.70<br />
302<br />
3 76<br />
453<br />
520<br />
604<br />
680<br />
755<br />
830<br />
905<br />
980<br />
1053<br />
101<br />
125<br />
151<br />
173<br />
201<br />
237<br />
252<br />
277<br />
3 02<br />
327<br />
351<br />
Supposing that all minimum groundwaters discharge at one section and gravitate<br />
to wells (with no lateral discharge) and that they were all tapped then the last year’s<br />
pumping capacity of 140 l/sec would approximately correspond to the coefficient of<br />
infiltration C = 0.3 in a dry period.<br />
However, the hydrogeological relation between the permeable and impermeable<br />
rocks in areas near the source suggest that the groundwaters of Bokanjac catchment<br />
area do not gravitate only towards the interceptors but also beside them. One part of<br />
groundwater circulates through the limestone along the north eastern Flysh barrier to<br />
north west, and the coastal springs near Nin and the other part along the south western<br />
Flysh barrier turn to the south western resurgent and coastal springs near Zadar.<br />
The quantity of groundwater which does not circulate under the influence of exis-<br />
ting interceptorsisunknown. On the basis of position ofinterceptorsin regard to themain<br />
direction of the circulation of groundwaters it can be supposed that about 50 per cent<br />
of flowing groundwaters have been intercepted. Consequently, the total discharge at<br />
the observed section would be 280 l/sec in the dry period of 1964.<br />
According to the above table, this value corresponds to the coefficient of infiltration<br />
C = 0.56. For different values of the quantity of intercepted flowing groundwaters (in<br />
percentage) using the minimum discharge at the section, the following values of the<br />
coefficient of infiltration are obtained:<br />
48 6
~ ~~ ~~~~<br />
The quantity of<br />
intercepted flowing<br />
groundwaters (%) 40 45 50 55 60 65 70 75 80<br />
Minimum discharge<br />
l/sec 350 312 280 255 234 215 200 187 175<br />
Coefficient of<br />
infiltration 0.7 0.62 0.56 0.51 0.47 0.43 0.40 0.37 0.35<br />
If we suppose that the possible quantity of water that can be abstracted in a karst<br />
groundwater body at the source in Bokanjac swamp ranges from 40 to 60 per cent of<br />
the total discharge at the section, then the coefficient of infiltration ranges from 0.47<br />
to 0.70. This value is higher than that one used before and the coefficient of infiltration<br />
ranges between 0.5 to 0.7<br />
In addition to the study of the values of the coefficient of the infiltration in karst,<br />
some data on the influence of precipitation on the water level in the karst groundwater<br />
body wil also be dealt with.<br />
At the Dubrava locality near Pirovac (north west of Sibenik), the influence of precipitation<br />
from the catchment area on the regime of groundwater body was also studied.<br />
For that purpose the measurements of atmospheric precipitations and variation of<br />
groundwater level at six exploratory boreholes were made at the locality of future interceptors.<br />
By continuous measurements from March 1960 to December 1962 it was<br />
found that the influence of precipitation during the hydrologic year (dry and wet periods)<br />
is similar for all boreholes and that in each following hydrological year the similarity<br />
is repeated.<br />
Therefore we shall present the results btained only in one borehole in a period<br />
from April 1960 to April 1961.<br />
1 1<br />
Fig. 3 - Diagrams representing the precipitations and changes of groundwater level<br />
at Dubrava.<br />
487
The variations of groundwater level in this locality depend directly on the precipi-<br />
tation in the immediate catchment area (fig. 3). The following data indicate this: during<br />
the dry period (July 1960) the groundwater level in the borehole declined to the abso-<br />
lute elevation of 3 m and during the wet period (October 1960) it rose to 16.7 m.<br />
The dependence of water level on the precipitation varies for the dry and wet period.<br />
A daily rainfall on 29 July 1960 (a dry period) of 56 mm caused the groundwater level<br />
in the borehole to rise from 3.1 m to 5.6 m, while the same rainfall on 7 December 1960<br />
(a wet period) caused the water level in the borehole to rise from 5.9 m to 15.2 m. Peri-<br />
odic daily rainfalls ranging from 5 to 15 m at the end of June and in the first part of<br />
July 1960 had no influence on the karst groundwater body whose elevation was about<br />
3.5 m but the eight-day rainfalls from 9 November to 19 November 1960 whose daily<br />
falls ranged from 4 to 24 mm making in total 82 mm quite clearly influenced an increase<br />
in the groundwater level (from 5.4 m to 13.2 m).<br />
The strongest oscillations of karst groundwater level were noticed on the transition<br />
from the dry to wet period. Under the influence of continual precipitation from 9<br />
October to 15 October 1960 daily falls ranging from 4 to 59 mm the amplitude of<br />
dynamic oscillations was 12.9 m (from 3.8 to 16.7 m). The daily cycle of precipitation<br />
in that interval shows that the maximum precipitation was preceded by five-day rains<br />
of 4-18 mm per day making a total of 61 mm. They were not of highest importance<br />
in influencing the rise of maximum groundwater level. The maximum level was reached<br />
after the daily rainfall of 59 mm on the sixth rainy day.<br />
Lag in the karst groundwater fluctuation depend on the precipitation in the catch-<br />
ment area, ranges from 2 to 3 days. The interval is the same during the whole hydro-<br />
logical year. In the dry period the rainfalls on 28 July 1960 were reflected on the bore-<br />
hole on 30 July 1960 and the same lag was also recorded in the wet period after the<br />
precipitation on 30 September, 15 October and 7 December 1960.<br />
The significant influence of precipitation in the catchment area itselî on the regime<br />
of the karst groundwater body at Dubrava and its comparatively quick reaction indi-<br />
cate that the absorption properties of the limestones in this area are also very pronoun-<br />
ced.<br />
The examples of the above-mentioned localities in Dinaric coastal karst show that<br />
the recharge of groundwaters in the karst does not depend only on the hydrological<br />
parameters but also on the hydrogeological properties of limestones rock complex<br />
where a groundwater body with a corresponding catchment area was formed.<br />
488
RESUME<br />
QUELQUES CONNAISSANCES SUR<br />
LA CIRCULATION DES EAUX SOUTERRAINES<br />
DANS LES FORMATIONS FISSURÉES<br />
NON KARSTIFIEES EN TCHÉCOSLOVAQUIE<br />
K. ZIMA<br />
(Tchkcoslovaquie)<br />
Dans plusieurs pays existent des régions avec des eaux souterraines circulant dans<br />
les massifs cristallins ou dans les roches sédimentaires fissurés.<br />
Ces mêmes conditions se présentent en Tchécoslovaquie où plus de 50 p.c. de la<br />
surface d’état est formée de terrains avec des sources irrégullières et pour la plupart peu<br />
abondantes (de 0,l jusqu’à l,Ol/s), en provenance d’un système des fissures discontinues.<br />
Exceptionnellement, suivant des conditions structurales, on trouve les écoulements<br />
sous-terrains plus grands dans les zones plus profondes, grâce aux effondrements tec-<br />
toniques. Les failles ouvertes drainent les petits systèmes de fissures et peuvent capter<br />
les eaux de quelques dizaines ou centaines de km2.<br />
En cas de contact tectonique avec les terrains perméables, l’eau des fissures enrichit<br />
les couches poreuses (les zones aquifères secondaires). Localement on a pu constater<br />
l’infiltration de courants superficiels dans les profondeurs plus grandes le long des<br />
effondrements et la migration des eaux souterraines au travers du substratum. Grâce à<br />
cette juxtaposition tectonique, les zones aquifères abondantes et souvent artésiennes<br />
les eaux froides ou chaudes sont évoquées.<br />
L’origine primaire des gisements d’eau démontre bien leur minéralisation peu<br />
élevée (résidu sec total 100-150 mg/l) et leur radioactivité plus élevée.<br />
En cadre des recherches hydrogéologiques régionales on a découvert en Tchécoslo-<br />
vaquie plusieurs structures de ce genre. I1 est intéressant de mettre un évidence deux<br />
exemples dans le Crétacé supérieur : la nappe aquifère dans les grès du Cénomanien à<br />
proximité de la faille de Luiice avec migration des eaux souterraines accumulées dans les<br />
fissures des roches cristallines et la zone artésienne dans les terrains sableux (grès et<br />
conglomérats) du Sénonien dans la dépression de Tteboìi (fosse tectonique compli-<br />
qué).<br />
Les débits des ressources atteignait à quelques cents I/s.<br />
SUMMARY<br />
Some details on the circulation of groundwater in non-karstijied ,fissiired formations in<br />
Crechodovakia<br />
In a number of countries there are regions with groundwater circulating in fissured<br />
crystalline massifs or sedimentary rocks.<br />
One of them is Czechoslovakia, where formations of these types constitute over<br />
50% of the country’s land surface. Discharge is through intermittent and mostly lowyield<br />
springs (O. 1 to 1.0 l/s), fed from a system of discontinuous fissures.<br />
Exceptionally, the structural conditions are such that the underground flow is found<br />
to be greater in the lower strata as a result of tectonic subsidence. Open faults drain the<br />
small systems of fissures and may capture the water of areas of some scores or hundreds<br />
of square kilometres.<br />
Where there is tectonic contact with permeable horizons the water from the fissures<br />
augments the supplies in the porous strata (secondary aquifers), and it has been possible,<br />
locally, to verify the infiltration of surface waters to the deeper strata along the length of<br />
the subsidences and the migration of groundwater through the substratum. The tectonic<br />
juxtaposition produces high-yielding, and often artesian, hot or cold nappes.<br />
The primary origin of the springs is sufficiently demonstrated by their low mineralization<br />
(total dry residue 100-1 50 mg/l) and higher radio-activity.<br />
In the course of regional hydrogeological research in Czechoslovakia a number of<br />
structures of this kind have been found. It is worth drawing attention to two examples<br />
in the Upper Cretaceous: (a) the aquifer in the Cenomanian sandstone near the Luiice<br />
fault with migration of the groundwater accumulated in the fissures of crystalline rocks,<br />
and (b) the artesian zone in the sandy formations (sandstones and conglomerates) of<br />
the Senonian in the Tiebofi depression (a complex tectonic trough fault).<br />
Discharges from the springs reach some hundreds of ljs.<br />
489
En Tchécoslovaquie, plus de 50% du territoire est formé par des massifs fissurés<br />
d’un caractère non karstiíïé ou karstifié. Le débit des eaux souterraines du système<br />
fissuré est cependant très variable et dépend du degré de leur communication mutuelle.<br />
C’est pourquoi il faut distinguer entre le système discontinu, grâce auquel existent<br />
seulement quelques sources isol&s de petits débits (environ de 0,l à 1,0 ]/sec.), et le<br />
système continu, dans lequel les accidents tectoniques plus importants, comme par<br />
exemple les failles continues, peuvent produire un vaste drainage de territoires plus<br />
étendus sous la forme de sources importantes (1-10 Usec.).<br />
Exceptionnellement,les fissurespermettent à l’eau d’atteindre les couches perméables<br />
le long de leur contact, qui est souvent assez étendu. Les débits de ces sources peuvent<br />
4 6<br />
L/<br />
3 S m 9 I’<br />
490<br />
Fig. 1 - Schème géologique de la partie occidentale de Tchécoslovaquie :<br />
1. Roches cristallines et sédimentaires fissurées;<br />
2. Roches éruptives tertiaires (basaltes compactes) ;<br />
3. Sédiments carbonifères et permiennes;<br />
4a) Crétacé supérieur du Massif de la Bohême; b) Crétacé supérieur du Système<br />
Carpathique;<br />
5. a) Sédiments paléogènes; b) Sédiments néogènes;<br />
6. Alluvions ;<br />
7. Axes des synclinaux;<br />
8. Failes principales;<br />
9. Linie de contact tectonique entre Massif de la Bohême et Système Carpathique;<br />
10. Coupes géologiques;<br />
11. Forages artésiens.<br />
/<br />
/<br />
10 /”<br />
11 El
atteindre des dizaines ou même centaines de litres/seconde. Le sujet de cette communi-<br />
cation sera l‘étude des eaux issues de ce genre de roches non-karstifiées, par l’examen<br />
de deux exemples typiques.<br />
CARACT~RISTIQUE G~OLOGIQUE DU TERRITOIRE<br />
Du point de vue géologique, la Tchécoslovaquie est divisée en deux parties : la partie<br />
occidentale est formée par des complexes anciens du Massif de Bohême (schistes et<br />
grauwackes algonkiennes, schistes, quartzites et calcaires du Paléozoïque moyen avec<br />
roches éruptives correspondantes (spilites, porphyres, diabases et granites), qui par<br />
endroits sont couverts de sédiments d’un âge géologique plus jeune (argillites permien-<br />
nes, arkoses et grès et marnes et grès du Crétacé supérieur, ou argiles et grès néogènes<br />
(fig. 1). La partie orientale atteint le système carpatique, qui forme au sud-est de l’Eu-<br />
rope une région montagneuse importante (calcaires secondaires et tertiaires, grès et<br />
schistes).<br />
Dans le système du Massif de Bohême existent des nappes aquifères abondantes<br />
en particulier dans la formation du Crétacé supérieur du nord de la Bohême, qui repose<br />
ou sur les couches permiennes ou sur le cristallin. C’est un bassin d’environ 300 km<br />
de long et 100 km de large qui s’étend dans la direction de l’ancienne ligne tectonique de<br />
Labe (Elbe). Au sud de la Bohême les roches crétacées sont conservées dans deux fosses<br />
tectoniques séparées l’une de l’autre par un seuil cristallin. La fosse la plus petite et<br />
plus profonde (jusqu’à 400 m environ) se trouve près de Ceské BudEjovice, tandis qu’une<br />
fosse moins profonde (environ 150 m) mais plus étendue est située aux alentours de<br />
Tieboñ et atteint au sud-est le territoire autrichien.<br />
Le Crétacé de Bohême a le caractère d’un recouvrement de plate-forme et appar-<br />
tient à l’étage moyen des bassins sédimentaires. I1 propose entre l’étage moyen des<br />
sédiments plus anciens qui datent du Perm-Zechstein et l’étage supérieur, auquel nous<br />
attribuons les sédiments néogènes. Du point de vue stratigraphique il peut être sub-<br />
divisé au Cénomanien (grès perméables et argillites subordonnées), le Turonien (marnes<br />
compacts et gr8s marneux, dans la partie supérieure grès) et le Sénonien-Coniacien<br />
inférieur (grès très perméables, marnes et grès marneux subordonnés). Toutes les deux<br />
parties marginales du bassin crétacéen principal sont plus aquifères : Au sud-ouest<br />
l’infiltration des précipitations dans les affleurements des gres cénomaniens est supé-<br />
rieure aux sources des fissures aquifères, tandis que la partie marginale tectonique au<br />
sud-est du bassin avec ressources abondantes d’eaux souterraines artésiennes (de nou-<br />
veau du Cénomanien) ne peut être alimentée que par l’intermédiaire du cristallin avoi-<br />
sinant plus élevé, dont les ruptures tectoniques puissantes dans la proximité de la grande<br />
faille de Luiice créent des conditions favorables à la venue d’eaux souterraines pro-<br />
venant de fissures. D’une façon semblable les réserves en eaux souterraines dans l’unité<br />
structurale plus petite - dans le Crétacé et le Tertiaire des bassins de Budëjovice et<br />
Tieboií au sud de la Bohême prennent naissance.<br />
Aux paragraphes suivants seront décrites deux localités assez importantes de ces<br />
régions du Crétacé supérieur.<br />
u) Synclinal crétacieii du nord de lu Bohême<br />
La quantité la plus importante des eaux de fissures du cristallin avoisinant se situe<br />
au bord nord-est du bassin crétacéen et aux alentours nord de Turnov dans la proxi-<br />
mité de la faille de LuZice (fig. 2). I1 s’agit d’une percolation des eaux superficielles<br />
(météoriques et des courants d’eau superficiels) sur un vaste territoire avec écoulement<br />
vers les couches crétacées (Cénomanien) le long des effondrements de caractère secon-<br />
daire presque perpendiculaires à la faille de Luiice (h 3-4) coupant le substratum du<br />
bassin crétacé. Des débits abondants ont été obtenus par les forages artésiens effec-<br />
49 1
E<br />
11<br />
_-
tués dans la vallée des rivières de Zehrovka et Jizera au sud de Turnov (la nappe captive<br />
cénomanienne se trouve à une profondeur de 300 à 430 m), avec un débit spécifique<br />
atteignant 15 l/sec/m, c’est-à-dire avec un débit par forage d’environ 40 à 80 l/sec. La<br />
composition chimique de l’eau est favorable: dureté4-7,5”n,minéralisation 200-300mg/l;<br />
elle est faiblement ferrique et modérément agressive aux métaux et au béton, ce qui<br />
prouve son origine cristalline.<br />
La perforation d’une nappe captive à Biezina (profondeur du forage 395 m, nappe<br />
captive à la profondeur de 330 m avec une charge piézométrique de 20 m au-dessus du<br />
niveau du terrain). Le débit initial atteignait 80 I/sec. (le débit constant fournit Cca<br />
50 ]/sec., pendant l’abaissement de 4 m le débit fut 83 l/sec.). Une nappe captive avec<br />
de l’eau dont la composition chimique est proche de celle des eaux de massifs cristallins,<br />
c’est-à-dire avec une faible dureté (4” allemands, résidu sec. 150 mgil) a été rencontrée<br />
dans les forages suivants.<br />
Pour une étendue du Cénomanien d’environ 400 km2, une puissance de l’aquifère<br />
de 50 m et une porosité des grès perméables de 20%, les réserves statiques en eau souterraine<br />
(accumulation) sont de 400 x lo6 x 50 x 0,20 = 4 mlds. m3,<br />
Les réserves dyriamiques (sous-écoulement) peuvent être évaluées au total à environ<br />
3 I/sec/km2, c’est-à-dire à 3 x 400 = 1.200 I/sec. L’étendue active de percolation doit<br />
donc être de plusieurs centaines de km2. Des conditions géomorphologiques favorables<br />
y existent : c’est le promontoire de Jizerské hory et de KrkonoSe. Les côtes plus élevées<br />
fournissent aussi une charge piézométrique relativement considérable (de 1-2 atm.).<br />
b) Le Créiaci des dépressions du sud de la Bohême près de ceské Budëjovice et Tfebon‘<br />
Du point de vue structural il s’agit de deux fosses le long des failles perpendiculaires<br />
d’une direction structurale de hi0 au centre du massif granitique et gneissique du sud<br />
de la Bohême, dont les conditions d’élévation sont visibles sur la coupe géologique<br />
(fig. 3).<br />
Du point de vue lithologique, les sédiments du Cénomanien supérieur (Sénonien<br />
inférieur) se développent à la base sous forme de grès et de conglomérats peu compacts<br />
d’une puissance de 30-50 m (perméables avec de l’eau artésienne) et couverts par des<br />
argiles et argillites plastiques imperméables.<br />
II est évident que l’origine des eaux artésiennes est exclusivement secondaire et qu’il<br />
y existe une alimentation provenant des roches cristallines des environs, et des assises<br />
cristallines le long des fissures et ruptures tectoniques de plusieurs systèmes.<br />
Ce sont surtout les failles transversales (perpendiculaires aux lignes de failles longi-<br />
tudinales) qui atteignent en profondeur lesmassifs granitiques et gneissiques. qui jouent<br />
le rôle de drains très actifs des terrains plus élevés où règnent des conditions favorables<br />
à la percolation des eaux météoriques. (eluvium sableux, forêts, pentes douces, préci-<br />
pitations annuelles entre 700-800 mm, évapotranspiration peu élevée). A ces conditions<br />
résulte la composition chimique de ces eaux artésiennes souterraines d’origine secon-<br />
daire : dureté peu élevée (titre hydrotimétrique 2-5” allemands, résidu sec 100-200 mg/]),<br />
agressives au Ca et Fe.<br />
En accord avec la géologie, la faible dureté indique aussi une courte circulation sans<br />
possibilité d’acquérir une teneur en substances minérales.<br />
Le niveau piézométrique des eaux artésiennes se trouve dans la dépression plate<br />
de Tfeboii, ou le débit des forages est 10-60 lisec., pour abaissement allant jusqu’à<br />
5 m, avec une charge piézométrique 1-5 m au-dessus du terrain; dans la dépression de<br />
Budëjovice (plus profonde), les débits des sources sont moins importants de l’ordre<br />
d’environ 0,5 à 5 l/sec. pour rabattement égal. Outre les profondeurs plus grandes, les<br />
mauvaises conditions hydrogéologiques de la dépression de Budijovice sont le caractère<br />
lithologique des sédiments dont les couches de base ne sont pas aussi perméables. Les<br />
couches sablonneuses contiennent une proportion considérable de ciment argileux et<br />
n’ont qu’un petit volume de pores actifs.<br />
49 3
7-<br />
..<br />
-\i.<br />
X<br />
x<br />
Lu<br />
z<br />
z.<br />
X<br />
X<br />
O<br />
cr,<br />
X<br />
x
En ce qui concerne les réserves dynamiques utilisables en eaux souterraines, un<br />
débit approximatif de 200 Ilsec. a été obtenu lors d’une reconnaissance hydrogéolo-<br />
gique de la partie nord du bassin de Tieboñ.<br />
Dans la dépression de Budëjovice il n’y a pas de possibilité de capter des eaux sou-<br />
terraines en quantités plus importantes. Toute la région manque d’eau et il sera néces-<br />
saire d’alimenter les villes importantes en amenant de l’eau de sources éloignées ou<br />
provenant des réservoirs d’eaux superficielles.<br />
CONCLUSION<br />
Les exemples donnés expliquent le régime des eaux souterraines de fissures en dépit<br />
de leur circulation cachée. Une évaluation des aquifères dans les massifs cristallins faite<br />
à partir des sources temporaires et ordinairement peu abondantes pourrait mener à des<br />
conclusions erronées sur leur passivité hydrogéologique.<br />
II est bien connu que la capture des eaux dans les régions cristallines est difficile<br />
et ordinairement peu efficace, en raison de leur fissuration irrégulière (profondeur<br />
variable et tortuosité du système des fissures aquifères). C’est pourquoi le recouvrement<br />
de couches perméables plus étendues, reposant immédiatement sur des massifs cris-<br />
tallins non altérés et une structure tectonique favorable créent souvent des accumula-<br />
tions considérables et permettent ainsi I’ailimentation en eaux potables à partir d’eaux<br />
souterraines des fissures.<br />
495
ALIMENTATION ARTIFICIELLE DE NAPPE AQUIFaRE<br />
DANS LES GaS F’ISSWS<br />
TANGER (MAROC)<br />
RESUME<br />
Robert AMBROGGI et Raymond HAZAN<br />
Recharge artificielte d’une nappe dans un grès fissuré (Tanger)<br />
Jusque 1955, la cité de Tanger recevait presque toute son eau de puits, par pompage,<br />
dans des calcaires coquilliers et des grès du Pliocène, formant une cuvette, alimentée<br />
uniquement par la recharge naturelle. Alors que la perméabilité du terrain était<br />
rincipalement interstitielle, la surface présentait cependant localement des formes de<br />
farstification et des fissures ouvertes d’origine tectonique.<br />
A la suite de l’accroissement de consommation d’après-guerre, il n’y avait plus<br />
équilibre entre la recharge estimée à 1 million de m3 par an et l’extraction (3 millions<br />
m3/an en 1955).<br />
I1 fut dès lors décidé de recharger la nappe artificiellement d’abord avec l’eau des<br />
«merjas» au centre du bassin et ensuite par de l’eau empruntée en hiver à un «oued»<br />
voisin. La méthode de recharge consistait à alimenter huit bassins d’absorption de<br />
10 x 5 x 2,5 m dans des grès isotropes et deux puits construits par une technique<br />
spéciale sur une faille naturelle.<br />
Alors que l’infiltration totale des huit bassins s’élevait à 280 m3/heure, les deux<br />
puits sur la faille absorbaient l’un 350 m3/heure et l’autre 370 m3/heure. La fissuration<br />
et la karstiñcation de la couche ont donc permis une solution économique du problème<br />
de la recharge de la nappe dans les calcaires et grès (la nappe est remontée de 15 mètres<br />
en six ans et les sources périphétriques commencent à couler à nouveau, aux dates<br />
attendues) et par conséquent du problème de l’alimentation de Tanger en eau.<br />
SUMMARY<br />
Artifcial recharge of a fissured sandstone aquifer-Tangiers<br />
Until 1955 the city of Tangiers obtained almost,all its water supply from pumped<br />
wells in conchitic limestones and sandstone of the Pliocene period, forming a complete<br />
cuvette with natural recharge by rainwater only. While the aquifer’s permeability is in<br />
the main interstitial, the surface in places presents various forms of karstification and<br />
open fissures of tectonic origin.<br />
As a result of the post-war increase in consumption, a dangerous inbalance deve-<br />
loped between the estimated recharge of 1 million m3/year, and extractions (3 million<br />
m3/year in 1953).<br />
It was therefore decided to recharge the nappe artificially, firstly with the water from<br />
the ‘‘ merjas” in the centre of the basin and secondly with water diverted in winter<br />
from a neighbouring “oued”. The method of recharge was by feeding the water into<br />
eight 10 x 5 >( 2.5 metre absorption basins in isotropic sandstones and into two pits<br />
each constructed by special engineering work on a natural fault.<br />
Whereas the total infiltration from the eight basins combined was 280 m3/hour, it<br />
was 350 m3/hour from one part and 370 m3/hour from the other. Thus the fissuring and<br />
karstiñcation of the aquifer have permitted of an economical solution of the problem<br />
of recharging the nappe in the conchitic limestones and sandstones (it was risen by<br />
15 metres in six years, and the perimetric springs began flowing again at the expected<br />
dates) and consequently of the problem of supplying Tangiers with water.<br />
A la fin de la guerre, en 1946,Tanger était alors un territoire international de 390 km2,<br />
dont la ville - avec une population de 92.000 habitants - et le port représentaient<br />
l’élément essentiel. Les conséquences de la guerre et le régime international ont pro-<br />
voqué une expansion extrêmement rapide de la ville qui a enregistré un accroissement<br />
annuel de la population de l’ordre de 776 entre 1949 et 1954.<br />
A partir de 1949, Tanger recevait la majeure partie de son alimentation en eau du<br />
bassin hydrogéologique de Chorf-el-Akab, exploité à raison de 3.000 m3/jour. Ce bassin,<br />
d’une superficie de 20 km2 est situé sur les bords de l’océan Atlantique, à 17 km au sud<br />
de Tanger. II est constitué de grès et calcaires coquilliers du Pliocène d’une puissance<br />
496
de 300 mètres reposant sur des argiles imperméables du Crétacé qui ceinturent également<br />
tout le bassin. Disposition originale, les grès pliocènes forment une ><br />
parfaite dont la seule alimentation naturelle est la pluie qui tombe .à la verticale du<br />
bassin. Une phase épirogénique fine-pliocène a plissé et relevé les grès et calcaires<br />
coquilliers sur toute la bordure, créant une zone très marquée de fracturation et fissuration,<br />
compliquée de phénomènes de karstification sous l’influence des eaux d’infiltration.<br />
En 1953, la consommation atteignait des pointes de 11.000 m3/jour en été. Ceci<br />
imposa une surexploitation des eaux souterraines du petit bassin de Chorf-el-Akab,<br />
ayant pour conséquence la rupture de l’équilibre entre l’alimentation naturelle de la<br />
nappe (1 M.m3/an) et son exploitation (3 M.ms/an). Ainsi s’amorça la chute du niveau<br />
hydrostatique et cette nappe qui était à la cote + 12 m au-dessus du niveau de la mer en<br />
1949 se retrouvait à -3 m au-dessous du niveau de la mer en 1954, soit une baisse de<br />
15 m en quatre ans. Entre-temps, les sources qui ceinturaient le bassin de Chorf-el-<br />
Akab avaient tari tour à tour. Le danger s’aggravait encore du fait de la proximité de<br />
la mer. En effet, parmi les sondages exécutés en 1948, trois forages avaient rencontré,<br />
dans le nord du bassin, des eaux saumâtres qui présentaient une certaine analogie avec<br />
l’eau de mer (résidu sec : 6 gil, dont 5 g/i de CLNa). C’était déjà l’indication d’une zone<br />
critique par où pouvait se faire l’invasion marine.<br />
Devant la chute rapide et alarmante du niveau hydrostatique de la nappe au-dessous<br />
du niveau de la mer, et afin de ne pas provoquer l’invasion et la contamination totale<br />
du bassin d’eau douce de Chorf-el-Akab par l‘eau de mer, des mesures sévères de<br />
restriction furent imposées à la ville, dès l’été 1954, pendant que des études de détail<br />
se déroulaient sur le territoire de Tanger et plus particulièrement sur le bassin de Chorfel-Akab.<br />
Ces études aboutissaient, en juin 1955, à la conclusion que, depuis cinq ans, le<br />
capital des ressources en eau souterraine du bassin de Chorf-el-Akab était dilapidé<br />
sans espoir de recopstitution naturelle. En conséquence, les restrictions à 8.000 ms/j<br />
à la consommation n’étaient qu’une mesure de caractère assez négatif. Des ressources<br />
nouvelles devaient être trouvées et l’alimentation artificielle de la nappe s’imposait.<br />
Une solution de secours, immédiate et provisoire, proposait l’injection des eaux<br />
d’hiver accumulées dans les deux merjas du bassin de Chorf-el-Akab, étendues d’eau<br />
temporaires alimentées par les pluies. Les premières injections d’eau de surface dans la<br />
nappe aquifère étaient effectuées dès novembre 1955.<br />
La solution définitive comportait l’adduction vers le bassin de Chorf-el-Akab, d’eau<br />
de surface en provenance de la rivière la plus proche, l’oued Mharhar qui écoule des<br />
débits d’hiver assez importants de novembre à mai et s’assèche entièrement durant les<br />
mois d’été. Au Chorf-el-Akab, une partie des eaux était dirigée sur Tanger et l’autre<br />
partie était injectée dans la nappe.<br />
Parallèlement à l’exécution de l’avant projet, un certain nombre d’interventions<br />
eurent lieu sur le bassin de Chorf-el-Akab. Une étude géologique et géophysique donna<br />
la certitude de la fermeture géologique complète du bassin aquifère, notamment vers le<br />
nord-ouest où une zone douteuse faisait craindre une possibilité d‘envahissement marin,<br />
à bas niveau de la nappe, ou une fuite de l’eau injectée vers la mer à haut niveau de la<br />
nappe.<br />
Un réseau de surveillance comprenant quatre double piézomètres fut installé entre<br />
les stations de pompage et !a mer: chaque double piézomètre a pour rôle de détecter<br />
l’envahissement marin par prélèvement d’échantillon d’eau au niveau de la nappe et<br />
surveiller la fluctuation du niveau d’eau. Ce réseau est complété par deux autres puits<br />
d’observation installés au centre du bassin. La recherche de la zone d’injection fut<br />
effectuée suivant plusieurs méthodes : injection dans les sources taries, injection dans<br />
un sondage, injection sur des fosses d’absorption creusées dans les grès et calcaires<br />
fissurés. Cette dernière méthode retiendra notre attention.<br />
497
La bordure orientale du bassin de Chorf-el-Akab avait été sélectionnée comme zone<br />
d’alimentation artificielle au vu des conditions naturelles; elle est évidemment située<br />
à l’amont hydraulique de la nappe; !es calcaires et grès coquilliers, roche-magasin de<br />
la nappe, y affleurent largement; ils sont fissurés, karstifiés, et présentent en surface des<br />
formes de lapiez; ils sont fracturés ( en grand n par !es mouvements tectoniques finepliocènes<br />
qui ont relevé à 45” les bords du bassin; les fractures ou failles sont parallèles,<br />
distantes de 50 à 100 m, orientées à l’ouest-sud-ouest, soit sensiblement en direction<br />
de l’écoulement de la nappe. Des essais d’absorption sur puits de 1 m x 1 m x 1,5 m<br />
creusés dans cette zone ont donné des absorptions de 400 l/h sous niveau constant.<br />
Cette perméabilité de 0,12 1/s par m”- sous une charge de 1,5 m était prometteuse, d’autant<br />
qu’elle représentait la perméabilité moyenne des calcaires et grès coquilliers homogènes<br />
en dehors des fissures ou fractures.<br />
Sur l’emplacement des puits d’essai ont été creusés, les fosses d’absorption alignées<br />
suivant une direction nord-sud perpendiculaire au sens d’écoulement de !a nappe et<br />
aux fractures et fissures des grès coquilliers. Cette disposition avait l’avantage d’augmenter<br />
la perméabilité moyenne des grès coquilliers en recoupant les fractures. D’après<br />
l’essai d’infiltration sur puits, si les grès étaient isotropes, il aurait fallu une surface<br />
d’infiltration de 900 m2 pour injecter l’eau des merjas au débit de 360 m3/h. Cela aurait<br />
représenté une fosse d’absorption théorique dont le fond aurait une surface de 90 m<br />
X 10 m, par exemple.<br />
Un bassin-pilote de 10 m x 5 m x 1,5 m a été creusé, à titre expérimental. L’absorption<br />
sous niveau constant y était de 25 m3/h au lieu de 20 m3/h calculés théoriquement<br />
d’après le premier essai. Certaines fissures avaient été recoupées mais aucune fracture<br />
ouverte ou faille n’avait été rencontrée au long des 10 mètres. Afin d’augmenter !a<br />
capacité d’absorption de ce bassin-pilote, il fut décidé d’accroître la profondeur dans<br />
le double but d’augmenter la hauteur d’eau, donc la pression, et de recouper des horizons<br />
plus poreux étant donné la stratification (< feuilletée >> des grès coquilliers. Un<br />
approfondissement à 2 m fut suivi d’un nouvel essai d’infiltration qui s’établissait à<br />
30 m3/h. Un nouvel approfondissement à 2,5 m, complété par un nouvel essai d’absorption<br />
à niveau constant portait le débit d’infiltration à 36 m3/h, soit 10 ils, soit pratiquement<br />
le double du débit théorique d’absorption. Mais après quelques jours d’essais,<br />
le débit d’infiltration diminuait à cause du colmatage du fond de la fosse par les matières<br />
organiques en suspension dans l’eau des merjas. I1 y fut remédié en recouvrant le fond<br />
d’une couche de sable de 0,20 m d’épaisseur. Ce sable pouvait être nettoyé, remué ou<br />
changé suivant les besoins. Ce procédé s’avéra très efficace.<br />
Après ces essais satisfaisants sur le bassin-pilote, il fut décidé de creuser dans le prolongement<br />
9 autres bassins ou fossesaux dimensions éprouvées de 10m x 5 m x 2,5 m. Ce<br />
dispositif de 10 bassins ( en série ) au lieu d’un bassin unique de 100 m x 5 m x 2,5 m<br />
offrait l’avantage d’une grande souplesse de fonctionnement de l’injection et du nettoyage<br />
du sable. Au cours des fouilles, deux failles ouvertes furent mises à jour, si bien<br />
que les fosses d’absorption furent limitées à huit au lieu des dix prévues initialement.<br />
Les deux autres fosses, contenant chacune une faille, firent l’objet d’un aménagement<br />
spécial qui avait pour but de protéger la faille contre tout colmatage par éléments solides<br />
plus ou moins grossiers.<br />
Les huit fosses d’aborption aménagées avec un tapis de sable infiltraient au total<br />
280 m3/h, soit 80 1/s. Les deux failles, après aménagement spécial, absorbaient respectivement<br />
350 m3/h, soit 97 1/s et 370 m3/h, soit 103 ljs. Ainsi, l’ensemble du système<br />
d’injection peut absorber au moins 24.000 m3/j, soit 1.000 m3/h, soit 280 I/s.<br />
Ainsi, Z’utilisation des propriétés naturelles des roches calcaires fissurées et karstifiées<br />
a facilité la solution aux moindres frais du problème posé par l’alimentation<br />
artificielle de la nappe, dont le facteur limitant est en général le débit d’absorption des<br />
terrains soumis a l’injection.<br />
Le processus de fonctionnement de cette nappe a été ainsi fixé :<br />
498
Durant t‘a période humide<br />
Les eaux superficielles sont prélevées sur un barrage au fil de l’eau. Ces eaux sont<br />
traitées et refoulées sur la ville de Tanger. Le complément est injecté dans le grès plio-<br />
cène. Durant cette période la nappe ne subit aucun prélèvement.<br />
Durant la période sèche<br />
Les eaux superficielles sont inexistantes. Seule la nappe du Chorf est exploitée pour<br />
la ville. Ainsi, la ville reçoit :<br />
u) La moitié de l’année, des eaux d’origine superficielle;<br />
b) L’autre moitié, des eaux d’origine souterraine.<br />
Cette nappe joue ainsi le rôle de réservoir souterrain accumulant, outre son alimen-<br />
tation naturelle, une partie des eaux superficielles injectées, qu’elle restitue en été.<br />
L’inexistence, l’impossibilité, le coût élevé d’exécution d‘un barrage de retenue, nous<br />
ont conduit à adopter une telle solution.<br />
C’est ainsi qu’il a été injecté :<br />
936.000 m3 en 1958-1959<br />
988.000 m3 en 1959-1960<br />
1.170.000 m3 en 1960-1961<br />
1.020.000 m3 en 1961-1962<br />
862.000 m3 en 1962-1963<br />
660.000 m3 en 1963-1964<br />
soit 5.600.000 m3, à raison de 10.000 m3/j maximum. Grâce à cette suralimentation de<br />
la nappe, en plus de son apport naturel (pluie), la ville de Tanger a pu être régulièrement<br />
alimentée, sans coupures. De plus, la nappe située à -3 m en 1958 est remontée jusqu’à<br />
+ 12 m, cote optimum d’exploitation et de sécurité. Signalons que les sources d’origine<br />
karstique qui ont tari en 1951 se sont mises à rejaillir dès 1963, conformément aux<br />
pronostics déduits des calculs.<br />
49 9
1.6<br />
Hydrologie karstique dans les roches volcaniques<br />
Karstic Hydrology in volcanic Terrains
GROUND WATER IN FRACTURED VOLCANIC ROCKS<br />
IN SOUTHERN ARIZONA (1)<br />
ABSTRACT<br />
L.A. HEINDL<br />
U.S. Geological Survey Arlington, Virginia, U. S.A.<br />
Fractured volcanic rocks, mostly andesitic flows of middle to late Tertiary age,<br />
provide only small to moderate amounts of water in southern Arizona. Their waterbearing<br />
potential is virtually untested, largely because adequate volumes of water are<br />
obtained from shallower and more easily drilled alluvial deposits. Nonetheless, andesitic<br />
flows underlie alluvium in many places and are untapped sources of ground water<br />
of usable quality.<br />
Wells in andesitic flows locally yield as much as 60 liters per second (1,000 gallons<br />
per minute), but yields are highly variable and cannot now be predicted, even within<br />
short distances. Yields from volcanic rocks undoubtedly come from interflow breccias<br />
and primary voids, as well as fractures, but the proportion of water yielded by each<br />
type of opening is unknown, and the combined yields are considered here to represent<br />
the water-bearing potential of fractured volcanic rocks.<br />
Fractured volcanic rocks in the basin-and-range country of southern Arizona also<br />
underlie areas of recharge in the mountains and act as conduits to transmit water to<br />
ground-water reservoirs in the alluvium of the basin fill or in the permeable volcanic<br />
rocks buried by or interbedded with the alluvium.<br />
To encourage development of ground water in fractured volcanic rocks, criteria<br />
are needed to identify, map, and project the fractures to below the surface. Determination<br />
of the relationship of permeability to mode and environment of extrusion and<br />
deposition, and to subsequent deformation and erosion, offer the principal means for<br />
meeting these needs.<br />
RESUME<br />
Les eaux souterraines dans les roches vo fcaniques fissurées de l’Arizona méridional<br />
Dans l’Arizona méridional, les roches volcaniques fissurées - constituées pour la<br />
plupart d’andésites datant du milieu ou de la fin de l’ère tertiaire - ne fournissent<br />
que de faibles ou modestes quantités d’eau, surtout parce que l’eau est obtenue en<br />
abondance des roches volcaniques et des couches d’alluvions moins profondes et plus<br />
faciles à forer. Cependant, sur de vastes étendues, les coulées andésitiques sont recou-<br />
vertes de dépôts d’alluvions et représentent à tout le moins des sources locales inexploi-<br />
tées d’eau souterraine dans les bassins d’entremont.<br />
Les andésites de la région fournissent jusqu’à 60 litres d’eau par seconde (1.000 gal-<br />
lons par minute), mais les débits sont très variables et défient toute prévision, même<br />
sur de courtes distances. On ignore quelle proportion de ce débit est due à l’existence<br />
de brèches entre les conduits.<br />
Les roches volcaniques fissurées influent sur le mouvement des eaux souterraines<br />
dans les couches d’alluvions des bassins d’entremont du fait qu’elles se trouvent au-<br />
dessous des zones de recharge, qu’elles servent de conduits, à la surface ou au-dessous,<br />
amenant les eaux dans les réservoirs alluviaux souterrains, et qu’elles consituent lorsque<br />
leur perméabilité est faible, des barrières souterraines et des barrages de dérivation.<br />
Pour encourager l’exploitation des eaux souterraines dans les roches volcaniques<br />
fissurées, il faut établir des critères permettant de déterminer la perméabilité et sa<br />
répartition au-dessous des autres dépôts. L’étude du mode d’extrusion et de dépôt,<br />
du milieu dans lequel ceux-ci se sont opérés et de la déformation ultérieure est le<br />
principal moyen pour établir ces critères.<br />
(I) Publication authorized by the Director, United States Geological Survey.<br />
503
INTRODUCTION<br />
Volcanic rocks of many types are exposed extensively in the western part of the<br />
United States and yield small to large volumes of water to wells locally. These rocks<br />
have not been exploited extensively for water, except where no other source is available,<br />
because they are not considered to be reliable aquifers and because adequate volumes<br />
of water are obtained from shallower and more accessible and easily drilled alluvial<br />
deposits. Their reputation for unreliability results largely from our present inability<br />
to predict the distribution of fractures, and thus of well yields, of even closely spaced<br />
wells. Nonetheless, volcanic rocks, and particularly fractured flows, represent at<br />
least local potential sources of ground water. This report summarizes the general<br />
conditions under which water occurs in fractured volcanic rocks in southern Arizona<br />
and suggests guidelines for further investigation of the potential productivity of these<br />
rocks.<br />
COLORADO<br />
PLATEAUS<br />
PROVINCE<br />
PROVtNCI<br />
Fig. 1 - Index map of Arizona showing physiographic boundaries and area of report<br />
(stippled).<br />
Southern Arizona is in the Basin and Range physiographic province and consists<br />
of roughly sub-parallel chains of mountain ranges and intermontane basins (fig. 1).<br />
In general, the basins in southern Arizona are more extensive than mountain ranges,<br />
in places two or three times as extensive (fig. 2). The mountains are composed mostly<br />
of Precambrian and Mesozoic granitic and metamorphic rocks, Precambrian and<br />
Paleozoic sedimentary rocks, and Mesozoic and Tertiary volcanic and indurated<br />
alluvial rocks. The basins are filled iargely with Tertiary and Quaternary alluvial<br />
504
material, which locally is interbedded with volcanic deposits that are generally younger<br />
than those exposed in the mountains. The fill in the central parts of the basins may be<br />
nearly 1,ûûû meters thick. In some basins, isolated hills of bedrock stand above<br />
the alluviated valley floors, and in a few basins, all or large parts of the valley floor<br />
are composed of volcanic rocks which overlie or are interbedded with alluvial deposits.<br />
Fig. 2 - Relief map of part of southern Arizona showing general distribution of<br />
ranges and basins. (Outlined area is Papago Indian Reservation.)<br />
The potential importance of water in volcanic rocks stems from the dependence<br />
of southern Arizona on ground water. About two-thirds of Arizona’s water needs is<br />
now supplied by ground water. The rates of decline of water levels, and of ground-<br />
water in storage, of the past few years, based on the analysis of declines in the most<br />
heavily pumped areas, are predicted to continue for at least the next few years (White and<br />
others, 1964). Almost all ground water is supplied by the most widely distributed rock,<br />
the alluvium in the intermontane basins, and locally, the overdevelopment of these<br />
aquifers is severe. The second most widely distributed rock of potentially moderate<br />
to large water-yielding capabilities is fractured volcanic flows of middle to late Tertiary<br />
and Quaternary age. The other principal types of rocks in southern Arizona are nearly<br />
impermeable or only of local significance as aquifers.<br />
DESCRIPTION AND GEOLOGIC SETTING<br />
Although nearly all types of volcanic rocks-flows, tuff, agglomerate, and breccia-<br />
yield some water somewhere, the discussion here is limited to water in fractured and<br />
brecciated andesitic flows, because in southern Arizona they are the second most<br />
extensive aquifers. The Aows generally are andesitic, but some are latitic or basaltic.<br />
Individual flows range in thickness from about 1 to 20 meters, but usually are 5 to<br />
505
10 meters thick; they may be in sequences from a few to about 500 meters thick.<br />
Typically the flow rocks are brecciated and fractured, particularly along their upper<br />
and lower surfaces, but hexagonal fracturing resulting from cooling is rarely prominent.<br />
At the present time the effects of voids and cavities, brecciation, and fracturing cannot<br />
be separated in evaluating the water-bearing potential of large masses of these flows,<br />
mainly because most of the data regarding their water-bearing characteristics are<br />
reported in summary terms by drillers and well owners. However, available data are<br />
adequate to indicate that the flow rocks have permeabilities that range from low to<br />
very high and that the permeability may change markedly within short distances,<br />
both vertically and horizontally. In some places, well fractured flows are dry because<br />
the fractures and cavities are not interconnected.<br />
Andesitic flows cap or form a large part of many ranges in southern Arizona.<br />
Their appearance is so uniform over so many tens of thousands of square miles, that<br />
it is easy to think of them as remnants of a widespread volcanic plateau, similar to,<br />
but smaller than, that of the Columbia and Dekkan fields. However, in southern<br />
Arizona the flows came from many separate centers and at different times. and pro-<br />
bably never were continuous over the region. Rather, they originated as small shield<br />
or composite volcanoes, whose margins may or may not overlap, and in thick sequences<br />
built up within the confines of broad, deep valleys. (For examples, see Anderson and<br />
Creasey, 1958; Gilluly, 1946; Heindl, 1963; Twenter, 1963.) As a result, the thicknesses<br />
of volcanic sequences may differ considerably, and adjacent areas of flows may be<br />
different depositional units.<br />
The original form of the volcanic deposits has been modified in turn by structural<br />
deformation and erosion. They have been folded, mostly into broad shallow folds,<br />
and ruptured, mostly along normal faults. Those volcanic depostis elevated to form<br />
topographic highs have been eroded deeply, and those depressed into the basins have<br />
been buried. The volcanic rocks that are contemporaneous and interbedded with, or<br />
younger than, the basin fill are much less affected by deformation and erosion.<br />
Where the fractured volcanic rocks are buried by or interbedded with the saturated<br />
basin alluvium, they may be in hydraulic continuity with the alluvium. Depending on<br />
relative permeability, water may move either from or into the volcanic rocks, or, as<br />
has been shown in one area (Heindl and McCullough, 1961), the water may move back<br />
and forth between volcanic and alluvial rocks, depending on down-gradient changes<br />
in permeability.<br />
This brief description presents the main elements by which the ground-water<br />
characteristics of the volcanic rocks are categorized in the following section as to their<br />
potential value as aquifers and as to the desirability for their exploration and further<br />
investigation.<br />
GROUND-WATER CHARACTERISTICS BY TOPOGRAPHIC SITUATIONS<br />
The ground-water characteristics of fractured andesitic flow rocks in southern<br />
Arizona are here categorizsd on the basis of their topographic situations, and examples<br />
are described briefly. The ground-water characteristics are given on the assumption<br />
that the sequences of flows have fairly uniform “formational” permeabilities, although<br />
these may differ considerably from the “rock” permeability at any particular site.<br />
The chemical quality of water in volcanic rocks is not discussed because available<br />
records indicate the chemical quality is generally uniform. Water from volcanic rocks<br />
commonly contains about 300 to 600 parts per million of dissolved solids, and the<br />
principal objectionable constituents are fluoride (commonly greater than 1 part per<br />
million) and silica (commonly greater than 20 parts per million).<br />
506
A. Volcanic flows irr mountain ranges<br />
1. In eroded remnants high in the ranges; no continuity with basin alluvium;<br />
(see A-1, fig. 3).<br />
a) Largely areas of recharge and nearly immediate discharge; small wet-weather<br />
springs or seeps at or near base of volcanic sequence, at interfaces between successive<br />
flows, or at some fracture intersections; potentially poor aquifer.<br />
F.’]<br />
PERMEABLE ALLUVIUM ,<br />
1<br />
PERMEABLE FRACTURED ______<br />
VOLCANIC ROCK<br />
GENERALLY IMPERMEABLE<br />
ROCK<br />
TOP OF SATURATED ZONE<br />
Fig. 3 - Diagrammatic sketches showing relationship of topographic situation of<br />
fractured rocks to the occurrence of ground water.<br />
507
) Examples are numerous. Table Top Mountain, Pinal County, stands about 600<br />
meters above the surrounding valleys. The mountain is composed largely of granite<br />
and schist, and is capped by volcanic flows which are about 150 meters thick and cover<br />
an area nearly 5 square kilometers. Small seeps are marked by patches of vegetation<br />
that remain green after the rest of the mountainside has turned brown or gray. Another<br />
example is Black Mountain near Tucson, Pima County, which stands about 300 meters<br />
above the surrounding piedmont slope. Black Mountain is a fault block about 3 kilo-<br />
meters long and 0.5 kilometer wide. It consists mainly of about 150 meters of volcanic<br />
flows resting on consolidated, poorly permeable conglomerate which is older than the<br />
alluvium of the basin fill. Wet-weather springs are localized along the base of the<br />
volcanic flows by small transverse faults. The volcanic flows and associated dikes<br />
are aquifers where they are encountered below the alluvium and the water table in<br />
adjacent areas. Locally these volcanic rocks yield small quantities (1 to 10 liters per<br />
minute) to domestic and stock wells (Heindl and White, 1965).<br />
2. In eroded remnants that pass beneath the basin alluvium. (See A-3, fig. 4j.<br />
u) Form areas of recharge in mountains and transmit water to below water table;<br />
depending on structural relationship and extent, they may or may not be a usable<br />
aquifer.<br />
b) Many examples, including Vaca Hills and Mesquite Mountains, Pima County,<br />
and west side of Vekol Mountains, Pinal County. The nothern of the two Vaca Hills<br />
is capped by about 50 meters of vesicular and fractured volcanic flows which dip north<br />
and pass under the valley fill. A weil 6 kilometers west of the Mesquite Mountains<br />
obtains water from lava at a depth of about 160 meters below the surface and about<br />
30 meters below the base of the alluvium.<br />
3. Constitute a large proportion of the range and pass under the alluvium. (See B,<br />
fig. 5).<br />
a) Form large areas of recharge and transmit water to saturated zone; potentially<br />
a usable aquifer.<br />
b) Many examples, including Ajo Range and Sikort Chuapo and Batamote<br />
Mountains, Pima County, and the mountains flanking Eagle Creek, Greenfee County.<br />
At least 6 test holes were drilled generally within about 300 meters of each other<br />
in the alluvial fill along Eagle Creek. Andesitic flows were penetrated at depths of 60<br />
to 100 meters. Hot water (ranging from about 48 “C to 56 “C) under artesian pressure<br />
rose to within a few meters of the surface or flowed at low rates. When tested with<br />
pumps, the wells yield from about 10 to 60 liters per second. However, a long-term<br />
(6 months) pumping test by C. F. Tolman in 1939 is reported to indicate that the aquifer<br />
had a “safe yield” of only about 60 liters per second. Detailed records of the test are<br />
not accessible to determine what was meant here by the term I‘ safe yield. ” In Bonita<br />
Creek, Graham County, about 30 kilometers east of Eagle Creek, the volcanic rocks<br />
in the basin have supplied the city of Safford with about 100 liters per second for many<br />
years (Heindl and McCullough, 1961). This water, however, is not obtained directly<br />
from volcanic flows; instead, it is obtained from shallow and narrow channel deposits<br />
which partly fill a canyon cut into the volcanic rocks. The water moves into the channel<br />
fill because a local barrier in the volcanic rocks, possibly an impermeable fault zone,<br />
prevents the water from continuing downgradient in the volcanic rocks.<br />
B. Volcanic flows in basins<br />
1. Widespread flows and related features (cinder cones) at surface; (see A-2, fig. 6).<br />
a) Form large areas of recharge; transmit water readily to water table; may or<br />
may not be an aquifer depending on whether the sequence is thick enough to be below<br />
saturated zone.<br />
508
) San Bemadino Valley, Cochise County, includes about 450 square kilometers of<br />
volcanic flows and cinder cones at the surface. Alternating beds of volcanic and alluvial<br />
deposits locally are at least 300 meters thick. The water is under sufficient artesian<br />
pressure locally to flow at rates of as much as 6 liters per second, but generally the water<br />
levels are from less than 50 to nearly 300 meters below land surface, A second, and<br />
somewhat different example, is that of the Sentinel flows in Maricopa County. These<br />
flows occupy about 650 square kilometers, but they apparently lie above the water<br />
table and do not yield water to any known wells.<br />
2. Restricted exposures in small hills standing above basin fill.<br />
u) Isolated hills are exposed parts of sequences of volcanic deposits intercalated<br />
with surrounding alluvium. (See C, fig. 3). Buried volcanic deposits probably are<br />
recharged largely from basin fill and may form potentially useful aquifers. In the broad<br />
valley known as the Dateland-Hyder area, along the boundary between Maricopa and<br />
Yuma Counties, sequences of volcanic flows intercalated with alluvial deposits range<br />
in thickness from about 100 to 400 meters and are at different depths below the surface<br />
to a maximum of 700 meters. Exposures of volcanic rocks in adjoining mountains are<br />
widespread and of different ages, but only 4 or 5 small hills in a valley area of about<br />
1,200 square kilometers hint at the presence of buried volcanic rocks. Yields from wells<br />
range from about 60 to 150 liters per second. The amounts contributed separately by<br />
the volcanic rocks and the intercalated alluvial deposits are not known. However,<br />
the fact that yields from wells that penetrate volcanic flows commonly are slightly<br />
greater to roughly twice as great as those from the alluvium alone suggests that the<br />
buried volcanic flows are aquifers. (Summary based on well data compiled by<br />
W. G. Weist, Jr., U. S. Geological Survey, Tucson, Arozina.)<br />
b) Isolated hills are exposed parts of small fault blocks or slivers. (See D, fig. 3).<br />
Such blocks of volcanic rock may or may not be in hydraulic continuity with alluvium,<br />
depending to some extent on permeability of fault gauge and degree of fracturing along<br />
the fault plane; may be a questionable or highly localized aquifer. In the central part<br />
of the lower San Pedro River basin in Pinal County, three small volcanic hills, all less<br />
than one square kilometer in extent, are in fault, or probable fault, contact with the<br />
alluvial deposits of the basin. The volcanic rocks are fractured and interflow contacts<br />
are brecciated and apparently porous. These rocks could be sufficiently permeable to<br />
transmit water, but no wells have been drilled into them.<br />
c) Isolated hills are exposed parts of volcanic sequences which may or may not be<br />
exposed in adjacent ranges. The buried volcanic rocks are in hydraulic continuity with<br />
the alluvium beneath which they are buried. The adequacy of volcanic rocks as aquifers<br />
in this situation depends largely on their extent. Several examples of this situation are<br />
known, such as in the upper Hickiwan and upper La Quitani Valleys of Pima County;<br />
the outstanding example is Childs Valley, generally north and east of Ajo. Ajo is a<br />
copper mining center, and its operations require large volumes of water for mine,<br />
mill, smelter, and municipal purposes. For 40 years nearly all of the supply has been<br />
from wells about 6 kilometers north of Ajo. Early in the century. a shaft was sunk to<br />
a depth of about 230 meters into andesitic flows and breccias, which lie beneath about<br />
60 meters of alluvium. Drifts branched out from the bottom of the shaft, which was<br />
at the water level of that time, to collect water moving through the brecciated volcanic<br />
rock. When the water level threatened to drop below the bottom of the drifts, a well<br />
was drilled in the bottom of the shaft to a depth of about 410 meters. Subsequently,<br />
300-meter deep wells were drilled from the surface to tap the same volcanic aquifer,<br />
but the principal production continued from the “shaft well,” at least to 1956, the last<br />
year for which a report is available. Between 1913 and 1956. the water level had dropped<br />
13 meters. In 1956, the well field produced 24 cubic meters per minute. In the past<br />
509
decade, operations at the mine and the population of Ajo have expanded, and the<br />
pumpage now probably is in the order of about 30 cubic meters per minute.<br />
C. No exposures of uolcanic rocks in basin. (See E, f;g. 3).<br />
a) No example of this type in southern Arizona. Every large basin has at least a<br />
few exposures of volcanic rocks around its perimeter. Salt River valley, centering on<br />
Phoenix, is one of the largest in the region and perhaps has the fewest volcanic exposures<br />
along its margins. No wells in the central part of the basin have reached bedrock,<br />
although many wells are as much as 700 meters deep. Nonetheless, the possibility<br />
of buried volcanic flows at greater depths is geologically sound, and if volcanic flows<br />
are encountered, they may be expected to have water-bearing characteristics that are<br />
determined by the degree of fracturing and the degree of hydraulic continuity with the<br />
overlying alluvium.<br />
“ FORMATIONAL ” PERMEABILITY AND TRANSMISSIBILITY<br />
The nature of the deposition of volcanic flows results in a high degree of anisotropy<br />
of permeability. Voids and zones of brecciation tend to be aligned both parallel and<br />
transverse to the direction of flow. However, the directions of flows in many places<br />
depart widely from the basic radial pattern around a volcanic center or from the basic<br />
linear pattern of down a valley or across a plain. Transmissibilities of sequences of<br />
flows also vary considerably within short distances, because of the general thinning<br />
of volcanic piles away from their sources and the intercalation of deposits of sedi-<br />
mentary, pyroclastic, and much less permeable extrusive rocks. Furthermore, in many<br />
places, younger dikes and faults may block off large volumes of the sequences of flows<br />
into compartments, which have little or no hydraulic continuity. In spite of wide<br />
local variations in permeability, transmissibility, and hydraulic continuity, large areas<br />
of fractured volcanic flows in southern Arizona may be considered to have reasonably<br />
uniform “formational” permeabilities and transmissibilities. These formational<br />
hydraulic characteristics are the “average” of great local differences of lithologic and<br />
hydraulic characteristics, and it is not only useful but necessary to consider the water-<br />
bearing potentialities of volcanic rocks in terms of formational rather than local<br />
characteristics.<br />
The “formational” permeabilities of the volcanic rocks discussed in this paper,<br />
and their abilities to transmit water, seem to be generally high. Although no quanti-<br />
tative estimates of permeability can be made on the basis of local pumping tests,<br />
evaluations and estimates of permeability can be made on the basis of observations<br />
of surface characteristics and water-level configurations and from records of pumpage<br />
and water-table declines. The description and examples given here are no doubt of<br />
rocks whose permeabilities are higher than average, and equally favorable permeabilities<br />
cannot be expected everywhere fractured volcanic rocks are water-bearing.<br />
The mountains along the western boundary of the Papago Indian Reservation<br />
(fig. 2) are made up mostly of fractured and brecciated andesitic flows. In these<br />
mountains, there are practically no secondary tributaries to the main stream channels,<br />
which are consequent on the dip slopes. Runoff after a rain is concentrated in the main<br />
channels and overland flow is minor. The rainfall apparently percolates downward<br />
almost immediately and moves along the top of less permeable zones to be discharged<br />
along the stream channels almost as immediately. After a storm, the volcanic rocks<br />
drain noticeably for only a few minutes or a few hours. Even reliable wet-weather<br />
springs and seeps are rare because the volcanic rocks apparently release the water as<br />
rapidly as they absorb it.<br />
510
Movement of water through these volcanic rocks can be so rapid as to be seen and<br />
heard. Workers at the “shaft-well’’ near Ajo (described in preceding section, item<br />
B-2-c) report that the movement of water could be watched before the water level<br />
dropped too far below the floor of the shaft; and in 1956, when the water level was 13<br />
meters below the level of the floor of the shaft, the water in the well could be heard<br />
gurgling merrily.<br />
These observations suggest permeability as high as or higher than that of the alluvial<br />
deposits of the intermontane basins, and, in some places the water tables in adjoining<br />
valleys appear to be so concordant as to suggest that the volcanic mountains between<br />
them are acting as conduits rather than barriers. In other places, the water table in<br />
alluvial and volcanic rocks in the same valley appear to be concordant.<br />
Concordant water tables on opposite sides of a range composed of volcanic rocks<br />
occur in the southwestern part of the Papago Indian Reservation (fig. 2). The mountains<br />
along the western boundary are made up mostly of fractured and brecciated andesitic<br />
flows. These flows are interbedded with thinner units of less fractured volcanic deposits<br />
and lenses of consolidated alluvium. The volcanic sequences rest on much less per-<br />
meable bedrock composed of metamorphosed sediments, gneiss, and granite or quartz<br />
monzonite. The less permeable bedrock units, in turn, make up most of a chain of<br />
mountain ranges, which are roughly 50 kilometers east of the mountains along the<br />
boundary. Between the two chains of mountains is a third chain of small ranges, com-<br />
prised mostly of the Gu Vo Hills and the Mesquite Mountains. This third chain of<br />
mountains is composed mostly of permeable andesitic flows. The two basins between<br />
the three chains contain alluvium that is at least 210 meters thick where it has been<br />
penetrated by wells. Although the two basins are nearly completely separated from each<br />
other by the chain of mountains between them, the water table in their alluvial deposits<br />
is almost concordant. In an area of about 1,200 square kilometers, the water table in<br />
the period of 1956-1958 lay between altitudes of 450 and 475 meters and had east-west<br />
and north-south gradients of about 5 and 1 meters per kilometer respectively. In the<br />
absence of firm evidence for an effective barrier which may hold up the water levels,<br />
it seems illogical to accept such a configuration of the water table, unless water were<br />
able to move as freely through the rocks of the mountains between the valleys as it<br />
did through the alluvium itself. The transmissibility of a saturated thickness of 200<br />
to 300 meters of alluvium is on the order of 100 cubic meters per day per meter. In that<br />
the saturated thickness of the flows in the Gu Vo Hills is estimated to be about 100<br />
meters, it seems reasonable to assume that their formational permeability is at least<br />
that of the adjacent alluvium.<br />
An example of concordant water levels in volcanic and alluvial rocks is in Ajo<br />
Valley. Wells drilled about 2 kilometers south (upgradient) and 2 kilometers north<br />
of the “shaft well” penetrate alluvium to depths of 342 and 200 meters, respectively.<br />
In contrast, the alluvium in the “shaft well” between them is only about 60 meters<br />
thick. The gradient between the south and shaft wells is about 5 1/2 meters per kilometer<br />
and that between the shaft and north wells is about 4 meters per kilometer. The general<br />
concordance of gradients here again suggests a similarity between the permeability<br />
of the alluvial and volcanic aquifers in this valley.<br />
Additional indication of the permeability of the volcanic aquifer in Ajo Valley<br />
is obtained from the pumpage records. These indicate that about 100,000,000 cubic<br />
meters were pumped and that the water table declined about 13 meters between 1913<br />
and 1956-or a yield of about 8,000,000 cubic meters of water per meter of water-table<br />
decline. These data indicate a far greater yield than that from volcanic rocks underlying<br />
Bonita Creek (item 3-b), where specific capacity was estimated to be the equivalent<br />
of about 5 liters per minute per meter of drawdown (Heindl and McCullough, 1961),<br />
or that from the volcanic rocks underlying Eagle Creek (item 3-b), whose “safe yield I’<br />
reportedly was calculated to be about 60 liters per second.<br />
51 1
These notes indicate both the high local potential fractured volcanic rocks have as<br />
local sources of water and the wide variability the same sequence may have in its<br />
water-bearing characteristics. Probably no amount of hydrologic, hydraulic, and<br />
statistical analysis of even much more information than we now have will preclude<br />
the drilling of “ dry” holes within short distances of good producers or the drilling of<br />
a successful well after a discouraging number of failures. Nonetheless, certain types of<br />
information could aid greatly in providing a basis for locating test holes whose chances<br />
of success are favorable.<br />
1. Mapping of patterns of alignments of voids, breccia, and fractures as a basis<br />
for determining direction of the flow of lava, and thus a part of the pattern of distri-<br />
bution of water-bearing Characteristics.<br />
2. Mapping of volcanic units-or sequences of similar units-on the basis of<br />
hydrologic rather than stratigraphic criteria; that is, mapping potential aquifers rather<br />
than formation.<br />
3. Mapping the structural deformation and consequent or related erosion, particu-<br />
larly to identify evidence that will indicate the geometry of the deposits where they are<br />
buried beneath the alluvium of the basins.<br />
4. Development of an integrated environmental history of deposition, deformation,<br />
and erosion of the potential volcanic aquifers. This is the basic hypothesis upon which<br />
projections and predictions are made.<br />
5. Projection of patterns of distribution of permeability and transmissibility and<br />
the effects of structural deformations and erosion, as exposed in the hills and mountains,<br />
into the adjacent alluviated basins.<br />
6. Use of available subsurface information to modify and refine projections of the<br />
geometry of the buried deposits and their water-bearing characteristics. Subsurface<br />
information should be interpreted in conjunction with the integrated history, which<br />
may be modified as subsurface data are accumulated.<br />
7. Geophysical information should be used only after a thorough synthesis of<br />
surface and subsurface information.<br />
8. Test holes, finally, are needed to substantiate predictions and projections and<br />
to provide firm data regarding the water-bearing characteristics and the quality of<br />
water. Evaluation of test holes should be made with due regard for the possibility<br />
that any one test hole may not be an adequate test of the “formational” hydraulic<br />
characteristics.<br />
Use of a simplified version of this rationalized approach to exploration and evalu-<br />
ation of ground-water supplies in volcanic rocks has resulted recently in the develop-<br />
ment of successful water supplies for the villages of Kaka and Hotosan Vo on the<br />
Papago Indian Reservation. At both villages, the water was developed in volcanic<br />
rocks below moderate thicknesses of alluvium in basins where no hydrologic infor-<br />
mation, other than that deduced from the geologic features exposed in the adjacent<br />
mountains, was available within several kilometers. At both sites, bailing tests indicated<br />
a minimum yield of about 2 liters per second with no apparent drawdown, an amount<br />
sufficient for the domestic and stock requirements of each village. In both instances,<br />
the water levels in the volcanic rocks were concordant with those of the adjacent or<br />
nearby alluvial basins.<br />
512
REFERENCES CITED<br />
ANDERSON, C.A., and CREASEY, S.C., 1958. Geology and ore deposits of the Jerome<br />
area, Yavapai County, Arizona. 185 p. (U.S. Geol. Survey Prof. Paper 308).<br />
GILLULY, James, 1946. The Ajo mining district, Arizona. 112 p. (U.S. Geol. Survey<br />
Prof. Paper 209).<br />
HEINDL, L.A., 1963. Cenozoic geology in the Mammoth area, Pinal County, Arizona.<br />
41 p. (U.S. Geol. Survey Bull. 1141-E).<br />
HEINDL, L.A., and COSNER, O.J., 1961. Hydrologic data and drillers’ logs, Papago<br />
Indian Reservalion, Arizona, with a section on chemical quality of the water by<br />
L.R. Kister. 116 p. (Ariz. State Land Dept. Water Resources Rept. no. 9).<br />
HEINDL, L.A., and McCullough, R.A., 1961. Geology and availability of water in<br />
the lower Bonita Creek area, Graham County, Arizona. (U. S. Geol. Survey Water-<br />
Supply Paper 1589).<br />
HEINDI., L.A., COSNER, O. J., PAGE, H. G., ARMSTRONG, C.A., and KISTER, L.R.,<br />
1962. Summary of Occurrence of ground water on the Papago Indian Reservation,<br />
Arizona. (U.S. Geol. Survey Hydro1 Atlas 55).<br />
HEINDL, L.A., and WHITE, N.D., 1965. H,ydrologic and drill-hole data, San Xavier<br />
Indian Reservation. and vicinity, Pima County, .. Arizona. 48 v. - (Ariz. . State Land<br />
Dept. Water-Resources Rept. 2Ó).<br />
TWENTER, F. R., 1961. Miocene and Pliocene history of central Arizona. In: Geological<br />
Survey Research 1961, Art. 205, U.S. Geol. Survey Prof. Paper 424-C, p. C-153-<br />
C-156. - .._.<br />
WHITE, N.D., STULIK, R.S., and RAUH, C.L., 1964. Effects of ground-water withdrawal<br />
in part of central Arizona projected to 1969: 22 p. (Arizona State Land Dept.<br />
Water-Resources Rept. 16).<br />
513
1.7<br />
Exploit ahon<br />
Exploitation
SUMMARY<br />
HYDROGEOLOGlCAL PROBLEMS<br />
IN THE KARST COASTAL AREA<br />
Jordan VELIMONOVI6 and Vlaàan CUBRAKOVI6<br />
The Institute for Geological and Geophysical Research, Beograd<br />
The complex hydrogeological investigations performed to solve the problem of<br />
water supply have been carried out at several localities in the coastal karst for the last<br />
ten years.<br />
The problems refering to mixing of salt and fresh waters, their hydrodynamic<br />
relation and the influence of pumping regime on their mutual relation had to be solved.<br />
This paper deals with the methodology of hydrogeological investigations with<br />
special regard to the results obtained by test exploratory pumping at some particular<br />
localities.<br />
RESUME<br />
PROBLÈMES HYDROGEOLOGIQUES<br />
DE LA RÉGION COTI&RE KARSTIQUE<br />
Jordan VELIMONOVId et Vlaàan CUBRAKOVIe<br />
Institut de recherches géologiques et géophysiques de Belgrade (Yougoslavie)<br />
Au cours des dix dernières années, des recherches hydrogéologiques complexes<br />
ont été faites en plusieurs points de la région karstique côtière pour résoudre la question<br />
de I’approvisionnement en eau.<br />
I1 s’agissait de résoudre les problèmes relatifs au mélange des eaux salée et douce<br />
àleur relation hydrodynamique et aux effets du pompage sur leurs rapports réciproques.<br />
Cet article traite des méthodes de recherches hydrogéologiques et étudie tou<br />
spécialement les résultats obtenus par les tests de pompage dans certains emplacement<br />
517
EXPLOITATION DES EAUX SOUTERRAINES ET<br />
BILAN HYDRIQUE DANS LES CALCAIRES DE TUNISIE<br />
RÉSUMÉ<br />
Gilbert CASTANY<br />
Les études hydrogéologiques poursuivies ces dernières années dans les massifs calcaires<br />
du Chenata, Zaghouan, Bent Saïdane et Bargou en Tunisie et l’exploitation des<br />
eaux souterraines pour l’alimentation en eau d’agglomérations urbaines, permettent de<br />
dégager quelques principes généraux sur leur alimentation et leur bilan hydrologique.<br />
La méthode d’exploitation, utilisant la structure hydrogéologique comme réservoir<br />
d’accumulation souterrain naturel, apporte également une contribution importante<br />
à l’exploitation rationnelle des eaux souterraines en pays calcaires.<br />
Le calcul du bilan établi par J. TIXERONT et E. BERKALOFF est basé SUT la détermination<br />
de la hauteur de précipitation, le débit d’exploitation et la reconstitution des réserves<br />
évaluées d’après le débit des sources ou l’observation de la cote du plan d’eau. La<br />
capacité d’emmagasinement par tranches de couche calcaire a pu être déterminée.<br />
Au Djebel Bargou, M. ZeBIDr a utilisé une méthode plus générale, basée sur le calcul<br />
de l’évapotranspiration, du ruissellement et de l’infiltration.<br />
SUMMARY<br />
Exploitaiion of underground water and hydrological balance of the calrareous massifs<br />
of Tunesia<br />
The hydrogeological studies pursued of late years in the Chenata, Zaghouan, Bent<br />
Saïdane and Bargou calcareous massifs in Tunesia and the development of their ground-<br />
water for the supply of urban communities enable certain general principles to be<br />
stated regarding their recharge and hydrological balance.<br />
The method of exploitation, using the hydrogeological structure as a natural under-<br />
ground storage reservoir, is also an important contribution to the sound management<br />
of groundwater in limestone country.<br />
The estimate of the water balance worked out by 5. Tixeront and E. ,Berkalof€ is<br />
based on the determination of the heigih of rainfall, the volume of extractions and,the<br />
restoration of the reserves estimated from spring discharge or observation of the height<br />
of the water table. It has proved possible to calculate the storage capacity per section<br />
of limestone bed. In the Djebel Bargou, Mr. Zebidj has used a more general method<br />
based on the calculation of evapotranspiration, surface runoff and infiltration.<br />
L’exploitation rationnelle, depuis plusieurs années des eaux souterraines de quelques<br />
massifs calcaires de Tunisie, reposant sur l’étude géologique et hydrologique régionale<br />
détaillée, a permis d’établir des bilans hydriques et d’évaluer les ressources en eau.<br />
Les travaux réalisés sont un exemple de régularisation des ressources eneau par l’utilisation<br />
des structures hydrogéologiques comme réservoirs souterrains naturels.<br />
Nous exposerons ici les résultats des études de J. TIXERONT et E. BERKALOFF concernant<br />
ies massifs calcaires des djebels Chennata, Zaghouan et bent Saïdane et de<br />
H. ZEBIDI relative au Bargou. Les trois derniers appartiennent à la même zone climatique<br />
et structurale de l’Atlas tunisien oriental au S.E. de Tunis.<br />
DJEBELS CHENNATA, ZAGHOUAN et BENT SAIDANE<br />
J. TIXERONT et E. BERKALOFF ont étudié le bilan hydrique des massifs calcaires du<br />
Chennata, Zaghouan et bent Saìdane dont les eaux souterraines alimentent les villes<br />
de Bizerte et de Tunis.<br />
51 8
Cadre hydrogéologique<br />
La structure hydrogéologique et les données sur la roche magasin de ces massifs<br />
calcaires sont bien connues par des études géologiques détaillées. Le bassin des eaux<br />
souterraines (bassin hydrogéologique), correspondant au bassin versant des eaux de<br />
surface (bassin hydrographique), est nettement délimité par la stratigraphie et la tec-<br />
tonique. L’alimentation naturelle du réseau aquifère s’effectue uniquement par les<br />
précipitations sur l’impluvium direct (pluie et neige). Le djebel Chennata, formé de<br />
calcaires du Sénonien, présente un impluvium de 1,8 km2. Un forage situé B l’amont<br />
des captages permet de suivre les variations du plan d’eau. Au djebel Zaghoan ce sont<br />
les calcaires jurassiques qui servent de réservoir alimentant trois sources et des galeries<br />
de captage. La galerie la plus basse est située à une trentaine de mètres au-dessous de<br />
la surface maximale des eaux souterraines. Leur impluvium atteint 20 km2. Les calcaires<br />
du Lias du bent Saldane, d’une superficie de 17 km2, alimentent des sources et forages.<br />
Exploitation des eaux souterraines<br />
Les sytèmes de captages, galeries et sondages, de ces massifs calcaires permettent<br />
de régler la production en eau selon les besoins. Ainsi en été (juiiiet-aoút), le niveau de<br />
la surface des eaux souterraines est abaissé par exploitation intensive et en période de<br />
précipitation importante (décembre-janvier) les réserves se reconstituent par alimen-<br />
tation naturelle. On utilise ainsi la structure hydrogéologique comme réservoir sou-<br />
terrain naturel pour la régularisation des ressources en eaux.<br />
Au Chennata, une galerie avec serrement permet de vidanger une tranche de roche<br />
magasin de 30 mètres de puissance et de 3 km2 de superficie. Au bent Saldane il existe<br />
deux captages de sources et un puits foré capable d’exploiter par pompage une réserve<br />
d’eau de 15 millions de mètres cubes, correspondant à une tranche de calcaire de 20<br />
mètres environ d’épaisseur. Trois sources captées et deux galeries utilisent le réseau<br />
aquifère du Zaghouan.<br />
Bilan hydrique annuel moyen<br />
Les éléments principaux connus servant de base au calcul du bilan hydrique sont<br />
la hauteur de précipitation P, le débit d’exploitation des eaux souterraines Qez et la<br />
variation positive de la réserve en eau souterraines + dW (reconstitution des réserves<br />
en eaux souterraines, évaluée d’après le débit des sources ou l’observation de la cote<br />
du plan d’eau dans les ouvrages témoins (tableau I).<br />
TABLEAU I<br />
Éléments principaux du bilan hydrique des<br />
massifs calcaires du Chennata, Zaghouan et bent Saidane<br />
Apports Dépenses<br />
Prkipitations P<br />
~<br />
Evapotranspiration réeiie<br />
Ruissellement de surface<br />
E<br />
R<br />
Exploitation des eaux souterraines Qez<br />
Variation de la réserve en eaux souterraines + dW<br />
L’expression du bilan hydrique est la suivante :<br />
P=E+R+Q,,+dW<br />
P est la hauteur de précipitation donnée par les postes pluviométriques (y compris les<br />
chutes de neige);<br />
519
E, l’évapotranspiration réelle calculée par différence des autres éléments connus du<br />
bilan;<br />
R, le ruissellement considéré comme négligeable tant que la réserve n’est pas entièrement<br />
reconstituée, donc que les sources de déversement ne sont pas alimentées;<br />
Qez, le débit d’exploitation mesuré aux captages et aux sources;<br />
dW, la variation de la réserve en eaux souterraines connue.<br />
L’élément du bilan, inconnu, est l’évapotranspiration réelle difficile à évaluer directement<br />
(l’évaporation Piche est de 1279 mm au Chennata). Cette donnée est calculée<br />
à partir de l’infiltration efficace, c’est-à-dire de l’infiltration profonde (ou percolation)<br />
qui alimente les eaux souterraines (voir tableau V).<br />
Précipitations. - Les données de base des postes météorologiques ont permis d’établir<br />
le tableau II.<br />
TABLEAU II<br />
Hauteurs de précipitations en mm<br />
D’après J. TIXERONT et E. BERKALOFF<br />
Massif Année hydrologique (septembre-août) Année moyenne<br />
(I 945-1 950)<br />
1945 1946 1947 1948 1949<br />
1946 1947 1948 1949 1950<br />
Chennata 579 721 580 617 669 623<br />
bent Saïdane 335 300 483 752 491 472<br />
Zaghouan 304 373 422 706 51 463<br />
Infiltration efficace. - Le ruissellement étant considéré comme négligeable, l’infiltration<br />
efficace, I, est calculée à partir de la variation de la réserve en eaux souterraines,<br />
dW, et du débit d’exploitation. Nous avons d’après J. TIXERONT et E. BERKALOFF :<br />
A est la surface du périmètre d’alimentation direct, déterminé par les études hydrogéologiques<br />
;<br />
Ri et Ro, le volume de la réserve en eaux souterraines au début et en fin de la période<br />
considérée; Ri - Ro = d W;<br />
Qez, le volume d’eau exploité au cours de la période considérée.<br />
L’opération essentielle revient donc à déterminer le volume de la variation de la<br />
réserve en eaux souterraines.<br />
Calcul de la variation de la réserue en eaux souterraines. Ce calcul est délicat car il<br />
repose sur la détermination de la relation entre le volume d’eau souterraine stocké dans<br />
la tranche de roche réservoir correspondant à l’amplitude de la fluctuation de la surface<br />
du réseau aquifère et l’altitude du plan d’eau mesuré dans les ouvrages témoins<br />
ou le débit des sources. En effet, si l’on décompose la masse calcaire en tranches successives,<br />
d’un mbtre de puissance par exemple, le volume d’eau stocké n’est pas constant<br />
d’une tranche à l’autre. En général, il décroît avec la profondeur.<br />
Au djebel Chennata, J. TIXERONT et E. BERKALOFF ont établi une relation entre le<br />
volume de la réserve et l’altitude du plan d’eau dans le puits témoin en évaluant le<br />
volume d’eau exploité par le captage en période sèche et correspondant aux abaissements<br />
successifs par tranches de 2,5 mètres. Une relation a été ensuite établie entre<br />
52 O
l’altitude du plan d’eau et le volume de la réserve qui lui correspond. Ce volume d’eau<br />
emmagasiné décroît avec la profondeur de 27.000 à 13.000 mètres cubes par metre<br />
d’abaissement. Ce phénomène est dû à la diminution de l’ouverture des fissures. Le<br />
volume des vides est plus important dans la zone de fluctuation de la surface des eaux<br />
souterraines. Le volume total de la réserve est en moyenne de 500.000 m3 pour un abais-<br />
sement de 29 mètres, lequel est réglé par la galerie.<br />
Au djebel bent Saldane la relation, déterminée par la même méthode dans le puits<br />
de captage, donne 750.000 m3 en moyenne par mètre d’abaissement et un volume total<br />
de stockage de 4 millions de mètres cubes. Ces données ont été contrôlées par les courbes<br />
de tarissement des sources. Au djebel Zaghouan, le volume de la réserve a été calculé<br />
par les courbes de tarissement des sources en régime non influencé et par l’exploitation<br />
des galeries. I1 est de 2.700.000 m3.<br />
Les résultats de ces déterminations directes sont exposés dans le tableau III.<br />
TABLEAU III<br />
Valeurs de la variation de la réserve pour l’année moyenne<br />
(période 1945-19.50) en millions de mètres cubes.<br />
D’après J. TIXERONT et E. BERKALOFF<br />
Nombre<br />
Massif d’années Volume Volume Volume Fréquence<br />
d’observations moyen minimal maximal<br />
Chennata 9 0,58 0,346 0,84 1 fois en 9 ans<br />
bent Saïdane 16 1,45 O 439 1 fois en 6 ans<br />
Zaghouan 18 32 178 5 1 fois en 8 ans<br />
Avec ces données (tableau III) sur la variation de la réserve en eaux souterraines<br />
on détermine la hauteur de la lame d’eau infiltrée (tableau IV).<br />
TABLEAU IV<br />
Hauteur de lame d’eau infiltrée, en rnm<br />
D’après J. TIXERONT et E. BERKALOFF<br />
Massif Année hydrogéologique (septembre-août) Année moyenne<br />
(1945-1950)<br />
1945 1946 1947 1948 1949<br />
1946 1947 1948 1949 1950<br />
Chennata 188 382 213 276 257 264<br />
bent Saldane 70 O 70 390 12 108<br />
Zaghouan 50 100 185 345 150 166<br />
Evapotranspiration réelle. - L’évapotranspiration réeiie, le ruissellement étant con-<br />
sidéré comme négligeable, est évaluée par différence,<br />
E=P-I, (3)<br />
52 1
TABLEAU V<br />
Euapotranspiration réelle rapportée à l’année moyenne, en mm (période 194.5-19.50)<br />
D’après J. TIXERONT et E. BERKALOFF<br />
Massif P Iw E = P-Iw<br />
Chennata 633 264 369<br />
bent Saïdane 472 108 362<br />
Zaghouan 463 166 297*<br />
* La faible valeur de E obtenue pour le Zaghouan, comparée aux autres massifs,<br />
provient du fait que pendant deux années consécutives, 1947 et 1948, le ruissellement<br />
a été appréciable.<br />
Préoisions du bilan hydrique - bilan hydrique annuel<br />
La relation entre la hauteur de précipitation P et le volume d’eau apporté par l’infiltration<br />
efficace, Zw, est donnée par une formule établie par J. TIXERONT et E. BERKALOFF<br />
I, = A(P-Ho-aE) (4)<br />
IW est le volume d’eau apporté par l’infiltration efficace en m3;<br />
A, la surface du périmètre d’alimentation directe en m2;<br />
P, la hauteur cumulée de précipitation en m ;<br />
HO, la hauteur de la tranche d’eau retenue par le sol (coefficient de rétention) en m ;<br />
a, un coefficient numérique;<br />
E, la hauteur cumulée de l’évapotranspiration en m.<br />
La détermination de HO et de a est effectuée à l’aide de graphiques. Les valeurs suivantes<br />
ont été obtenues (tableau VI) :<br />
TABLEAU VI<br />
Valeurs des éléments de la formule (4)<br />
Chennata 0,5 60 1,8 1279<br />
bent Saïdane 0,4 85 17 1400<br />
Zaghouan 0,4 120 20 -<br />
La confrontation des valeurs calculées de l’infiltration efficace avec celles ayant été<br />
observées a donné les résultats exposés dans le tableau VII.<br />
TABLEAU VI1<br />
Comparaison des oaleurs en mm de lu> obseroées aoec celles ayant été calculées.<br />
La diflérence, d, en plus ou en moins est exprimée en mm.<br />
D’après J. TIXERONT et E. BERKALOFF<br />
Année Chennata bent Saïdane Zaghouan<br />
différence différence différence<br />
hydrologique Iw Iw Iw<br />
+ - + - + -<br />
5 22<br />
1945-1946 191 3 65 5 40 10<br />
1946-1947 359 23 O 80 20<br />
1947-1948 213 5 53 17 65* 120*<br />
1948-1949 266 10 380 10 342 3<br />
1949-1950 261 4 53 39 144 6<br />
moyenne 258 6 110 2 134 32
Les corrélations sont satisfaisantes, sauf pour le Zaghouan en 1947-1948. Cette ano-<br />
malie est due vraisemblablement au ruissellement.<br />
DJEBEL BARGOU<br />
Le bilan hydrique du djebel Bargou, en Tunisie orientale, a été étudié par H. ZEBIDI.<br />
Cadre hydrogéologique<br />
Le djebel Bargou est un vaste dome constitué de calcaires de 1’Aptien supérieur,<br />
reposant sur un substratum argileux de 1’Aptien inférieur. I1 est constitué de deux plis<br />
parallèles séparés par une gouttière synclinale faillée, la vallée du Bargou. H. ZEBIDI<br />
a étudié plus particulièrement cette vallée, laquelle correspond à un bassin des eaux<br />
souterraines bien individualisé.<br />
La couche aquifère calcaire de la vallée du Bargou, holokarst typique, est bien déli-<br />
mitée. L’exutoire des eaux souterraines est représenté en totalité par les sources captées<br />
pour l’alimentation en eau de la ville de Tunis : Ain Bou Saadia I, Ain Bou Saadia II<br />
et Ain Faouar. Sur une superficie du bassin versant de 55,5 km2, on compte 19 krnz<br />
d’affleurements calcaires, 13 de marnes et le reste d’éboulis et brkhes de pentes et de<br />
limons quaternaires. L’altitude moyenne est de 800 mktres.<br />
Bilan hydrique annuel moyen :<br />
Les éléments principaux de base de calcul du bilan hydrique sont donnés dans le<br />
tableau suivant :<br />
TABLEAU VI11<br />
Éléments principaux du bilan hydrique annuel moyen du djebel Bargoii<br />
(période 1949- 1960)<br />
D’après H. ZEBIDI<br />
Apports Dépenses<br />
(en millions de mètres cubes)<br />
Précipitation P 42,5 Evapotranspiration réelle E<br />
0,5 x 553 .lo6 28<br />
Infiltration efficace IW 2,5<br />
Ruissellement R 12,5<br />
I1 n’est pas tenu compte de la variation des réserves sur l’année moyenne. D’ailleurs,<br />
comme le calcul est effectué avec le débit des sources Zw = dW. Nous remarquerons<br />
que le ruissellement est important. Nous aurons donc comme expression du bilan<br />
hydrique :<br />
P=E+R+I, (5)<br />
P est le volume d’eau précipité au cours de l’année moyenne mesuré par planimétrage<br />
de la carte en courbes isohyètes;<br />
E, le volume d’eau dépensé par l’évapotranspiration réelle calculé par la formule de<br />
L. TURC;<br />
R, le volume d’eau ruisselé obtenu par différence et contrôlé par des évaluations;<br />
Zw, le volume d’eau alimentant les eaux souterraines (infiltration efficace) évalué d’après<br />
les mesures de débit des sources.<br />
52 3
Quelques remarques s’imposent au sujet des valeurs de l’évapotranspiration réelle,<br />
de l’infiltration efficace et du ruissellement.<br />
Evapotranspiration delle<br />
Elle a été calculée d’après la formule de L. TURC, appliquée aux données météorologiques<br />
de l’année 1961-1962.<br />
ou<br />
L = 300 + 25T + 0,05T3 (7)<br />
T, étant la température annuelle moyenne.<br />
Pour T = 18#C et une hauteur de précipitation de 560 mm<br />
E = 513 mm<br />
Cette valeur est trop forte, comparée à celle obtenu pour les autres massifs, en particulier<br />
le bent Saldane situé dans les mêmes conditions climatiques.<br />
Infiltration eficace-débit des sources<br />
La totalité du débit des eaux souterraines, correspondant i l’alimentation par l’in-<br />
filtration efficace, s’écoule par trois sources captées : Ain Bou Saadia I, Ain Bou Saadia<br />
II et Ain Faouar. Pour les deux premières, des mesures de débits depuis 1949 permet-<br />
tent de connaître avec précision les volumes d’eau écoulés chaque année et de déter-<br />
miner le débit annuel moyen (tableau IX).<br />
TABLEAU IX<br />
Débits annuels moyens en millions de mètres cubes des sources<br />
d’Ain Bou Saadia I et II.<br />
D’après H. ZEBIDI<br />
Période de P annuelle moyenne Débit annuel moyen (lo6 m3)<br />
référence à Saadia (mm)<br />
Ain Bou Saadia I Ain Boa Saadia II<br />
1949- 1960 715 1 o, 8<br />
soit 11 ans<br />
L’étude des courbes de décrue donnent les résultats suivants (tableau X). Les chiffres<br />
obtenues, Qe ont été comparés à ceux des débits mesurés, Qm,<br />
du tableaux IX.<br />
TABLEAU X<br />
Comparaison des débits annuels mesurés et calculés par les courbes de décrue<br />
D’après H. ZEBIDI<br />
Source étudiée P QC em Qcl Qm<br />
(mm) (en millions de m3)<br />
Ain Bou Saadia I 666 1,298 0,349 0,27<br />
Ain Bou Saadia II 666 0,827 0,223 0,27<br />
524
Ainsi pour les deux sources de Bou Saadia, l’évaluation de la réserve en eaux sou-<br />
terraines par les courbes de décrue ne représente que 27% de la réserve totale annuelle<br />
moyenne écoulée à la source. Ces résultats permettent de calculer le débit écoulé à la<br />
source d’Ain Faouar. L’interprétation de la courbe de décrue de la saison sèche 1962<br />
donne 190.000 m3, ce qui correspondrait à un volume annuel de 700.000 m3.<br />
TABLEAU XI<br />
Débits annuels moyem écoulés aux sources du Bargou, en millions de mètres cubes<br />
D’après H. ZEBIDI<br />
Source Méthode de Débit annuel moyen<br />
détermination (en millions de m3)<br />
Ain Bou Saadia 1 jaugeage 1,058<br />
Ain Bou Saadia II jaugeage 0,824<br />
Ain Faouar calcul 0,7<br />
Total 2,582<br />
Le volume d’eau infiltré sur la surface des affleurements calcaires, soit 19 km2,<br />
serait donc d’environ 2.580.000 mètres cubes, soit une hauteur de lame d’eau de 135 mm.<br />
Ce résultat est comparable aux données obtenues pour les massifs calcaires de la même<br />
région.<br />
Ruissellement<br />
Le ruissellement, appréciable, est difficile à évaluer. Une analyse des averses a<br />
montré que dans le bilan hydrique établi il était surestimé. Cette remarque conduit à<br />
augmenter la valeur de l’infiltration efficace, donc des ressources en eaux souterraines.<br />
CONCLUSIONS<br />
L’étude géologique et hydrologique détaillée des massifs calcaires de Tunisie a per-<br />
mis d’établir des bilans hydriques, base de l’exploitation rationnelle des ressources<br />
en eaux. Ceux-ci ont le m6rite de reposer sur une connaissance hydrogéologique aussi<br />
poussée que possible des bassins d’eaux souterraines et des impluviums, base nécessaire<br />
du calcul des réserves.<br />
Les travaux réalisés montrent la possibilité de régulariser les débits d’exploitation<br />
en utilisant comme réservoir naturel la structure hydrogéologique.<br />
52 5
CONFINED FRESH WATER AQUIFERS<br />
IN LlMESTONE, EXPLOITED<br />
IN THE NORTH OF MEXICO WITH DEEP WELLS<br />
BELOW SEALEVEL<br />
Ing. Heim LESSER JONES<br />
Consulting Geologist<br />
Secretaria de Recursos Hidraulicos<br />
Mexico<br />
RESUME<br />
Dans la Sierra Madre Orientale au Mexique, dans ses extensions vers le Plateau<br />
Central et vers la Plaine Côtière du golfe du Mexique, on trouve des montagnes<br />
avec failles raides, de sédiments marins, principalement d’âge crétacique. Ces sédiments<br />
constitués surtout de phyllades et de calcaires, ont une épaisseur totale de plus de<br />
5000 m. Les calcaires très perméables, ont une épaisseur toiale d’environ 1000 m et<br />
renferment, dans certaines régions, des nappes de grande capacité de production.<br />
Dans d’autres zones de la Plaine Côtière, ces calcaires donnent du pétrole ou de<br />
i’eau salée.<br />
Plusieurs cités du Mexique septentrional exploitent ces nappes par approximative-<br />
ment 50 puits avec des profondeurs de 200 a 1400 m, atteignant des profondeurs de<br />
O a 800 m sous le niveau du sol. Les nappes sont artésiennes dans la plupart des puits<br />
avec des débits de 40 a 240 l/sec et des rabattements de 2 à 40 m. Les puits ou les champs<br />
da puits sont situés sur les flancs et axes d’anticlinaux afin d’atteindre les nappes à la<br />
profondeur la plus réduite possible.<br />
Ces nappes ont des variations de niveau saisonnières de 20 a 80 m dépendant de<br />
leur production. Leur transmissibilité et leur capacité d’emmagasinement sont très<br />
grandes. Les effets de recharge sous l’action de pluies isolées sur le bassin d’alimentation<br />
des nappes est instantané; les précipitations moyennes dans cette région aride varient<br />
de 180 a 600 mm qui tombent durant un a trois mois de l’année.<br />
SUMMARY<br />
In the ranges of the Eastern Sierra Madre in Mexico, in its extentions to the Central<br />
Plateau and to the Coastal Plain of the Gulf of Mexico,there are steeply folded mountains<br />
of marine sediments principally of Cretaceous age. These sediments, mostly series of<br />
shales and limestones, have a total thickness of more than 5,000 m. The limestones<br />
which are very persistent and pervious, with a tota1,thickneses of about 1,00Om, consti-<br />
tute in certain regions, aquifers of great productive capacity. In other zones of the<br />
Coastal Plain these same limestones produce oil or contain salt water.<br />
Several cities in the North of Mexico exploit these aquifers to supply their water by<br />
approximately 50 wells with depths from 200 to 1,400 m, reaching elevations between<br />
O and 800 m. below sea level. The confined limestone aquifers are under pressure pro-<br />
ducing artesian conditions in most wells with yields of 40 to 240 l/seg., and drawdowns<br />
of 2 to 40 m. The wells or well fields have been located on the flanks and axes of anti-<br />
clines in order to reach the aquifers at the least possible depth.<br />
The aqujfers have seasonal variations in their levels from 20 to 80 m regardless of<br />
their production. Their deduced transmissibility and storage capacity are very high.<br />
The effects of recharge of the isolated rains occurring on the aquifer outcrops, are nearly<br />
instantaneous; the average rainfall in this arid region varies between 180 and 600 mm<br />
which fall only during one to three months of the year.<br />
INTRODUCTION<br />
This paper summarizes the results of the geologic exploration which was done in<br />
the search for deep groundwater sources in the formations of the Mexican Geosyncline<br />
in the Northern and Northeastern part of the Country. This geosyncline is formed by<br />
marine sediments with a total thickness of about 5000 m. All the Mesozoic formations<br />
of this geosyncline are represented in the area covered by the Sierra Madre Oriental<br />
Range of Mexico.<br />
52 6
In the northern part of the country the geosyncline was divided by the Coahuila<br />
Peninsula which was part of an old continent which extended further to the North at<br />
the end of the Paleozoic.<br />
The Mesozoic formations of this geosyncline were folded during the Laramide<br />
Revolution wich began at the end of this era, by compression stresses that formed the<br />
pronounced folded structures which now form the Sierra Madre Oriental.<br />
The orientation of these folds which is generally NW-SE was affected in the North-<br />
ern Central Region of the country by the resistance opposed by the old continental<br />
mass that formed the Coahuila Peninsula, and so in the area surrounding this Peninsula<br />
the folded structures have a trend with an E-W orientation.<br />
In the stratigraphic sequence of these marine formations there are several members<br />
formed by limestones like the “Cuesta del Cura” (Cenomanian); The Aurora (Albian)<br />
and the Cupido (Aptian) which contain fissures, fractures and cavities due to tensional<br />
and compressional stresses and due to dissolution allowing the accumulation and cir-<br />
culation of water or oil through them. These limestone members are confined by imper-<br />
meable formations which are equally folded in such a way that the water contained<br />
in the limestones is under hydrostatic pressure. The wells drilled to reach these lime-<br />
stones prove this, since when they penetrateci these permeable zones at depths of more<br />
than 1000 m and elevations below sealevel the water flowed to the surface in most wells<br />
under artesian conditions.<br />
HYDROLOGIC CONDITIONS<br />
It is obvious that in the region where these aquifers are exploited the superficial<br />
watersheds do not limit the recharge of meteoric waters that percolate into these aquifers,<br />
since their exposed outcrops are not defined by the physiographic conditions but by<br />
their structural geologic conditions. The limestone aquifer outcrops pass from one<br />
watershed to the other without interruptions receiving by these means their recharges<br />
from the outside.<br />
PHYSIOGRAPHY<br />
The above area can be divided in general in two parts: One belonging to a plain with<br />
small elevations and a mean altitude of 600 m above sealevel formed by low hills and<br />
a low slope belonging to Physiographic Province of the Gulf of Mexico Coastal Plain.<br />
In the other part prevail the rough mountain ranges with elevations of up to 3000 m<br />
which belongs to the Physiographic Province of the Sierra Madre Oriental.<br />
In the whole area all the physiographic accidents are controlled by geological<br />
structures with very well defined trends. Generally the highest part of the mountain<br />
ranges coincides with the fold axes or with its flanks, specially when they are formed by<br />
limestones.<br />
In most of these folds the high arch has been destroyed by the combined effect of<br />
erosion and dissolution, leaving only the flanks of the anticlines forming this way typical<br />
topographic features of this region of elongated amphitheatres.<br />
Another physiographic feature is defined by the aridity or the relative abundance of<br />
rain. Where the precipitation is more than 600 mm the drainage is well defined and is<br />
nourished by springs that maintain a base flow. Under aridity conditions there are arid<br />
basins with interior drainage.<br />
STRATIGRAPHY<br />
The geohydrologic characteristics of the regional formations and their sequence is<br />
as follows:<br />
Upper Jurassic: Limestones of Zuloaga Formation which contain gypsum in its<br />
527
ase. This formation is an aquifer that contains water with a high sait content. Thickness<br />
100 m.<br />
Upper Jurassic: La Casita Formation, shales with thin intercalations of limestones,<br />
carbonaceous shales and sandstones. Confining formation. Thickness 400 to 900 m.<br />
Lower Cretaceous Taraises Formation (Neocomian): Shales with limestone intercalations.<br />
Thickness 300 to 500 m.<br />
Lower Cretaceous (Aptian) Cupido Limestone: cavernous and very permeable. Jt<br />
is one of the most important exploitable sweet water aquifers in the Northern part of<br />
Mexico. Thickness 200 to 500 m.<br />
Lower Cretaceous (Albian) La Peña Formation: Impermeable confining shales. When<br />
they are very thin or fractured they do not act as confining formations of the limestone<br />
aquifers between which they are intercalated. This is a very persistent formation along<br />
the whole Sierra Madre Range. Thickness 10 to 100 m.<br />
Lower Cretaceous (Albian) Aurora Limestones: They are cavernous and permeable<br />
and constitute sweet water aquifers. Thickness 200 to 400 m.<br />
Lower Cretaceous (Upper Albian) Kiamichi Formation: Very persistent shales in the<br />
regional stratigraphy, impermeable and confining formation. When it is very thin or<br />
fractured it does not act as confining formation between the limestone aquifers. Thickness<br />
very variable between 20 to 80 m.<br />
Upper Cretaceous (Cenomanian) Cuesta del Cura Formation: Limestones with thin<br />
shale intercalations. Locally contains fractures and dissolution channels which permit<br />
water circulation and therefore it is only occasionally an aquifer. Thickness 50 to 150 m.<br />
Upper Cretaceous (Turonian) Zndidura Formation: Impermeable compact shales, confining<br />
formation. Thickness 100 to 600 m.<br />
Upper Cretaceous (Santonian) Parras Formation: Compact impermeable shales.<br />
Thickness 2 O00 to 2 500 m.<br />
Tertiary: non existent.<br />
Pleistocene Reynosa Formation: Alluvial gravel deposits partially cemented forming<br />
conglomerates.<br />
Recenf: Alluvial deposits.<br />
STRUCTURE<br />
The structural geologic features shown in the geological cross sections of this paper<br />
can be extended to other parts of the country in which there are also exploitations of<br />
underground water from limestones under similar conditions of geology, fisiography<br />
and geohydrology in the extensions of the Sierra Madre Orientai range towards the<br />
Central Plateau and the Gulf Costal Plane where well groups have been drilled to<br />
exploit water through these deep wells. These wells have been always located along the<br />
anticline folds of the same water bearing Aurora and Cupido limestones. More than<br />
50 wells provide partially or totally the water supply of important towns.<br />
This same formations described above as aquifers are oil producing in their extension<br />
as folded structures buried under concordant marine Cenozoic sediments towards the<br />
Gulf Costal Plain of Mexico. In the Abra Limestone, which is a reef facies of the Aurora<br />
(Aptian) the oil producing structure called the Golden Lane was developed. In this<br />
formation, the most spectacular flowing oil wells of the world at that time, were located<br />
(1914-1916). When two of these wells without control started flowing spontaneously,<br />
this are the Cerro Azul No. 4 and the Dos Bocas, productions that were estimated up<br />
to 250 O00 barrels per day per well, were obtained.<br />
Most of the Mexican oil fields in the Gulf Costal Plain are always flowing. This<br />
feature is due to hydrostatic pressure applied by water confinments located in the folded<br />
mountains of the S. M.O. in the same stratigraphic horizons with elevations of more<br />
than 600 m above the sea level and at distances of 150 Km from these oil fields which<br />
have a medium elevation of 150 m above sea level.<br />
528
DESCRIPTION OF ONE OF THE EXPLOITED AREAS: THE MINA ANTlCLINE CLOSE TO MONTERREY,<br />
MEXICO<br />
This area was located for the drilling of deep water producing wells in the highest<br />
part of an anticline with not very pronounced flanks. This structure has been perma-<br />
nently exploited for part of the water supply of the city of Monterrey (population<br />
1 O00 000) since 1959 until now.<br />
Eight deep wells were drilled; 7 of them have been under permanent production<br />
with a compound yield of 600 I/s.<br />
DESCRIPTIONS<br />
Fig. 1<br />
Figure 1. - Main geological structures of the area close to the city of Monterrey<br />
and the general distribution of the outcrops of the different types of existing rocks.<br />
Figure 2. - Sketch of a topical geological cross-section of the type of folded struc-<br />
tures that form the Sierra Madre Oriental close to Monterrey.<br />
Figure 3. - Sketch of a geological cross-section of the Mina Anticline where. the<br />
above wells were drilled.<br />
Figure 4. -Topographic map with locations of wells in the Mina Anticline.<br />
52 9
530<br />
c<br />
v)<br />
I<br />
/----.<br />
53 1<br />
I<br />
u<br />
I-<br />
W<br />
Y<br />
v)<br />
k-<br />
cn<br />
w<br />
a
MINA, HL
The geological characteristics of these wells are the following:<br />
Well Number I. - Depth 1 030 m elevation 610 m above sea level, bottom elevatiuo<br />
420 m below sea level. Yield 230 i/s, specific yield 26 I/s per meter of draw-down.<br />
Producing aquifer Cupido limestone. The weil is artesian.<br />
Well Number 2. - This is a not producing well due to drilling difficulties. Depth<br />
872 m. Elevation 600 m above sea level, bottom elevation 262 m below sea level. This<br />
well did not reach any permeable parts of the penetrated Aurora and Cupido limestones.<br />
Well Number 3. - Not producing well, because of difficulties during drilling and<br />
because it did not penetrate permeable parts of the limestone aquifers Aurora and<br />
Cupido. Elevation 634 m above sea level. Depth 929 m bottom elevation 295 m below<br />
sea level.<br />
Well Number 4. - Depth 757 m. Elevation 628 m, bottom elevation 129m below<br />
sea level; yield 140 1/s, specific yield 4.7 l/s per meter of draw-down. Producing aquifer.<br />
Cupido Limestone.<br />
Well Number 5. - Depth 982 m. Elevation 617 m bottom elevation 365 m below<br />
sea level; yield 200 l/s, specific yield 7.7 I/s per meter of draw-down. Producing aquifer<br />
Cupido Limestone.<br />
Well Number 6. - Depth 1150 m. Elevation 612 m above sea level bottom elevation<br />
538 m below sea level yield 100 1/s specific yield 6.7 i/s per meter of draw-down. Producing<br />
aquifer. Cupido Limestone.<br />
Well Number 7. - Depth 261 m. Elevation 622 m above sea level bottom elevation<br />
361 m above sea level, yield 150 l/s, specific yield 5.4 i/s per meter of draw-down.<br />
Producing aquifer Aurora Limestone.<br />
Note: Although all the wells mentioned before, went through the Aurora Formation,<br />
well number 7 was the only producing well in this Limestone.<br />
Well Number 8. - Depth 1079 m. Elevation 628 m above sea level bottom elevation<br />
421 m below sea level, yield 80 1/s, specific yield 3.6 I/s per meter of draw-down; producing<br />
aquifer Cupido Limestone.<br />
All these wells were drilled with Rotary Petroleum drilling Rigs with a diameter of<br />
12” and using preferably water circulation, employing bentonite only on exceptional<br />
occasions. In their upper part the diameter of the wells was reamed to 18”, to a depth<br />
of 100 m for the installation of the pumps.<br />
The only effective and practical indication to stop well drilling was the total loss of<br />
fluid circulation when the permeable parts of the limestone acquifers were reached. In<br />
all these cases of circulation loss, wells were tested and they resulted always, producing.<br />
In most of the wells tests with packers were done to a depth very close to the bottom<br />
and the results proved without any doubt that the production came only from the<br />
bottom of the well. Therefore in no case there was an opportunity to exploit water at<br />
lesser depths than the ones reached by these drillings.<br />
Electric logs were run in all the wells and as an example they are shown in figures 5<br />
and 6. It can be observed that these were only of use in defining the stratigraphic<br />
sequence and the thicknesses of the penetrated formations. The shale horizons of the<br />
Kiamichi and La Peña Formations that are intermediate between the acquifer limestones<br />
could be perfectly defined.These logs were of no utility as indicators of variations<br />
in permeability in the limestone acquifers. Therefore it is concluded that the water flows<br />
through fraktures andsolutionchannels that this geophysical procedure can not discover.<br />
On the other side, it is evident that there is an intercornunication between the<br />
conducts and fractures of both exploited aquifers in this area as shown by observing<br />
on one side the water level variations that can be seen for a short observation period<br />
include in figure No. 7 and in the pumping tests that were made operating one well and<br />
observing other wells close to it (see fig. 8 and 9). The observation of figure 7 which<br />
shows the water level variations as an example shows also the fast recuperation of the<br />
aquifer as a response to the recharge by rain that occurred not exactly in the area of<br />
Mina but in further areas between 20 and 80 km from Mina.<br />
5 34
Fig. 5
Fig. 6
538
1.8<br />
Influence sur l’écoulement superficiel<br />
Influence on Runoff
SUMMARY<br />
UTILIZATION OF I(ARST BASINS FOR<br />
REGULATING THE RUN-OFF<br />
Dr Nicolas BOYADJIEFF<br />
The fissures in the lime rocks progressively widen on account of the dissolution of<br />
these rocks by the waters. Thus a complex network of linked one with another empty<br />
spaces forms, the volume of which may reach up to 20%.<br />
The carsted lime massifs could be divided into: such, where the water-impervious<br />
base lies higher than the level of the carst springs and others, where the base is lower<br />
than the level of the springs. The second type we call carst basins, because the water<br />
that fills up the empty spaces under the level of the springs, cannot run away.<br />
The underground water of the carst basins gradually changes, but its volume is<br />
preserved constant. Depending on the rate and degree of carsting, great masses of<br />
underground water can gather in and this water can be scooped out during the period<br />
of irrigation through wells and pumps or through artesian wells, at ali places where<br />
the geological conditions permit. The pumped out stock wil be restored during the<br />
rainy period, according to the proportion of the catchment area and the quantity of<br />
the rains.<br />
In Bulgaria, we have established the presence of 135 carst basins with 3,36 milliards<br />
cub. m. water, to a depth of 25 meters under the level of the carst springs. If this water<br />
could be pumped out for irrigation, the conditions would permit its annual restoration<br />
RÉSJM~<br />
UTILISATION DES BASSINS KARSTIQUES<br />
POUR LA RÉGULARISATION DES<br />
DEBITS HY DROLO GIQUES<br />
Dr Nicolas BOYAD JIEFF<br />
(Bulgarie)<br />
Les fissures des roches calcaires s’agrandissent progressivement à mesure que l’eau.<br />
dissout la roche. Ainsi se forme un réseau complexe de cavités reliées les unes aux<br />
autres, et dont le volume peut atteindre jusqu’à 20 % de celui de la roche.<br />
On peut distinguer deux types de massifs karstiques calcaires: dans le premier type,<br />
la base imperméable du massif est située à un niveau supérieur au niveau des sources<br />
issues du karst; dans le second type, cette base se situe à un niveau inférieur à celui<br />
des sources. On appelle karstiques les bassins du deuxième type, parce que l’eau qui<br />
remplit les espaces vides situés au-dessous du niveau des sources ne peut s’écouler.<br />
L’eau souterraine des bassins karstiques s’altère progressivement mais son volume<br />
reste constant. Suivant l’état de karstification du massif, une importante masse d’eau<br />
peut s’accumuler dans celui-ci, et cette eau peut en être extraite en période d’irrigation<br />
au moyen de puits, de pompes ou de puits artésiens, partout où les conditions géolo-<br />
giques le permettent. La réserve d’eau pompée sera restituée à la saison des pluies,<br />
proportionnellement à l’importance du bassin de drainage et au volume des préci-<br />
pitations.<br />
En Bulgarie, on a établi l’existence de 135 bassins karstiques renfermant 3,36 mil-<br />
liards de m3 d’eau, à une profondeur de 25 mètres en-dessous du niveau des sources.<br />
Si cette eau était pompée pour l’irrigation, les conditions naturelles assureraient la<br />
réalimentation annuelle des bassins.<br />
543
ON THE PROBLEM OF THE INFLUENCE OF KARST<br />
ON THE HYDROLOGICAL REGIME OF RIVERS<br />
A.M. GAVRILOV<br />
(USSR)<br />
Karst is widely spread in the European part of the USSR as well as in Eastern<br />
Siberia beginning from Krasnoyarsk. In the European territory of the Soviet Union<br />
the proportion of karstic fissured rocks-consisting mainly of limestone and gypsumis<br />
especially great in the following “Karstic” regions: the Urals, the Belomorsko-<br />
Kuloiskaye plateau, the Onega-Dvina water-divide area, the lake district to the south<br />
of Onega lake, the Silurian plateau to the south-west of Leningrad, the middle reaches<br />
of the Volga and some other regions.<br />
In the regions mentioned above covered karst is found as a rule. Sometimes a<br />
complicated alternation in the bedding of karstic and non karstic rocks can be<br />
observed which stipulates fairly diverse source conditions of some rivers-for instance<br />
in the Urals and in the middle reaches of the Volga. In other cases karst is represented<br />
by large massifs made up of homogeneous fissured rocks-for instance in the Silurian<br />
limestone plateau and to a considerable extent in the region of the Emtsa river basin<br />
in the Onega-Dvina water-divide area.<br />
Karst influences the sources and the hydrological regime of rivers and according<br />
to observational data in the northern and middle section of the European part of the<br />
USSR, this effect is important in rivers with drainage areas of not more than<br />
3,000-7,000 km2.<br />
Occasionally the influence of karstic sources on the hydrological regime is<br />
noticeable in some stretches of larger rivers.<br />
As is known, the influence of karst on run-off arises from the more or less complete<br />
absorption of precipitation by karst rocks and the existence of rather large<br />
groundwater storage.<br />
Consequently the share of the surface run-off decreases and in many cases the<br />
annual distribution of run-off is considerably regulated, with more moderate values<br />
of maximum discharges and higher values of minimum discharges. The lack of<br />
coincidence of the surface and underground drainage basins inherent to karstic<br />
regions often causes noticeable deviations of average rates of discharges of karstic<br />
rivers from the zonal normal amounts and these deviations may be of opposite signs<br />
even for neighbouring rivers. The long-range amplitude of annual run-off is smoothed<br />
down too. In particular cases the influence of karst upon the run-off greatly depends<br />
on the complex of local geological and hydrographical conditions, such as the<br />
character of bedding and the structure of karsting and underlying impermeable rocks,<br />
as weil as the availability of impermeable lenses in the bulk of fissured rocks and<br />
their associated “perched” storage of karstic waters. The direction of rivers also may<br />
promote or hamper the interception of karstic waters.<br />
Streamflow investigations on karstic rivers and the systematization of their<br />
observation data are of great importance to hydrologists concerned with hydraulic<br />
structures and mining operations. It js possible to obtain the run-off data of karstic<br />
rivers mainly by two methods:<br />
1. By organizing special hydrological and hydrogeological field investigations of<br />
karstic and non-karstic rivers of a definite river basin;<br />
2. By the use of run-off observation data on the hydrological network in karstic<br />
regions taking into consideration local geological and hydrographical conditions.<br />
544
The first method is preferable as it allows one to undérstand more completely the<br />
complicated multi-factor relationships between run-off and natural conditions and to<br />
separate and evaluate the proper influence of karst on run-off. Now a broad<br />
development of detailed field investigations may not be possible for a number of<br />
reasons, but it does not diminish the importance of such work both for local practice<br />
and for general methodology. The practical and scientific methods of detailed<br />
investigations checked by experiments can be applied later to similar complex cases<br />
thus giving economy of time and expenditure.<br />
The character of karstic influence of karst upon run-off may also be derived from<br />
streamflow data of a drainage basin or region, published in water yearbooks. The<br />
completeness of such data depends on the density and representativeness of the<br />
network of stream-gauging stations.<br />
In this report, examples are given to characterise karstic influence upon the runoff<br />
of small rivers within the following regions of the northern and middle zones of the<br />
European part of the USSR:<br />
1. Silurian plateau;<br />
2. Belomorsko-Kuloiskoye plateau;<br />
3. Onega-Severnaya Dvina water divide area;<br />
4. Right bank region of the middle Volga.<br />
In the first of these regions, special investigations of runoff in the Oredezh basin<br />
were made; for other regions, the data of permanent stream gauging stations<br />
published in water yearbooks were used.<br />
In all cases the ratio of the average low water (summer) discharge and average<br />
winter discharge (Qy) for a given period of years was accepted as one of the criteria<br />
of the annual flow regulation; the periods of observation are equal for all stations to<br />
be compared. The average low-water summer discharge (Qs) is calculated as an<br />
average value from discharges for two summer months, that usually have the least<br />
streamflow rate in a given region, and the average winter discharge (Qu?) is calculated<br />
correspondingly for two winter months with the least stream flow. The choice of months<br />
is defined by the general character of the hydrological regime of rivers in a given region.<br />
To evaluate the natural yearly regulation of the runoff the following classes are defined:<br />
I. High regulation Qs/Qy N Qu;/Qy =<br />
- - 60%.<br />
II. Moderate regulation Qs/Qy Qw/Qy = 40-60%.<br />
III. Slight regulation Qs/Qy Qw/Q.v = 25-40%.<br />
IV. Negligible regulation Qs/Qy = Qw/Qy = 1-25;,;.<br />
The data obtained should be plotted upon schematic maps of summer and winter<br />
run-off regulation which given valuable descriptive characteristics.<br />
1. KARST AND RUN-OFF IN THE OREDEZH RIVER BASIN<br />
Hydrological investigations in the basin of the Oredezh river, tributary of the<br />
Luga river (Leningrad district) were organized by the State Hydrological Institute<br />
(SHI) during 1952-1954; one of their purposes was to establish the karstic influence<br />
upon the hydrological regime of rivers. The investigations were carried out according<br />
to the method of hydrological comparison, by means of systematic uniform observations<br />
of water discharge in the correspondingly situated gauging stations on karstic and<br />
non-karstic rivers of the basin being studied.<br />
The source of the Oredezh river is situated at the edge of the Silurian plateau,<br />
which consists of karst limestones; the river in its upper course flows to the East and<br />
545
then turns to the South (fig. I). Observations at Vyritsa (drainage area A = 734 kma)<br />
and Morovino (A = 2890 km2), have shown that the greatest influence of karst upon<br />
run-off is shown in the upper course of the river from its origin up to Vyritsa. Seven<br />
new stream-gauging stations were opened here and together with Vyritsa their number<br />
Fig. 1 - The scheme of disposition of stream gauging stations on the Oredezh and<br />
Luga rivers: 1. Oredezh r. at Zarechye; 2. Konevka r. at Zarechye; 3. Chernaya r.<br />
at Kordon; 4. Oredezh r. at Daimishtche; 5. Oredezh r. at Siverskaya; 6. Oredezh r.<br />
at Belogorka; 7. Orlinka r. at Orlinka; 8. Oredezh r. at Vyritsa; 9. Oredezh r. at<br />
Morovino. 10. Luga r. at Voronino.<br />
reached 16 stations on the Oredezh river and 2 stations on its tributaries-the<br />
Chernaya and the Orlinka rivers. For comparison, data of the Oredezh river at<br />
Morovino (with negligible karstic sources) as well as of the Luga river at Voronino<br />
(no karstic sources at all) were also taken (table 1).<br />
~~<br />
TABLE 1<br />
Drainage Percentage Percentage<br />
No. River Station area (A) of forest of swamp<br />
in km2 area area<br />
546<br />
Oredezh<br />
Chernaya<br />
Oredezh<br />
Oredezh<br />
Oredezh<br />
Orlinka<br />
Oredezh<br />
Oredezh<br />
Luga<br />
B. Sarechye<br />
Kordon<br />
Daimishtche<br />
Sivers kaya<br />
Belogorka<br />
Orlinka<br />
Vyritsa<br />
Morovino<br />
Voronino<br />
113<br />
29<br />
230<br />
351<br />
3 90<br />
183<br />
734<br />
2,890<br />
839<br />
40<br />
80<br />
55<br />
53<br />
53<br />
38<br />
56<br />
40<br />
30<br />
5<br />
40<br />
12<br />
10<br />
9<br />
10<br />
8<br />
20<br />
35
Values of the long-term average rate of run-off for rivers without karstic sources<br />
reach 7.0-7.5 l/sec/km2 for this region. In the upper course of the Oredezh, the average<br />
rate of run-off according to ten years’ observations is 1.5 to 2 times more than the zonal<br />
norm (table 2). It can be mainly attributed to the additional inflow karst waters of<br />
the Silurian plateau; besides, the underground drainage area exceeded the surface<br />
drainage area by 35% at Daimishtche and by 30% at Vyritsa.<br />
The amount of precipitation is 20% less in the upper course of the Luga river than<br />
in the upper course of the Oredezh river and this difference is relevant also.<br />
The influence of karst waters upon river discharges is most significant at the<br />
Daimishtche gauging station; further downstream this influence gradually decreases.<br />
The flow of the Orlinka and (especially) the Chernaya rivers approaches the zonal<br />
value since karstic waters only feed them in a minor way.<br />
Oredezh<br />
Oredezh<br />
Oredezh<br />
Oredezh<br />
Oredezh<br />
Chernaya<br />
Orlinka<br />
Luga<br />
TABLE 2<br />
The average rate of run-off for the period 1954-1963(l)<br />
Drainage area Average rates of<br />
River Station (A) in km2 run-off in I/sec/km2<br />
Zarechye<br />
Daimishtche<br />
Belogorka<br />
Vyritsa<br />
Morovino<br />
Kordon<br />
Orlinka<br />
Voronino<br />
113<br />
230<br />
390<br />
734<br />
2,890<br />
29<br />
183<br />
839<br />
11.2<br />
15.2<br />
13.6<br />
10.4<br />
1.4<br />
8.0<br />
9.3<br />
7.0<br />
On the river reach considered the annual run-off of the Oredezh is largely regulated<br />
by the storage of karst waters, accumulated in epring (every year) and in autumn<br />
(50% of occasions). The most permanent regulation is observed near Daimishtche<br />
where there is no appreciable exhaustion of the source whose minimum rate of flow<br />
in the driest years does not become lower than 4.0 l/sec/km2. On non-karstic rivers<br />
the corresponding values may fall in the range 0.2 to 0.4 I/sec/km2. At Zarechye<br />
during extremely dry years the spring-sources dry up. The ratio (in %) of average<br />
summer low-water discharges (July-August) Qs, and average winter (January-<br />
February) discharges, Qw, to average annual values Qy (table 3) shows that the high<br />
TABLE 3<br />
The percentage values of ratios Qs/Qy and Qw/Qy for the period of 19.52-1961<br />
~ ~ ~~ ~~ ~<br />
No. River A, km2 Qsl Qv<br />
1 Oredezh at Zarechye 113 114<br />
2 Oredezh at Daimishtche 230 84<br />
3 Oredezh at Vyritsa 734 69<br />
4 Oredezh at Morovino 2,890 40<br />
5 Chernaya at Kordon 29 14<br />
6 Orlinka at Orlinka 183 43<br />
7 Luga at Voronino 839 25<br />
QwlQu<br />
(l) The ratio of run-off rate for the period 1954-1963 to the rate of run-off for<br />
the period of 20 years is 1.02.<br />
46<br />
68<br />
63<br />
49<br />
15<br />
21<br />
28<br />
547
egulation of streamflow during the winter period is only a bit less than regulation<br />
during the summer low water period. This fact is clear evidence of the decisive<br />
influence of karst upon streamflow regulation.<br />
The annual regulation of run-off in the upper course of the Oredezh can also be<br />
clearly seen on the combined hydrographs (fig. 2 and 3) while comparing the smooth<br />
discharge variations at the Oredezh with their sharp changes at the Orlinka and the<br />
Luga. It is possible to determine the water-storage effect of karst during the spring<br />
period by considering the spring run-off coefficients of the Oredezh, its non-karstic<br />
tributaries and the Luga (table 4).<br />
TABLE 4<br />
Spring run-off coeficients<br />
~~ ~~~~~~ ~~~~<br />
River<br />
Years<br />
A,<br />
in km2<br />
1953 1954 1955 1956 1957 1958 1959 1960 1962<br />
____ __<br />
Oredezh at Zarechye 113 0.29 0.31 0.44 0.27 0.47 0.59 0.47 0.24 0.56<br />
Oredezh at Daimishtche 230 0.54 0.48 0.55 0.55 0.69 0.53 0.60 0.34 0.72<br />
Oredezh at Vyritsa 734 0.54 0.30 0.56 0.42 0.82 0.58 0.52 0.45 0.54<br />
Chernaya at Kordon 29 - - 0.85 0.82 - 0.80 0.89 0.64 0.88<br />
Orlinka at Orlinka 183 - 0.83 0.84 0.83 - 0.93 0.66 0.58 0.76<br />
Luga at Voronino<br />
548<br />
839 - - _ _ - _<br />
~~<br />
- 0.61 0.96<br />
Fig. 2 - Combined hydrographs of the Oredezh and Orlinka rivers, 1959.
The influence of karst on maximum water discharges of the Oredezh is of<br />
smoothing character and maximum rates of run-off are considerably lower than at<br />
non-karstic rivers (at Vyritsa during wet years these values are about 100 l/sec/km2,<br />
at Voronino on the Luga river they exceed 200 i/sec/kmz, the drainage areas being<br />
Fig. 3 - Combined hydrographs of the Oredezh and Luga rivers, 1959.<br />
almost the same). The rate of run-off per unit basin area in the upper course of the<br />
Oredezh actually increases with distance downstream (table 5 and fig. 4).<br />
The regulating influence of karstic sources also affects the variations of annual<br />
run-off. In the upper course of the Oredezh the range of these variations is smaller<br />
than on the Luga (table 6) while the range of annual precipitation is approximately<br />
the same.<br />
Thus, in the upper course of the Oredezh where karst is concentrated in one<br />
massif and karst waters are intercepted by the river we have an example of a simple<br />
positive influence of karst upon run-off.<br />
At the same time, the areal rate of run-off and the run-off regulation sharply<br />
decreases downstream in progressing from the upper tributaries of the Oredezh,<br />
namely the Chernaya and the Orlinka which are hardly influenced by karst. This is<br />
why the Oredezh is an example of a river where hydrological analogy is not permitted.<br />
At the gauging station Morovino the influence of karst is felt only to a small degree,<br />
being reflected by the moderate regulation of the summer low water and winter<br />
run-off. Consequently, the influence of karst is attenuated when the drainage area is<br />
about 3,000 kma. As we shall see from other examples, this area is not a limit.<br />
The limit depends on the whole complex of local conditions.<br />
549
River<br />
TABLE 5<br />
Maximum rates of ruil-off in Ifsec per kmz<br />
Years<br />
1953 1954 1955 1956 1957 1958 1959 1960 1961 1962 1963 1964<br />
Oredezh at<br />
Zarechye<br />
Oredezh at<br />
42 16 46 33 63 54 48 16 38 47 24 14<br />
Daimishtche<br />
Oredezh at<br />
61 27 117 116 84 77 89 44 52 87 45 24<br />
Belogorka<br />
Oredezh at<br />
76 32 133 91 ' 86 62 77 58 53 80 43 49<br />
Vyritsa<br />
Chernaya at<br />
85 27 100 95 98 71 93 86 56 86 54 50<br />
Kordon - 38 241 218 187 126 183 77 93 193 106 -<br />
Orlinka at<br />
Orlinka - 24 169 149 135 89 136 113 80 128 62 69<br />
Luga at<br />
Voronino _ _ 156 210 93 112 146 78 36 180 86 48<br />
Values<br />
TABLE 6<br />
The range of annualprecipitation ai2d run-off for the period of 1953-1964<br />
Annual precipitation, mm Annual discharges, m3/sec<br />
meteorological stations gauging stations<br />
Oredezh r. Oredezh r. Luga i.<br />
Elizavetino Belogorka Grigorovo at Dai- at at<br />
mishtche Vyritsa Voronino<br />
Average 639 620 542 3.46 7.27 5.72<br />
Maximum 831 774 777 5.28 10.4 10.2<br />
Minimum 463 410 42 6 2.32 4.59 2.30<br />
Extremes in %<br />
of the average 72-130 66-125 78-143 67-152 63-143 40-177<br />
There was an attempt on the Oredezh to establish the relation of run-off at<br />
Daimishtche to the underground water levels in the Silurian plateau, 35 km from<br />
Daimishtche in a straight line. According to average monthly values for the period<br />
of 1952-1964, more or less satisfactory relationships for separate months were<br />
obtained, particularly in the winter period when the karstic sources entirely account<br />
for the subsurface run-off (fig. 5). The considerable dispersion of points on the graph<br />
is mainly observed during wet periods, when rain floods from the non-karstic part of<br />
the basin are superposed upon regulated karst feeding. At any rate, the relations<br />
between the underground water levels and the run-off in karstic regions are worth<br />
attention and may be of practical importance.<br />
5 50
O<br />
Fig. 4 - The change of the rate of. maximum runoff in the upper course of the<br />
Oredezh river.<br />
2. KARST AND s m . FLOW ~ IN BELOMORSKO-KULOISKOYE PLATEAU<br />
The Belomorsko-Kuloiskoye plateau is situated to the north-east of Archangel<br />
and consists in its eastern part of karstic caícareous and Permian limestones, dolomit<br />
and gypsum covered by a thin stratum of moraine deposits. The drainage basins of<br />
rivers flowing in this part of the plateau-namely the Kuloi with its tributaries the<br />
Soyana, Kepina, Kelda and others-are under the influence of karst. Their reghe<br />
differs from the regime of rivers flowing into the White Sea from the western non-karstic<br />
part of the plateau (the Lodma, Mudyuga, Zoíotitsa rivers).<br />
551
To characterize the influence of karst run-off data, the following stations were used<br />
(table 7).<br />
TABLE 7<br />
River Station A, km2 Drainage area<br />
Kuloi Kuloi 3,280 karstic<br />
Soyana Fishing mil 4,870 karstic<br />
Kepina Kepina 1,170 karstic<br />
Lodma Korovkinskaya 1,400 non-karstic<br />
Mudyuga Patrakeevskaya 305 non-karstic<br />
Zolotitsa V. Zolotitsa 1,840 non-karstic<br />
It was possible to compare the data at all six stations only for a ñve-year period<br />
(I 957-1961).<br />
Nevertheless, the comparison of data of stations with 10 and 20 years of observations<br />
shows that five-year data are sufficiently representative (table 8).<br />
pebpoab fg52 -6427<br />
Fig. 1<br />
Fig. 5 - The curves of relation between the average monthly ground water table<br />
(GWT) on the plateau and the discharges of Oredezh river at Daimishtche: QD):<br />
U) QD =f(GWT) II - 1952 - 64.<br />
b) QD =f(GWT) IV - 1952 - 64.<br />
c) QD = f(GWT) VI - 1952 - 64.<br />
The data presented in table 8 show quite clearly the regulating effect of karst upon<br />
the summer low water and winter run-off. The regulation of rivers with karstic<br />
drainage basins during severe winters is the most reliable index of the karst influence.<br />
552
The karst effect can be also seen from the comparison of summer low water run-off<br />
and winter run-off at the Kepina and the Lodma for ten-year period (table 9). The<br />
rate of winter run-off of the first river is more than 4 times larger than that of the latter.<br />
QBf en6 6952-642.2.<br />
Fig. 2<br />
TABLE 8<br />
The natural regulation of summer low water and winter run-o8 (%)<br />
River A, in kmz<br />
1957-1961 1952-1961 1938-1961<br />
_ _ - --<br />
Kuloi at Kuloi 3,280 89 60 91 56 85 58<br />
Soyana at Fishing mill 4,870 - 60<br />
Kepina at Kepina 1,170 92 78 96 75 _ -<br />
Lodma at Korovkinskaya 1,400 50 I3 48 16 51 il<br />
Mudyuga at Patrakeevskaya 305 52 32 60 32 63 33<br />
c<br />
Zolotitsa at V. Zolotitsa 1,840 - 27<br />
_ _ _<br />
(l) Qs means the average discharge of August-September and QU, the average<br />
discharge of January-February.<br />
553
The regulating influence of karst in this region also becomes apparent in respect<br />
of the maximum and minimum run-off. The spring flood caused by snow melt on karst<br />
rivers is smoothed, the rates of maximum run-off are considerably smaller than on<br />
rivers with non-karstic drainage basins (table IO), while the rates of minimum winter<br />
run-off on karstic rivers are 2-3 times larger than on non-karstic rivers (table li).<br />
UMJfb 1952-642.<br />
Fig. 3<br />
TABLE 9<br />
River Station A, kmz<br />
Rate of run-off in l/sec/km2<br />
Qs QW<br />
Kepina Kepina 1,170 10.6 8.23<br />
Lodma Korovkinskaya 1,400 5.41 1.78<br />
From comparing the run-off of karstic and non-karstic rivers of this region, it can<br />
be seen that karst regulates the annual run-off of rivers with drainage areas up to<br />
5,000 kmz, this area not being considered a limit.<br />
554
TABLE 10<br />
Annual rates of maximum run-off in I/sec/km2<br />
River Station A. km2<br />
Years<br />
1957 1958 1959 1960 1961<br />
Soyana Fishing mil 4,870 81 40 68 49 57<br />
Kepina Kepina 1,170 78 50 45 19 48<br />
Lodma Korovkinskaya 1,400 289 110 163 66 187<br />
Zolotitsa V. Zolotitsa 1,840 188 149 202 68 194<br />
~ ~<br />
TABLE 11<br />
Annual rates of minimum run-off in l/sec/km2<br />
River Point A, in km2<br />
Years<br />
1957 1958 1959 1960 1961<br />
~~~ ~ ~ ~<br />
Soyana Fishing mil 4,870 3.72 3.99 4.02 6.13 5.13<br />
Kepina Kepina 1,170 8.39 9.23 7.07 5.94 5.62<br />
Lodma Korovkinskaya 1,400 0.85 0.87 0.61 0.51 1.22<br />
Zolotitsa V. Zolotitsa 1,840 2.23 2.72 2.26 2.12 2.40<br />
As to the total stream-flow, there is no systematic difference in this region between<br />
karstic and non-karstic drainage basins. The average annual rates of run-off (eav)<br />
for most of the rivers are of the same order; the rate of run-off of the karstic river<br />
Soyana is even smaller, while in the case of the Mudyuga it is much higher than that<br />
of other rivers (table 12).<br />
TABLE 12<br />
Acerage annual rates of run-off in l/sec/km2<br />
Qav Qav<br />
River A, in km2 1957-1961 1952-1961<br />
Kuloi at Kuloi<br />
Soyana at Fishing mil<br />
3,280<br />
4,870<br />
11.1<br />
9.25<br />
11.3<br />
-<br />
Kepina at Kepina 1,170 11.1 11.2<br />
Lodma at Korovkinskaya 1,400 11.1 11.3<br />
Mudyuga at Patrakeevskaya<br />
Zolotitsa at Zolotitsa<br />
305<br />
1,840<br />
18.3<br />
11.5,<br />
18.8<br />
-<br />
The data of annual rates of run-off do not con0ict with the regulating effect of<br />
karst on the run-off but undoubtedly restrict the regulation within annual periods.<br />
The annual rates of run-off are influenced by precipitation distribution as well as<br />
possible errors in defining the drainage areas.<br />
555
3. KARST AND STREAM-FLOW IN THE ONEGA-DVINA WATER-DIVIDE AREA<br />
This area is an undulating plain with a general slope towards the White Sea.<br />
The plain is drained by the Severnaya Dvina, Onega, Vaimuga, Yemtsa, Vaga and<br />
other rivers (fig. 7). In the upper and middle parts of the Emtsa river basin and in the<br />
right bank part of the Vaimuga basin the bed rock, consisting of calcareous limestones<br />
and dolomites, is near the surface and is covered with moraine deposits of small<br />
thickness. Karst phenomena are developed here, disappearing lakes and rivers occur<br />
Fig. 6 - Scheme of the Belomorsko-Kuloiskoye plateau rivers. Stream gauging<br />
stations: 1. Kuloi river at Kuloi; 2. Soyana r. at Fishing mill; 3. Kepina r. at Kepina:<br />
4. Lodnia r. at Korovkinskaya; 5. Mudyuga r. at Patrakeyevskaya; 6. Zolotitsa r.<br />
at V. Zolotitsa.<br />
and abundant springs emerge from which some rivers originate (Korza, Vaimuga).<br />
The hydrographic network is not dense and sometimes it is totally absent as for<br />
example in the watershed of the Vaimuga and the Yemtsa rivers.<br />
The karstic sources are of clear importance upon the rate of stream-flow and<br />
natural regulation of run-off of rivers in the Emtsa drainage basin, but due to the<br />
complicated forms of karst and in particular because of fissure phenomena, this<br />
effect varies sometimes even within short stretches of rivers (for instance in the upper<br />
course of the Yemtsa).<br />
To characterize the influence of karst upon run-off in this region, the data from<br />
the following gauging stations were used (table 13).<br />
556
River<br />
TABLE 13<br />
Station A, km2 Drainage basin<br />
Yemtsa Railway bridge 1,580 Karstic<br />
Yemtsa Seltso 3,180 Karstic<br />
Sheleksa Konets 1,050 Karstic<br />
Vaimuga Permilovo 2,800 Partly karstic<br />
Kodina Kodino 1,820 Karstic<br />
Solza “Sukhie Poroghi” 1,240 Non-karstic<br />
Vaga Gluboretskaya 1,410 Non-karstic<br />
Fig. 7 - The scheme of the Onega-Dvina water divide area. Stream gauging stations:<br />
1. Yemtsa r. at railway bridge; 2. Yemtsa r. at Seltso; 3. Sheleksa r. af‘Konets;<br />
4. Vaimuga r. at Permilovo; 5. Kodina r. at Kodino; 6. Solza r. at Soukhie<br />
Poroghi”; 7. Vaga r. at Gluboretskaya.<br />
557
In its upper course, the Emtsa river reflects the contradictory effects of the karstic<br />
sources in this region. Arising from abundant karst waters from outside of the surface<br />
catchment area, the Emtsa river (before the affluence of the Sheleksa river) has a high<br />
rate of streamflow, which was estimated from short-term observations to be<br />
approximately 18 I/sec/km2. After the affluence of the Sheleksa (the rate of run-off<br />
of which is only 6 l/sec/kmz, as a result of periodical outflows of water from its<br />
catchment area through fissure formations) the areal rate of stream-flow of the Emtsa<br />
decreases. Nevertheless its run-off near the railway bridge remains higher than that of<br />
other rivers, particularly that of the non-karstic river Vaga (table 14).<br />
TABLE 14<br />
Average annual rates of run-of in 1/sec/km2<br />
1957-1961 1952-1 96 1<br />
River A, km2 Qau Qau<br />
Yemtsa at railway bridge 1,580 10.9 10.0<br />
Sheleksa at Konets 1,050 6.05 -<br />
Vaimuga at Permilovo 2,800 8.75 8.36<br />
Vaga at Gluboretskaya 1,410 9.00 -<br />
In the catchment area of the Yemtsa, the regulating influence of karst upon the<br />
annual run-off is quite explicit. The main influence here, as everywhere ip the northern<br />
regions, is the regulation of winter run-off which for the Yemtsa occurs also near<br />
Seltso where the catchment area reaches 8,000 km2. The Vaga is a demonstration of<br />
a neighbouring non-karstic river whose run-off is not regulated (table 15).<br />
TABLE 15<br />
Regulation (%) of the low water (August-September) und<br />
winter (January-February) run-of for the period of 1957-1961<br />
River A, km2 QslQv QdQv<br />
Yemtsa at railway bridge<br />
Yemtsa at Seltso<br />
Sheleksa at Konets<br />
Vaimuga at Permilovo<br />
Vaga at Gluboretskaya<br />
Vaga at Filaevskaya<br />
1,580 90 66<br />
8,180 99 53<br />
1,050 96 45<br />
2,800 82 40<br />
1,410 37 12<br />
13,200 51 22<br />
Run-off regulation in the catchment area of the Yemtsa can be clearly seen in<br />
table 16, which compare the average summer and winter rates of run-off of the<br />
Yemtsa and the Solza rivers for a 20-year period (table 16).<br />
TABLE 16<br />
Qs QW<br />
River A, km2 I/sec/km2 l/sec/km2<br />
Yemtsa at railway bridge 1,580 8.88 6.58<br />
Solza at " Soukhie Poroghi" 1,240 5.31 2.31<br />
558
It can be seen from figure 8 that the regulation of run-off in the upper course of<br />
the Yemtsa during the whole year is of a very stable character.<br />
Maximum and minimum values of the annual run-off in the drainage basin of<br />
the Yemtsa are smoothed under the influence of karstic sources (mostly apparent on<br />
the Yemtsa itself, tables 17 and 18); the large range of discharges of the Vaimuga and<br />
Kodina rivers is attributed to slight karst development in their drainage basins.<br />
1101<br />
(3 ~ C P K<br />
100<br />
a .<br />
..<br />
... .. .<br />
. .<br />
.. .<br />
/96Rr.<br />
. . . .. f<br />
_c_<br />
111 I IV I V VI UII VIiI<br />
l l I<br />
I<br />
Yemtsa at railway bridge<br />
Vaimuga at Permilovo<br />
Kodina at Kodino<br />
Solza at “ Sukhie Poroghi”<br />
Vaga at Gluboretskoya<br />
Fig. 8 - Combined hydrograph of the Emtsa river.<br />
-2<br />
TABLE i7<br />
Annual rates of maximum run-off in I/sec/km2<br />
River A, km2<br />
Years<br />
-<br />
1957 1958 1959 1960 1961<br />
River<br />
Yemtsa at railway bridge<br />
Vaimuga at Permilovo<br />
Kodina at Kodino<br />
Solza at “Sukhie Poroghi”<br />
Vaga at Gluboretskaya<br />
1,580 73 61 43 13 62<br />
2,800 136 58 64 27 126<br />
1,820 173 92 71 31 166<br />
1,240 160 103 78 62 136<br />
1,410 250 147 121 102 202<br />
TABLE 18<br />
Anrtual rates of minimum run-off in l/sec/km2<br />
A in km2<br />
Years<br />
1957 1958 1959 1960 1961<br />
1,530 4.30 7.26 - 4.49 4.37<br />
2,800 2.49 2.91 2.34 2.01 2.55<br />
1,820 2.34 3.10 2.16 1.93 2.16<br />
1,240 1.41 0.95 0.95 0.88 0.97<br />
1,410 0.63 0.79 0.35 0.34 0.71<br />
559
The annual rates of maximum run-off of the Yemtsa river increase down-stream<br />
(table 19). This is the same phenomenon as observed in the case of the upper course<br />
of the Oredezh, but occurring over more of the drainage basin.<br />
TABLE 19<br />
Annual rates of maximum run-of along the Yemtsn river in i/sec/km2<br />
River A in kmz<br />
Years<br />
1959 1960 1961<br />
Yemtsa at railway bridge 1,580 43 13 62<br />
Yemtsa at Seltso 8,180 55 19 71<br />
Fig. 9 - Scheme of rivers in the Middle Volga area. Stream gauging stations: 1 .Tesha<br />
river at Novoselki; 2. Seryozha r. at Lesunovo; 3. Kudma r. at Novaya; 4. Pyana r.<br />
at Gaghino; 5. Pyana r. at Kamkino; 6. Alatyr r. at Madaevo; 7. Alatyr r. at<br />
Turghenevo.<br />
5 60
The data given above show that karstic influence upon run-off in the Emtsa<br />
catchment area is mainly and quite explicitly revealed in the regulation of annual<br />
run-off. Karst affects areal runoff variously and deviates from the zonal norm in both<br />
directions. This fact should be explained not only by the lack of coincidence of the<br />
surface and underground catchment areas, but also by fluctuation of the latter.<br />
4. KARST AND STREAMFLOW IN THE MIDDLE VOLGA REGION<br />
On the right bank of the Volga in the Gorky region (fig. 9), karst does not form<br />
compact massif. The karst-forming rocks, limestones, dolomites, and gypsums occur<br />
as separate islands and stripes in the catchment areas of the following rivers: the<br />
Tesha (tributary of the Oka), the Seryozha, the Kudma, the Pyana (tributary of the<br />
Sura). These rocks emerge here and there at the surface and form clearly expressed<br />
karstic formation such as fissures, collapsed lakes (as in the middle Pyana basin and<br />
Seryozha basin), caves, etc.<br />
, In this region karst does not regulate the annual run-off, but has rather a negative<br />
influence upon it (table 20), annual rates of minimum run-off of all rivers being negligible<br />
(about O. 10-0.40 I/sec/km2). Sometimes rivers periodically dry up (the upper course of<br />
the Tesha, for instance) because of the complete outflow of water into karst rocks.<br />
Only the maximum run-off undergoes some smoothing influence of karst (table 21).<br />
The average annual rates of run-off here are lower than zonal values (the Serozha<br />
river) or approach them (table 23).<br />
TABLE 20<br />
The natural regulation (A) of the summer loic water and winter run-off<br />
for the period of ì9.57-1961<br />
River Ain km2 QslQy QUI Qu Note<br />
Tesha at Novoselki 1,240 10 7 Karst<br />
Seryozha at Lesunovo 1,810 23 17 Karst<br />
Kudma at Novaya 1,700 39 26 Karst<br />
Pyana at Gaghino 2,880 19 7 No karst<br />
Pyana at Kamkino 6,310 44 35 Partially karst<br />
Alatyr at Madayevo 1,340 21 18 No karst<br />
Alatyr at Turghenevo 10,800 25 16 No karst<br />
One can see from table 20 the natural regulation of the low water (July-August)<br />
and winter (January-February) run-off of the rivers mentioned above is everywhere<br />
River<br />
TABLE 21<br />
Annual rates of maximum run-ofl in l/sec/km2<br />
Years<br />
1952 1953 1954 1955 1956<br />
Pyana at Gaghino 172 216 61 214 255<br />
Pyana at Kamkino 44 19 25 69 66<br />
Seryozha at Lesunovo 26 43 7 83 77<br />
Alatyr at Turghenevo 65 97 18 130 91<br />
561
negligible. Only at the Pyana near Kamkino the regulation is moderate. This ma)<br />
be attributed to the increased feeding of karstic waters through underground ways<br />
from the upper part of the basin.<br />
TABLE 22<br />
Acerage rutes of run-off for the period of 1952-1956 in l/sec/km2<br />
River A, km2 Qav<br />
Seryozha at Lesunovo 1,810 2.3<br />
Pyana at Gaghino 2,880 3.60<br />
Pyana at Kamkino 6,310 3.65<br />
Alatyr at Turghenevo 10,800 3.34<br />
Average rates of run-off of two neighbouring rivers (the Seryozha and the Pyana)<br />
differ sharply from each other. The low rate of run-off in the basin of the Seryozha,<br />
which incidentally cannot be determined from any available run-off map for this<br />
region (2), is explained by the outflow of waters through underground channels. The<br />
presence of a complicated system or karst lakes in the basin of the Seryozha contributes<br />
to this effect.<br />
The marked difference in average rates of run-off of neighbouring rivers is often<br />
observed in karst regions where there is an alternation of karstic and non-karstic<br />
rocks. This is especially characteristic for the Urals (3,4).<br />
The consideration of the run-off data in karstic regions has led (2,4) and once again<br />
leads to the following conclusions.<br />
1. The application of the analogy method for hydrological designs in small rivers<br />
of karstic regions and in particular the use of ordinary small-scale maps of run-off<br />
should be strictly limited to indisputable cases of proven natural similarity. The<br />
average run-off data of some karstic rivers have to be plotted upon the existing maps<br />
of isolines of average run-off and these data should be incorporated within the large-<br />
scale regional maps of run-off (average, maximum a d minimum rates).<br />
2. Schematic maps should be drawn of the summer low water and winter run-off<br />
regulation for the approximate evaluation of water resources.<br />
3. In karstic regions it is expedient to establish a relationship between streamñow<br />
and the level of underground waters feeding the rivers, so as to estimate approximate<br />
nui-off from the data of level fluctuations.<br />
4. The development of detailed field investigations in karstic regions are of urgent<br />
necessity. In the USSR there is a vast scope for such activity.<br />
5 62
II<br />
LACS KARSTIQUES<br />
KARSTIC LAKES
SUMMARY<br />
LAKES IN THE CROATIAN LIMESTONE REGION<br />
Milivoj PETRIK<br />
A discussion is presented on the permanent natural accumulations of water on<br />
earth’s surface in the limestone region of Croatia. Such accumulations are divided<br />
into two groups: lakes proper, and small accumulations called “Oka”.<br />
The discussion covers all lakes of that region. They are: 1. the lake Vrana on the<br />
island of Cres, 2. the lake Jezero on the island of Krk, 3. the lakes of Plitvice, i.e.<br />
the 14 larger basins, 4. the lake Vrana at Biograd in Dalmatia, 5. the lakes along the<br />
river Krka, 6. six lakes in the environs of Imotski, in Dalmatia, 7. the lakes of BaCina,<br />
in Dalmatia.<br />
Because the smaller accumulations, often called “Oka”, are too numerous to be<br />
discussed in their totality, only a representative series of the more interesting ones are<br />
discussed, viz. those at Sv. Stjepan in Istria, at Rijeka, Slunj, Ogulin, in the region of<br />
the lower Krka river, at Imotski and those in the region of the lower Neretva rive?.<br />
The discussion includes-as far as they are at present known-data on geographic<br />
position, altitude, general morphology, geology and hydrology, genesis, quality of<br />
water, temperature, dissolved oxygen, free carbon dioxide, total, carbonate and non-<br />
carbonate hardness, alkalinity, calcium, magnesium and chloride, transparency and<br />
productivity. Seasonal stratification of water is also discussed.<br />
Finally, an attempt is made to arrive at the common characteristics of the lakes in<br />
that region.<br />
RESUME<br />
Les lacs de la region cnlcnire de Croatie<br />
Cette étude porte sur les accumulations naturelles permanentes d’eaux super-<br />
ficielles dans la région calcaire de Croatie. On distingue les lacs proprement dits et<br />
les accumulations d’eau moins importantes appelées «Oka ».<br />
Tous les lacs de cette région sont étudiés, à savoir : (1) le lac Vrana, dans l’île de<br />
Cres; (2) la lac Jezero, dans l’île de Krk; (3) les lacs de Plitvice, c’est-à-dire les 14<br />
bassins principaux; (4) le lac Vrana A Biograd en Dalmatie; (5) les lacs situés sur le<br />
cours de la Krka; (6) six lacs des environs d’hotski, en Dalmatie; (7) les lacs de<br />
BaCina, en Dalmatie.<br />
Les N Oka ) étant trop nombreux pour etre étudiés en totalité, l’auteur ne considère<br />
qu’un ensemble représentatif des plus intéressants d’entre eux : ceux de Sv. Stjepan<br />
en Istrie, de Rijeka, Slunj, Ogulin, dans la région du cours inférieur de la Krka,<br />
d’Imotski et du bassin inférieur de la Neretva.<br />
L’auteur fait en outre le bilan des connaissances actuelles sur les points. suivants :<br />
situation géographique, altitude, morphologie générale, géologie et hydrologie, origine,<br />
qualité de l’eau, température, oxygène dissous, quantité totale de gaz carbonique<br />
libre, dureté en carbonates et non carbonates, alcalinité, calcium, magnésium et<br />
chlorure, transparence et productivité. La stratification saisonnière des eaux est égale-<br />
ment examinée.<br />
L’étude se termine par un essai de définition des caractéristiques communes aux<br />
lacs de la région calcaire de Croatie.<br />
Lakes are defined as large or extensive bodies of water entirely surrounded by land,<br />
occupying a depression in the land’s surface. The definition is vague because the terms<br />
“large”, “extensive” and “depression” can include various orders of magnitude.<br />
The line between lakes and marshes, and between large and small bodies of water is<br />
not sufficently sharp.<br />
In this paper, we shall deal with such bodies of water which are deep enough to<br />
exclude development of aquatic vegetation except along their shores and sufficiently<br />
wide to be forced to the use of boats for their exploration.<br />
The number of such bodies of water is large in the limestone region of Croatia.<br />
565
For this reason, we shall consider only non-artificial and perennial bodies of sweet<br />
water; of these, all easily accessible, major bodies of water wil be included, but of the<br />
smaller bodies, called ‘‘Oka” and “ jama”, only some characteristic examples wil<br />
be given.<br />
The geographic position of them is given in figure 1 to 4 of our paper on “Charac-<br />
teristics of water from sources in the limestone region of Croatia” P).<br />
THE LAKES OF PLITVICE<br />
The lakes of Plitvice make a series of 14 larger and a great number of smaller<br />
lakes, arranged in single or multiple cascades. For the eight largest lakes, the principal<br />
data are given in table 1.<br />
The lakes lie in the uppermost part of the original canyon of the river Korana,<br />
as is shown on figure 1. Their orjgin is due to the growth of barriers built by carbonate<br />
Fig. 1 - The lakes of Plitvice: situation and longitudinal section along the line of<br />
greatest depths.<br />
depositing mosses, as was shown by I. Pevalek (2* 3). In the opinion of J. Roglié their<br />
growth started after glaciation, on places favourable for their development (‘9, and<br />
is still in progress; it produces, sometimes interrupted by breaks of barriers, slow but<br />
constant changes in the altitudes and dimensions of the lakes. In figure 1 is visible how<br />
the bottom of the lakes follows the bottom of the original canyon; also are visible the<br />
imposing measures of the barriers, both those which are still active and also some of<br />
the submerged barriers. On figure 2 is shown a dead lower part of a still active, huge<br />
barrier.<br />
AI1 lakes on the upstream side of the largest lake, Kozjak, are situated in dolomite,<br />
all lakes on the down-stream side in limestone, and the lake Kozjak itself is in dolomite<br />
along its western and southern shores, and in limestone on its eastern side.<br />
According to A. Pollak (5$ 6~ 72), upper-triassic dolomite makes the most impermeable<br />
sediment of the dolomitic region, causing water from the south and west to<br />
circulate towards the lakes. It is concordantly covered by jurassic dolomite and limestone,<br />
and these by upper-cretaceous, permeable, dolomites or limestones, bare of<br />
ail springs. The Iakes are fed by water from a number of springs, ali of them in dolomites<br />
(1, points 46-49). The circulation of water before its appearance in springs is governed<br />
by tectonic factors, especially faults.<br />
566
Fig. 2 - The lakes of Plitvice: the dead lower part of a phytogenic barrier.<br />
The lakes below Kozjak are arranged in a single row and their banks are high,<br />
almost perpendicular, and in large areas eroded smoothly. Remnants of subterranean<br />
water courses still exist in the shape of caves and tunnel trunks on various elevations<br />
on both banks; one of the caves is shown on figure 3. These phenomena brought<br />
J. Poljak to interpret the genesis of the lower lakes by assuming an original flow<br />
of water in their region partly on the surface and partly underground, until erosive<br />
and corrosive processes caused destruction of the ceiling of subterranean courses<br />
and successively established the present open canyon which was later, by the growth<br />
of phytogenic barriers, divided into four lakes.<br />
The bottom of the lakes follows the slope of the canyon but is across the lakes<br />
nearly horizontal and consists of precipitated carbonate mainly.<br />
The total dry weather flow through the lakes is around 600 l/sec. and forms, with<br />
the water from the river Plitvica, the river Korana (i, points 50-51).<br />
The lakes are oligotrophic. Their main macroorganisms are trout and crayfish.<br />
The transparency of the lakes, as measured by the Secchi disc, is between 3.60 and<br />
12.45 m; the lowest values were obtained in the lakes ProSCe and Galovac, the highest,<br />
in the deepest region of Kozjak. it was lowest in February-May, highest in October-<br />
November.<br />
567
The lakes show thermal stratification. It is most clearly expressed in early autumn.<br />
A weil defined epi-, meta- and hypolimnion is established in the lower Kozjak, with<br />
the temperature at bottom varying between 4.0 and 4.5 "C throughout the year, and<br />
at the top between O and 22°C. Less well established is the stratification in the lake<br />
ProSCe, the water of which is cooled in summer and heated in winter by the springs<br />
and creeks feeding the lake; its summer temperatures at the bottom are around 6°C.<br />
Fig. 3 - The lakes of Plitvice: remnants of a former subterranean water course in<br />
the region of the lower lakes.<br />
For this reason, the lake is covered by ice in winter-if at all-for a shorter period than<br />
the lake Kozjak, the altitude of which is 100 m lower than that of ProsCe. The lakes<br />
of 10 m of depth do not show any stratification. As is evident, the lakes are holomictic,<br />
with two overturns.<br />
In examinations carried out in all seasons in the period 1952-1960, in the deepest<br />
regions of the various lakes, from top to bottom, the concentration of oxygen varied<br />
between 0.4 and 14.7 mg/l, but were commonly between 8.6 and 1.8 mg/l, the satu-<br />
ration varying between 82.5 and 125.8%. Graphic presentation of oxygen concentrations<br />
is of the clinograde type.<br />
568
As a rule, no carbon dioxide was present. The mineral content varied as shown in<br />
table 2. The percentage of magnesium hardness in total hardness discloses water from<br />
dolomite with some limestone which is in full agreement with the geological conditions.<br />
During the flow from the springs through the lakes into the Korana, the water loses<br />
some carbonate hardness through precipitation and utilization by barrier-building<br />
mosses and algae. The values of carbonate hardness were in the springs between 221<br />
and 291 mg/l, in the lake ProlCe on the surface 230-240, in the lake Kozjak 204-218,<br />
in the river Korana below the lakes 200, and at Slunj 196 mg/l ('J 10).<br />
No nitrogen at all was found in the lakes, and the consumption of oxygen from<br />
KMn04 was below 2 mg/l.<br />
Fig. 4 - The lake Vrana on the island of Cres: View along the longitudinal axis.<br />
THE LAKE VRANA ON THE ISLAND OF CRES<br />
Among the Adriatic islands, there are several with accumulations of water in the<br />
form of lakes, as on Cres and Krk, or marshes, as on Krk, Pag, KorEula and Mljet.<br />
Of these accumulations, the lake Vrana on Cres is by far the largest one; it belongs<br />
also to the largest lakes in Croatia.<br />
Its geographic position is 44"51' N and 17"23' E.<br />
According to the results of comprehensive geodetic and other measurements<br />
organized by the present author in 1953-1956 (li, 12, 13), the older data on its elevation<br />
and depth which still persist in literature, should be corrected.<br />
The elevation of its surface oscillates around 12.25 m above the sea and may be<br />
up to 2.5 m higher or lower, according to meteorologic conditions (li, 13).<br />
The form of the lake is shown on figure 5. Its length is about 5200 m, its greatest<br />
width 1500 m, and the surface around 5.75 km2; its volume of water is about 0.28 km3.<br />
The slope of the bottom is steep on the eastern and western flank and mild on both<br />
ends. At 40 m below the sea level the slope goes over into a flat bottom, nearly horizontal;<br />
its lowest point is 42.8 m below the sea level. At the south-eastern end of the lake,<br />
569
I l<br />
I_<br />
I<br />
I<br />
I<br />
I<br />
I<br />
l<br />
I<br />
I<br />
1<br />
I<br />
I l<br />
. I<br />
l<br />
I l<br />
I ,<br />
, I<br />
I<br />
1 I<br />
I<br />
I<br />
l<br />
I<br />
I<br />
l I<br />
I l<br />
O<br />
E<br />
a<br />
B
there is a funnel-shaped depression in the bottom; its lowest point is 61.5 m below the<br />
sea. Along the flanks, the bottom is rocky, but on mild slopes and in its flat part it<br />
is muddy and consists mainly of precipitated carbonate; it is covered by a Chara<br />
vegetation (I4). Another characteristic organism of the lake is Ceratium (Is).<br />
The lake is situated in a cryptodepression which constitutes a submerged "polje"<br />
without sufficient drainage capacity which was, in its lower part, transformed into a<br />
lake when the rise of the sea level caused a decrease of the seepage of water. The<br />
relatively high mean elevation of the lake surface is determined by low permeability<br />
of the lake's flanks.<br />
As shown by A. Magas, the area of the lake's watershed is built of three main<br />
geologic members: limestones of upper-cretaceous and lower-cretaceous age, with<br />
transitional dolomites between them. Originally, they were arranged in normal<br />
sequence, forming a surface warping in a series of alternating synclines and anticlines<br />
of dinaric strike. After eocene, that system was disturbed by a series of parallel thrust<br />
faults, of the same strike. The outcome was the present statea sequence of series,<br />
all dipping to the east, each having lower-cretaceous limestone covered by dolomite,<br />
and dolomite by upper-cretaceous limestone, with insignificant areas of eocene and<br />
quaternairy. One of the faults runs along the western border of the lake and is intersected<br />
by another fault striking along the longitudinal axis of the lake. These two faults<br />
seem to have predisposed the present lake, at a time when the sea was much lower<br />
with respect to land, and caused disintegration of rocks in the area of the lake. They<br />
also provided the way for subterranean drainage of that area. Subsequent erosion<br />
cleaned away the debris and established the present basin of the lake. It would seem<br />
that the entrance to subterranean drainage channels was in the depression of the bottom<br />
of the lake which successively became clogged, thus causing accumulation of<br />
water in the basin (16).<br />
The drainage area of the lake is partly forest, macchia and bare rocks, it is very<br />
sparsely inhabited, with an insignificant cultivated area. The only water which enters<br />
the lake is derived from rains within the watershed which has an area of some 33 km2.<br />
The water washes away the salt deposited on the surface with sea spray carried inland<br />
by winds, especially by the strong north-easterly, the " bura".<br />
The lake can lose water-besides by evaporation-only by subterranean flow.<br />
That flow may be either concentrated on one or several points, or more or less uniformly<br />
distributed along the flanks, but not through the bottom which consists of thick<br />
deposits of extremely fine precipitated carbonate. Since there are no submarine sources<br />
of greater discharge known up till now around the northern part of the island, it does<br />
not seem impossible that the lake loses water through its steep lateral banks, the<br />
seepage being distributed along them. It has been shown that the rate of the seepage<br />
is in linear relation to the elevation of the lake surface, as is the case with the flow of<br />
water through fine-grained media, but that the coefficient of permeability is much<br />
lower; the average rate of seepage was shown to be around 570 l/sec. (I1).<br />
The transparency of the lake water was found to vary between 17.65 and 23.85 m<br />
in March, and between 10.15 and 15.1 min summer.<br />
The temperature on the surface of the lake, as measured by Casagrandi (15),<br />
Nümann (I7) and the present author (12), was at the end of July and in August, on<br />
the surface between 22.2 and 24.8"C, and at the bottom between 6.1 and 9.0"C; in<br />
March it was at the surface between 4.7 and 7.4"C, and at the bottom between 4.5<br />
and 6.5 "C. The temperatures at the end of winter show the lake to be holomictic and<br />
monomictic; the mixing takes place at the lowest temperature to which the lake is<br />
cooled in the course of the winter. In summer, there is a very well defined thermal<br />
stratification of the water, with a thoroughly homogeneous epilimnion 9 to 10m<br />
deep at the end of July. A perfect thermal and chemical homogeneity of the lake<br />
is established at the end of the winter.<br />
571
As to oxygen in the lake, the whole lake is, at the end of winter, practically saturated.<br />
In high summer, the epilimnion is a little supersaturated, the metalimnion markedly<br />
supersaturated, and the hypolimnion still between 80 and 100 per cent of saturation.<br />
The curve of the oxygen concentrations is orthograde. The oxygen disolved from the<br />
atmosphere in the period of mixing is used up very slowly in summer, and the pro-<br />
duction of oxygen by phytoplankton is very low.<br />
Total hardness varies in July between 130 and 150 mg/l, the lowest values being<br />
found in epilimnion. In March 1956 it was 139 mg/l in ali determinations and at ali<br />
depths. Non-carbonate hardness is very low, between 25 and 29 mg/l, and magnesium<br />
hardness 21 mg/l, or 15% of total hardness, which indicates a drainage area of dolomite<br />
and limestone in exact correspondence to the geology of the drainage area.<br />
Chloride was found in July 1954 at all points and depths between 69.2 and 72.2 mg/l,<br />
and in March 1956 in 20 determinations on 3 points and at all depths at 69mg/l.<br />
Since it was present at all depths in the same concentration, it cannot be taken as a<br />
Fig. 6 - The lake of Visovac: view across the lake at the point of the greatest width.<br />
sign of the intrusion of sea-water but must be considered as brought in by winds,<br />
with the spray, deposited on the vegetation and rocks, and washed into the lake by<br />
rain water. Nümann found on five occasions between 63 and 66 mg/l, also at all<br />
depths (17).<br />
No nitrogen was found; the consumption of KMn04 was below 2.5 mg 02/1.<br />
Nümann found in the lake between 1.8 and 20.4 gramatoms Si!m3, and phosphorus<br />
and iron only in traces.<br />
All characteristics of the lake show it to be highly oligotrophic.<br />
THE LAKE JEZERO, ON THE ISLAND OF KRK<br />
In a shallow depression in the background of Njivice, there is a lake which once<br />
covered a much larger area but was, for agricultural reasons, in part drained by a<br />
572
tunnel into the sea. The elevation of the lake surface was by that measure brought<br />
down to 1.1 m above the level of the sea, in dry weather.<br />
The geographic co-ordinates of the lake are 45" 10' N and 14" 34' E.<br />
The shape of the lake is very roughly rectangular. At the elevation of 1.1 m it<br />
measures in length 740 m and in width about 600 m. The slope of the bottom and of the<br />
surrounding area is so small that the borderline of water is ill recognizable, on account<br />
of reed. The basin consists, in fact, of two basins divided by a submerged reef, also<br />
marked by vegetation. The lake covers an area of about 25 ha. Its greatest depth is<br />
8.3 m, at the gauge reading of 1.1 m; the deepest point is thus 7.2 m below the level<br />
of the sea. The lake lies, therefore, in a cryptodepression covered by alluvial sediments.<br />
The substratum is an anticline the core of which consists of cretaceous breccias and<br />
limbs of upper-cretaceous limestones. The lake is in the eastern limb of the anticline<br />
which, further on, dips under eocenic limestones; the western limb dips under the sea.<br />
The drainage area of the lake extends further on to the south and is built of cretaceous<br />
limestones and breccias, while eocenic layers of shale probably act as impermeable<br />
barriers (la). On the very border of the lake, towards the west, a sinkhole is coming into<br />
action if the lake surface reaches the elevation of 2.4 m above the sea.<br />
The lake is fed by surface drainage from the east, and by underground drainage<br />
from the south. Close to its southern border are two springs, in alluvium, which always<br />
deliver water to the lake (I, points 97-98; the lake itself is point 96). Surplus water<br />
is evacuated from the lake through the tunnel into the sea; at elevations of its surface<br />
above 2.4 m the sinkhole also comes into action.<br />
Because of the swampy character of the lake borders, it is difficult to put a workable<br />
boat on the lake, which is probably the reason why it has been examined only partially.<br />
At an examination conducted by the present author in August 1964, the results of<br />
table 3 were obtained.<br />
Oxygen and carbon dioxide show concentrations usual in swampy waters. Alkalinity<br />
and hardness are much lower than in springs on the lake border, and so is salinity.<br />
The latter was, however, in observations made in October 1959 on many points and<br />
at depths from O to 7 m found to vary between 90.0 and 95.6 mg/l. That is not very<br />
much higher than in the lake Vrana; the origin of the salinity is in both cases probably<br />
the same. The percentage of magnesium hardness to total hardness is in accordance<br />
with the nature of rocks in the possible drainage areas.<br />
The essential difference between the hardness of the lake and of the springs on its<br />
border may be caused by the r6le of surface drainage from the east which is periodical<br />
and could not be examined in August 1964.<br />
THA LAKE VRANA IN DALMATIA<br />
Northern Dalmatia consists, in a great measure, of a series of synclines and anti-<br />
clines which strike parallel to the coast. The bottoms of synclines are covered by<br />
more or less impermeable eocenic sediments. Between Biograd and the Bay of Sibenik,<br />
in the first syncline from the coast, the lake of Vrana is situated, at 43" 53.5' N and<br />
15"35' E. In the past, it was very much larger until an outlet into the sea was built in<br />
1897, for agricultural reasons, which caused a lowering of the lake surface.<br />
It is fed by water from a number of springs situated beneath the north-eastern<br />
limb of the syncline; they deliver water from the hinterland. It loses water not only<br />
through its artificial outlet, but also-according to Gavaui (19)-through sinkholes<br />
on its bottom. It drains a vast agricultural area and at present it is used for raising<br />
fish. So it lost its natural state of purity a long time ago and in its present state it is<br />
of no great interest, in spite of its still great surface area. By Gavazzi's measurement,<br />
its depth is 3.9 m.<br />
573
THE LAKES OF THE RIVER KRKA<br />
On several points along the river Krka barriers of phytogenic origin can be observed<br />
(20), some of them of imposing dimensions, which divide the course of the river into<br />
several lake-like sectors. In its lower course, above Skradin, there is such a barrier,<br />
the greatest of all, having a total height, between the lower and upper water surface,<br />
of 45 m. It is called Skradinski Buk-the falls of Skradin. The rise of that barrier caused<br />
a rising of the water level on its upstream side in such a measure that two lakes were<br />
created: the lake Visovac, on the river Krka, and the lake of Cikola, a river tributary<br />
of the Krka which joins the Krka just above the falls of Skradin (i, points 126-127<br />
on fig. 3). The two lakes are connected at their lower ends and are on the same elevation<br />
of 45 m above the sea. They are, in fact, parts of the two river courses, but because<br />
of their relatively great depth the velocities and the turbulence of flow are very low,<br />
which causes stratification of the water as it occurs in lakes.<br />
THE LAKE OF VISOVAC<br />
It is situated in the canyon of the lower Krka, between the falls of Skradin and those<br />
of Rogovo (RoSki Slap), which latter are on another travertine barrier, on the upstream<br />
side, 23.5 m high (20). The lake is a little longer than 12 krn; its width and depth in<br />
various sectors are given in table 4. The greatest depth is in the most narrow stretch<br />
of the lake, the smallest ili the widest stretch.<br />
B. Petrik, S. Sirca and I. Degkovik found in August 1957 at various points and<br />
depths of the lake the main characteristics of its water as shown in table 5. Both ternper-<br />
ature and dissolved oxygen showed stratification. Temperature below 19 m of depth<br />
was in general essentially different than above that depth; for oxygen, the criticai<br />
depth was around 12 m.<br />
THE LAKE OF THE CIKOLA<br />
That part of the canyon of the river Cikola which is below the elevation of the<br />
barrier crest of Skradinski Buk has become the lake of the Cikola. Its length is about<br />
3.5 km, and the maximum width about 650 m. The greatest depth at the confluence<br />
with the lake Visovac is 28 m.<br />
Just beside the uppermost part of the lake is Torak, a strong, perennial spring of<br />
the peculiar shape of an “oko” (i, point 126). Cikola itself. on the upstream side of<br />
the lake, may run dry in rainless periods. The deepest point of the cone of Torak is<br />
at 2.6 m below the level of the sea, and the deepest point of the lake Cikola is i7 m<br />
above the sea at its mouth into the lake of Visovac, and 34.3 m above the sea at the<br />
distance of 750 m downstream of Torak. The deepest point of the “oko” of Torak is,<br />
therefore, nearly 20m below the deepest point of the lake which is fed by it and<br />
nearly 37 m below the lake in its upstream part.<br />
Both Torak and Cikola were examined in August 1957 by the same investigators<br />
as the lake Visovac. The water of Torak originates in pure limestone, that of the<br />
Cikola corresponds to dolomitic limestone.<br />
THE LAKE PROKLJAN<br />
In the course of time, the eastern coast of the Adriatic came partly under the level<br />
of the sea, by the rise of the sea or by the lowering of the continent, or by both (21).<br />
574
In that process, the valleys of the Dalmatian rivers Zrmanja, Krka and Neretva were<br />
partly submerged. The subterranean circulation of water in fissured carbonate rocks<br />
was at that time already well developed, as is witnessed by many submarine springs<br />
which still function, and-among others-also by the “oko” of Torak. The valley<br />
of the river Krka below the Skradinski Buk also came under the sea; in this way the<br />
lake Prokljan was formed in a flat part of the Krka valley. It is called a lake but is,<br />
in fact, an enclosed part of the sea, filled by sea water except in the upper 2 metres, as<br />
was found by the above-mentioned investigators in 1957 in that part of the Krka which<br />
is between the falls of Skradin and the lake of Prokljan. The variations of temperature<br />
and oxygen dissolved on two points of that sector, from top to bottom, are shown<br />
in table 6, together with the variations of salinity. The greatest depth of the lake is<br />
21 m (22).<br />
THE LAKES OF IMOTSKI<br />
From the standpoint of the hydrography of limestone regions, the lakes of Imotski<br />
are very interesting and instructive indeed.<br />
A long and important line of tectonic disturbance seems to extend from LjubuSki<br />
over Grude and along the north-eastern border of the “polje” of Imotski towards<br />
BuSko Blato. Along that line, there is a number of hydrogeologic phenomena: springs,<br />
sinkholes, “ponikvas” (23, 24). Among them are the springs of the river Vrlika (i,<br />
points 150-152) at the altitude of 268 m above the sea, and a number of young<br />
“ponikvas”, not yet filled up and containing water. These are known as the lakes of<br />
Imotski. All of them are in Dalmatia, close to the border of Hercegovina, and along<br />
the border of the “polje” of Imotski (see 1, fig. 4). For the most important of them,<br />
the main data are given in table 7.<br />
Except the run-off from their geographic drainage areas, which are extremely<br />
small, all lakes receive and lose water only subterraneously with the exception of the<br />
lake of Proloiac (ProloSko Jezero, also called Imotsko Blato) which also receives<br />
the discharge of the river Suvaja, and loses water partly into the river Vrlika. According<br />
to J. Poljak (26), sinkholes in the north-eastern hinterland of the polje, within the<br />
watershed of the Suvaja river, may lose water into these lakes, but other sources are<br />
not excluded. Since the Modro Jezero (the Blue Lake) reaches an altitude of 342 m,<br />
it must receive water from sources higher than that, but could be fed, in addition, also<br />
by lower sources. On some bodies of water in this region, colour was observed after it<br />
was introduced into the water at the sinkholes of BuSko Blato (27). The relations<br />
between the levels of the various lakes at different times and in simultaneous observa-<br />
tions can be seen, for some characteristic periods, jn table 8. In July 1955 was the water<br />
level in the greatest lake, that of Proloiac, just on the level of the springs in the “polje”<br />
but in the three next greatest lakes it was very much lower. In September of 1955<br />
Modro Jezero was nearly 30 m below them, if not more, because at that time the lake<br />
had run dry. In September 1956 were the levels of all the lakes observed also below<br />
the level of the springs; in March 1957 were, however, all lakes above the spring level.<br />
The differences in the levels of individuai lakes at various times were also great, and<br />
so were those between different lakes at the same time: Galipovac was in 1955 higher<br />
than Modro Jezero and lower than the lake of Proloiac, but in 1957 it was lower than<br />
Modro Jezero and higher than the lake of Proloiac. The observed levels of Crveno<br />
Jezero show fluctuations of 20 m, and in the Modro Jezero of more than 100 m.<br />
The hydrography of Imotski was A. Grund’s argument for his conception of the<br />
“Karstwasser” (28). One may wonder what modifications his theory might have<br />
undergone, if such data had been accessible at his time.<br />
The “ponikva” of Crveno Jezero (fig. 7) is of cylindrical form. This fact makes us<br />
believe that it is the youngest among them. It is 519 m deep, the highest point of the<br />
575
circumference being at 522.9 m and the deepest point of the bottom at 4.1 m above the<br />
level of the sea. The surface of the water oscillates around the middle, that is about<br />
260 m above sea. Its rocky wails are on three sides nearly perpendicular in their entire<br />
height, and on the fourth side in the lower half. The bottom is rocky and slopes to the<br />
west. The earthquake of 1942 caused a large portion of the western wall to drop into<br />
the lake. The surface of the lake has an area of about 33,000 m2; the water volume is<br />
more than 6,000.000 m3.<br />
Fig. 7 - The Red Lake at imotski: view from the rim of the “ponikva”.<br />
The “ponikvas” of the other lakes are older; the older the lake, the more advanced<br />
is the process of filling up the cavity of the “ponikva” by disintegration of its walls.<br />
All other lakes have the form of inversed truncated cones, with horizontal and flat<br />
bottom built up of precipitated carbonate, and steep slopes. The largest of them is the<br />
Modro Jezero (the Blue Lake), in which the observed level varies between less than<br />
239 and at least 342 m above the sea level. The KnezoviCa Jezero has very steep and<br />
unstable sloping walls and is difficult of access which is the reason why it could not<br />
have been measured and investigated. The lake LokviTiC has less steep walls; the water<br />
has an observed depth between 30 and 40 m. Galipovac has between 40 and 50 m of<br />
water. The lake of Proloiac has been filled up with rocks and sediment above the<br />
lower part of its brim and presents now a wide expanse of water the depth of which<br />
varies between 25 and 30 m. it has a perfectly flat bottom.<br />
All of these lakes are in upper-cretaceous limestones which lie on dolomite. In<br />
the opinion of J. RogliC, so far the most thorough investigator of this region, the<br />
subterranean water courses, at the contact of limestone and dolomite, corroded the<br />
limestone and eroded the dolomite so far that the ceilings of the large cavities succes-<br />
sively collapsed. That process is still active, as witnessed by a sinking of the ground,<br />
caused by the earthquake of 29 December 1942, and also by two minor “ponikvas”<br />
which appeared a few years ago in the plain of the Jezero of Proloiac (29).<br />
576
As the deepest point of the Crveno Jezero is at 4.1 m above the sea, the true, orig-<br />
inal bottom must be still deeper, because the ground is covered by the material of the<br />
ceiling and walls, and also by that rolling down the slope below the eastern part of<br />
the brim. It should lie, therefore, below the present level of the sea.<br />
3<br />
I' /<br />
4.1<br />
v<br />
4 12.VII 1955.<br />
Fig. 8 -_The Red Lake at Imotski: cross-section.<br />
The contact of water in the lakes with both limestone and dolomite is confirmed<br />
by the percentage of magnesium hardness in total hardness, especially for Crveno<br />
Jezero, as can be seen in table 9. From the values for total hardness, in the same table,<br />
it is discernible that the lakes Crveno, Galipovac and LokviEiC receive water from<br />
greater depth than Modro and ProloSko Jezero, or-possibly-from different sources;<br />
3'<br />
1<br />
577
for such conclusion speak the great differences in hardness both at the surface and at<br />
bottom, as also variations in hardness at the bottom.<br />
All lakes show homogeneous water from top to bottom, its hardness increasing<br />
with depth, as is usual, but with all characteristics nearly constant in hypolimnion.<br />
Only the lake of Proloiac displays heterogeneous water in various depth regjons.<br />
All show thermal stratification with well expressed epi-, meta- and hypolimnion.<br />
The overturn may occur at temperatures higher than 4.0°C, as is shown by bottom<br />
temperatures of all lakes; in that case, the lakes would be monomictic. Ali of them<br />
are holomictic. With the exception of the lake of Proloiac all lakes are oligotrophic,<br />
with transparency varying between 8.6 and 13.05 m while in the lake of Proloiac it<br />
varied from 0.3 to 1.35 m (table 9).<br />
A comparison of the characteristics of water from lakes and from springs shows<br />
about the same hardness in springs as in Crveno Jezero, Galipovac and LokviEiC, with<br />
a smaller percentage of magnesium hardness, but a higher hardness than in Modro<br />
Jezero and ProloSko Jezero.<br />
&INSMA JEZERA<br />
Fig. 9 - The lakes of BaCina: situation with isobates.<br />
It should be mentioned here that some of the dye put in one of the sinkholes of the<br />
BuSko Blato on 31 December 1960 appeared on three points at Imotski-in the lake<br />
of Proloiac, in the spring Opatac and the periodic spring at Grude (i, points 150<br />
and 158) which fact discloses some hydrographic connexion between the two regions (30).<br />
Since there is always oxygen present at all depths of all lakes, with the saturation<br />
at bottom above at least 35%, it can be taken that parts of the underground channels<br />
are in contact with outer atmosphere.<br />
578
All observations are in harmony with the assumption of the sole, or principal,<br />
entrance of water at the bottom of the lakes, with the exception of the lake of Proloiac,<br />
but that lake receives also surface water and-seemingly-underground water, above<br />
the bottom. In fact, on the bottom of Modro Jezero are clearly visible holes which<br />
perform the double function of feeding and draining the lake.<br />
In Crveno Jezero, Modero Jezero and the springs in the “polje” there were found<br />
only few microorganisms and bacteria. The density of bacteria in Crveno Jezero<br />
increased with depth. Fishes are present in that lake.<br />
THE LAKES OF BACINA<br />
The lakes of Bafina are situated in the immediate hinterland of the port of Plote,<br />
at the southern end of the Biokovo range; they are separated from the port by a saddle<br />
in the coastal hills and from their main drainage area, the periodic lake of Vrgorac,<br />
by another ridge of the Biokovo. They consist of five basins, four of which are inter-<br />
connected and the fifth isolated (fig. 9). Their geographic position and main measures<br />
are given in table 10, for the surface at the elevation of 0.8 m above the sea.<br />
Fig. IO - The lakes of Batina: view across the two middle lakes taken from south<br />
towards north.<br />
579
The lakes fill a string of cryptodepressions of irregular form. Their bottoms are<br />
built mostly of precipitated carbonate and some alluvial material and are in wide areas<br />
flat and nearly horizontal, especially in the basins OhSa and Podgora; the lake CrniSevo<br />
shows in its southern part a depression some 5 m deeper than its ñat surroundings.<br />
The sides of the hills around the lakes are rocky and steep; they are built of jurassic<br />
limestones and constitute a quite small geographic drainage area (31). The hydrologic<br />
drainage area is much wider: the lakes receive water from the periodic lake of Vrgorac,<br />
called Jezero, which is situated in a deep “polje” south of Vrgorac, with sinkhoes at<br />
its southern end, nearest Badina, 25m above the sea, and springs on the northern<br />
side; these springs, again, receive water underground from a stili farther “polje” to<br />
the north of Vrgorac, called Rastok (23). Geologic structure of these regions is of<br />
upper-cretaceous age. The present hydrologic régime of the Batina lakes differs from<br />
the past one because, in 1912, a tunnel was constructed from the basin Sladinac into<br />
the port of Plote in order to lower the level of the lakes, and in 1940 another tunnel<br />
was made from the Jezero at Vrgorac into the basin Podgora, for agricultural reasons.<br />
Consequently, the present measures of the lakes, especially depth, and even the number<br />
of basins, greatly differ from the data in older literature (32). In the present, as in the<br />
past, the level of the lakes is governed on one side by meteorologic conditions and on<br />
the other side by the head necessary to overcome the friction and other losses of head<br />
in the incoming and outgoing channels of underground flow. Beside the artificial incom-<br />
ing and outgoing channels, the old natural subterranean ones are still in function and<br />
are, in dry periods, the only active channels. Even with the two tunnels in function,<br />
the surface of the lakes varies between 0.8 and 2.94 m above the sea, the lower value<br />
corresponding to dry weather conditions and the higher to rainy periods in late autumn<br />
(33, 34). The old, natural subterranean flow into the lakes appears in the springs around<br />
the lakes, in first line in the spring Klokun, but also in two springs on the shore of the<br />
basin Ohla, and finally in a number of saline springs in the basin of CrniSevo (i,<br />
points 188-191).<br />
The main characteristics of the water in the various basins and springs are shown<br />
in table 11. The springs show the saturation with oxygen to vary between 37 and 99%.<br />
The perennial and strong spring Klokun has the highest hardness, excepting the saline<br />
springs on CrniSevo. All non-saline bodies of water show-by the percentage of their<br />
magnesium hardness-an origin in dolomitic limestone, or limestone with dolomite.<br />
The basin of CrniSevo contains water the character of which is altered by its saline<br />
springs; in a smaller measure they alter also the character of water in Sladinac, through<br />
which basin the water of all other basins flows to the sea. The isolated, small basin<br />
of Vrbnik also shows higher salinity which finds, so far, no explanation in observed<br />
facts.<br />
The deepest part of CrniSevo, below - 23 m, shows presence of sea water; at one<br />
occasion, there was below - 27 m about 50% of sea water in the lake water.<br />
There is a very clear thermaI stratification of water in the three deepest lakes, but<br />
a proper hypolimnion is found only in CrniSevo. The epilimnion was in CrniSevo<br />
around 7 m deep in the beginning of August and about 11 at the end of September;<br />
in OCuSa and Sladinac it varied between 9 and 13 m. In the lower part of the epilimnion,<br />
and in metalimnion of CrniSevo, there was supersaturation with oxygen with a maxi-<br />
mum, at the end of September in 1964, of 18.4 mg/l or 202% of saturation. In OCuSa<br />
and Sladinac, the curves of oxygen concentrations took approximately the shape of<br />
the curves of temperature. In CrniSevo, there was usually also some chemical strati-<br />
fication of water, not congruent with the thermal one. Thus, on 28 August 1959, there<br />
was. an increase of chloride between 8 and 16 m of depth and again on 5 August 1962<br />
between 7 and 13 m and between 15 and 23 m, and on 27 September 1964 between<br />
22 and 28 m. The most saline water was, therefore, not always at the bottom, but on<br />
the first occasion at 11 and on the second at 12 m of depth. This was probably caused by<br />
580
the varying combinations of salinity and temperature of the water from saline springs<br />
and of the receiving lake water.<br />
The transparency was in CrniSevo around 9 m, in OCuSa between 4.7 and 6.6 m,<br />
in Sladinac around 5.5 and in Vrbnik 3.5 m.<br />
No data on winter conditions are known. It is, therefore, not possible to confirm the<br />
opinion that the lakes were holomictic and monornictic, which was formed on basis<br />
of observations made on the lakes of Imotski which are on a higher elevation and<br />
farther from the mediterranean influence.<br />
THE “OKA”<br />
Besides proper lakes, there are in our region many smaller depressions permanently<br />
filled with water which cannot be called lakes very well. They are, on account of their<br />
circular shape, often called “Oka” (which is plural of “oko”, and this means eye). Most<br />
of them receive water at the deepest point of their bottom, but some, in addition, from<br />
springs in their vicinity. Some of them lose water by overflow on their brim, others do<br />
not. Since they are too numerous to be treated here all, only a few representative<br />
examples wil be shown. They are arranged in table I3 with their main characteristics.<br />
The best and largest example of an “oko” with constant discharge of water at an<br />
overflow is Torak. the already mentioned spring on the border of the lake of Cikola<br />
(i, point 126). It is shown on fig. 6. It measures 200 m in diameter and nearly 50 rn<br />
in depth. It has the shape of an inverted cone, has a circular surface and receives water<br />
Fig. 11 - The “oko” of Torak.<br />
at the deepest point, from subterranean channels. Similar, but smaller, are two basins<br />
called Jezerine, at Imotski, close to each other, one of them active, with a conical<br />
shape, another inactive, in the shape of a truncated cone, with flat bottom (1, point 152).<br />
Wider than Torak, but shallower, is the periodically active “oko” Krenica, near<br />
Grude, 300 m wide and 41 m deep, also of conical form. The most picturesque of them<br />
58 1
seems to be Modro Oko (the blue eye) in the marshy region of the lower Neretva<br />
river, 130 m wide and 24.5 m deep (35), which is also a perennial spring. (1, point 184).<br />
Of similar shape are the springs: Sv. Stjepan in Istria, 12.3 m deep, the main spring<br />
of the river Cetina, the spring Rude, also a spring of the Cetina, Bili Vir, a spring in<br />
the lower Neretva Valley, Bud, another spring in the same valley, some springs of the<br />
Gacka river (i, points 35-37, 69, 122, 136, 142, 181, 185) and many others. A general<br />
characteristic of the true Oka is their position-they are usually in alluvial ground, at<br />
the foot of a hilly background, that is: in shallow alluvium.<br />
Similar to the “Oka” are basins of irregular shape, of which again some yield water<br />
always and others do it periodically or not at all. The last three examples of table 13<br />
are of this type, the first two being active and the third non-active. The spring of the<br />
SluSnica river is 72 m long and nearly 27 m deep; the spring of Zvir (fig. 10) is smaller,<br />
but in a cryptodepression, like Bubica Jama, at PIomin (1, points 55 m and 84) (38, 37).<br />
As most of the “Oka” are perennial or periodical springs, and are situated in<br />
alluvium at the foot of a hilly background, it is easy to imagine them in the far past<br />
as springs on the side of hills, delivering water into their valleys; as the latter were<br />
being constantly filled up, the alluvium reached at a time the level of the spring and<br />
was still growing. With strong springs, the jet of water could prevent the alluvial<br />
material to cover the spring and gradually caused the cone in the alluvium, around the<br />
mouth of the spring.<br />
On the other hand, one could imagine them to be ancient “ponikve” filled up<br />
initially with rocks from the walls and later by alluvial material. Also, new “Oka”<br />
may appear in consequence of the collapse of the ceiling of a cavity; the present author<br />
had occasion to visit such a collapse which, however, did not result in the hole being<br />
filled with water. Finally, pressure of water underneath an ancient clogged sinkhole<br />
may blow away the clogging material, in which case water will fill the new hole and<br />
eventually start a constadt flow. Three blow-outs of this kind have also been visited<br />
by the author.<br />
Irregular “Oka”, and those situated in bare rock, can be imagined as true “Oka”<br />
in the initial phase oï their development.<br />
The ‘‘Oka” and “jame” which constantly discharge water do not show any thermal<br />
nor chemical stratification of water, but inactive “Oka” do, if they are sufficiently<br />
deep. The latter also show rich algal population and very small transparency, while<br />
the first display opposite conditions.<br />
SUMMARY<br />
In the region considered, all of the larger natural accumulations of water which<br />
merit the name of lakes contain clear water of low productivity, except those which<br />
receive water from inhabited or cultivated areas. So do also smaller accumulations,<br />
“Oka”, if they are active, but not those without constant overflow.<br />
All of them show water of the hydrocarbonate type with a mineral content charac-<br />
teristic îor spring waters of their region. In all of them can be observed the process<br />
of precipitation of part of their carbonate hardness in warm periods of the year.<br />
If they are of sufficient depth, about 15 m or more, they show clear thermal strati-<br />
fitation in summer and are holomictic, with one or two overturns, according to the<br />
lowest winter temperature. On one lake basin chemical stratification was observed.<br />
In the coastal belt, many accumulations are in cryptodepressions; it seems that their<br />
genesis took place at an essentially lower level of the sea than the present one.<br />
The genesis of the accumuIations was variable. Some developed in normal river<br />
canyons where conditions favoured the growth of phytogenic barriers. Their growth<br />
still goes on where it has not been interrupted by human interference. Such lakes receive<br />
and lose their water mainly on the surface. In other cases, the origin was caused pri-<br />
5 82
marily by tectonic processes of which extensive faults seem to have been the initial<br />
ones, with subsequent erosion or destruction of cavity ceilings. Synclines may also<br />
offer conditions favourable to the development of lakes.<br />
Lakes of tectonic origin in our region usually receive and lose water by subterranean<br />
channels.<br />
Whether a lake will develop and subsist depends upon several factors, the main of<br />
which are-beside meteorologic conditions-the capacity of incoming and especially<br />
outgoing subterranean channels. In the coastal belt, the capacity of outgoing channels<br />
may be diminished by a rising of the sea level. That factor probably caused the develop-<br />
ment of some lakes and "Oka" in the valley of the lower Neretva river, and in the<br />
region of BaCina.<br />
Lake<br />
ProSCe<br />
Ciginovac<br />
Okrugljak<br />
Galovac<br />
Gradinsko jezero<br />
Kozjak<br />
Milanovac<br />
Kaluderovac<br />
Lake<br />
TABLE I<br />
Main geographic data on the lakes of Plituice<br />
Altitude<br />
m<br />
636,5<br />
625,5<br />
613,6<br />
584,6<br />
553,2<br />
535,O<br />
523,3<br />
505,2<br />
Geographic<br />
Area of Maximum<br />
coordinates<br />
N E<br />
the surface depth<br />
ha m<br />
44" 51,5'<br />
44" 52'<br />
44" 52'<br />
44"52,5'<br />
44" 52,5'<br />
44" 53<br />
440535'<br />
44" 53.5'<br />
15'36'<br />
15"36'<br />
15" 36'<br />
15"36,5'<br />
15"36'<br />
15"36'<br />
15"3?'<br />
15"37'<br />
TABLE II<br />
Main analytical data on the lakes of Plituice<br />
Depth<br />
Hardness<br />
total carbonate magnesium<br />
68,3 37,4<br />
735 16,l<br />
4 1 15,3<br />
12,5 24,4<br />
8,1 10,o<br />
81,5 46,4<br />
3,3 18,4<br />
291 13,4<br />
% of Mg-hardness<br />
in total hardness<br />
ProSCe surface 230-240 228-235 79-197 34,4-44,9<br />
bottom 224-227 218-220 61-73 30,4-48,3<br />
Kozjal surface 204-218 200-205 81-93 38,7-45,2<br />
bottom 215-226 215-226 69-91 3 1,7-40,3<br />
583
TABLE III<br />
Main analytical data on the lake Jezero on the island of Krk<br />
Hardness<br />
Depth 'C O2 COZ % Of Chloride<br />
total carb. Mg<br />
Mg-hardness<br />
0,O 23,6 7,8 4 172 150 32 18,6 54<br />
4,7 19,6 0,6 i6 178 165 36 20,2 50<br />
7,s 17,5 0,O 30 234 230 50 21,4 65<br />
Sector Distance from<br />
the falls of<br />
Rogovo<br />
km<br />
Lake of 0,70<br />
Visovac 2,73<br />
above the 5,90<br />
falls of 7,90<br />
Skradin 11,oo<br />
TABLE 1V<br />
Main geographical data on the lake of Visorac<br />
Width Maximum Elevation of<br />
m depth the deepest<br />
m point<br />
m<br />
267 17,6 27,4<br />
128 32,2 12,8<br />
493 24,3 20,7<br />
243 29,O 16,O<br />
362 25,4 19,6<br />
TABLE V<br />
Main analytical data on the lake of Visovac<br />
Temperature<br />
at bottom in<br />
August 1957<br />
15,O<br />
14,8<br />
14,5<br />
-<br />
14,5<br />
Distance from Hardness<br />
the falls of Depth "C Oz COZ Chloride<br />
Rogovo, km total curb. Mg<br />
5 84<br />
0,7 O 21,l 9,2 O 258 175 50<br />
17,s 15,O 2,0 12 258 190 46<br />
2,7 O 21,l 9,4 O 256 165 28<br />
30 14,s 3,8 ô 244 188 40<br />
599 O 22,4 9,4 O 244 170 58<br />
24 14,5 3,8 10 252 195 42<br />
ll,o O 22,6 9,2 O 240 158 52<br />
24 14,5 4,l 5 257 183 49
Lake<br />
TABLE VI<br />
Teinperariire and oxygen dissolued in lake Prokijnn<br />
Oxygen dissolved<br />
Point Depth Temperature Chloride<br />
"C mg/l of satur. mg Cl/i<br />
1 0,5 22,23 9,OS 103,7 480<br />
13 22,48 11,80 161,O 17.000<br />
2,4 29,80 10,04 164,3 20.500<br />
3 90 29,47 5,94 96,6 20.500<br />
43 26,92 5,20 81,3 21.250<br />
2 0s 22,92 834 104,4 2.675<br />
1 6 25,68 9,?6 138,8 15.375<br />
292 27,35 10,12 155,7 19.650<br />
2,s 27-60 8,80 136,6 19.900<br />
52 25,69 7,OO 107,O 21.900<br />
TABLE VI1<br />
Main geographical datn on the lukes of Imotski<br />
Geographic<br />
coordinates<br />
N E<br />
Modro jez. 43"27' i7"13'<br />
Crveno lez. 43"27,5' 17"12'<br />
Galipovac 43"28' 17"06'<br />
LokviEiC 43"28' 17"06'<br />
KnezoviC. 43"27,5' 17"06'<br />
Jezero Proloiac 43"28,5' 17"07'<br />
Observed eleva-<br />
tion above sea Maximum<br />
max. min. length width<br />
283,6 239<br />
274,5 252,s<br />
270,s 261.9<br />
271,4 260,9<br />
272,O 270,5<br />
271,2 266,2<br />
0-250 0-100<br />
220 190<br />
170 120<br />
116 90<br />
not measured<br />
not well<br />
defined, great<br />
TABLE VI11<br />
Coniparatioe elecutions of the lakes of Imtoski<br />
Elevation<br />
of the<br />
deepest point<br />
239,O<br />
4,1<br />
210,7<br />
229,3<br />
unknown<br />
241,7<br />
Date Modro Crveno Galipo- Prolo& Lokvi- Knezo- Springs in<br />
jezero jezero vac ko jez. ëic viC the polje<br />
21 7 1955<br />
26 9 1955<br />
2 9 1956<br />
250,O 252,s 264,7 268,2 - - 267,7-268,2<br />
239,O - - - - - -<br />
- - 261,9 266,2 260,9 - around 268<br />
20 3 1957 278,s 275,O 270,5 270,2 269,s 272,O 267,9-268,5<br />
585
TABLE IX<br />
Main analytical data on the lakes of Imofski<br />
Hardness<br />
Lake Depth "C Oz CO2 %ofMg- C1<br />
total carb. Mg hardness<br />
Crveno O<br />
10 7 55 200<br />
Galipovac O<br />
20 7 55 42<br />
1 9 56 O<br />
45<br />
LokviCii: O<br />
3 9 56<br />
Modro jez.<br />
30<br />
O<br />
7 6 58 34<br />
ProloSko j. O<br />
11 7 55 20<br />
28 8 56 O<br />
24<br />
30 8 56 O<br />
23<br />
12 2 58 O<br />
27<br />
9 9 59 O<br />
Basin of<br />
the lakes<br />
Crniievo<br />
OCuSa<br />
Sladinac<br />
Pogora<br />
Plitko jez.<br />
Vrbnik<br />
586<br />
155 57 23,l 6,O<br />
200 49 23,l 7,O<br />
130 18 13,6 5,0<br />
188 26 13,7 5,O<br />
130 16 10,8 5,6<br />
175<br />
108<br />
22<br />
18<br />
10,3<br />
16,l<br />
6,5<br />
6,5<br />
180<br />
145<br />
160<br />
30<br />
26<br />
30<br />
13,6 6,5<br />
16,l -<br />
16,9 -<br />
120 48 37,5 7,O<br />
124 24 19,3 6,5<br />
118 30 25,4 7,O<br />
158 26 14,4 6,5<br />
123<br />
170<br />
28<br />
32<br />
22,6<br />
18,2<br />
6,O<br />
5,6<br />
22,3 8,6 O<br />
24,5 8,O 4,4 6<br />
120<br />
172<br />
135<br />
135<br />
120<br />
165<br />
16<br />
16<br />
20<br />
20<br />
11,s<br />
11,4<br />
16,7<br />
11,6<br />
5,6<br />
5,6<br />
8,6<br />
73<br />
19,s 9,7 O 160<br />
9,4 7,4 2 212<br />
24,l 8,7 O 132<br />
9,O 5,6 5 190<br />
22,l 8,O o 148<br />
6,5 43 3 21 3<br />
26,O 8,7 O 112<br />
935 5,9 1 220<br />
18,O 10,l o 163<br />
7,2 8,7 4,4 178<br />
23,7 7,4 O 128<br />
7,7 7,6 O 124<br />
28,3 9,2 - 118<br />
5,6 6,O O 180<br />
25,5 9,0 O 1 24<br />
5,8 7,O 5 176<br />
7,7 12,6 O 138<br />
4,6 12,8 O 140<br />
TABLE X<br />
Main geographical data on the lakes of Badina<br />
Geographic coordinates Maximum Elevation of<br />
the deepest<br />
N E length width depth point<br />
43"05' 17"25' 1110 680 30,6 - 29,s<br />
43"05' 17"26' 1250 540 19,6 - 18,8<br />
43"05' 17"26' 560 345 16,9 -16,l<br />
43"04' 17"26' 390 325 10,1 - 9,3<br />
43"05' 17"25' 1160 170 595 - 4,7<br />
43"05' 17"25' 275 160 8,7 - 7,9
587<br />
o”
TABLE XII<br />
Main geographical data of some "Oka" and "jarne"<br />
Geographic coordinates Maximum Elevation<br />
Name Elevation of deepest<br />
N E m length width depth point<br />
Torak<br />
Jezerine N<br />
Jezerine S<br />
Modro oko<br />
Krenica<br />
SluSnica, spring<br />
Zvir, spring<br />
BubiCa jama<br />
43"49'<br />
43"28'<br />
43"28'<br />
43"03'<br />
42"52,5'<br />
45"05'<br />
45"25'<br />
45"09'<br />
16"Ol'<br />
17"lO'<br />
17"lO'<br />
17"31'<br />
i 7"20'<br />
15'34'<br />
14"25'<br />
14"lO'<br />
45<br />
268,6<br />
268,6<br />
0,9<br />
252,6<br />
240<br />
5,5<br />
095<br />
202 171 41,5<br />
43,6 43,l 13,2<br />
49,l 44,l 6,O<br />
130,6 95,7 24,5<br />
300 275 41,3<br />
72 40 26,9<br />
33 24 17,8<br />
23 14,5 16,4<br />
- 2,6<br />
255,4<br />
262,6<br />
-23,6<br />
211,3<br />
213?<br />
-12,3<br />
-15,9<br />
BIBLIOGRAPHY<br />
(l) PETRIK, M., 1965, Characteristics of Water from Springs in the Croatian Limestone<br />
Region. The present Symposium.<br />
(2) PEVALEK, I., 1935, Verh. d. internat. Ver. f. Limnol, 7, Beograd.<br />
(3) PEVALEK, I., 1926, Gorjanouideua Spomenica, Zagreb.<br />
(4) ROGLIC, J., 1951, Geogr. Glas., Zagreb.<br />
(9 POLSAK, A., 1959, Ljetopis, 63, JAZU, Zagreb.<br />
A., 1960, Ljetopis, 64, JAZU, Zagreb.<br />
(6) POLSAK,<br />
(7) POLSAK, A., 1965, Ljeiopis, 70, JAZU, Zagreb.<br />
(8) POLJAK, J., 1914, Prirod. istraz'., JAZU, Zagreb.<br />
(9) PETRIK, M.,<br />
(lo) PETRIK, M., 1961, Ruspratle, 11, JAZU, Zagreb.<br />
(Il) PETRIK, M., 1957, Krf Jugosl., 1, JAZU, Zagreb.<br />
(12) PETRIK, M., 1960, Krs' Jzigosl., 2, JAZU, Zagreb.<br />
(9 PETRIK, M., 1961, Gradeuinar, 13, Zagreb.<br />
(14) GOLUBIC, S., 1961, Ljetopis, 65, JAZU, Zagreb.<br />
(l5) CASAGRANDI, O.,<br />
1958, Nacionalni park PlitviEka jezera, Zagreb.<br />
1927, Studi per il rifornimento idrico dell' Istria.<br />
(I6) MAGA:, A., 1965, Geol. Vjes., 19, Zagreb.<br />
(17) N~MANN, W., 1949, Nova Thalassia.<br />
(18) CRNOLATAC, I., 1963, Unpublished Report, Zagreb.<br />
(19) Institute of Sanitary Engineering, Zagreb, 1959, Unpublished Report.<br />
(20) MILOJEVIC, B. Z., Glas. geogr. druStua, Beograd.<br />
(21) MILOJEVIC, B.Z., Glas. geogr. drus'rua, 32, Beograd.<br />
(22) PETRIK, N., 1960, Krf Jugosl., 2, JAZU, Zagreb.<br />
(23) CRNOLATAC, I., 1965, Private communication.<br />
(*,4) ROGLI~, J., 1954, Polja zapadne Bosne i Hercegovine, Sarajevo.<br />
(9 PETRIK, M., 1960, Ljetopis, 64, JAZU, Zagreb.<br />
(26) POLJAK, J., 1956, Unpublished Report, Zagreb.<br />
(9 Elektroprojekt, 1961, Unpublished Report, Zagreb.<br />
(28) GRUND, A., 1903, Peiicks Geogr. Mitt., 7, Leipzig.<br />
(29) ROGLIC, J., 1938, Imotsko polje, Beograd.<br />
(30) Elektroprojekt, 1961, Unpublished Report, Zagreb.<br />
BLASKOVIC, P., Unpublished Geologic Map of the Lower Neretva Region, drawn<br />
on basis of investigations carried out by I. Crnolatac, D. Anit and D. Sikit, Zagreb.<br />
588
(32) GAVAZZI, A., 1904, Abh. geogr. Ges., 2, Wien.<br />
P3) PETRIK, M., 1965, Ljetopis, 70, JAZU, Zagreb.<br />
M., 1963, Ljetopis, 69, JAZU, Zagreb.<br />
(34) PETRIK,<br />
(39 Institute of Sanitary Engineering, Zagreb, 1959, Unpublished Report.<br />
(39 PETRIK, M., 1957, Krt Jugod., 1, Zagreb.<br />
(37) Institute of Sanitary Engineering, Zagreb, 1964, Unpublished Report.<br />
589
PROBLEMES DE CONSTRUCTION DES BASSINS DE<br />
RETENUE DANS LWERCÉGOVINE DE L’EST<br />
RESUME<br />
Stjepan MIKULEC<br />
Dans le but de l’utilisation complexe des eaux se prévoit dans I’Hercégovine de<br />
l’Est, la construction de trois grands bassins de retenue. Le premier des plus grands<br />
dans la région du karst yougoslave, se trouve en construction sur le fleuve TrébiSnjica.<br />
11 aura le volume total de 1280 hm3.<br />
Les problèmes de la construction de ces bassins de retenue sont très complexes et<br />
exigent des recherches intensives, lesquelles s’effectuent déjà depuis 12 ans. Etant donné<br />
que la région est intensivement karstificiée, il a fallu élaborer des cartes géologiques<br />
et hydrogéologiques détaillées d’une plus large étendue, examiner toutes les eaux sou-<br />
terraines, déterminer la profondeur de la karstification et les voies potentielles pour la<br />
perte d’eau.<br />
Une grande assistance dans la phase des recherches ont présenté les méthodes géo-<br />
physiques, lesquelles ont eu leur affirmation justement sur ce terrain. Ont été effectuées<br />
environ 50 collorations de gouffres et des forages à l’aide du sodium fluoresceine et<br />
perforé plus de 10.000 m de forages. Le large réseau des piezomètres a aidé de suivre<br />
les oscillations du niveau de l’eau souterraine. Les recherches spéléologiques ont rendu<br />
possible la vue partielle dans les conditions souterraines.<br />
En raison de l’examen des eaux souterraines était bétonné et une grande source<br />
périodique d’une capacité de 60 m3/s. Les résultats obtenus par la recherche ont per-<br />
mis de voir l’étendue nkessaire des mesures techniques pour la sécurité des plus gran-<br />
des pertes de la région des bassins de retenue futurs. De même ils ont permis que la<br />
décision soit apportée sur la submersion de la source TrébiSnjica pour 70 m. Certains<br />
cours d’eau souterrains devront être coupés par des voiles d’injection, afin d’augmenter<br />
la capacit6 des cours d’eau superficiels et améliorer l’économie des usines hydroéner-<br />
gétiques, laquelle utilisera les eaux nivelées des bassins de retenue envisagés. L’éten-<br />
due des travaux prévus rendra possible la production totale de l’énergie électrique de<br />
3,5 milliards kWh, mais les frais de la réalisation ne dépasseront pas les dépenses moy-<br />
ennes pour la construction des usines dans les conditions normales géologiques, ce qui<br />
représente un succès important pour vaincre le karst dans la région yougoslave.<br />
SUMMARY<br />
Problems OJ storage dam construction in eastern Hercegovina<br />
To cater for a combination of water uses it is planned to build three large storage<br />
dams in eastern Hercegovina, of which the first, one of the largest in the Yugoslav<br />
karst region, is now in course of construction on the River TrebiSnjica; it will have total a<br />
volume of 1,280 hm3.<br />
The engineering problems presented by the construction of these reservoirs are<br />
extremely complex necessitating intensive studies which have been proceeding for twelve<br />
years past. As the region is highly karstified, it has been necessary to prepare detailed<br />
geological and hydrogeological maps of the sites and their surroundings, investigate<br />
all groundwater bodies and determine the depth to which karst phenomena extend and<br />
the possible paths by which water could escape.<br />
In the study phase, geophysical methods have been of great help on this terrain.<br />
About 50 dye tracer operations with sodium ñuorescine have been carried out on<br />
swallow-holes and borings and trial borings have been made to a total of over 10,000<br />
metres. A wide network of piezometers has made it possible to follow the oscillations<br />
of the groundwater level. “Pot-holing” techniques have been used for a study of some<br />
of the conditions to be found underground.<br />
For the investigation of the underground channel systems, a large intermittent spring<br />
delivering 60 m3/s was blocked and the study of the consequences has afforded an idea<br />
of the extent of the engineering precautions needed to limit water losses in the areas of<br />
the projected storage reservoirs: it has also enabled a decision to be taken on the sub-<br />
mersion of the TrebiSnjica’s source to a depth of 70 m. Certain underground currents<br />
wil have to be blocked off by cement grouting to increase the capacity of the surface<br />
streams and make the hydroelectric power stations which will use the regulated water<br />
590
of the projected storage dams more economic. The works planned wil allow of an<br />
overall output of 3.5 milliard kilowatt hours of electric energy, but their cost will not<br />
exceed the average for the building of power stations in normal geological conditions.<br />
This represents a major success in taming the karst in this part of Yugoslavia.<br />
ABSTRACT<br />
Afin de résoudre les problèmes de l’économie de l’eau dans la région du karst herzégovinien<br />
a l‘est du fleuve Néretva, il est nécessaire de construire des bassins de retenue.<br />
En outre, il ne faut pas perdre de vue que cette région est seulement très riche en<br />
précipitations pendant la période hivernale de l’année (X-IV). Par conséquent les inondations<br />
dans les champs karstiques sont provoquées presque chaque année. Les courants<br />
d’eau superficiels sont normalement courts et se terminent a des gouffres, OU l’eau<br />
se perd et descend dans les horizons plus bas. Les étés sont très secs, de sorte que l’agriculture<br />
se trouve dans des conditions vraiment défavorables pour le développement,<br />
tant que la question de drainage des champs ne sera pas résolue ainsi que celle consistant<br />
a assurer la quantité suffisante d’eau pour l’irrigation. Cependant, la forme favorable<br />
du relief et le voisinage de la mer rendent possible d’une manière convenable<br />
l’utilisation du potentiel hydroénergétique. Les champs sont situés dans trois horizons.<br />
Le plus haut horizon est formé par les champs de Gatsko et de Névesinje a une hauteur<br />
de 800-950m. L‘horizonmoyen se trouve à une hauteur de 450-500m (Dabarsko polje,<br />
Fatni Fatniiiko, polje, Biletko polje, etc.). Le plus bas horizon forme la vallée de la<br />
rivière TrébiSnjica, laquelle se termine dans Popov0 polje, (220-250 m d’altitude). Trébihjica<br />
représente en même temps le plus grand cours d’eau, puisque c’est suivant son<br />
lit que drainent par voie souterraine les quantités principales d’eau. Son débit moyen<br />
à Trébinje s’élève à 100 m3/s.<br />
La fégion du champ de Névésinje et de Dabar appartient au bassin versant de Néretva.<br />
Leurs eaux partent par des cours d’eau souterrains en direction des rivières Buna<br />
et Brégava, qui sont déjà situées a une altitude plus basse au-dessus de la mer (50-100 m<br />
d’altitude).<br />
En raison du caractère karstique du terrain, de grandes différences de hauteur, des<br />
directions sous forme tectonique prédéterminées et du grand nombre de fissures, l’érosion<br />
par l’eau fut intense, de manière qu’il s’est développé un faisceau enchevêtré de<br />
canaux souterrains, par lesquels les eaux s’infiltrent dans des directions différentes. Sur<br />
la figure 1, ces directions sont clairement présentées. I1 a fallu environ i2 ans d’une<br />
recherche intense, pour que ces liaisons souterraines soient déterminées.<br />
Les recherches ont cependant démontré que toutes les sources et les abîmes sont<br />
géologiquement prédisposés, car dans la masse des calcaires perméables se présentent<br />
souvent les dolomites OLI les flysch, qui représentent les isolateurs hydrologiques. Toutes<br />
les recherches sont effectuées en rapport avec les études que fait Energoinvest à Sarajevo<br />
pour résoudre les problèmes hydrotechniques de la région en question.<br />
Ces études ont montré qu’il y a lieu de constituer quelques bassins de retenue plus<br />
importants, afin d’atteindre régale repartition annuelle des eaux. Les endroits favorables<br />
pour ces futurs bassins de retenue sont recherchés sur la base des études préliminaires<br />
qui ont établi la possibilité d’obtenir la solution favorable de tous les problèmes de<br />
l’économie de l’eau.<br />
Au début, tous les moyens étaient dirigés sur le cours de la TrébiSnjica, en raison<br />
des plus grandes quantités d’eau et de la possibilité d’obtenir des effets énergétiques<br />
plus favorables. C’est ainsi qu’a été prise la décision de procéder à la construction du<br />
bassin de retenue MiruSa d’un volume de 1.280 km3 dans la région de la source de cette<br />
rivière.<br />
La TrébiSnjica a seulement 35 km de cours permanent. En été, en aval de Trébinje,<br />
elle se perd complètement dans les abîmes. Cependant, en hiver, naît à Popov0 polje<br />
59 1
I<br />
CARTE HYDROLOGIQUE DE LA REGION O
E CHERZEGOVINE DE LEST<br />
AVTAT I I EN SERVICES<br />
/ 0 EN CONSTRUCTION<br />
a EN ETUDE<br />
I
un bassin de retenue d’un volume d’un milliard de m3, qui souvent se maintient jusqu’au<br />
mois de juin.<br />
Le problème principal dans la région du bassin de retenue futur était constitué par<br />
la question de la résistance de la base sur la perte d’eau du lit même. Les recherches<br />
ont montré qu’il y a 5 groupes de plus petits abìmes. Leurs communications ont été<br />
examinées en premier lieu par la coloration avec la fluoresceine et il fut constaté qu’elles<br />
sont de caractère local. Les sources de la rivière seront submergées de 70 m et il fallait<br />
examiner la possibilité d’ouverture des voies dans la direction de la source de Brégava,<br />
qui sont éloignées de presque 40 km mais se trouvent à un niveau inférieur de 150 m.<br />
Dans ce but on a effectué des forages géologiques et des essais géophysiques sur une<br />
large étendue, qui comprenaient environ 135 km2 de surface.<br />
Par ces essais on avait pris en considération la région du champ de Dabar jusqu’à la<br />
source et plus loin dans le sud, plus en aval de l’emplacement du barrage. On a appliqué<br />
la méthode de la résistance spécifique électrique, par sondage et carotage géoélectriques,<br />
ensuite par la méthode électromagnétique M Turam ) et la méthode de carotage électrique<br />
dans les forages. Les résultats des méthodes géoélectriques de recherches en combinaison<br />
avec les résultats de forage et coloration des forages et des abîmes ont pu servir<br />
pour l’élaboration de la carte de la base de karstification. Elle représente la limite de la<br />
partie karstifiée des sédiments de celle non karstifiée. Par la méthode M Turam n on a<br />
pu suivre avec certitude les canaux karstiques, lesquels n’avaient que 50 m de profondeur.<br />
Tous ces essais ont montré que le danger potentiel pour les plus importantes pertes<br />
d’eau existe seulement dans la zone entre Dabarsko et FatniCko polje, qui est dans I’endroit<br />
le plus étroit, large d’environ 150 m. A cet endroit sera exécuté le voile d’injection,<br />
si cela se présentait comme économique après le remplissage du bassin. Les colorations<br />
des gouffres dans cette zone ont montré que les eaux se divisent : ou bien elles sont<br />
drainées vers les sources de la TrébiSnjica ou bien vers celles de la Brégave. Toutes ces<br />
colorations sont effectuées plusieurs fois sous des conditions hydrologiques différentes,<br />
afin d’obtenir des résultats plus certains.<br />
La conception de la construction du grand barrage de 123 m à GranEarevo se base<br />
sur le fait que dans la région de Lastve se tend directement sur le cours de la rivière la<br />
zone des dolomites qui ont des proprietés d’isolateurs hydrologiques. Or, cette zone<br />
ne se présente pas à la surface sur la rive droite. Au moyen d’un grand nombre de forages<br />
et de colorations on a cherché à établir quelle partie d’eau était engloutie tandis que<br />
par le réseau des piézomètres sont suivies les oscillations duniveau des eaux souterraines.<br />
A son entremité aval passe la faille de Zubac, par laquelle les eaux infiltrées éventuellement<br />
doivent retourner dans le bassin de compensation de Gorica. Elles non plus ne<br />
seront pas perdues pour l’utilisation dans des buts énergétiques à l’aménagement principal,<br />
qui utilise les eaux sur la chute de 295 m. jusqu’au niveau de la mer.<br />
Après que les problèmes principaux, géologiques et hydrogéologiques, furent résolus<br />
pour ce bassin de retenue, on a procédé à la recherche de la possibilité de former un<br />
plus petit bassin de retenue au niveau du champ de Névésinje. On voudrait rassembler<br />
les eaux de ce champ avec celles du champ de Dabar et les faire passer dans le bassin de<br />
retenue sur la TrébiSnjica : de cette façon on augmenterait la capacité des centrales qui<br />
sont en construction ou en service. Le champ de Névésinje a environ 10.000 ha de surface<br />
agricole cultivable, qui exige de l’eau. Cependant, en hiver ces champs sont soumis<br />
aux inondations, car la capacité d’absorption des abîmes est insuffisante. Le bassin<br />
versant de ce champ a environ 620 km2 et les précipitations moyennes s’&lèvent à<br />
850 mm. A travers ce champ passe la rivière Zalomka avec quelques affluents, dont les<br />
eaux s’engouffrent sur la partie ouest dans la zone de calcaire. Les études hydrologiques<br />
ont montré que le coefficient d’écoulement de toutes les précipitations s’élève seulement<br />
à 0,38, et sur la TrébiSnjica à 0,7-0,8, ce qui signifie très peu. Ceci a montré le danger<br />
qu’au-dessous du niveau du champ se perde une partie d’eau directement en direction<br />
5 94
de la source de Buna. Une grande partie des champs est formée par les sédiments oli-<br />
gocènes-éocènes, connus sous le nom de série promina. Ils se présentent sous forme de<br />
conglomérats, mames, feldspaths et de grès qui sont imperméables. Cependant, en<br />
direction du nord, dans le cânion de Budisavlje, se présentent déjà les calcaires des<br />
crétacés supérieurs, qui sont karstifiés. Puisque dans la partie sud du champ les séries<br />
promina sont profondes jusqu’à 800 m, il n’y a pas de danger de perte d’eau. A la<br />
décrue des eaux, la zone près de Budisavlje est en communication souterraine avec la<br />
source de Buna, mais aux grandes eaux se présentent sur la rive gauche des sources<br />
Fig. 2<br />
595
périodiques, puisque les canaux vers Buna sont remplis. Par les essais et forages on a<br />
constaté que cette zone passe comme un corridor étroit à travers la série promina. En<br />
considération du caractère et de la profondeur des canaux dans cette zone il faudra exé-<br />
cuter un voile d’injection. Ces travaux seront coûteux car la longueur du voile peut<br />
atteindre environ 1.200 m et la profondeur jusqu’à 250 m. Or l’économie de ces frais<br />
se base sur le fait qu’une bonne partie d’eau se perd à travers cette zone. Ces eaux res-<br />
teront après l’injection sur l’horizon du champ et agiront essentiellement sur I’augmen-<br />
tation de la production dans les centrales hydroénergétiques, car le débit moyen actuel<br />
de il m3/s peut meme augmenter de 50%. Etant donné le niveau de la mer, ces quantités<br />
pourront donner une importante production. Des recherches détaillées de cette zone<br />
sont maintenant en cours. Déjà maintenant on peut compter avec certitude que des<br />
conditions existent pour la construction du bassin de retenue de i 50 hm3, qui sera suf-<br />
fisant pour l’égalisation des eaux et pour satisfaire à tous les besoins.<br />
Un troisième bassin de retenue est envisagé dans le champ de Cernica, qui représente<br />
une plus faible dépression fermée, près de GataEko polje. Les rapports hydrologiques<br />
sur ce champ sont aussi très compliqués. La partie nord-est dans le champ est formée<br />
par les sédiments du Aysch et celle du sud-ouest par les couches de calcaires des crétacés<br />
supérieurs qui sont karstifiés. Dans cette zone se trouve une série d’abîmes. Les plus<br />
importantes quantités d’eau viennent dans le champ du GataEko polje à travers la<br />
source Vilino. Ensuite naît la rivière qui, après 400 m de cours, s’engloutit. Les recher-<br />
ches avaient en vue la constatation de la direction des eaux eaux souterraines de tous<br />
les gouffres, car on tend à obtenir des bassins de retenue seulement avec la fermeture<br />
des gouffres. Ce travail est très difficile et il dure longtemps. Par les différentes méthodes<br />
géophysiques, forages, colorations, et les recherches spéléologiques on essaie de voir<br />
le fond de tous les problèmes. Le chemin de la réussite est encore très long, mais main-<br />
tenant on est de plus en plus d’avis qu’il faudra d’une manière convenable fermer les<br />
gouffres principaux et examiner la possibilité d’édifier des bassins de retenue sans<br />
entraîner de grands frais. De cette manière on obtiendrait la meilleure vue sur la possi-<br />
bilitéderetenir leseaux dans lechamp. Sicette fermetureréussissait, alors on procéderait<br />
ala construction du tunne1,lequelferait passerl’eau jusqu’àFatniEko polje, où l’onenvi-<br />
sage une centrale. La fermeture expérimentée des gouffres rendrait possible lëlabora-<br />
tion d’un bilan d’eau, mais de toute façon reviendrait moins chère que les longues<br />
recherches avec les méthodes normales de travail.<br />
Sur le champ CerniEko se présente encore un problème hydrologique, étant donné<br />
que la rivière a une faible longueur, et que le gouffre KljuE a une insuffisante capacité<br />
d’absorption, il se produit rapidement un ralentissement lors des grandes précipitations,<br />
et par conséquent il est impossible de déterminer exactement le débit. Bien qu’on ait<br />
essayé en Yougoslavie de résoudre des problèmes semblables, les résultats pour les<br />
buts énergétiques ne sont pas certains. C’est pourquoi on essaye maintenant d’après<br />
les conditions des laboratoires de l’Institut hydrotechnique à Sarajevo, les méthodes<br />
directes convenables pour la mesure de la capacité des gouffres avec le temps, à l’aide<br />
des dispositifs hydrauliques installés. En outre, il faut avoir en vue que la capacité des<br />
abîmes n’est pas proportionnelle au niveau du bassin de retenue au-dessus du gouffre,<br />
mais dépend de la grandeur des canaux souterrains et de la quantité d’eau filtrée qui<br />
débouche aux canaux le long de leur cours. Mais ces quantités sont différentes et pro-<br />
portionnelles aux précipitations et à la fissuration de la masse rocheuse du terrain fendu<br />
au-dessus des canaux.<br />
Comme on voit, les problèmes sont assez complexes et ne peuvent pas être rapide-<br />
ment résolus. Sur la région dont il est question, jusqu’à maintenant, on a effectué plus<br />
de 10.000 m de forages et près de 50 coloraiions de gouffres. De grandes étendues sont<br />
examinées par les méthodes géophysiques. L’ordre du travail dépend de la conception<br />
technique pour les aménagements futurs, mais elle se développe parallèlement avec les<br />
recherches. De grands moyens financiers ont été utilisés ces dernières quinze années,<br />
5 96
m<br />
M<br />
iz
mais ils ont quand même atteint leur but, puisqu’il a été constaté que les problèmes de<br />
l’économie de l’eau peuvent se résoudre avec succès, si la collarobation des différentes<br />
professions participant à la recherche est étroite. En examinant les phénomènes hydro-<br />
logiques naturels, on peut tirer des conclusions qui ensuite serviront comme le point<br />
de départ pour le travail futur de recherche.<br />
(l) ENERGOINVEST-SARAJEVO,<br />
(2) S. MIKULEC<br />
BIBLIOGRAPHIE<br />
Documentation.<br />
et collaborateurs, Energetsko-poljoprivredni plan Trebiinjica (Power<br />
and agriculture project TrebiSnjica), Revue Tehnika, no 7, Beograd 1963.<br />
TORBAROV, Les recherches de la sécurité de l’accumulation karstique<br />
(3) S. MIKULEC-K.<br />
sur la TrebiBnjica, Septième Congrès des Grands Barrages, Question no 25, Comptes<br />
rendus, Rome 1961.<br />
(4) B. PETROVIC-B. PRELEVI^, Hydrologic characteristics of the karst area of Bosnia<br />
and Herzegovina and a part of Dalmatia with special consideration of underground<br />
water connections, Recue NaSe Jame “Nos Grottes), nos 1-2, Ljubljana 1965.<br />
598
III<br />
GEOCHIMIE - EROSION<br />
GEOCHEMISTRY - EROSION
CARBONATE EQUILIBRIA AND RADIOCARBON<br />
DISTRIBUTION RELATED TO GROUNDWATER FLOW<br />
IN THE FLORLDAN LIMESTONE AQUIFER, U.S.A.W]<br />
SUMMARY<br />
Bruce B. HANSHAW, William BACK and Meyer RUBIN<br />
U. S. Geological Survey, Washington D. C., U. S. A.<br />
The principal artesian aquifer of Florida is composed predominantly of Tertiary<br />
limestone with lesser amounts of dolomite and gypsum. A north-south geohydrologic<br />
section through the piezometric high depicts the spatial and temporal changes of<br />
chemical character of water. The major area of recharge is characterized by calcium<br />
bicarbonate type water, by low concentrations of total dissolved solids and of sulfate<br />
ions, by undersaturation with respect to calcite and dolomite, and by young CI4 ages.<br />
Concentration of dissolved solids and sulfate increases markedly as a function of length<br />
of flow path and residence time in the aquifer. Radiocarbon ages indicate that within<br />
different parts of the system velocities range from 2 to 12 meters per year.<br />
Away from the recharge area the water is supersaturated with respect to calcite<br />
and dolomite. Throughout most of the area the water has not reached equilibrium<br />
with aragonite and gypsum. Supersaturation of the water with respect to calcite tends<br />
to buffer the bicarbonate concentration. This study shows that the geochemistry of<br />
the water conforms well with the hydrologic history of the system.<br />
RESUME<br />
L’équilibre des carbonates et la répartition dir radiocarborie par rapport à l’e‘coulement<br />
de la nappe aquifère calcaire de Floride, aiix Etats-Unis d’dmbique<br />
Le principal aquifère artésien de Floride se compose surtout de calcaires tertiaires<br />
auxquels se melent, en quantités moindres, des dolomies et du gypse. Une coupe<br />
géohydrologique nord-sud suivant le maximum piézométrique fait apparaître les<br />
changements dans l’espace et dans le temps du caractère chimique de l’eau. Dans<br />
l’aire principale d’alimentation de la nappe, l’eau est caractérisée par son contenu en<br />
bicarbonate de calcium, par de faibles concentrations en corps solides dissous et en<br />
ions sulfates, par une sous-saturation en dolomie et en calcite et par des carbones<br />
14 d’âge récent. La concentration en solides dissous et en sulfate s’accroît notablement<br />
avec l’accroissement de la distance parcourue par les eaux et de la durée de séjour dans<br />
la nappe. L’âge du radiocarbone indique que, dans différentes parties du système, la<br />
vitesse d’écoulement est de l’ordre de 2 à 12 mètres par an.<br />
Loin de l’aire d’alimentation, l’eau est sursaturée en dolomie et en calcite. Dans<br />
la plus grande partie de l’aire, l’eau n’a pas atteint son équilibre en aragonite et en<br />
gypse. La sursaturation de l’eau en calcite tend à jouer le rôle de tampon l’égard de<br />
la concentration en bicarbonate. Cette étude montre que la goéchimie de l’eau suit<br />
l’histoire hydrologique du système.<br />
INTRODUCTION<br />
The purpose of this paper is to describe the application of geochemical principles<br />
to a reasonably well known hydrologic environment to determine which solid phases<br />
play the most important part in controlling the chemistry of water as it moves through<br />
the aquifer system. Use of basic principles of physical chemistry show how chemical<br />
equations express solution and precipitation of common carbonate and evaporite<br />
minerals. A chemical equilibrium model aids in understanding geologic processes such<br />
as formation of secondary permeability by solution, precipitation of minerals in the<br />
aquifer, cementation, and recrystallization. Isotopic investigations may be used in the<br />
study of a hydrologic system, to determine the various origins of water, residence time<br />
(l) Publication authorized by Director, U. S. Geological Survey.<br />
60 1
of water, velocity of groundwater movement and rates of chemical reactions. A<br />
combined study of general water chemistry, mineral saturation of the water, and<br />
distribution of radiocarbon isotopes is helpful to identify the principal areas of<br />
recharge and to identify which geochemical processes control the chemical character<br />
of water. This approach is also useful in predicting which, if any, chemical changes<br />
may occur as a result of imposing such stresses as increased pumping or artificial<br />
recharge on the hydrologic system.<br />
The regional flow pattern in the hydrologic system in central Florida is controlled<br />
largely by the two piezometric highs shown in figure 1. A north-south line of wells<br />
through the major piezometric high was chosen for the study of changes in aqueous<br />
Fig. 1 - Piezometric map of the principal artesian aquifer of central Florida showing<br />
location of sample points used on cross-sections (after Stringfield, 1936).<br />
chemistry as the water flows from a recharge area toward deeper parts of the aquifer.<br />
The principal artesian aquifer of Florida consists of a series of limestones of Tertiary<br />
age which contain minor amounts of dolomite, disseminated quartz sand, gypsum, and<br />
anhydrite. The limestones are interconnected and function as a hydrologic unit.<br />
The eight wells sampled during this study (fig. i) range in depth from approximately<br />
80 to 300 metres and are completed in limestone that ranges in age from middle Eocene<br />
to Miocene. The principal artesian aquifer is overlain by confining beds of Miocene<br />
age, chiefly clay of the Hawthorn Formation (Pride, Meyer, and Cherry, 1961;<br />
Le Grand and Stringfield, 1965). The major piezometric high has the shape of a north-<br />
south elongated dome; water flows down gradient at right angles to the piezometric<br />
contours.<br />
602
This investigation is part of a continuing study of the chemistry of the principal<br />
artesian limestone aquifer of Florida. The complete study includes about 50 wells<br />
covering the centre of the State, an area of roughly a half million square kilometres.<br />
The final report will include mineral equilibrium studies of solid phases in addition to<br />
those presented here and investigations of the isotopes of hydrogen, carbon, oxygen<br />
and sulphur.<br />
CHEMICAL CHARACTER OF WATER<br />
The chemical character of the water reflects the combined effect of chemical<br />
activity between water and limestone and the flow pattern within the aquifer. Within<br />
the study area most of the water (Wildwood, Groveland, Polk City and Fort Meade)<br />
CATIONS ANIONS<br />
Fig. 2 - Chemical composition of ground water from the principal artesian aquifer of<br />
central Florida.<br />
is of the CaHCOs type; the magnesium and sulphate content increases downgradient<br />
so that a mixed type of water is produced by the wells at Ocala and Arcadia, and a<br />
Cas04 type water is produced by the well at Wauchula. The well at Cleveland produces<br />
water of NaCI type. The chemical character of water in the area of study is shown in<br />
table 1 and is represented in figure 2 as a trilinear plot of the percentages of each<br />
major constituent to the total anions or cations in milliequivalents per litre.<br />
The Polk City well is close to the highest part of the piezometric surface (fig. 1)<br />
and water in this part of the aquifer flows radially downgradient. The area near Polk<br />
603
City is a principal area of recharge, and the Groveland and Wildwood areas also<br />
contribute substantial quantities of water to that portion of the aquifer system north<br />
and westward of the Polk County high (Stringfield, 1936, p. 151). Between the area<br />
of recharge and Ocala, the principal change in composition is in the anion facies, which<br />
changes from predominantly HC03 to a mixture that is predominantly S04+HC03<br />
(table 1).<br />
A simple progressive change in type of water occurs as water moves from Polk<br />
City toward the Cleveland area, indicating only minor recharge south of Polk City.<br />
Between Polk City and Arcadia there is a progressive increase in the Mg:Ca ratio in<br />
the cations and a similar increase of S04:HC03 ratio in the anions. A major change in<br />
aqueous chemistry occurs between Arcadia and Cleveland. At Arcadia the hydro-<br />
chemical facies is Mg+Ca, so4 whereas water produced by the Cleveland well is<br />
a NaCl type water.<br />
Similar patterns of chemical change away from the principal recharge area are<br />
shown by the constituents which are discussed in the following paragraphs, and by<br />
the isotope measurements and mineral saturation studies which are discussed in the<br />
two following sections. The TDS (total dissolved solids) content of the water in the<br />
study area increases north and south away from the area of recharge, and in particular,<br />
from the area of recharge at Polk City (fig. 34. The Polk City-Wildwood area is<br />
characterized by water with less than 200 mg/l TDS. South of the Polk City recharge<br />
area, water from the aquifer exhibits a progressive increase in TDS to a maximum of<br />
1600 mg/l at Cleveland. Northward, the TDS increases to 420 mg/l.<br />
A similar pattern is observed for the concentration of sulphate ions in the ground-<br />
water (fig. 3b). In the Polk City-Wildwood area the sulphate is less than 10 mg/i and<br />
increases to 148 mg/l at Ocala. South of the Polk City area the sulphate content<br />
increases progressively as far as Arcadia and decreases between Arcadia and Cleveland.<br />
Similar reversals in other chemical parametres occur between Arcadia and Cleveland.<br />
These may be due in part to mixing of waters from different geohydrologic<br />
environments, as reflected in the change in hydrochemical facies from Mg+Ca, so4<br />
to NaCl. South of the Cleveland area, water from the principal artesian aquifer<br />
becomes increasingly more saline and approaches the concentration of ocean water.<br />
It is possible also that water produced by the well at Cleveland includes a significant<br />
amount of water from the Hawthorn Formation because the well is not cased through<br />
the Hawthorn Formation. The quality of water in the Hawthorn Formation does not<br />
affect the well at Polk City because the well is near the piezometric high and the<br />
limestone aquifer is recharged only by percolation downward through the Hawthorn<br />
Formation, whose water has essentially the same chemical character as that of the<br />
Floridan aquifer. However, at Cleveland, water from the Hawthorn is probably quite<br />
different from water in the Floridan aquifer and from water in the Hawthorn at<br />
Polk City.<br />
The bicarbonate content of water from the aquifer is relatively uniform throughout<br />
the area of study (fig. 4a). In the Polk City-Wildwood area the bicarbonate content is<br />
somewhat lower than elsewhere, indicating that this is an area of major recharge.<br />
The uniform bicarbonate content reflects a buffering mechanism by the solid carbonate<br />
phases of the aquifer rocks.<br />
To summarize the chemical data presented so far, an area of significant recharge<br />
between Polk City and Wildwood is identified by downgradient changes in hydro-<br />
chemical facies, and by changes in concentrations of total dissolved solids and of<br />
sulphate ion.<br />
RADIOCARBON CONCENTRATIONS<br />
Results of radiocarbon measurements made on the bicarbonate ion in water from<br />
each well are provided in table 2 and figure 4b. The measurements are part of a continu-<br />
604
605
606<br />
1 sa313w
607
ing study of the isotopic composition of water and rock samples representative of the<br />
aquifer, that will include an investigation of the isotopes of hydrogen, carbon, oxygen,<br />
and sulphur.<br />
The results of C14 determinations have been published elsewhere (Hanshaw, Back<br />
and Rubin, 1965) for the group of wells from Polk City south to Cleveland. Because<br />
there is no evidence of significant recharge south of Polk City, differences in CI4 ages<br />
between wells are assumed to be due to time of travel and are used to calculate apparent<br />
velocities of groundwater flow. Velocities range between two and 12 metres per year<br />
(table 2). Net velocities between Polk City and wells to the south calculated from<br />
hydrologic equations are essentially in agreement with the radiocarbon-determined<br />
velocities (table 2). Although apparent radiocarbon ages wil not give absolute residence<br />
time, age difference between two wells wil approximate relative residence time.<br />
MINERAL EQUILIBRIUM<br />
Measurements of departure from chemical equilibrium between groundwater and<br />
the minerals which comprise an aquifer aid in delineating principal areas of recharge<br />
and in predicting areas subject to solution or deposition of minerals. Equilibrium<br />
studies also increase our knowledge of the minerals that control the chemistry of water<br />
and the changes that may occur with time or because of the application of a stress<br />
upon the hydrologic system.<br />
The minerals considered in this study are those most common in the principal<br />
artesian aquifer: calcite, aragonite, dolomite, gypsum, and anhydrite. The thermo-<br />
dynamic model used in this study was developed by Back (1961) and has been applied<br />
to a study of calcium carbonate saturation of groundwater in Florida (Back, 1963).<br />
Each of the minerals is handled thermodynamically in the same manner; gypsum wil<br />
be used as an example. The chemical equation describing the solution of gypsum is<br />
CaSO, .2 H20 = Ca+’ +SO 4 ’ + 2 H20<br />
and the equilibrium constant, Keq, for gypsum Kgyp, is<br />
where a is activity. By definition, the activity of a solid phase is equal to one; for<br />
dilute water the activity of water may also be considered equal to one, hence<br />
equation (2) becomes<br />
Kgyp = %a+2US04-Z (3)<br />
The equilibrium constant was calculated from the Gibbs free energy values by standard<br />
thermochemical methods (see Garrels, 1960, pp. 6-18). The Keq given in the heading<br />
of table 3 is at 25°C; the Keq of the minerals at the temperature of the groundwater<br />
was calculated by use of the Van’t Hoff equation.<br />
Several steps are required to go from standard chemical analyses such as those in<br />
table 1 to activities of single ions. (See Garrels, 1960, pp. 3-42, Back, 1963.) The<br />
calculated activities of calcium and sulphate ions are used in equation (3) to obtain<br />
the ion activity product, Kiap. The Kisp is compared with the equilibrium constant to<br />
determine the departure from equilibrium of the water with respect to gypsum. If the<br />
ratio, Kisp: Kgyp, is equal to one (or 100%) the water is saturated with respect to<br />
gypsum; a ratio less than one (less than loo%), the water is undersaturated and if the<br />
ratio is greater than one, the water is supersaturated. From the form of equation (3)<br />
it is seen that the Kiag for gypsum and anhydrite are the same.<br />
The principals for determining carbonate mineral saturation are identical. However,<br />
608
id<br />
;o<br />
O<br />
z<br />
oj<br />
d<br />
m<br />
d<br />
&<br />
O r.<br />
a<br />
I<br />
a<br />
2<br />
E 2<br />
m<br />
N<br />
+<br />
E m<br />
O<br />
m<br />
a M
determination of saturation of carbonate minerals requires accurate determination of<br />
bothpH and bicarbonate in the field. This is necessary because the equilibrium constant<br />
for calcite is<br />
Kcaic = %i+z%03-2 (4)<br />
whereas the major dissolved carbon species is commonly bicarbonate ion at the pH of<br />
most groundwater. Therefore it is necessary to calculate aCO3-2 from the relationship<br />
and G(co~-~ is sensitive to changes in a~+(pH). As shown above for gypsum and<br />
anhydrite, the Kiap for calcite and aragonite is the same.<br />
Departure of the groundwater from equilibrium with respect to gypsum and<br />
anhydrite is shown in table 3 and figure SQ. The entire study area contains water<br />
undersaturated with respect to both gypsum and anhydrite. However, water in the<br />
Polk City-Wildwood area is most undersaturated. This is related to the low sulphate<br />
ion concentration in water of that area. The paucity of sulphate may be caused either<br />
by lack of deposition of gypsum and anhydrite in this area, or-perhaps more likelyby<br />
the great amount of recharge and the consequent removal of sulphate minerals by<br />
solution during the millennia since the rocks were elevated to where they could be<br />
dissolved by percolating waters.<br />
It is suggested that the progressive decrease in undersaturation of water with<br />
respect to gypsum and anhydrite south of Polk City is an expression of distance of<br />
travel time from the recharge area and residence time (fig. 46) in the aquifer system.<br />
In table 3 and on all the figures representing the results of the mineral equilibrium<br />
study (fig. 4b-6b) an apparent reversal of trend is observed in water from the Cleveland<br />
well. This reversal may be the result of mixing as mentioned above.<br />
In the study area the groundwater is undersaturated with respect to aragonite<br />
(fig. 5b) but is most undersaturated in the principal area of recharge-the Wildwood-<br />
Polk City area.<br />
Results of the calcite saturation investigation (fig. 6a and table 3) are generally<br />
similar to, yet significantly different from the picture developed for the aragonite<br />
study. (Compare fig. 6n and 5b.) Al but one well-that at Wildwood-produce<br />
water supersaturated with respect to calcite. However, the Groveland-Polk City area<br />
contains water which is less supersaturated than elsewhere; the generally low degree<br />
of saturation at Wildwood probably indicates the influence of significant amounts of<br />
recharge on the chemistry of groundwater.<br />
An important but unanswered question is, “How does water in a limestone aquifer<br />
remain supersaturated with respect to the major solid phase present in the aquifer?”<br />
First, perhaps the analytical results may be slightly in error and the supersaturation<br />
may be more apparent than real; only a slight excess of calcium or carbonate ion is<br />
necessary to achieve the percentages of supersaturation shown in table 3. However,<br />
water from wells used jn this study has been sampled and analysed twice at different<br />
times of the year with similar results. Thus we believe that supersaturation is real and<br />
not an implied false value resulting from analytical error.<br />
Secondly, this study was conducted using the values of free energy of pure, ordered<br />
phases of CaC03 to calculate equilibrium constants. However, many limestones are<br />
not pure CaC03 but contain as much as several per cent magnesium in the calcite.<br />
This departure from a pure phase increases the free energy of the phase which, in turn,<br />
increases the value of the equilibrium constant. Results obtained in this study are<br />
within the limits of the possibility that the groundwater is in equilibrium with a<br />
magnesian calcite.<br />
A third and intriguing possibility (which is also compatible with the hypothesis<br />
that the water is approximately in equilibrium with a magnesian calcite phase) is that<br />
610<br />
’
61 1
612<br />
E<br />
4<br />
P<br />
,” 1331<br />
VlV30<br />
aOOMallM<br />
(INV13AOäE)<br />
A113 Nod<br />
3 a v ~<br />
1804<br />
VlílH3ílVM<br />
viav3w<br />
aNV13A313<br />
2<br />
$<br />
3
613<br />
VlVIO<br />
a00MallM<br />
B<br />
h<br />
Y<br />
d<br />
111) Ilod<br />
.4<br />
*<br />
B<br />
R<br />
E<br />
O<br />
*i'<br />
Y<br />
o<br />
4<br />
-8<br />
wlw iüoi<br />
c<br />
VlflHlflVM<br />
viaviw<br />
ûNV13h313
water wil maintain supersaturation with respect to pure calcite, possibly for kinetic<br />
reasons, until saturation with respect to aragonite is reached. Once equilibrium is<br />
attained, aragonite may precipitate and later invert to calcite. In the ocean and in<br />
closed basin environments, aragonite, in preference to calcite, is the usual phase to<br />
precipitate out of solution. Perhaps, in groundwater also, aragonite and not calcite<br />
is the control on carbonate equilibrium.<br />
Although the water between Ocala and Polk City is undersaturated with respect<br />
to dolomite, the water from the wells at Ocala and Polk City is nearly at equilibrium.<br />
The departure from equilibrium at Wildwood and Groveland suggests this area is one<br />
of major recharge to the aquifer. In this study, a commonly accepted value 1 x 10-17<br />
was used as the Keg for dolomite. The relatively high degree of supersaturation may<br />
be the result of choosing a Keg which is too high; perhaps a value of 2 or 3 x 10-17,<br />
as suggested by Hsu (1963) and by Barnes and Back (1964), is more nearly correct.<br />
Lack of equilibrium with respect to dolomite in the Ocala-Polk City area is<br />
controlled by the low magnesium content of groundwater in this region. Away from<br />
the area of major recharge the calcium content increases by a factor of two or, at<br />
most, three. The magnesium content, however, increases by a factor of from three to 30<br />
(table 1 and fig. 2). The increase in magnesium content probably is caused by t~e greater<br />
solubility of a magnesium calcite compared to pure calcite. The concentration of calcium<br />
ion is maintained at a rather constant value because the groundwater in nearly all<br />
the study area is supersaturated with respect to calcite.<br />
CONCLUSIONS<br />
This investigation confirms previous studies (Stringfield, 1936, p. 151) that major<br />
recharge to the Floridan aquifer may occur not only in high but also in some lower<br />
areas of the piezometric surface. Principal areas of recharge in the Floridan aquifer<br />
are indicated by low total dissolved solids, low sulphate and magnesium ion content,<br />
high C14 concentrations (low apparent ages), and by degree of undersaturation with<br />
respect to various solid phases. As water moves away from the recharge area it increases<br />
in total dissolved solids, sulphate and Mg:Ca ratio. In addition, CI4 decreases in a<br />
systematic manner allowing calculation of apparent groundwater velocities. A study<br />
of mineral equilibrium indicates that groundwater increases in saturation away from<br />
recharge areas and may become supersaturated with respect to some solid phases.<br />
REFERENCES<br />
BACK, William, 1961, Calcium carbonate saturation in ground water, from routine<br />
analyses: U.S. Geol. Survey Water -SuppìyPaper 1535-D, 14 p.<br />
-, 1963, Preliminary results of a study of calcium carbonate saturation of ground<br />
water in central Florida: Internat. Assoc. Sic. Hydrol.: 8, 43-51.<br />
BARNES, Ivan and BACK, William, 1964, Dolomite solubility in ground water: Art. 160<br />
in U.S. Geol. Siircey Prof. Paper 475-D, D179-180.<br />
GARRELS, R. M. (1960) Mineral Equilibria: Harper and Bros., New York, 254 p,.<br />
HANSHAW, B. B., BACK, William, and RUBIN, Meyer, 1965, Radiocarbon determinations<br />
for estimating ground-water flow velocities in central Florida: Science, Apr., 23,<br />
148, no. 3669, 494-495.<br />
HEALY, H.G., 1962, Piezometric surface of the Florida aquifer in Florida, July 6-17,<br />
1961: Fla. Geol. Szwuey, Map Series No. 1.<br />
Hsu. K. 3.. 1963. Solubilitv of dolomite and comDosition of Florida ground waters:<br />
I<br />
J. Hydrol., 1,’288-310.<br />
LEGGRAND, H.E., and STRINGFIELD, V.T., 1965, Development of permeability in the<br />
Tertiary limestones of the southeastern states, U.S.A.: (in press) International Assoc.<br />
Sci. Hydrology.<br />
PRIDE, R.W., MEYER, F.W., and CHERRY, R.N., 1961, Interim report on the hydrologic<br />
features of the Green Swamp area in central Florida: Fla. Geol. Survey Cire., no, 26,<br />
968.<br />
STRINGFIELD, V.T., 1936, Artesian water in the Florida peninsula: US. Geol. Survey<br />
Water-Supply Paper 7734, pp. 115-195.<br />
614
RESUME<br />
SUR LE RAPPORT DE LA SOLUBILITE<br />
DES CALCAIRES ET DES DOLOMIES<br />
Dragoljub ZOCOVI&<br />
Institut de recherches géologiques et géophysiques, Belgrade<br />
La solubilité des roches dans les eaux naturelles est l’une des principales conditions<br />
du développement karstique en général et, par conséquent, de la formation d’aquifères<br />
carbonates. C’est là un problème auquel on s’est intéressé dès le début de l’étude<br />
des karsts. Mais la dissolution des roches carbonatées dans l’eau naturelle est un<br />
phénomène physico-chimique très complexe et, bien que de nombreux travaux de<br />
laboratoire aient été effectués à ce sujet dans le monde entier, la question de la solubilité<br />
des calcaires et des dolomies n’est pas encore suffisamment étudiée et éclaircie. Les<br />
ouvrages de géologie contiennent des données très contradictoires sur différents<br />
aspects de la relation entre les solubilités respectives de ces roches qui constituent le<br />
principal agent de la karstification.<br />
La solubilité des roches dépend surtout de la nature de la substance cristalline.<br />
La cohésion du réseau cristallin, qui est inversement proportionnelle à la solubilité,<br />
a une importance capitale; viennent ensuite la structure de la roche et la quantité<br />
d’impuretés qu’elle contient. La nature du solvant est l’autre facteur important de<br />
la solubilité des calcaires et des dolomies. Les différentes propriétés hydrochimiques<br />
et thermodynamiques des solutions aqueuses influent différemment sur la solubilité<br />
des calcaires et des dolomies. En conséquence, la relation entre les solubilités respectives<br />
de ces roches dans des conditions hydrochimiques et thermodynamiques différentes<br />
est variable.<br />
SUMMARY<br />
The problem of relation between the limestones and dolomites solubility<br />
The solubility of rocks in natural waters represents one of the main conditions for<br />
the development of karst in general and consequently the carbonates. Even the first<br />
investigator of karst, therefore, had paid their attention to that problem. However,<br />
the solution of carbonate rocks in natural water is a very complex physico-chemical<br />
process and in spite of numerous laboratory tests performed in the world, the problem<br />
of solubility of limestones and dolomites has not been studied and enlightened su,ffi-<br />
ciently as yet. The geological literature deals with very contradictory data concerning<br />
different aspects of the relation between the solubility of these rocks which represent<br />
the main medium for the karstification.<br />
The solubility of rocks mainly depends on the nature of crystal material. The<br />
energy of crystal lattice, standing in the reciprocal ratio with the solubility, is of essential<br />
importance and then come the structure of rock and the content of impurities. The<br />
other important factor which governs the solubility of limestones and dolomites is<br />
the character of the solvent. Different hydrochemical and thermodynamic properties<br />
of aqueous solution are of different influence on the degree of solubility of limestones<br />
and dolomites. Consequently, the relation between the solubility of these rocks in<br />
different hydrochemical and thermodynamic conditions is changeable.<br />
Une des conditions essentielles pour la création d’un karst est la solubilité des<br />
roches. C’est la raison pour laquelle les premiers karstologues s’occupaient de cette<br />
question. Cependant, la solubilité des calcaires et des dolomies, roches le plus souvent<br />
sujettes à la karstification est un processus physico-chimique très complexe. Malgré<br />
les nombreuses études de laboratoire effectuées dans le monde, la solubilité des calcaires<br />
et des dolomies reste encore insuffisamment étudiée et mal élucidée. Dans la documen-<br />
tation scientifique on rencontre des théories tout à fait opposées sur la solubilité de<br />
ces roches carbonatées. D’après certains auteurs qui sont, semble-t-il, la majorité,<br />
la solubilité des dolomites et des dolomies est considérablement moindre que la<br />
615
solubilité de la calcite ou du calcaire, et d’après d’autres la situation est inverse. Ce<br />
n’est que tout récemment que s’est formée l’opinion que la solubilité de ces carbonates<br />
est fonction des conditions hydrochimiques et thermodynamiques.<br />
F. W. Pfaff (1907) a mis en évidence ces résultats (dus à Koss, à Bischof, à Scheerer,<br />
à Doelter-Hornes, à Gorup-Besanez). C’est ainsi que d’après Koss l’eau saturée en<br />
COZ, à la pression normale, dissout moins la magnésite que la dolomite et davantage<br />
la calcite. Les données des tests dus à Bischof, à Scheerer et à Doelter-Hornes,<br />
démontrent que l’eau contenant du COZ est en état de dissoudre la dolomite dans la<br />
solution seulement sous forme de traces. Gorup-Besanez a examiné la poussière de la<br />
roche de la composition suivante, en % : CAC03, 55,03; MgC03, 40,9; FeC03, 1,6;<br />
SiOz+Ai203, 1,03, dans l’eau à l’acide carbonique. D’après les données obtenues par<br />
cet examen, pour une roche dont la teneur en carbonate de chaux est un peu plus élevée<br />
que dans la dolomie normale, après cinq et huit jours, les CaC03 et MgC03 étaient<br />
dissous dans des rapports proches voisins de ceux de la dolomie normale. En revanche,<br />
après 21 jours, dans la solution se trouvait plus de la calcite que pour une dolomie<br />
normale. En résumé, Pfaff conclut que la magnésite et la dolomite sont faiblement<br />
solubles dans les acides dilués, à l’exception de l’acide carbonique dont l’influence<br />
sur leur solubilité reste mal élucidée.<br />
H. Leitmeier (1916) souligne que les essais de la solubilité de la magnésite et de la<br />
dolomite dans l’eau pure, aux températures variées, n’ont pas été couronnés de succès,<br />
c’est-à-dire que l’on n’a pas obtenu de quantités mesurables de substance dissoute.<br />
D’après son test, dans de l’eau chargée en oxyde de carbone à la température ambiante,<br />
pour une durée de 8 jours, la solution contenait 0,ll gil de fine poussière de dolomite,<br />
donc une quantité relativement imposante.<br />
O. Lehmann (1936) traite également la question de la solubilité des carbonates,<br />
en mettant en évidence qu’il n’y a pas beaucoup à dire sur la solubilité des dolomites.<br />
Tout de même il conclut, en se basant essentiellement sur les résultats de Coss, qu’à<br />
la pression inférieure à 1 atm. dans de l’eau contenant du COZ, la dolomite est moins<br />
soluble que le calcaire.<br />
I. V. Popov (1 959), en mettant en évidence la diversité des données sur la solubilité<br />
des dolomites dans l’eau pure, cite comme valeur probable 3,2 mg/l, tandis que la<br />
solubilité de la calcite, également dans l’eau pure (d’après cet auteur) est caractérisée<br />
par les valeurs suivantes : à la température de 25 “C - 14,33 mg/l; à la température de<br />
50°C - 15,04 mg/l et à la température de 100°C - 17,59 mg/l.<br />
Les plus marquants parmi les partisans de l’opinion que la solubilité de la dolomite<br />
est plus grande que celle de la calcite sont les minéralogistes. D’après N. M. Strahov<br />
(1963) la solubilité des dolomites n’est pas établie par voie expérimentale, mais on peut<br />
considérer qu’elle se situe entre le degré de solubilité de la calcite et celui de la magnésite,<br />
qu’en tout cas ce degré de solubilité est supérieur à celui de la calcite, mais la calcite<br />
se dissout plus vite que la dolomite. G.I. TeodoroviE (1960), de m6me que Strahov,<br />
en examinant la genèse des dolomies considère que dans les conditions marines et<br />
lacustres normales la dolomite est beaucoup plus soluble que la calcite et que leur<br />
solubilité est très voisine aux hautes pressions partielles du COS.<br />
Ces opinions contradictoires sur la solubilité de la dolomite et de la calcite, ainsi<br />
que des dolomies et des calcaires, résultent du fait que l’on attribue aux résultats des<br />
tests dans des conditions déterminées une extension universelle, et que l’on perd de<br />
vue la possibilité d’une modification complète de ces valeurs selon la composition des<br />
solutions aqueuses et leur température. De plus, lorsqu’il s’agit des roches - comme<br />
les dolomies et les calcaires, leur composition et leur microstructure inñuent sur leur<br />
solubilité. Il faut tenir compte de deux aspects du problème : de la vitesse de la<br />
dissolutiop et du degré de la solubilité.<br />
D.S. Sokolov (1962) a traité très à fond le problème de la solubilité des dolomies<br />
et des calcaires. Ses conceptions seront largement utilisées dans cet exposé.<br />
616
D’une manière générale, la solubilité de la matière cristalline est fonction de sa<br />
nature d’une part, et de l’action dissolvante du solvant d’autre part. Au cours du<br />
processus de la dissolution, les molécules de l’eau détruisent, par ses champs électriques<br />
et la dynamique calorifique, la grille cristalline du sei où les ions sont liés par les forces<br />
d’attraction électrostatiques.<br />
La constance de la grille cristalline d’une matière est déterminée par l’énergie<br />
nécessaire pour le déchirement des liaisons existantes en elle et l’éloignement des ions<br />
de la grille jusqu’à la distance où cesse leur influence mutuelle. L’énergie de la grille<br />
cristalline, pour les conditions déterminées thermiques et de tension, est fonction du<br />
radius et du chargement de ses ions et de la structure du cristal. Sur le tableau 1 sont<br />
présentées les grandeurs de l’énergie des grilles cristallines de quelques combinaisons<br />
à la température de 18°C et à la pression de i atm.<br />
TABLEAU 1<br />
La grandeur de I’ériergie de la grille cristalline (d’après D.S. Sokoloo, 1962)<br />
Combinaison<br />
NaCI (sel gemme)<br />
Cas04 (anhydrite)<br />
CaS04.2 H2O (gypse)<br />
CaC03 (calcite)<br />
CaMg (CO& (dolomite)<br />
Energie de la grille cristalline de kcal<br />
par 1 molécule de la matière<br />
Calculé d’après les Calculé d’aprks<br />
données thermochim. les Eksl<br />
183<br />
642<br />
650<br />
700<br />
745<br />
i 19<br />
621<br />
Les données du tableau présenté ci-dessus démontrent que la grandeur de l’énergie<br />
de la grille cristalline et la solubilité de la matière sont dans le même rapport. La<br />
grandeur de l’énergie de la grille cristalline du sel le plus aisément soluble (NaCl)<br />
est quatre fois moindre que la grandeur de l’énergie de la grille cristalline de la dolomite.<br />
Cependant, la différence entre les valeurs de l’énergie de la grille cristalline de calcite<br />
et de celle de la dolomite, ce qui nous intéresse tout particulièrement cette fois, n’est<br />
pas sensible. C’est pourquoi, en ce qui concerne le rapport de leur solubilité, les autres<br />
facteurs dont dépend la solubilité sont décisifs.<br />
D’autre part, la constance de la grille cristalline est différente dans les différentes<br />
conditions thermiques et de tension. Un accroissement de la température donne lieu<br />
à un affaiblissement de l’effet mutuel des ions et diminue l’énergie de la grille cristalline.<br />
En excluant l’influence de la température sur l’action dissolvante des solutions aqueuses,<br />
la solubilité des cristaux augmente avec une température élevée. De même, la substance<br />
minérale est plus soluble lorsqu’elle est sous une pression plus grande que le solvant<br />
(N.A. Ogiljvi, 1956; D.S. Sokolov, 1962). N.A. Ogiljvi attribue une importance<br />
particulière à l’influence de la pression, à laquelle est exposé le squelette de la roche,<br />
SUI la solubilité, et il en explique la création du karst au-dessous des bases érosives.<br />
De même que D. Sokolov le souligne, on peut considérer que la solubilité est<br />
fonction des dimensions des grains de la substance cristalline. Les résultats de nombreux<br />
tests sur les différents matériels cristallins indiquent que les petites particules sont<br />
«Ek» dktennine la quantité de l’énergie qu’un ion met en liberté à l’occasion<br />
du passage de l’état libre en état d’ion ou d’atome dans la grille cristalline (D. Sokolov,<br />
1962, d’après A.E. Fersman).<br />
-<br />
653<br />
617
sensiblement plus solubles que les grosses. Cela prouvent aussi les résultats de l’examen<br />
de la solubilité des dolomies de la région des Dinarides que j’ai fait sur les échantillons<br />
de grandeur variée. C’est-à-dire que les échantillons de dolomie de structure pélitomorphe<br />
sont considérablement plus solubles que les échantillons de gros grains.<br />
La cause en est que «les solutions aqueuses peuvent être non saturées de petits grains,<br />
saturées de grains moyens et sursaturées de gros grains)). (D. Sokolov, 1962). Cela<br />
signifie qu’il est possible qu’en même temps les petits grains se dissolvent et que les<br />
gros s’accroissent. I1 est à souligner que de tels phénomènes ne sont pas rares dans les<br />
roches dolomitiques.<br />
Par conséquent, l’inégalité des grains des dolomies et des calcaires est un facteur<br />
important des différences de solubilité.<br />
Les ingrédients étrangers exercent une influence prononcée sur la solubilité des<br />
roches carbonatées. I1 faut distinguer les ingrédients qui ralentissent et<br />
accélèrent la dissolution. Parmi les premiers on compte les ingrédients moins solubles<br />
que les carbonates. Parmi eux sont importantes, pour les dolomies et les calcaires, les<br />
substances argileuse et bitumineuse. Elles ralentissent le processus de la dissolution en<br />
formant les patines colloïdales couvrant les grains minéraux. La substance argileuse et<br />
bitumineuse en ingrédients des roches carbonatées (calcaires et dolomies) joue un rôle<br />
important dans le processus de la karstification.<br />
Les ingrédients de la matière plus soluble que la substance minérale essentielle<br />
des calcaires et des dolomies accélèrent le processus de la solution et augmentent la<br />
solubilité. Mais, comme le souligne D. Sokolov, l’essence de ce phénomène a un autre<br />
sens. Les sels plus aisément solubles en passant en solution augmentent son agressivité,<br />
c’est-à-dire son action dissolvante, ce qui est déjà une autre question.<br />
Pour les roches calcaire-dolomie le rapport calcite-dolomite est tout particulièrement<br />
intéressant. D’après N.V. Rodionov (1958) et I.V. Popov (1959), on a établi que la<br />
vitesse de dissolution de la calcite dans les conditions physico-chimiques les plus<br />
fréquentes est plus grande que celle de la dolomite. Tout permet de considérer que la<br />
dissolution de la calcite est plus rapide que celle de la dolomite. En outre, d’après<br />
N. Rodionov et I. Popov, dans le mélange de calcite-dolomite, la vitesse de la dissolution<br />
de l’un ou de l’autre des composants augmente avec la diminution de sa teneur dans<br />
le mélange (tableau II), pour des vitesses lentes du solvant aqueux.<br />
I1 faut souligner que la vitesse de la dissolution de la calcite dans les dolomies<br />
calcaires est l’une des causes essentielles de la dégradation de leurs masses rocheuses<br />
en un détritus dolomitique, qui joue cependant un important rôle hydrogéologique<br />
dans les terrains karstiques.<br />
618<br />
TABLEAU II<br />
La solubilité du mélange de la calcite et de la dolomite (I. V. Popov, 1959)<br />
Teneur du mélange<br />
en % pondéraux<br />
Rapport de la vitesse<br />
de la dissolution de la calcite<br />
et de celle de dissolution de la dolomite,<br />
à la vitesse de la circulation de l’eau<br />
Calcite Dolomite 15,7 m/jour 1,57 m/jour<br />
98 2<br />
91 9<br />
50 50<br />
9 91<br />
0,35<br />
1,73<br />
11,2<br />
32,4
Un autre et probablement le plus important des facteurs qui conditionnent le degré<br />
de solubilité des calcaires et des dolomies est le caractère des solutions aqueuses dont<br />
même l’action dissolvante change en fonction des conditions dynamiques. Cependant<br />
et malheureusement, on doit constater qu’on ne dispose que de trop peu de données<br />
sur la solubilité des calcaires et des dolomies dans les conditions physico-chimiques et<br />
thermo-dynamiques proches de celles de la nature. Pour ces raisons, les karstologues<br />
étaient obligés d’utiliser les données sur la solubilité de ces roches obtenues dans le<br />
but d’expliquer leur genèse, c’est-à-dire dans des conditions bien déterminées, et en les<br />
prenant pour base donnaient des conclusions sur leur solubilité dans les conditions<br />
naturelles de formation du karst.<br />
La conception de D. Sokolov sur les variations du rapport de la solubilité de la<br />
calcite et de la dolomite dans les différentes conditions physico-chimiques est basée<br />
sur les résultats des études importantes de O.K. Janeteva.<br />
Nous traiterons plus loin du rapport de la solubilité de la dolomite et de la calcite<br />
dans des solutions aqueuses différentes et des conditions physico-chimiques variées.<br />
Sur le diagramme (fig. li est représentée la solubilité de la dolomite et de ses<br />
mélanges avec la calcite et le gypse à la température de 25 “C et &O2 de 1 atm. Pour<br />
les conditions données, la solubilité de la dolomite est plus faible de 25 à 35 % que la<br />
solubilité de la calcite. La solubilité totale des carbonates dans les mélanges de la<br />
dolomite et de la calcite, ainsi que de la dolomite, de la calcite et du gypse est<br />
approximativement égale à la solubilité de la calcite.<br />
Fig. 1 - Solubilité de la dolomite et de ses mélanges avec la calcite et le gypse à<br />
t = 25°C et &OZ = 1 atm. (d’après D.S. Sokolov, 1962).<br />
1. dolomite; 2. dolomite +calcite; 3. dolomite + gypse; 4. dolomite +calcite +<br />
gypse; 5. grandeur de la solubilité de la calcite.<br />
-<br />
Les données de deux différents tests de Janeteva sur la solubilité de la dolomite<br />
dans son mélange avec le gypse sont contradictoires. D’après l’un des tests, dont les<br />
résultats sont présentés sur le diagramme de la figure 1, la solubilité de la dolomite dans<br />
le mélange avec le gypse est très forte. Les résultats de l’autre test, cependant<br />
(tableau III), démontrent que Cas04 en solution, pour &O2 = 1 atm., se comporte<br />
comme un composé sans influence sur la solubilité de la dolomite. A savoir, d’après<br />
les données du tableau III le rapport de la solubilité de la calcite et de la dolomite<br />
dans l’eau avec acide carbonique est fonction de la valeur de &Oz. Pour ,CO2 = 1 atm.<br />
la solubilité de la dolomite est moindre, et pour pCOz = 0,0012 atm. elle est supérieure<br />
à la solubilité de la calcite. I1 faut souligner que cette dernière valeur du &Oz est<br />
proche des conditions naturelles (la teneur moyenne du CO2 dans l’air atteint 0,03 %,<br />
619
espectivement COZ est de 0,0003 atm.). Dans ce dernier cas, le processus de la dissolu-<br />
tion s’exerce anormalement. D’autre part, l’influence de Cas04 sui- la solubilité de la<br />
dolomite se manifeste différemment aux différentes valeurs du COZ. Pour<br />
pCO~=0,0012 atm. la solubilité de la dolomite dans la solution de Cas04 est<br />
supérieure à la solubilité dans l’eau pure, mais la solution est de nouveau instable,<br />
tandis que pour &Oz = 1 atm. l’influence de Cas04 sur la solubilité de la dolomite<br />
est insignifiante.<br />
TABLEAU III<br />
La solubilité de la dolomite et de la calcite à la t -25 “C<br />
dans l’eau et dans les solutions du sulfate de calcium (D. Sokolov, 1962)<br />
PC02<br />
Calcite<br />
~~<br />
Dolomite<br />
Ca (HC03)z SO4 Ca Mg HC02 SO4<br />
à 100 g de la solution<br />
1 8,98 8,98 - 3,21 3,28 6,49 -<br />
1 20,47 7,52 12,95 19,06 3,39 6,85 15,60<br />
0,001 2 0,81 0,81 - 0,40 1,02 1,49 -<br />
0,001 2 15,96 0,38 15,59 15,28 2,85 0,45 17,68<br />
Cependant, en laissant de côté la question de savoir lequel des résultats de Janeteva<br />
est le plus sûr, c’est-à-dire si la présence de Cas04 en solution augmente la dissolution<br />
de la dolomite ou non, d’après D. Sokolov la teneur augmentée en Cas04 dans la<br />
solution provoque inévitablement le changement du taux de la solubilité de la calcite<br />
et de la dolomite, car il est incontestable que la solubilité de la calcite diminue dans<br />
la solution de CaS04. C’est schématiquement présenté sur le diagramme (fig. 2) ou<br />
le comportement de la dolomite est donné pour toutes les variantes.<br />
I I<br />
.-<br />
-<br />
Sadrkuj Caso4 u rastvoru<br />
Teneur en Caso4 de la solution<br />
Fig. 2 - Influence de Cas04 sur la solubilité de la calcite et de la dolomite à<br />
&OZ = 1 atm. (d’après D.S. Sokolov, 1962).<br />
L’influence de la température sur la solubilité de la calcite et de la dolomite et les<br />
rapports mutuels de leurs solubilités aux différentes températures dans l’eau contenant<br />
de l’acide carbonique (&O2 = 1 atm.) sont présentés sur le tableau IV. Pour des<br />
620
,<br />
teneurs élevées en &O2 à la température de 0°C la solubilité de la calcite est d’environ<br />
1,5 fois supérieure à la solubilité de la dolomite. Une augmentation de la temperature<br />
fait disparaître cette différence et à la température de 55 “C la solubilité de la calcite<br />
et celle de la dolomite sont égales. Pour une température supérieure à 55 OC, la solubilité<br />
de la dolomite dépasse celle de la calcite.<br />
TABLEAU IV<br />
La solubilité de lu calcite et de la dolomite dans l’eau<br />
contenuni de l’acide carbonique au ,COZ = 1 atm. (D. S. Sokoìou, 1962)<br />
t “C Millimôles<br />
(HC0$2 à 1 .O00 g de la solution<br />
-<br />
Calcite Dolomite<br />
O<br />
25<br />
55<br />
70<br />
15,08<br />
970<br />
6,09<br />
3,45<br />
10,74<br />
0,49<br />
6,08<br />
4,58<br />
La variabilité du taux de solubilité de la calcite et de la dolomite, dans les conditions<br />
physico-chimiques présentées ci-dessus, est représentée par trois diagrammes schbma-<br />
tisés sur la figure 3. À ce propos, il faut souligner que la détermination des points de<br />
l’intersection des courbes de solubilité de la calcite et de la dolomite dans des conditions<br />
variées est une question particulièrement importante. Par les études suivantes, il faudrait<br />
aussi établir l’influence d’autres facteurs sur le taux de solubilité de ces minéraux.<br />
Fig. A<br />
t+<br />
o<br />
Fig. B<br />
Colcite<br />
Dolomite<br />
P 2-3-<br />
F-<br />
- Teneur<br />
.a- I c<br />
Coicite<br />
._ / __-----<br />
O<br />
Dolomit c<br />
- en CaSO de ia Solution<br />
Teneur en CaSO de la Solution<br />
F1g.C<br />
Fig. 3 - Variations du rapport de la solubilité de la calcite et de la dolomite sous<br />
l’influence de différents facteurs :<br />
a) Influence de la température (à COZ = 1 atm.);<br />
b) Influence de la teneur du COZ ya t = 25°C);<br />
c) Influence de Cas04 (à &OZ = 0,0012 atm. et t = 25 “C) (d’après D. S. Sokolov).<br />
Dans le but d’étudier le taux de solubilité des roches du genre calcaire-dolomie<br />
dans les conditions les plus proches à celles naturelles, j’ai fait les tests de solubilité<br />
de 38 échantillons des calcaires, des calcaires dolomitiques, des dolomies calcaires et<br />
des dolomies d’âge et de caractères pétrogénétiques variés de la région des Dinarides<br />
externes. etant donné qu’on ne cherchait pas à obtenir des valeurs quantitatives, mais<br />
des rapports relatifs de la solubilité d’échantillons variés, le test a été fait sans reconsti-<br />
tuer des conditions physico-chimiques déterminées. Les échantillons étaient broyés en<br />
poussière. 50,OO g de cette poussière passée par un tamis de 0,l mm étaient prélevés.<br />
Les échantillons ainsi préparés étaient mis dans 200 cm3 d’eau distillée dans les verres<br />
gradués. Ces verres étaient couverts par un fin papier filtre et laissés i80 jours à la<br />
62 1
température ambiante. Par le papier filtre circulait l’air, et de sorte que l’influence<br />
permanente du CO2 dans la solution se maintenait.<br />
Dans le but de réaliser le contact le plus intime entre le solvant et les particules<br />
de la roche, tous les échantillons étaient périodiquement mélangés. Après 180 jours,<br />
les échantillons de roche étaient séparés du solvant et par la méthode complexe était<br />
déterminée la teneur en calcium et en magnésium du solvant, transformée en mg/l.<br />
De la concentration du calcium et du magnésium de la solution était calculée la<br />
teneur de CaC03 et de MgC03 égaiement en mg/l.<br />
Les résultats du test sont présentés sur le tableau V.<br />
TABLEAU V<br />
La solubilité des dolomies et des calcaires à la température ambiante<br />
et sous ïinfuence naturelle du COZ dans la solution<br />
Nombre Dissous de CaC03 Dissous de MgC03<br />
Espèce de des échan- __<br />
la roche tillons Max. Min. Moyen. Max. Min. Moyen.<br />
Calcaire 6 18,5 14.1 16,i 2,6 O 1 9 1<br />
Calcaire dolom. 2 12,9 8,4 10,6 3,7 3,6 3,65<br />
Dolomie calcaire 23 68,9 12,4 18,6 26,O 0,39 10,8<br />
Dolomie 17 21,3 10,8 15,8 19,4 3,O 10,5<br />
Comme on voit sur le tableau présenté ci-dessus, la dissolution des échantillons des<br />
calcaires dolomitiques, puis des calcaires, est plus grande que celle des échantillons<br />
de dolomies et particulièrement de dolomies calcaires. Cette différence dans la solubilité<br />
des dolomies et des calcaires, pour les conditions physico-chimiques données ,est tout<br />
à fait évidente. La teneur moyenne du carbonate de calcium dissous (sans carbonate<br />
de magnésium) provenant des dolomies calcaires dépasse la teneur moyenne du car-<br />
bonate de calcium - pratiquement de ka substance dissoute au total - provenant<br />
des calcaires. La teneur moyenne du carbonate de calcium dissous et du carbonate de<br />
magnésium provenant des échantillons des dolomies est aussi bien supérieure à la<br />
teneur respective de la substance dissoute provenant des calcaires.<br />
D’autre part, les rapports du carbonate de calcium et du carbonate de magnésium<br />
dissous démontrent que le processus de la dissolution s’effectue anormalement. En<br />
«plus-value»apparaît tantôt le carbonate de calcium, tantôt le carbonate de magnésium.<br />
C’est ainsi, par exemple, qu’on rencontre, dans la solution de certains échantillons de<br />
dolomies, en majorité le carbonate de calcium et, inversement, dans la solution de<br />
certains échantillons de dolomies calcaires le carbonate de magnésium. Cependant,<br />
d’après les teneurs moyennes, en «plus-value» apparait le carbonate de calcium.<br />
Dans la solution de dolomies calcaires, la teneur moyenne du carbonate de calcium<br />
atteint 63,2%, et du carbonate de magnésium 36,8%. Dans la solution de dolomies,<br />
cette différence est moindre; la teneur en CaC03 est 58,8% et en MgC03-41,2%,<br />
donc, la teneur en CaC03 est tout de même quelque peu supérieure à celle de la<br />
dolomite. 11 faut souligner que cette augmentation de CaC03 dans la solution est<br />
normale, car ces échantillons dissous de la roche renferment aussi de CaC03 libre,<br />
sauf la dolomite.<br />
Sur la base de cet exposé, on peut conclure que les taux de solubilité des calcaires<br />
et des dolomies, en fonction de leurs composition et structure et des conditions physico-<br />
chimiques de la dissolution, sont tres variables. Cependant, on peut dire que dans les<br />
conditions naturelles les dolomies sont le plus souvent plus solubles que les calcaires.<br />
622
D’autre part, la vitesse de is mise eri solution de la calcite paraît sensiblement plus<br />
grande que celle de la mise en solution de la dolomite. Les données dues à O. Janeteva,<br />
analysées par D. Sokolov, démontrent qu’aux pressions faibles, plus proches des<br />
pressions naturelles partielles du COZ, la dolomite est plus soluble que la calcite.<br />
De telles conclusions peuvent être tirées aussi des résultats d’expériences faites sur la<br />
solubilité des échantillons des roches carbonatées de la région des Dinarides.<br />
Les taux de solubilité de la dolomite et de la calcite peuvent être déterminés<br />
indirectement. C’est ainsi qu’en faveur de la solubilité élevée des dolomies, parle<br />
aussi le fait que dans le karst, soit dans les calcaires, soit dans les dolomies, les filons<br />
dolomitiques, c’est-à-dire les formations secondaires, ne sont rencontrés que secondaire-<br />
ment. E n revanche, dans les dolomies, les filons calcitiques sont très fréquents, repré-<br />
sentant des boyaux élargis par la karstification et remplis par la calcite secondaire.<br />
Le fait que dans les récents bassins marins et lacustres la dolomite ne précipite pas,<br />
indique incontestablement que dans les conditions physico-chimiques qui règnent dans<br />
ces bassins, la dolomite est plus soluble que la calcite.<br />
BIBLIOGRAPHIE<br />
LEHMANN O., 1932, Die Hydrographie des Karstes. Leipzig und Wien.<br />
LEITMEIR H., 1916, Zur Kenntnis der Carbonate, II. Neues Jahrbuch für Mineral.<br />
Geol. und Paläontol., XL, Beilage-Band, Stuttgart.<br />
OGILJVI N.A., 1956, Adna iz vozmoinih prifin svjazi karstovih javljenija s tektonifes-<br />
kimi zonami. - Tezisi dokladov na SoveSEaniji PO izufenjiju karsta, Moskva.<br />
PFAFT F.W., 1907, Uber Dolomit und seine Entstehung. - Neues Jahrbuch für<br />
Mineral., Geol. und Paläontol., XXIII, Bailage-Band, Stuttgart.<br />
POPOV J.V., 1959, Inienjernaja geologija. Moskva.<br />
RODIONOV N. N., 1958, lnienjerno-geologifeskije isledovanija v karstovih rejonah ...,<br />
Moskva.<br />
SOKOLOV D. S., 1962, Osnovnije uslovija razvitija karsta. Moskva.<br />
STRAHOV N. M., 1963, Tipi litogeneze i jih evolucija u istoriji zemlji. Moskva.<br />
TEODOROVIE G. J., 1960, O genezi sedimentnogo dolomita. - Geologogeohemieeskije<br />
isledovanija nevtogazonosnih oblastej SSSR, N.N. SSSR, Moskva.<br />
623
CHARACTERISTICS OF WATER FROM SPRINGS IN<br />
THE LIMESTONE REGION OF CROATIA<br />
SUMMARY<br />
Mi1ivo.j PETRIK<br />
Data are presented on ,about 100 springs distributed throughout the region. They<br />
cover the position and altitude of springs and the following characteristics of their<br />
water: temperature, dissolved oxygen, free carbon dioxide, total, carbonate and non-<br />
carbonate hardness, alkalinity, calcium, magnesium and chloride. The data were obtai-<br />
ned in single or repeated observations, and in case of more important springs in all<br />
seasons. The results are grouped for smaller sub-regions and an attempt is made to<br />
arrive at general sub-regional characteristics as well as at general characteristics for<br />
the entire region. Finally, a comparison is made between the underground water of<br />
that region and such water from small-grained water-bearing strata in the non-karsti-<br />
fied portion of Croatia.<br />
RESUME<br />
Caractéristiques de l’eau des sources de lu région calcaire de Croatie<br />
Cette étude donne des indications sur une centaine réparties de sources dans toute la<br />
régionconsidérée, notamment sur l’emplacement et l’al titude des sources, ainsi que sur les<br />
caractéristiques suivantes de l’eau : température, quantité d’oxygène dissous, quantité<br />
totale de gaz carbonique libre, dureté en carbonates et non carbonates, alcalinité, calcium,<br />
magnésium et chlorure. Les données ont été obtenues à la suite d’observations<br />
uniques ou répétées en toutes saisons dans le cas des sources les plus importantes. Les<br />
résultats sont groupés par sous-région; l’auteur s’efforce de dégager les caractéristiques<br />
générales de ces sous-régions, ainsi que celles de l’ensemble de la région. L’étude se termine<br />
par une comparaison entre les eaux souterraines de cette région et celles des couches<br />
aquifères granuleuses de la partie non karstique de la Croatie.<br />
1. INTRODUCTION<br />
From the analytjcal material collected on waters in the limestone region of Croatia,<br />
data from 200 points have been selected for the present attempt to arrive at a general<br />
picture of the character ofwaters in that region. They cover roughly the drainage areas<br />
ofthe rivers Lika, Gacka and Kupa with their tributaries, the region of Rijeka with the<br />
UEka mountain, the basin of Plomin in Istria with some additional Istrian springs, the<br />
main springs on the Adriatic coast between Rijeka and OmiS, the valleys of the lower<br />
Neretva and of the Cetina river, the “polje” of Imotski and the river system Suvaja-<br />
Vrlika-Tihaljina-Trebiiat, the region of the Baeina lakes and the islands of Krk and<br />
Rab. The selected points represent only a small number of springs and rivers in that<br />
region, but, in a general way, include the more important ones of the perennial sources.<br />
Their geographical distribution is shown on figure 1 to 4. Their elevation ranged from<br />
zero to more than 1,000 m above sea-level. Greater springs are, with a few exceptions,<br />
between the sea level and 350 m above it.<br />
The material was collected by the Institute of Sanitary Engineering of the Faculty<br />
of Civil Engineering at Zagreb for 177 points. Supplementary data for some of these<br />
points, and data for the 23 additional points were obtained from the public health laboratories<br />
at Rijeka and Split.<br />
A total number of 576 analyses has been used. Their numbers on individual points<br />
varied between 37 and one. On points with a larger number of analyses, examinations<br />
were made in all seasons, on those with one to four analyses, they were carried out<br />
mostly in the period from June to October, in the months, in which they are the least<br />
distorted by rains.<br />
624
o<br />
e<br />
BO)(ANJAc NOVlGRP<br />
Fig. 1<br />
- oc mE vw.<br />
CLUSIAN WPE<br />
cr SIWIOIOLE<br />
-A- POINT OW TUE RIVER<br />
.p<br />
8
Of the 576 analyses, 400 contained data on temperature, oxygen dissolved, free car-<br />
bon dioxide, total, carbonate and bicarbonate alkalinity, total, carbonate, non-carbo-<br />
nate, calcium and magnesium hardness, and chloride. Further 38 examinations lacked<br />
either data on carbon dioxide or chloride. The remaining 138 examinations gave infor-<br />
mation mostly on temperature, total alkalinity and total hardness, but often also on<br />
some other characteristics.<br />
Fig. 2<br />
gzt 0 R S K I<br />
.O0<br />
W O T A R<br />
All determinations were carried out, and their results expressed, according to the<br />
best known standards 2). The saturation with oxygen was calculated on basis of<br />
Truesdale, Downing and Lowden's table (3), without correction for altitude.<br />
626
2. AREA<br />
Geological information was obtained from the newer literature. The limestone region<br />
of Croatia was built, with few exceptions of a more local character, in the mesozoic<br />
and tertiary age. Smaller palaeozoic regions occur in Gorski Kotar, which makes the<br />
highest portion of the upper Kupa and upper Dobra drainage areas, and in the Velebit<br />
range where it forms parts of the drainage areas of the Lika river and of some of its left<br />
tributaries (4,5v 6$ 7,R,9), and also around the upper Korana river. They are the least per-<br />
meable to water and often form impermeable barries. Of the mesozoic, trias covers the<br />
least part; lower triassic makes small parts of the region of the main springs of the Lika,<br />
Fig. 3<br />
while upper triassic contributes to the region of some other springs of Lika’s tributaries.<br />
Jurassic strata also occur in the Velebit, but also in the mountain of Velika Kapela<br />
where they include part of the drainage area of the upper Dobra river. The greater part<br />
of the mesozoic consists, however, of cretaceous sediments. Lower cretaceous makes<br />
the mountain Svilaja and the south-eastern part of the Dinara range, but is also found<br />
in other regions, as in the mountain of Mala Kapela and around the lakes of Plitvice<br />
(10,11*12;. Upper cretaceous covers the greatest part of the area; it makes the southern<br />
and eastern part of Istria, the main parts of the islands, part of the drainage area of the<br />
Plitvice lakes, the greatest part of the geographic drainage areas of the rivers Korana,<br />
MreZnica and Dobra (below Ogulin), the anticlines of Northern Dalmatia, the region<br />
between Sibenik and Split, the greater part of the Dinara, Mosor and Biokovo moun-<br />
627
tains, and of Hercegovina. Next in importance to the upper cretaceous are deposits<br />
of eocene which often include strata impermeable to water or suitable for agriculture.<br />
Such strata make the northern part of Istria and the north-eastern part of Northern<br />
Dalmatia. Long belts of eocene, in single or multiple arrangement, run along the coast<br />
from Rijeka to Montenegro. Quaternary strata form some of the large basins, as the<br />
“polje” of Sinj and that of Imotski, or the valley of the lower Neretva river.<br />
Fig. 4<br />
Both limestone and dolomite appear in all periods. In the palaeozoic, dolomite is<br />
found in a restricted measure but is developed in all facies of the mesozoic. Both are<br />
subject to corrosive and erosive processes and may be either permeable or impermeable<br />
to water, in dependence of the intensity of these two destructive processes in fissured<br />
rocks. Dolomite cannot be considered as always impermeable but only as less permeable<br />
than limestone. In the region of the lakes of Flitvice, for example, triassic and lower<br />
Jurassic dolomite forms the impermeable barrier which is concordantly covered by<br />
cretaceous dolomite, corroded and eroded, permeable, and without springs. Subsurface<br />
corrosion and erosion can thus develop both in limestone and dolomite. With both, the<br />
precondition are tectonic disturbances of sufficient violence to create fissures, especially<br />
faults, and in first line crossings of faults. The greatest measure of subsurface corrosion<br />
and erosion show the widespread and deep areas of upper-creataceous limestone which<br />
also make the largest part of our region.<br />
The drainage areas of the rivers Kupa, Dobra, Mreinica and Korana are wooded<br />
in their upper parts, and so is the hinterland of Rijeka, the UEka and the Mala and<br />
Velika Kapela, also the continental side of the Velebit. The rest of the region does not<br />
contain forests of importance but is, at the best, covered by macchia.<br />
628
3. ANALYTICAL RESULTS<br />
Limited space prevented presenting of analytical results even in regional groups and<br />
much more so individually. With few exceptions, the number of examinations at single<br />
points was too small to allow statistical methods. For this reason, it seemed best to<br />
present analytical results by the extreme values observed.<br />
Repeated examinations on the same points disclosed the general fact that the results<br />
varied with time, seasons and weather conditions, in some cases within relatively narrow<br />
limits, in other cases quite widely.<br />
3.1 Temperature<br />
The temperature of water varied between 4.8 and 18.0"C. It varied inversely with<br />
altitude, but springs at the same elevation and in the same region showed sometimes<br />
very different temperatures. Thus, the nearly-coastal spring Zvir (point 84), at an elevation<br />
of 5 m, showed temperatures between 8.4 and 9.1 "C, whilst the coastal spring<br />
at Plomin (point 119), at an elevation of 0.5 m., displayed temperatures between 13.3<br />
and 13.9"C; both are in the bay of Rijeka. The low temperatures of the first-called<br />
spring are due to the elevation of its drainage area, which is above 300 m, whilst that of<br />
the second-called lies at about 20 m. Coastal springs showed temperatures between 7.8<br />
and 18.O0C, springs between 300 and 350 m above sea-level between 6.6 and ll.O"C,<br />
those between 550 and 600 m between 7.2 and 10.2"C. Individual springs, if strong and<br />
reliable, showed throughout the year variations of less than 1.0 "C.<br />
3.2 Dissolved oxygen<br />
The saturation of water with oxygen was generally high, between 54 and llO%,<br />
with concentrations between 6.3 and 12 mgil; the usual concentrations were between<br />
8 and 11 mg/l, and the usual saturation between 80 and 100%. Occasionally, supersatu-<br />
ration was observed on the very spot of emergence, which would indicate underground<br />
heating of water as it approached the surface.<br />
The lowest saturation was quite often found at the end of summer or in early au-<br />
tumn, the highest in early spring.<br />
Amopg our 200 points, those on the island of Krk, at Split and at OmiS showed the<br />
lowest saturation, between 63 and 85%, and the springs around Rijeka the highest,<br />
between 86 and 110%. The drainage areas of the springs with the lowest saturations<br />
were those of an agricultural character, the highest ones showed water from wooded<br />
drainage areas.<br />
Generally high saturation indicates subterranean flow in well aerated systems of<br />
fissures.<br />
3.3 Free carbon dioxide<br />
Of all springs in our region except the basin-like ones, with entrance of water at the<br />
bottom, only in 11 was there occasionally no free carbon dioxide. Its presence is a nor-<br />
mal occurrence. The concentrations were usually below 10 mg/l, in some springs below<br />
20 or even 30 mg/l. The springs in the islands of Krk and Rab showed the highest<br />
concentrations, frequently between 30 and 62 mg/l; next to them are the springs at<br />
Plomin (points 116-119), between O and 55 mg/l. All of the 3 drainage areas are under<br />
cultivation. The highest concentration found among strong springs was 16 mg/l.<br />
Higher alkalinity occuried, as is normal, with higher concentrations of free carbon<br />
dioxide. A comparison of all the measured concentrations with those which would<br />
establish an equilibrium with the observed alkalinity, made on basis of Tillman's table<br />
as modified by Zehender, Stumm and Fischer (le), showed that in certain parts of our<br />
region the observed concentration of CO2 was higher than, or equal to, the values of<br />
629
the accessory COZ. But most springs had less offree CO2 than necessary for equilibrium.<br />
Comparison with values of the accessory CO2 for the observed temperatures instead<br />
of 15-18 “C, for which Tillman’s table was made, would somewhat increase the number<br />
of springs with a surplus of free COZ, but such values are not at hand. The water in<br />
most of our springs seemed to be in equilibrium at lower concentrations of free COZ<br />
than the accessory concentrations are.<br />
3.4 Alkalinity and hardness<br />
In springs, alkalinity was always bicarbonate, as is normal with water containing<br />
free COZ. Only in streams from which free CO2 had already escaped, some of bicarbonate<br />
alkalinity had been turned into carbonate.<br />
Total alkalinity of individual springs was less variable than hardness and chloride<br />
content but it varied considerably from one watershed to another and even between<br />
individual springs. It is, as a rule, taken as equal to carbonate hardness; when it is<br />
greater thantotal hardness, the differenceis attributed to bicarbonates ofalkalimetals (I).<br />
Such was the case on 16 points, but on 10 of them only occasionally. The most pronounced<br />
differences in favour of alkali metals were found among the springs on the<br />
island of Krk and in the basin of Plomin (points 115-117, 119), in rainy months. The<br />
third region with such results was the marsh of Hutovo (points 168, 169 and 173). All<br />
of these regions are either agricultural or marshy.<br />
Total hardness varied considerably throughout the region. In non-saline springs<br />
it varied between 104 and 878 mg/l, but in the great majority only between 104 and<br />
270 mgil.<br />
The softest water was found: in the springs of the UEka mountain, about 950 m<br />
above sea-level, and in the springs of the river NovEica, about 600 m above sea-level, in<br />
points 112-1 14 and 9-1 1, with 104-144 mg/l; further in the river Lika above its sinkholes,<br />
in point 34, about 480 m above sea-level, with 144-176 mg/l, in the springs at Bili Vir,<br />
points 185-186, at 0.5 m above sea-level with 168-170 mg/l, around Rijeka with 115-<br />
183 mg/l, and in the Cetina river and the springs along it, at 20-385 m above sea-level,<br />
with 120-212 mg/l.<br />
The hardest water was found mainly at low altitudes, as on the island of Krk, with<br />
172-457 mg/l, in springs on the left side of the Trebiiat river, 40-80 m above sea-level,<br />
with 220-399 mg/l, in the Trebiiat itself, point 163, with 256-448 mg/l, in the springs on<br />
the left side of the Tihaljina river, at 120-170 m above sea-level, with 430-878 mg/l, in<br />
springs on the right side of the lower Neretva river, at 1 m above sea-level, with 396-<br />
430 mg/l, and, of course, in saline coastal springs.<br />
Carbonate hardness varied between 100 and 310 mg/l, with the exception of brackish<br />
springs. J. Zötl (24) found in Austrian north-eastern Alps values between 100 and 180<br />
mg/l at altitudes of 1,000 m or more, 140-230 mg/l between 400 and 900 m, lower values<br />
being obtained at higher altitudes. At the same altitudes, similar values were obtained<br />
in our region also, sometimes even lower, except in the drainage basin of the river<br />
Gacka, in the “polje” of Krbava and in the lake region of Plitvice. The highest values<br />
were found in flat grounds near the coast in Istria, on the islands and in Northern Dalmatia.<br />
Non-carbonate hardness varied between zero and 688 mg/l. Points and regions with<br />
values of 33 mg/l or less were: all springs of the Lika and Gacka rivers and around the<br />
Plitvice lakes, all springs of the river Kupa, Dobra and MreZnica, and these rivers themselves,<br />
all springs around Rijeka, on the UCka, at Plomin, Raga and Sv. Stjepan (points<br />
83-88, 112-117, 119-122), springs at Sibenik, Split and OmiX (points 126, 131-133, 135),<br />
along the Cetina river and in that river, in the rivers Bregava, TrebiSnjica and Neretva,<br />
and in the springs in the Hutovo marsh; also around Sarajevo (points 168-179,192-197).<br />
High non-carbonate hardness was found in the springs along the lower Neretva<br />
(points 181-184) with 221-245 mg/l, in those left to the TrebiZat, with 10-239 mg/l, in<br />
630
that river itself with 66-318 mg/l, and in the springs on the left side of the Tihaljina river<br />
with 240-688 mg/l. Since all these points showed low concentrations of chloride, between<br />
4, 5 and 30 mg/l, non-carbonate hardness in their water represents mainly sulphate.<br />
Magnesium hardness of 20 mg/l or less was found in a number of springs of the<br />
Lika. In the springs around Rijeka and on Krk only occasional values were 20 or less,<br />
but in the basin of Plomin, in the “polje” of Imotski and on the spring of the Tihaljina<br />
river there were occasional values of over 20 mg/l only. All springs around Sarajevo,<br />
except the main spring of the Bosna river, had less than 20 mg/l, and also the great<br />
springs Gaja, Sv. Stjepan and Torak (points 120, 122, 126).<br />
On the other hand, concentrations higher than 100 mg/l were found in the springs<br />
at Plitvice, with 100-140 mg/l, and in those left to the Tihaljina river with 3 values between<br />
70 and 85, and 7 values between 117 and i90 mg/l.<br />
Since pure dolomite contains equal parts of calcium and magnesium carbonate and,<br />
if both are expressed as CaC03, also equal weights, magnesium hardness cannot be<br />
higher than 50% of total hardness in waters which have been in contact with dolomite<br />
alone; it is less than 252, if water has been in contact with limestone only. The ratio<br />
of magnesium hardness to total hardness indicates, therefore, whether water issues<br />
from limestone or dolomite or both. In the opinion of P. Fourmarier (19) the ratio is<br />
between zero and 7.5% for pure limestone, between 7.5 and 12.5 for magnesitic limestone,<br />
between 12.5 and 25.0% for dolomitic limestone, and between 25 and 50% for<br />
dolomite; pure dolomite wil be denoted by the ratio between 42.5 and 50%.<br />
Among our points, there were some, which showed less than 7.5 of magnesium hardness<br />
in all examinations, issuing, therefore, from pure limestone. Such were 12 springs,<br />
8 of which were in that part of the Velebit which does not contain dolomite of the palae-<br />
ozoic 0, the remaining four being the springs Torak (point 126) and Gaja (point 120)<br />
both emerging from upper-cretaceous limestones (33), and two springs at Sarajevo.<br />
A much greater number of springs disclosed magnesitic or dolomitic limestone in<br />
Fourmarier’s sense as the original environment of their water. Among these are the<br />
rivers lika and Gacka, and the majority of their springs, also the springs on the island of<br />
Krk and in the region of Plomin, which all drain plains surrounded by cretaceous limestones<br />
(30,31,32,33J, further the springs in the “polje” of Imotski, in the valley of the<br />
Neretva, those around Rijeka, where upper-cretaceous limestone and dolomite as also<br />
eocenic limestone was recognized (Z8) and on the UEka, which forms a block of uppercretaceous<br />
limestone which had come to lie over impervious eocenic rocks (29); also the<br />
main spring of the Kupa (point 74) and most springs along the Tihaljina and TrebiZat<br />
rivers.<br />
In pure dolomite originate waters of most of the springs in the lake region of Piitvice<br />
and the main springs of the rivers Cabranka and Dobra (points 58 and 73). The<br />
firstregionis about 600m, abovesea-level, partlq built oflower andupper-triassicdolomite<br />
which makes an impermeable barrier and covered by lower-jurassic limestone which<br />
is waterless (l0,l19l2). The Cabranka seems to emerge from triassic dolomite (27,28j,<br />
and the Dobra appears in upper carbon, passes through middle and upper jurassic<br />
strata and drains water from the dolomites in the Velika Kapela mountain, goes underground<br />
at Ogulin, emerges again after 4.5 km of underground flow and enters yper<br />
cretaceous strata (25,26927).<br />
From less pure dolomite, between 25 and 42.5% of Mg-hardness, or mainly from<br />
dolomite and less from limestone, derive their waters from other springs around Plitvice<br />
(points 46,5@, 52) and of the rivers Kupa, Dobra and MreZnica (points 76-81, 60-<br />
65, 67-68, 70). For that reason these rivers retain, as far as Karlovac, their character of<br />
dolomitic waters. The springs of the Zagorska Mreinica lie at the foot of Velika Kapela<br />
and receive water from its dolomites (25j.<br />
In all of the remaining points the results were variable-one examination indicated<br />
dolomite, another magnesitic or dolomitic limestone, in accordance with the composite<br />
63 1
character of their drainage areas (s,zs,35,36,37,38,39). In these cases it seems probable<br />
that their drainage areas consisted in one part of limestone and in another of dolomite;<br />
the resulting character of water would depend upon which part received more water<br />
from rains. Another possibility would be that the rocks, through the fissures of which<br />
the water flowed, were divided in vertical sense in a dolomitic and a limestone part; in<br />
this case the upper part would contribute water in very rainy periods only. A third pos-<br />
sibility would from various combinations of these two cases.<br />
3.4 Chloride<br />
In 137 of our 200 points, all examinations showed the chloride content to be 10 mg/l<br />
or less; in most cases it was below 5 mg/l. In a very general way, the chloride-content<br />
was inversely proportional to the altitude of the drainage area. In springs on or near<br />
the coast, it was usually permanently higher. Thus, our points in the bay of Plomin<br />
(points 115-1 19) showed in all of the 69 examinations, extended over two years, sali-<br />
nities between 12 and 33 mg/l. Similar results were obtained in the springs along the<br />
lower Cetina (points 147-149), namely 14-38 mg/l. On the inland points of the islands<br />
of Krk and Rab 25 examinations gave 15.5-335 mg/l, the majority of the results being<br />
on the higher side. Such salinities have to be ascribed to sea spray carried inland by<br />
winds, as was shown at another occasion, (40,41).<br />
In some cases, high salinity was found quite far from the sea, as in two springs of<br />
the Cetina, on points 137 and 138, at an elevation of some 360 m with 358 and 281 mg/l,<br />
on one occasion only, at low flow. In the coastal belt, high salinities are quite common,<br />
and need not appear only in springs on the coast itself. Thus, a spring on the basin<br />
CrniSevo, of the Bacina lakes, point 191, about 1.5 km inland, showed fluctuations<br />
between 4,450 and 6,75Omg/C1/1 ; a saline spring at Prud, point 180, showed 415 mg/l<br />
at a distance of about 7 k m from the sea, and one at Luke, point 187, displayed 1,840<br />
mg/l, about 4 k m from the sea. The last two springs could, however, receive infiltration<br />
of sea water from the river Neretva, into the bed of which, at high tides, sea water enters<br />
as far upstream as Metkovic, sweet water of the river flowing over it into the sea.<br />
A special category constitutes springs which receive less or greater inflow directly<br />
from the sea. Various aspects of the mechanism of such intrusion were clarified by<br />
K. GjuraSin (“0) and 1. KuSEer CAI). Their salinity depends upon the structure of the<br />
spring, its discharge, and the tides; since the last two factors are variable, the salinity<br />
is also variable. Examples of such springs are Zrnovnica, Jaz and a saline spring at<br />
Plomin (points 95, 102 and 119 A). The first one is usually sweet, with as little as 3.5<br />
mg/l, but showed in dry weather as much as 2,770 mg/l. The second oscillated between<br />
310 and 4,320, and the third between 73 and 3,230 mg/l.<br />
3.5 Other characteristics<br />
Some information on other characteristics of waters can be best obtained from the<br />
examination of the four rivers of our region which flow toward Karlovac, viz. Kupa,<br />
Korana, Dobra and Mreinica. There, they showed in a total of 11 examinations, variations<br />
of turbidity between 0.2 and 22 mg/l,of total iron, 0.03-0.36 mg Fe/l, of sulphate<br />
2.0-3.0 mg SO4/1, of phosphate 0.00-0.18 mg Pod/], of silicate 0.4-10.3 mg SiOa/l, of<br />
the total residue on evaporation in unfiltered water 174-260 mg/l, in filtered water<br />
167-756 mg/l, in oxygen consumption from KMn04 in 30’ 0.3-3.5 mg Ozil, of albuminoid<br />
ammonia 0.04-0.29 mgN/1, of free ammonia 0.01-0.07 mg N/1, of nitrite 0.000-<br />
0.004 mg N/1, of nitrate 0.07-0.45 mg N/1, of total organic nitrogen 0.23-0.48 mg /i, of<br />
total organic carbon 5.8-53.8 mg Cil, and of BOD5 0.2-1,.1 mg O2/1. As evident, there<br />
is little organic matter in these waters, and dissolved mineral matter is well represented<br />
by total hardness.<br />
632
4. DISCUSSION<br />
Our analytic material seems to permit some generai statements.<br />
Individual springs vary from season to season and from year to year within limits<br />
which may be relatively narrow in cases of great and constant springs, homogeneous<br />
drainage areas from the mineralogic point of view, and restricted inflow of water in<br />
the last phase of subterrapean flow, but quite wide in opposite conditions. The greater<br />
rivers show, however, a steadier character.<br />
Several springs, geographically close to each other, may show significant differences<br />
in the quantity and structure of their mineral content. Thus, for example, three springs<br />
of the creek PoCiteijnica (points 5-7) showed on the same day hardness between 160<br />
and 192 mg/l, non carbonate hardness between 1 and 17 mg/l, magnesium hardness<br />
between 28 and 76 mg/l, and the percentage of M g hardness between 17.5 and 39.6%.<br />
Likewise, three springs of the creek BruSanka (points 9-1 I) showed at the same day<br />
hardness between 104 and 144 mg/l. Such quantitative differences in the mineral con-<br />
tents among springs in the same limestone region are quite common. V. Maurin and<br />
J. Zötl (z2y 23) observed in the Greek islands of Kephalonia and Amorgos in groups of<br />
springs or wells great differences, as, for example, in springs at Kutavos, where total<br />
hardness varied between 358 and 573 mg/l, in wells at Chara, where it varied between<br />
251 and 537 mg/l, or at Aigitai, from 286 to 627 mg/l.<br />
There are still greater differences between various regions. In a very general way,<br />
springs at higher elevations show the least mineral content, as shown by those on the<br />
UEka mountain, on the mountains around Sarajevo, of the rivers Dobra and the upper<br />
Cetina, and those around Rijeka which drain the highlands of the hinterland.<br />
The highest values for total hardness appeared on flat grounds near the coast, as<br />
on the island of Krk and in thevalley of the lower Neretva. Exceptionally high values<br />
showed in the springs on the left side of the Tihaljina and ïrebiZat rivers, up to 878<br />
mg/l, with salinities below 9 mg/l. Both Krk and lower Neretva show marshy regions<br />
and agricultural utilization of the soil, as does the drainage area of Plomin, in the plain<br />
of CepiC, which also yields water of a relatively high hardness. High hardness along<br />
Tihaljina and Trebiiat, however, seem to be caused by some gypsum deposits, which<br />
have not yet been discovered.<br />
Qualitative differences in the minerai content also appear between individual springs<br />
as between groups of springs. Some show water derived from limestone deposits and<br />
others, less numerous, from dolomitic rocks; the latter are prevalent in the northern<br />
part of our region.<br />
In carbonate rocks of the north-eastern Alps, J. Zötl (24) found the least concentra-<br />
tions of dissolved minerai matter in springs from limestone rocks, higher concentra-<br />
tions in those from dolomite, and highest in springs issuing from unconsolidated clastic<br />
and alluvial material at the foot of mountains. In our regions, springs in carbonate rocks<br />
disclose similar differences. Hardness from 23 points in limestone showed values be-<br />
tween 104 and 192 mg/l; from 20 points in dolomite, waters had a hardness between<br />
170 and 29 1 mg/l. Twelve points in unconsolidated rubble displayed a hardness between<br />
179 and 430 mg/l. The rest of our points show at times water from limestone and at<br />
other times from dolomite, or do not conform to the rule, or by lack of sufficient data.<br />
The rivers Dobra and Kupa with their springs, which drain dolomitic rocks, never-<br />
theless show comparatively low total hardness and deviate from other dolomitic waters.<br />
The greatest part of our points show a non-carbopate hardness less than 35 mg/l;<br />
that shows that our region consists preponderantly of carbonate rocks. Sulphates are<br />
present only on the continental side of the rivers Tihaljina and Trebiiat, in the Herce-<br />
govina.<br />
If the rivers of our region are examined, it wil be found that their hardness, in 40<br />
examinations, varied between 144 and 216 mg/l, with the rivers Gacka and Trebiiat as<br />
63 3
the only exceptions, but Trebiiat may be left out of consideration, on behalî of its<br />
exceptional springs. In comparison, the river Sava above Zagreb showed in ten exami-<br />
nations a total hardness between 164 and 250 mg/l. Jts hardness was, therefore, some-<br />
what higher than in all rivers of our region except one. Similarly, examinations of<br />
underground waters from alluvial layers along the rivers Sava and Drava, carried out<br />
at Zagreb, Boeanska GradiSka, Bosanski Brod, VarGdin, and Durdevac, disclosed<br />
their hardness to range between 222 and 449 mg/I, which is fully above the hardness<br />
in our entire region except the island of Krk and, as already stated, Trebiiat and left<br />
springs of Tihaljina and Trebiiat. As it is often claimed that waters in limestone regio-is<br />
possess a higher hardness than those in alluvial water-bearing strata, it can be stated<br />
that such opinions do not agree with the facts observed in the limestone region of<br />
Croatia.<br />
REFERENCES<br />
(l) Standard Methods for the Examination of Water, Sewage and Industrial Wastes.<br />
1955, New York.<br />
(2) International Standards for Drinking Water, WHO, 1963, Geneva.<br />
(9 SCHMASSMANN, H., 1956, Schweiz. Zrschr. Hydrol, 10, Basel<br />
(4) SALOPEK, M., 1948, Prirod. istrai., JAZU 24, Zagreb.<br />
(5) SALOPEK, M., 1960, Prirod. istruf., JAZU 29, Zagreb.<br />
(6) SALOPEK, M., 1961, Prirod. istrai., JAZU 31, Zagreb (l).<br />
(7) SALOPEK, M., 1961, Prirod. istrai., JAZU 31, Zagreb (2).<br />
HERAK, M., 1960, Geologija, Zagreb.<br />
(9) HERAK, M., 1953, Geol. ves., 5-7, Zagreb.<br />
(lo) POLSAK, A., 1959, Ljetopis, JAZU 63, Zagreb.<br />
(11) POL~AK, A., 1964, KrS Jugosí., 4, Zagreb.<br />
(12) POLSAK, A., 1960, Ljetopis, JAZU 64, Zagreb.<br />
(9 POLJAK, J., 1958, Geol. ves., li, Zagreb.<br />
(14) POLJAK, J., 1951, Geogr. Glas., 13, Zagreb.<br />
(I5) ROGLIC, J. and BAuCI~, J., 1959, Geogr. Glas.. 20, Zagreb.<br />
(16) HERAK, M., 1958, Geol. ves., 12, Zagreb.<br />
(17) HERAK, M., 1956, Geol. ves., 8-9, Zagreb.<br />
(18) BÖGLI, A., 1964, Steir. Beitr. Hydrogeol., Graz.<br />
(I9) FOURMARIER, P., 1950, Principes de géologie, Paris.<br />
(20) GJURASIN, K., 1943, Techiz. Vies., 60, Zagreb.<br />
(21) KuS~ER, J., 1950, Razpraue, 1 SAZU, Ljubljana.<br />
(22) MAURIN, V. and ZÖTL, J., 1960, Steir. Beitr. Hydrogeol., Graz.<br />
(23) The same, 1964, The same, Graz.<br />
(24/ ZOTL, J., 1961, Steir. Beitr. Hydrogeol., Graz.<br />
(25) POLJAK, J., 1926, Gorjanoviéeeoa spomenicn, Zagreb.<br />
(26) MALEZ, M., 1956, Geol. fies., 8-9, Zagreb.<br />
(27) MALEZ, M., 1957, Geol. Vies., 10, Zagreb.<br />
(28) SALOPEK, M., 1956, Prirod. istruf., JAZIJ 27, Zagreb.<br />
(29) SALOPEK, M., 1954, Prirod. istraf., JAZU 26, Zagreb.<br />
(30) SIKIF, D., 1960, Report, Zagreb.<br />
P1) SIKIF, D. and TOMIC, A., 1960, Ceol. ves., 14, Zagreb.<br />
(32) ROGLIC, J., 1950, Geogr. Clas., 11-12, Zagreb.<br />
(33) SALOPEK, M., 1956, Prirod. istrai., JAZU, Zagreb.<br />
(34) CRNOLATAC, I., 1963, Report, Zagreb.<br />
(35) " Elektroprojekt ", 1961, Report, Zagreb.<br />
(9 MALEZ, M., 1958, Geol. ves., 11, Zagreb.<br />
(37) ROGLIC, J., 1938, Imotsko polje, Beograd.<br />
(9 SIKIC, D., 1956, Geol. ves., 8-9, Zagreb.<br />
(39) Geologic map of the lower Neretva after I. Crnolatac, D. Ani6 and D. Sikit ~<br />
Zagreb.<br />
(40) PETRIK, M., 1957, KrS Jirgosl., 1, Zagreb.<br />
1960, KrS Jugosl., 2, Zagreb.<br />
(41) PETRIK, M.,<br />
634
SUMMARY<br />
HYDROCHEMICAL CHARACTERISTICS OF<br />
GROUND WATERS IN SARMATIAN AND<br />
MEDITERRANEAN-II LIMESTONES IN<br />
THE VICINITY OF BELGRADE<br />
N. MILOJEVIC, B. FILJPOVIe, and N. DIMITRIJEVIC<br />
Faculty of Mining and Geology, Belgrade<br />
In this paper, the dependance of the hydrochemical characteristics of the ground<br />
waters on the geology of the particular area and on the other factors is discussed. The<br />
origin of the particular types of ground waters is also presented.<br />
Using as the objects of investigation localities around Beograd: Obrenovatka Banja,<br />
OvCa and some others localities, the parallel in hydrothermal characteristics of the<br />
ground waters of these areas is presented together with the factors which may influence<br />
the observed difference between these waters. Starting with the facts that the above<br />
mentioned localities are situated within the same phisical-geographic, litological and<br />
some others environments, and are also situated within different structural-geological<br />
and hydrological environements, the authors are giving basic factors influencing the<br />
formation of the hydrochemical characteristics of ground waters in these area.<br />
The work is illustrated with profiles and diagrams showing basic hydrochemical<br />
characteristics of these waters and the classification of ground waters is also presented.<br />
RESUME<br />
Caractéristiques hydrochimiqiies des eaux souterraines des calcaires du Sarmatien et du<br />
Méditerranéen-Il arrx environs de Belgrade<br />
Cet article étudie dans quelle mesure les caractères hydrochimiques des eaux souter-<br />
raines dépendent de la géologie locale et d’autres facteurs. TI traite aussi de l’origine<br />
des différents types d’eau.<br />
Les auteurs ont fait porter leurs recherches sur des localités des environs de Bel-<br />
grade : ObrenovaEka Banja, OvEa, etc. Ils décrivent les caractéristiques hydro-ther-<br />
miques parallèles des eaux souterraines de ces régions, ainsi que les facteurs qui peuvent<br />
influer sur les différences observées entre ces eaux. Considérant que les localités men-<br />
tionnées ci-dessus appartiennent au même ensemble du point de vue de la géographie<br />
physique et de la iithologie, mais qu’elles diffèrent du point de vue de la géologie struc-<br />
turale et de l’hydrologie, ils exposent les facteurs essentiels qui influent sur la formation<br />
des caracteristiques hydrochimiques des eaux souterraines de ces régions.<br />
Des profils et des diagrammes montrant les caractéristiques hydrochimiques fon-<br />
damentales de ces eaux illustrent cet article qui présente en outre un classement des<br />
eaux étudiées.<br />
INTRODUCTION<br />
Because Sarmatian and Mediterranean-IT limestones in the vicinity of Belgrade<br />
have special hydrogeological characteristics when compared with other Tertiary sedi-<br />
ments, our purpose is to describe the essential chemical charateristics of their ground<br />
waters. In our study of some localities in which they occur (Obrenovatka Banja, OvEa,<br />
Rimski Bunar (Roman well at Kalemegdan fortress, Belgrade), Bele Vode, Kne2evac<br />
limestone quarries, Rakovica) we shall try to explain briefly the relationship between<br />
the chemical composition of ground waters and specific conditions i.e. geological strata<br />
in which they occur, giving at the same time essential reasons for differences in the<br />
chemical composition of water in the localities cited.<br />
635
GEOLOGICAL AND LITHOLOGICAL CHARACTERISTICS<br />
Mediterranean-II and Sarmatian sediments are widely distributed in the broad vicin-<br />
ity of Belgrade. Limestone of Mediterranean-II and Sarmatian age are a conspicuous<br />
lithological member and are invariably present in these sediments.<br />
Fig. 1 -A geological sketch map: (1) ObrenovaEka Banja spa; (4) Ovfa; (5) Rimski<br />
Bunar; (7) Bele Vode; (8) Rakovica; (9) SremEica.<br />
I. Mesozoic; II. Tertiary; III Quarternary.<br />
Mediterranean-II limestones are developed in the Belgrade area (TaSmajdan, Kale-<br />
magdan:, on Torlak, ViSnjica, etc. These are mainly reef (TaSmajdan, Torlak) and less<br />
frequently bedded limestones (Kalemegdan) which mostly crop out or are covered by<br />
younger sediments. These limestones are mainly built up of algae, corals, bryozoans,<br />
cerithiums (ViSnjica), etc,<br />
Their distribution is limited. Because of their reef character their thickness is small<br />
(about 50 m) so that this makes them readily noticeable and recognizable in the geolog-<br />
ical structure of these parts of the terrain.<br />
Sarmatian limestones have by far the most extensive distribution. Their prevalently<br />
reef character makes them conspicuous and readily noticeable among other lithological<br />
members of the Tertiary in the vicinity of Belgrade.<br />
These limestones occur in the form of elongated zones of an almost N-S strike.<br />
Several narrow zones which undoubtedly represented an integral whole are now exposed<br />
locally. They also crop out on the surface, viz. along the margin of Makis through<br />
Aarkovo to Zeleznik and further southwest, and, from Rakovica to Kijevo along the<br />
left hank of the TopEiderska Reka, in the valley of the Reka (Sremfica:, at several points<br />
between the TopEiderska Reka and VrEinska Reka (south of Vrfin, etc). Sarmatian<br />
limestones were established by boring in the southern parts of the Pannonian basin<br />
(Obrenovac, Ovfa, etc.) They are mostly built up of clams and snails (cerithium limes-<br />
tone, ostrea banks, serpula limestones) less often of bryozoans and algae and are mostly<br />
of a reef character, often banked or bedded. The limestones are frequently marly, sandy,<br />
636
or brecciated so that their present appearance definitely proves that they were formed<br />
in a shallow-water environment. They are of a gray to yellowish colour due to the pres-<br />
ence of iron, and their thickness does not exceed 60 meters.<br />
Fig. 2 - A hydrogeological section from Rakovica to Kne2evac limestone quarries:<br />
(1) Sandstones and marls; (2) basal conglomerate of the Mediterranean JI;<br />
3) clayey sands; (4) bluish coal-bearing clay; (5) yellowish marls of Sarmatian age;<br />
6) karstified limestones of Sarmatian age; (7) diluvial clays; (8) alluvial deposit;<br />
(9) groundwater table.<br />
The limestones transgresively overlie Cretaceous or Mediterranean-Il sediments and<br />
are mostly exposed or overlain by younger sediments generally of Pannonian age. These<br />
limestones belong to the Lower Sarmatian.<br />
By their geological, lithological, and especially hydrogeologycal characteristics<br />
these limestones break the monotonous distribution of Tertiary sediments of the vicin-<br />
ity of Belgrade. Their geomorphological and hydrogeological features impart a special<br />
character to this part of the terrain.<br />
HYDROGEOLOGICAL<br />
PROPERTIES OF LIMESTONES<br />
These limestones are characterized by the process of karstification in which they<br />
were involved as a whole (merokarst, CvijiC, J., 1926). Because of their small thickness<br />
this process involved even their lowermost parts (SremEica). Sinkholes, small uvalas,<br />
karstified dolines, small caves, karstic springs, etc occur frequently.<br />
As can be seen îrom figure 3 they are distinguished by secondary porosity with a<br />
pronounced karstic porosity of the cavernous type. In addition to large and small<br />
cavities of highly irregular form, broadened fissures and cracks in the form of irregular<br />
channels often occur. Their upper ?arts are often filled with uncemented material.<br />
In these limestones a karstic groundwater body has been formed.* it is of limited<br />
extent because of the reef character of limestones and their small distribution. This is<br />
a permanent and no doubt a true karstic groundwater body with all its characteristics.<br />
The amount of karstic waters can be judged from the occurrnce of perennial springs.<br />
They are rather numerous although their discharge is not high (0.1-0.5, less often over<br />
* According to M.T. Lukovii: (1946), this primarily refers to the groundwater body<br />
in Sarmatian limestones while Mediterranean-II limestones bear no water.<br />
631
3 lisec). The groundwater table is found at a considerable depth in lower parts of the<br />
terrain, often at a depth of 20-30 m below the surface. The groundwater table is free<br />
in those parts where the limestones are exposed on the surface (above the base level of<br />
erosion), or is under pressure when they lie deep under the base level of erosion and<br />
under younger sediments (ObrenovaEka Banja, OvEa, etc).<br />
Fig. 3 - Karstified Sarmatian limestones, Rakovica.<br />
The karstic groundwater body is recharged in a comparatively simple way. There<br />
is no doubt that the groundwater body is mostly recharged through precipitation (the<br />
mean oî average annual rainfall is about 625 mm), to a smaller extent through waters<br />
of other groundwater bodies or through surface waters.<br />
Ground waters issue in two ways: naturally through perennial springs of the gravity<br />
type, and artificially through wells in which water issues at a positive artesian pressure<br />
(ObrenovaEka Banja, OvEa). Subsurface flow of these waters into alluvial drifts is not<br />
uncommon (the margin of Makis).<br />
PHYSICAL AND CHEMICAL PROPERTIES OF GROUND WATERS<br />
These are colourless waters free of odour except for the water of Obrenovatka Banja<br />
in which the presence of H2S is noticeable. They mostly have no taste except the waters<br />
at OvEa which have a salty-bitter taste. It is quite understandable that these waters<br />
have different temperatures. The waters of ObrenovaEka Banja have a temperature of<br />
21-22°C which ranks them as thermal and mineral waters. The temperature of the<br />
water at OvEa approaches temperature of thermal waters (19.3 OC) while the temperatures<br />
of waters in other localities are lower and range between 12 and 14 "C, exceptionally<br />
638
U<br />
3<br />
x<br />
.* +<br />
U<br />
5<br />
a a
6-8 "C (Rimski Bunar). Temperatures are generally somewhat higher than the average<br />
annual air temperatures (I 1.5"). There are slight seasonal fluctuations in the course of<br />
the year.<br />
These waters also differ in total hardness. The hardness of water at ObrenovaEka<br />
Banja is 7-8" dH, at OvEa 29.54" d H and 42.75" dH, at Rakovica 6.7"2 dH, at Srem-<br />
Cica 11.20" dH, at Bele Vode 10.36" dH and 18.92" dH. It can be seen that these are<br />
mostly moderately hard waters, sometimes very hard, and rarely soft. The pH value of<br />
these waters is about 7.<br />
Dry residue in the waters of Obrenovatka Banja amounts to 1.1 g/i, in those at<br />
OvEa 16.3 g/l while in other localities the total mineral content is 1 gil, and mostly about<br />
0.5 gil.<br />
The mineral composition is given in table 1.<br />
To give a clearer idea of the relation between mineral constituents required for the<br />
study of conditions of their formation their composition will be first given in Kurlov's<br />
formula:<br />
1. Obrenovatka Banja :<br />
4. OvEa:<br />
5. Rimski bunar :<br />
8. Rakovica :<br />
M1,05H2S0.006CN~.06<br />
M0.59<br />
HCO397.o<br />
Na+K85.5Mg8.8Ca5.6<br />
HC0~l.0S0~8.Z~~10.8 t, o c<br />
Na+ KT 2.3'giZ.3<br />
t13.8 Oc<br />
fz2 "C<br />
Classification of these waters according to the cation and anion contents can be seen<br />
from the diagram (fig. 4).<br />
Fig. 4 - Diagrams for graphical presentation of cations and anions in ground waters:<br />
1. ObrenCyaCka Banja; (4) OvEa; (5) Rimski Bunar; (7) Bele Vode; (8) Rakovica;<br />
(9) Sremcica.<br />
640
As can be seen from the diagram, according to the cation content they belong to the<br />
group of sodium waters, while in respect to the anion content some differences exist.<br />
In addition to pronouncedly hydrocarbonate waters there are also some chloride<br />
waters (Ovca).<br />
After Sulin’s classification these waters can be classified into the following genetic<br />
types: the hydrocarbonate-sodium type (Obrenovacka Banja, Rimski Bunar, Sremtica,<br />
Rakovica, Bele Vode) and the chlorine-magnesium type (Ovra).<br />
To make the relation between mineral constituents clearer the chemical composi-<br />
tion of ground waters wil be represented in Roger’s diagram. The diagram indicates<br />
the essential characteristics of these waters according to Palmer’s classification.<br />
I 4<br />
Fig. 5 - Roger’s diagram of the cation and anion contents of ground waters: (1)<br />
Obrenovarka Banja, (4) OvTa; (5) Rimski Bunar; (8) Rakovica.<br />
Considerable differences in the chemical composition of ground waters evidently<br />
exist and they wil be discussed later on.<br />
CONDITIONS AFFECTING THE CHEMICAL COMPOSITION OF GROUND WATERS<br />
The existing differences in the chemical composition are undoubtedly due to the<br />
differences in the conditions under which the waters occur. The main factors, or rather<br />
groups of factors affecting the chemical composition of groupd waters wil be dealt<br />
with first.<br />
It should be pointed out that the localities studied occur under the same physico-<br />
geographical conditions and belong to the same stratigraphic units of given lithological<br />
composition. On the other hand it should be emphasized that there exists essential dif-<br />
ferences in structural-geological and hydrogeological conditions. and their analysis<br />
wil lead us to reliable conclusions.<br />
From the point of view of structural geology two strikingly different environments<br />
can be distinguished. In one of them the karstic groundwater body forms in an open<br />
64 1
geological structure above the local base level of erosion with a free groundwater table<br />
and in this the degree of hydrogeological exposure* of the groundwater body is great.<br />
With other conditions more or less favourable, infiltration in this case is unlimited, i.e.<br />
direct infiltration is possible down to the groundwater table over the entire extent of<br />
the groundwater body of this type (Rakovica, Bele Vode, SremEica, Rimski Bunar).<br />
Under these conditions the groundwater body is directly replenished through precipitation.<br />
The groundwater table is free and movement of ground water in the zone above<br />
the groundwater table is vertical, while in the zone of the groundwater body it is horizontal<br />
towards the lowermost draining channels. Springs are of the gravitational type<br />
(see fig. 2). Movement of ground waters is more intensive here than in other localities,<br />
Under these conditions some mineral constituents, mostly carbonates, are leached<br />
from limestones under the action of water charged with carbonic acid, water and containing<br />
sodium hydrocarbonate is formed as a result. At the same time sulphates and<br />
sodium chloride occur in smaller or larger amounts. According to Sulin, this is one of<br />
the main genetic types formed in a continental environment. In addition to the characteristics<br />
cited waters of this type are distinguished by a comparatively low minerai content,<br />
generally below 1 gil. It should be emphasized that under the conditions considered<br />
there are no essential differences between the chemical composition of Sarmatian and<br />
Mediterranean-II limestones. A somewhat higher minerai content of the water of<br />
Rimski Bunar is a result of the absence of free flow of ground waters. It follows that<br />
this type of water (sodium hydrocarbonate) results from intensive leaching of the<br />
medium through which the water flows.<br />
The localities ObrenovaEka Banja and OvEa differ fundamentally from these. Limestones<br />
lie deep below the local base level of erosion in closed or semi-open geological<br />
structures. The water-bearing horizon is mostly overlain by impervious clay. (fig. 6).<br />
In take areas are at a considerable distance from the point where the water issues on<br />
the surface. Groundwater is under pressure so that artesian springs occur.<br />
It is evident that in these almost closed structures ground waters move slowly or<br />
very slowly from distant intake areas towards the point of discharge. In contradistinction<br />
to the case considered above, here the concentration of chemical constituents<br />
is higher. Under these conditions waters have a higher mineral content, a higher temperature<br />
and a higher content of specific constituents (HzS, I and Br, COZ, CH4, etc.<br />
Structural-geological and hydrogeological conditions are reflected in the specific character<br />
of the chemistry of these waters.<br />
It follows that the explanation of the chemical composition of the water of ObrenovaEka<br />
Banja should be sought in the Sarmatian limestones. The pronounced sodium<br />
hydrocarbonate type of water forms exclusively from the sodium sulphate type (Sulin,<br />
1948) through the transformation of sodium sulphate and its carbonate into bicarbonates<br />
during the calcium hydrocarbonate stage of leaching. The presence of hydrogen<br />
sulphate (HzS) and ammonium ions (NH4ì can be explained by the presence of organic<br />
matter in these waters (of the order of 0.030-0.050 gil).<br />
A low calcium content can also be explained by the cation exchange which greatly<br />
affects the composition of ground waters in sedimentary rocks.<br />
Nevertheless, the chemical composition of the sodium hydrocarbonate type of<br />
waters depends on the original composition of waters subjected to desulphatization,<br />
the intensity of this process, and on the chemical composition of rocks leached. On<br />
the other hand this chemical composition can also be the result of intensive leaching of<br />
the rocks through which ground waters circulate and the influence of ground waters<br />
from other groundwater bodies in the recharge area which have a similar chemical<br />
composition. The organic matter present could also be transported from other recharge<br />
areas.<br />
* V. A. Sulin, 1948, suggested the term “degree of hydrogeological exposure of the<br />
water-bearing horizon”.<br />
642
Ova is another locality occurring under conditions of aggravated circulation of<br />
water. It differs from all others. Its water belongs to the chlorine-magnesium type, the<br />
sodium chlorine group (after Sulin) which indicates that it was formed in marine sedi-<br />
ments. This is borne out by its higher I and Br contents and the fact that this locality<br />
occurs in the area of regional geological structures conditioning the formation of water<br />
of this type. It is striking that sulphates occur in traces as a result of the process of desul-<br />
phatization. The content of magnesium is higher than that of calcium, while the con-<br />
tent of hydrocarbonates is insignificant. Sodium chlorides predominate while mag-<br />
nesium chlorides take the second place with the ratio NaKl = 0.97.<br />
U.<br />
Fig. 6 - (u) Geological section of the well B-3 at Obrenovazka Banja (after S. RadojEii:<br />
and M. JanjiC); (b) Geological section at OvEa: (I) Humus; (2) sandy clay; (3) clayey<br />
sand;(4)coarse- and fine-graínedsand; (5) gravel and sand; (6) Sarmatianiimestone;<br />
(7) clay.<br />
Thus there are several factors influencing the composition of ground waters. First<br />
of all, the conditions discussed above. Next, the transformation of waters of the sodium<br />
sulphate type during their infiltration, movement, and leaching of rocks formed in a<br />
marine environment, which finally leads to the concentration of sodium chloride. The<br />
NaCl content is a result of the “struggle” between the continental and marine regimes.<br />
643
Here the conditions of the marine environment are rather well preserved although there<br />
is a tendency towards the continental regime. The ratio Na/CI = 0.97 approaches 1 i.e.<br />
the balance but is still within limits reflecting the marine environment (0.87-1).<br />
In this case, too, a slowed-down movement of ground waters, more complex struc-<br />
tural-geological relations, and a different lithological composition of rocks with a<br />
higher content of chlorides of sodium and magnesium played a decisive part.<br />
In the survey of groundwater occurrences in Sarmatian and Mediterranean-Il limes-<br />
tones we have pointed to essential factors which under given geological-lithological,<br />
structural-geological, hydrogeological, physico-geographical and other conditions<br />
affect the formation of various types of ground waters of a definite chemical compo-<br />
sition. Besides this, they were classified after several authors and these classifications<br />
presented schematically in the triangular and Roger’s diagrams showing relations<br />
between the basic mineral constituents of ground waters.<br />
Special attention has been given to the factors influencing the formation and changes<br />
of the chemical composition of ground waters under existing conditions based on their<br />
study. The study of the regime of the chemical composition of these groundwater occur-<br />
rences wil be continued.<br />
644
INFLUENCE DE LA STRUCTURE GÉOLOGIQUE<br />
SUR LA COMPOSITION CHIMIQUE DES EAUX<br />
SOUTERRAINES DANS LA ZONE DE POPOV0 POLJE<br />
RESUME<br />
Joca MLADENOVIC<br />
Energoinvest, Sarajevo<br />
Pour pouvoir suivre l’influence du régime des eaux de TrebiSnjica, après la con-<br />
struction du système hydroélectrique, sur ies sources dans la région littorale, des<br />
analyses hydrochimiques des eaux de Trebibnjica furent effectuées au cours des années<br />
1961-62 en divers points, ainsi que sur les nombreuses sources de la région littorale,<br />
à partir de l’embouchure de Neretva jusqu’à Konavlje, sources vers lesquelles les eaux<br />
de Trebihjica sont drainées par voie souterraine.<br />
Des essais géologiques-tectoniques avaient été effectués antérieurement sur la<br />
zone entière, ainsi que de nombreux essais de coloration dans le lit de TrebiSnjica<br />
montrant assez bien le réseau des eaux souterraines et le sens de l’écoulement.<br />
Le bassin versant de Trebilnjica est constitué de calcaires et de dolomies et pour<br />
une petite part de roches marno-sableuses. Les analyses chimiques ont montré la<br />
dépendance étroite entre la composition chimique des eaux souterraines qui sont<br />
drainées vers la région littorale et la structure géologique du terrain qui joue le rôle<br />
de collecteur-conducteur hydrogéologique, surtout pendant la période des basses eaux<br />
En raison du remplissage des canaux souterrains lors des précipitations atmosphériques,<br />
l’augmentation des ions HC03 est relativement petite car l’eau parcourt durant une<br />
courte période le chemin de la source à la mer.<br />
Le groupe des eaux hydrocarbonatées faiblement minéralisées diffkre particulière-<br />
ment des eaux plus enrichies en ions Mg**, qui dépend de l’influence du substratum<br />
essentiellement dolomitique de certaines zones. La composition chimique révèle des<br />
grandes variations en fonction du degré de remplissage des canaux souterrains.<br />
Parmi les sources se trouvant presque au niveau de la mer, on peut distinguer les<br />
groupes des eaux plus minéralisées chlorosulfatées et carbonatées. L’enrichissement<br />
de ces eaux en sulfate et chlorure ne résulte pas de la décomposition du substratum<br />
géologique, mais de la pénétration de l’eau de mer dans la masse continentale rocheuse.<br />
ABSTRACT<br />
Influence of the geological structure on the chemical composition of groundwater in the<br />
Popov0 Polie area.<br />
To be able to trace the influence of the Tresbisnjica water regime, after the construc-<br />
tion of the hydroelectric works, on the springs in the coastal area, chemical analyses<br />
both of the Trebisnjica at several points and of the many springs in the coastal belt,<br />
from the mouth of the Neretva to Konavlje, to which water from the river drains<br />
underground, were carried out in 1961-1962. Analogical and tectonic tests had previ-<br />
ously been carried out throughout the area, while numerous colour tracer tests in the<br />
Trebisnjica bed had given a fairly good idea of the groundwater network and the direc-<br />
tion of flow. The basin of the Trebisnjica consists of limestones and dolomites with a<br />
small amount of marl-sandstone formations and the chemical analyses have shown the<br />
close dependence of the chemical composition of the groundwater draining towards<br />
the coastal area on the geological structure of the terrain serving as the hydrogeological<br />
catchment-conduit, particularly during the low water period. The filling up of the<br />
underground channels during rainy periods makes the increase of HCû3 ions relatively<br />
low as the water’s passage from the source to the sea is brief.<br />
The group of limestone waters of low mineralization differs particularly from that<br />
of the waters to which the influence of the essentially dolomitic sub-stratum of certain<br />
zones has given a heavier dosage of Mg** ions. The chemical composition varies widely<br />
according to the degree to which the underground channels are full up.<br />
Among the springs lying almost at sea level, groups of “carbonated” and of more<br />
highly mineralized chlorosulphated waters can be distinguished. In the latter case the<br />
increase in the sulphate and chloride content is here due not to the decomposition of<br />
the geological sub-stratum but to the penetration of sea water into the mainland rock<br />
mass.<br />
645
INTRODUCTION<br />
C’est par les recherches hydrogéologiques et par l’application des méthodes exactes<br />
qu’il a été déterminé que les eaux de la rivière TrebiSnjica s’infiltrent et s’écoulent par<br />
des gouffres et des voies souterraines et alimentent une série de sources le long de la<br />
région maritime entre Konavlje à l’estuaire de Neretva et au long de Neretva jusqu’à<br />
MetkoviC. La majorité de ces sources représentent les seules possibilités d’approvisionnement<br />
en eau de la population de la région.<br />
Pour pouvoir suivre l’influence du régime modifié des eaux de la rivière TrebiSnjica<br />
après la construction du système des aménagements hydroélectriques sur les dites<br />
sources, on a effectué au cours de 1961/1962 des essais hydrochimiques des eaux<br />
souterraines sur la région en question. Ces essais sont effectués trois fois au cours<br />
d’une année hydrologique en trois périodes différentes soit :<br />
- pendant la période sèche (août-septembre) aux étiages;<br />
- pendant la période humide (févriermars) aux niveaux d’eau supérieurs, et aux<br />
- niveaux d’eau moyens (mai-juin).<br />
L’analyse des eaux souterraines a été faite en 80 sites hydrologiques (sources,<br />
gouffres et estavelles). Pour la clarté de la carte hydrochimiquè disons que sur celle-ci,<br />
on a donné les résultats des caractéristiques principales de certains groupes hydrauliques,<br />
dont sont représentées les valeurs moyennes chimiques des trois périodes hydrologiques.<br />
Sur la base des résultats de ces recherches, il a été rendu possible de voir les types<br />
hydrochimiques des eaux souterraines ainsi que la conformité générale dans la concentration<br />
de certains ions en dépendance avec la formation géologique du terrain<br />
et les propriétés hydrogéologiques des masses rocheuses.<br />
LES RAPPORTS G~TECTONIQUES DU TERRAIN<br />
Dans la région de Popovo polje, la vallée de la rivière TrebiSnjica est formée uniquement<br />
de roches sédimentaires. Stratigraphiquement elles appartiennent au trias<br />
supérieur, jura, au crétacé inférieur et supérieur et à l’éocène.<br />
Des membres stratigraphiques repr&entés, seul le trias supérieur est formé exclusivement<br />
de dolomites. Ces dolomites sont découvertes dans deux zones isolées et clairement<br />
séparées par les unités tectoniques soit : l’une, dans l’étendue du cours moyen de la<br />
rivière TrebiSnjica, connue comme anticlinale dolomitique de Lastva et l’autre, le<br />
long de la zone maritime en tête du charriage du haut karst.<br />
En ordre superposé à travers les dolomites triasiques s’étendent respectivement<br />
dans une et dans l’autre zone, les sédiments jurassiens, des crétacés inférieurs et<br />
supérieurs se présentant en grande partie avec un faciès calcaire, ensuite avec les<br />
intercalations des calcaires marneux et dolomites, mais moins de marnes.<br />
Les sédiments éocènes, comme les nouvelles formations dans le développement<br />
superposé, sont liés avec les sédiments du crétacé supérieur qui sont souvent en rapport<br />
tectonique anormal. Ils sont représentés avec le faciès de calcaires et le faciès du flysch<br />
(marnes, calcaires et grès marneux). Ils sont découverts sur l’étendue entre Popovo<br />
polje et Ljubinje, ensuite dans la zone maritime paractonique, où le charriage a amené<br />
à travers eux, les dolomites supérieures triasiques.<br />
Avec sa position structurale, la série du flysch joue un rôle hydrogéologique im-<br />
portant dans la zone maritime, concernant la naissance d’un plus grand nombre de<br />
sources karstiques.<br />
La distinction principale des formations géologiques représentées de la région<br />
traitée est nettement visible par l’étendue dinarique des couches et structures (NW-SE)<br />
avec tous les éléments caractéristiques de la tectonipue dinarique.<br />
646
Par l’influence des forces radiales et tangentielles, les roches sont disloquées de<br />
différentes manières et amenées aux conditions réciproques anormales le long de la<br />
faille, des failles reversibles et des charriages. De cette manière toute la région en<br />
question est séparée en plusieurs unités tectoniques et celles-ci en petits ou plus grands<br />
blocs. Une telle séparation du terrain représente la prédisposition principale pour la<br />
continuation future du développement évolutif des processus hydrographiques et<br />
hydrogéologiques de cette région karstique.<br />
CARACTBRISTIQUES<br />
HYDROGÉOLOGIQUES DE LA RBGION<br />
La plus grande surface-partie de la région recherchée est formée de roches car-<br />
bonatées, OU les calcaires participent avec 70%, les dolomites avec 20% et les sédiments<br />
marneux clastiques avec 10% d’étendue.<br />
Les mouvements tectoniques intenses qui se sont produits dans cette région se sont<br />
le plus caractérisés sous forme de differentes déformations dans les calcaires, moins<br />
(localement) dans les dolomites, ce qui a permis plus facilement le développement de<br />
la karstification dans ces roches de grande profondeur. Dans les calcaires, tous les types<br />
de formes karstiques sont développés : les tourbillons d’eau, anses, champs karstiques,<br />
ainsi que les ponors avec le réseau réparti des canaux souterrains. Les formes karstiques<br />
se sont manifestées même dans les dolomites mais sous une forme moins intense.<br />
Ces remarques caractérisent les dolomites près de la région maritime parce qu’elles se<br />
trouvent en tête du charriage du haut karst, OU se sont manifestées extraordinairement<br />
les compressions tectoniques. C’est pourquoi, les calcaires en général et les dolomites<br />
endommagés par endroit de cette région, représentent les roches perméables avec<br />
porosité dissolue-fissurée-caverneuse.<br />
Une telle fonction hydroghlogique des masses rocheuses a conditionné les cir-<br />
constances hydrographiques spécifiques dans cette région, où s’est formé au lieu du<br />
réseau orographique, un riche réseau souterrain hydrographique.<br />
La rivière TrebiSnjica est le seul cours d’eau orographique. De sa source àTrebinje<br />
elle se caractérise par un cours permanent, qui est conditionné par le complexe des<br />
dolomites triasiques-monolithes imperméables. Cependant, à l’aval de Trebinje, dans<br />
les roches calcaires le long de son cours se trouve une série de ponors, qui pendant la<br />
période sèche absorbent toute la quantité d’eau, d’alleurs petite. Pendant le semestre<br />
hivernal la TrebiSnjica est très riche en eau. C’est pourquoi, les ponors ne peuvent<br />
absorber toute la quantité d’eau et que Popovo polje, se trouvant sur le cours inférieur<br />
de la rivière TrebiSnjica, est submergé.<br />
Près des gouffres, le long du bord nord-est de Popovo polje se présentent les groupes<br />
des estavelles (IV, VI1 et VIII) qui sont alimentées par les eaux des gouffres W et 1x1<br />
de la région locale karstique se trouvant à leur arrière.<br />
En vue d’expliquer plus clairement l’hydrographie souterraine, on a procédé à<br />
la coloration de certains groupes de gouffres le long du lit de la TrebiSnjica. La colora-<br />
tion de certains groupes de gouffres le long du lit de la TrebiSnjica. La coloration fut<br />
exécutée avec la fluoresceine, ce qui a permis de constater la liaison souterraine avec<br />
les sources de la région maritime et la vallée de la rivière Neretva près de MetkoviC.<br />
Les résultats des colorations de ponors (gouffres) peuvent se résumer ainsi :<br />
Le gouffre ( Trnje» (I) à Mokro polje a été coloré le 25.2.1957 avec 28 kg de<br />
fluoresceine pendant les niveaux d’eau supérieurs. La couleur s’est répandue le ler<br />
mars 1957 sur une distance de 16,2km à la source Duboka Ljuta-Robinzon (3).<br />
Le gouffre ( Geljev Most H (II*) près de Trebinje fut coloré le 16.8.1956 pendant<br />
l’étiage avec 16 kg de fluoresceine. La couleur s’est répendue le 25.8.1956 à une<br />
distance de 16,5 km sur la source Ombla (5*) près de Dubrovnik.<br />
Le gouffre ( Pridvorci H (III*) près de Trebinje était coloré le 29.7. i956 pendant<br />
l‘étiage avec 12 kg de fluoresceine. La couleur s’est répandue le 4.8.1956 à une distance<br />
647
de 14,6 km sur la source Ombla (5*). La deuxième coloration fut effectuée le 28.3.1960<br />
pendant les niveaux d'eau supérieurs avec 60 kg de fluoresceine. La couleur s'est<br />
répandue le 31 .3.1960 sur la source Ombla (5*) et Zavrelje (6*).<br />
Le gouffre a Mlinica)) (VI*) à Popovo polje fut coloré le 25.2.1958 pendant les<br />
niveaux supérieurs d'eau avec 90 kg de fluoresceine. L'eau colorée s'est répandue le<br />
28.2.1958 à une distance de 18 km sure la sourc Ombla (5*).<br />
Le gouffre ( Porvalija ) (X*) à Popovo polje fut coloré le 20.6.1958 aux niveaux<br />
moyens avec 30 kg de fluoresceine. La couleur est apparue le 27.6.1958 à une distance<br />
de 32,5 km aux sources Bistrina (17*) près de Ston. La deuxième coloration fut effectuée<br />
aux niveaux supérieurs d'eau le 23.3.1962 avec 150 kg de fluoresceine. L'eau colorée<br />
est apparue le 25.3.1962 de méme aux sources Bistrina (17*) ainsi que dans une série<br />
de sources ou de résurgences sous le niveau de la mer près de Bani6 (1 3*).<br />
L.e gouffre (< DoljaSnica» (XI*) à Popovo polje fut coloré le ler.4. 1962 pendant<br />
les niveaux moyens avec 92 kg de fluoresceine. La couleur s'est montrée le 3 1 .4.1962<br />
à une distance de 12 km aux sources Svitavskog (30* et 31*) et Deranskog blata (32*)<br />
ainsi qu'aux sources Bistrina (17*).<br />
Le gouffre ~5 Ponikva ) (XII*) à Popovo polje fut coloré le 20.2.62 lors des niveaux<br />
d'eau supérieurs avec 105 kg de fluoresceine. La coloration est apparue à une distance<br />
de 20 km aux sources et dans la vallée de la rivière Neretva (21 - 28*) ainsi qu'aux<br />
sources et résurgences sous le niveau de la mer entre Slano et Ston (14*).<br />
648<br />
*- -signe ' représentant des sites hydrologiques sur la carte
IBROVNI H<br />
On voit du compte rendu ci-dessus que les eaux souterraines; des gouffres aux<br />
sources, parcourent de grandes distances dans un temps relativement court, ce qui<br />
prouve que les canaux souterrains sont assez bien répartis.<br />
En plus de ces sources qui ont une liaison souterraine directe avec la rivière Trebik-<br />
jica, il existe une série de sources le long de la région maritime, qui s'alimentent en eau<br />
des bassins versants locaux de la région. Ce sont les sources dans la région de Konavlje<br />
(i* et 2*), ensuite sur la direction de Dubrovnik à Slano (6 - 13*) ainsi que de plus<br />
petites sources vers la vallée de la Neretva (18 - 21*). Elles se présentent au contact<br />
des roches perméables (dolomites) et des sédiments imperméables du flysch.<br />
Le travail des analyses hydrochimiques consistait à déterminer la liaison éventuelle<br />
de ces eaux avec celles de la TrebiSnjica. Pendant ces essais on s'est efforcé de trouver<br />
comment on pourrait exactement évaluer le danger pour la population de cette région<br />
de se trouver sans eau et jusqu'à quelle mesure la construction du système hydraulique<br />
modifiera la composition chimique des eaux souterraines.<br />
CARACTERISTIQUES CHIMIQUES DES EAUX SOUTERRAINES<br />
A l'aide des analyses chimiques des eaux souterraines, on a constaté que les eaux<br />
de la région traitée se distinguent par la valeur moyenne du résidu sec (minéralisation)<br />
de 291 mg/l. Le rapport des ions représentés d'après le résidu sec de la minéralisation<br />
totale démontre la séparation de certains groupes d'ions (annexe diagramme figure I),<br />
soit :<br />
i<br />
BILLCA<br />
CA A T E G E O H I D R O C H I MIQ U E<br />
L E G E N D E<br />
ALLUVIONS<br />
EOCENE-CALCAIRES NLR.1ULLITIQUE ET FLYSCH<br />
CRETACÉ SUPERIEUR-CALCAIRES<br />
T CRETACE XJPERIEUR-CALCARESff DOLOMIES<br />
LJ CRETACÉ INFERIEUR-CALCAIRES MARNEUX<br />
JURASIQUE-CALCAIRES ET DOLOMIES<br />
a TRIAS SUPERIEUR - DOLOMIES<br />
CHARRIAGE<br />
A FAILLE REVERSIBILE<br />
FAILLE<br />
LES COMMUNICA~IONS SOUTERRAINES DEFINIES<br />
A "?b ; ..IF u ENTONOIR ABSORBANT<br />
SOURCE<br />
ESTAVELLE<br />
96 - eku/l UCoa ion<br />
649
Dans les résidus secs jusqu’à 400 mg/l dominent les ions HC03 et Ca, tandis que<br />
les ions restants ont une importance réduite. Les eaux avec ces valeurs du résidu<br />
sec sont du type bicarbonate de calcium dans lesquelles la combinaison Ca(HC03)z<br />
dépasse 75 % mg/eq./l.<br />
Les eaux souterraines avec minéralisation au-dessus de 400 mg/], présentent une<br />
rapide augmentation du contenu des ions CI et Na, de manière qu’au résidu sec<br />
de 2000-2500 mg/l, le contenu des ions C1 s’élève à 36,4 mg/eq./l et Na à 31,5 mg/<br />
eq./l. Ces eaux sont du type bicarbonate de calcium au chlorine de sodium.<br />
I50 150 300 I50 LOO ,1000<br />
LE RESIDU SEC EN ms/i<br />
FIG. 1<br />
Fig. 1 - Courbes de dépendance de la minéralisation et du contenu d’ion.<br />
Les valeurs movennes et extrêmes du contenu des ions dans les eaux souterraines<br />
de la région étudiée, sont représentées sur le tableau (fig. 2) et le cyclogramme (fig. 3).<br />
Sur le diagramme (fig. 1) se distinguent clairement les concentrations de certains<br />
groupes d’ions en dépendance du résidu sec-minéralisation.<br />
Les eaux des sites hydrologiques analysées dans le région étudiée ne présentent pas<br />
de composition hydrochimique identique, de telle façon qu’elles peuvent se grouper<br />
approximativement en trois régions soit :<br />
1. Région de la vallée de TrebiSnjica (Popovo polje);<br />
2. Région des sources maritimes avec la liaison souterraine directe avec Popovo polje<br />
en direction de Konavlje-Ombla (Dubrovnik);<br />
3. Région des sources maritimes sans la liaison souterraine déterminée (de Ombla à<br />
Neretva).<br />
I. Région dans la vallée de la rivière Tranihjica “Popovo polje).<br />
Les eaux souterraines dans la région de la Trebilnjica (Popovo polje) présentent<br />
exclusivement la composition hydrocarbonate de calcium, où les combinaisons de<br />
HCO3 et Ca sont prépondérantes sur celles des NaCI ou MgSO4. Cette prépondérance<br />
est de 8-9 fois, soit 75-90% eq./l.<br />
6 50
~~<br />
Tableau de la ualeur moyenne et extrême du contenir des ions<br />
Valeurs moyennes<br />
du contenu<br />
des ions minimum maximum<br />
Valeurs extrêmes du contenu des ions<br />
- _____ -<br />
HC03 223,2 3 $6 146,4 2,06 427,3 67<br />
CI 60,54 1,5 3.13 0,09 1291,2 36,4<br />
SOS 12,76 0,18 0,Ol 0,02 166,7 0,46<br />
Ca S9,79 2,7 32,l 2,09 116,14 5,s<br />
~~ ~<br />
~~ ~~<br />
Mg 13,18 191 2,25 0,19 112,6 92<br />
Na+Ka 29,21 1,3 1,53 0,07 723,5 31,5<br />
Résidu 291<br />
sec<br />
137 227 1<br />
Fig. 2<br />
Le résidu sec - de la minéralisation totale dans cette région se présente avec les<br />
plus petites valeurs, le contenu maximum est 195 mg/l, et la valeur moyenne de 167 mg/<br />
1. Le contenu du groupe des ions HC03 et Ca par rapport à la minéralisation jusqu’à<br />
200 mg/!, s’élève dans les limites de 2-3 mg/eq./l. tandis que le contenu des ions Ci,<br />
so4, Mg et Na est au-dessous de 0,G mg/eq./l.<br />
Une telie composition hydrochimique des eaux souterraines est en liaison avec la<br />
plus ou moins grande homogéinité lithologique du terrain formé (en grande partie<br />
des roches sédimentaires carbonatées).<br />
2. Région maritime Konavlje - Dubrovnik<br />
Les eaux souterraines analysées de cette région aux sources des liaisons souterraines<br />
déterminées avec la rivière TrebiSnjica ne présentent pas de différences essentielles dans<br />
la composition chimique. A savoir, la minéralisation de ces eaux dépasse à peine<br />
environ 50 mg/l, tandis que l’augmentation des principaux ions (HC03 et Ca) est<br />
insensible. Bien que les parcours des cours d’eau souterrains soient assez longs, la<br />
minéralisation supérieure ne s’est pas produite, étant donné que les canaux karstiques<br />
sont suffisamment bien répartis. Les eaux souterraines, sans séjourner longtemps,<br />
coulent rapidement avec une assez grande influence mécanique, mais une faible action<br />
de dissolution chimique dans le milieu géologique. Naturellement, la possibilité n’est<br />
pas exclue de l’influence locale chimique intensive dans des eaux souterraines dans les<br />
canaux karstiques. Cependant, puisqu’il s’agit d’enrichissements de Ca(HC03)z<br />
c’est par la dynamique de mouvement dans les conditions déterminées que HCO3<br />
baisse. Ces phénomènes se présentent près des gouffres et des sources. A ceci contribue<br />
le fait que pendant les étiages la minéralisation de l’eau augmente et inversement.<br />
3. Région maritime Ombla - Neretva<br />
Dans la région maritime de la direction de Dubrovnik à la rivière Neretva, les<br />
eaux des sites hydrauliques analysées présentent d’importants écarts dans la compo-<br />
sition chimique.<br />
651
La minéralisation de ces eaux monte à 400 mg/l et exceptionnellement au-dessus<br />
de 1000 mg/l. Les ions C1 et Na dominent tandis que HC03 et Ca, ont des courbes<br />
présentant une tendance à la stagnation (fig. 1). Dans la composition chimique de ces<br />
eaux on trouve le bicarbonate de calcium, le sulfate de magnésium ou le chlorure de<br />
FIG. 3<br />
- . - . -. -. CONTENU MAXIMUM D’ ION<br />
Fig. 3 - Cyclogramme du contenu maximum d’ion pour la région complète.<br />
sodium. Une telle composition chimique des eaux de sources peut ètre en liaison avec<br />
le phénomène des roches dolomitiques et des marnes du flysch. La minéralisation<br />
augmente dans les sources au voisinage direct de la mer et ceci s’explique par l’influence<br />
de l’eau maritime.<br />
652
4. Région du cours inférieur de la rivière Neretva<br />
Dans la région du cours inférieur.de la rivière Neretva se présentent des eaux souter-<br />
raines avec la composition chimique semblable à celle de la région exposée précédem-<br />
ment. La différence est qu’ici il ne s’agit pas de l’influence directe maritime, mais de<br />
la minéralisation produite par les sédiments d’alluvions. Ces sédiments sont très salés<br />
et par leur porosité inter-granulaire, comme les roches imperméables, prédisposent<br />
à la naissance des sources.<br />
La minéralisation de ces eaux se trouve dans les limites de 300 mg/l mais va jusqu’à<br />
dépasser 1000 mg/l. Souvent dominent les ions C1 et Na. On remarquera aussi le rapport<br />
uniforme des ions HC03 et Ca d’après les autres ions, ce qui démontre la salinisation<br />
ultérieure des eaux du type précédent avec bicarbonate de calcium par les combinaisons<br />
NaCl et MgS04.<br />
Les eaux souterraines de cette région se distinguent par la dureté qui va des eaux<br />
très légères aux eaux très dures dépassant 41,7” dH.<br />
Pour la région Popovo polje la dureté d’eau est caractéristique jusqu’à 10” dH.<br />
Dans la région Konavlje - Dubrovnik les eaux souterraines ne sortent pas du cadre<br />
des eaux avec dureté de 13” dH. Alors qu’en direction de Dubrovnik - Neretva -<br />
MetkoviC, les eaux souterraines sont très variables avec une duretémaximum de 41” dH<br />
et présentent les eaux dures et les eaux les plus dures.<br />
Les valeurs du p H des eaux souterraines se trouvent en général dans les limites<br />
des eaux neutres avec la valeur moyenne de 7,4; minimale 3,l et maximale 7,9. Les eaux<br />
dont la valeur du p H est le plus souvent entre 7,O à 7,9, se trouvent dans le rayon de<br />
la région maritime.<br />
CONCLUSION<br />
Du texte exposé ci-dessus on peut conclure ce qui suit :<br />
La formation géologique du terrain dans la région de la rivière Trebisnjica autour<br />
de Popovo polje et à l’arrière des sources le long de l’étendue maritime est constituée<br />
en majorité de roches calcaires et dolomitiques mais moins de roches marneuses et de<br />
flysch.<br />
Les caractéristiques chimiques des eaux souterraines distinguent clairement les<br />
régions du type bicarbonate de calcium des eaux, de celles du type bicarbonate de<br />
calcium mélangé au sulfate de magnésium ou du chlorure de sodium.<br />
Une telle composition chimique est conditionnée par la formation géologique du<br />
terrain et par l’infiuence du milieu maritime.<br />
Les eaux souterraines de la région de Popovo polje ont les caracteristiques chimiques<br />
semblables à celles des eaux souterraines de la région Konavlje - Ombla (Dubrovnik).<br />
La composition chimique des eaux des sources en direction de Ombla à Slano et<br />
de celles qui se trouvent sur les hautes cotes de Slano à Neretva, démontrent qu’il<br />
n’existe aucune liaison souterraine avec TrebiSnjica.<br />
Les sources qui se trouvent à la cote maritime de Slano à Neretva ainsi que celles<br />
le long du cours inférieur de la Neretva avec lesquelles on a établi l’existence d’une<br />
liaison souterraine, sont généralement plus minéralisées que les eaux de la TrebiSnjica<br />
à Popovo polje.<br />
653
AN ISOTOPE SURVEY OF LAKES<br />
IN THE KARST REGION OF SOUTHERN TURKEY<br />
ABSTRACT<br />
Turgut DINCER and Bryan R. PAYNE<br />
International Atomic Energy Agency, Vienna<br />
A survey of stable and radioactive isotopes of hydrogen and oxygen was made in<br />
some lakes located in the karst region of southern Turkey. From the chloride concen-<br />
trations observed it is seen that these shallow lakes behave as well-mixed reservoirs<br />
and it is possible to estimate the turnover time by comparing actual tritium concentra-<br />
tion curves with theoretical curves based on tritium fallout in the region. The turnover<br />
time in turn gives information concerning the losses occurring through sinkholes.<br />
The results so far obtained agree well with the previous knowledge of the hydrology<br />
of the lakes studied.<br />
RESUME<br />
Une étude des concentrations en isotopes des lacs situés dans In région karstique du<br />
sud de la Turquie<br />
On étudie les isotopes stables et radio-actifs de l’hydrogène et l’oxygène contenus<br />
dans divers lacs situés dans la région karstique de la Turquie du sud. Les concentrations<br />
de chlorure observées dans ces lacs peu profonds ont permis de conclure qu’ils pouvaient<br />
être considérés comme des réservoirs bien mélangés. On a pu estimer la période de<br />
renouvellement en comparant les courbes réelles de concentration en tritium avec les<br />
courbes théoriques basées sur les retombées de tritium dans la région. La période de<br />
renouvellement fournit, à son tour, des renseignements sur les pertes à travers la<br />
formation fissurée où les lacs se trouvent placés. Les résultats obtenus jusqu’à présent<br />
confirment les connaissances en hydrologie acquises sur les lacs en question.<br />
INTRODUCTION<br />
During recent years significant amounts of bomb-produced tritium was added to<br />
the atmosphere, which resulted in a spectacular labelling of the precipitation in the<br />
northern hemisphere. Concentrations as high as 6,000 tritium units(*) were observed<br />
in some continental stations such as Vienna, Austria and Ankara, Turkey. The mean<br />
annual concentrations of tritium in precipitation which prevailed in these regions during<br />
the pre-bomb era and which were due to the production of tritium by cosmic rays<br />
did probably not exceed 20 T.U.<br />
Tritium concentration in the precipitation is a cyclic phenomenon, as wil be seen<br />
from figure 1. Concentrations are lower during the winter of the northern hemisphere,<br />
and have well-defined peaks during the late spring or early summer months. It is also<br />
interesting to note that the correlations among different locations are very significant,<br />
a fact which is useful in extending data for stations where the records do not cover a<br />
long period.<br />
The analytical techniques which are used at present allow for the detection of very<br />
low concentrations of tritium in water, thus providing a tool of considerable value<br />
to trace the tritium pulse observed in the precipitation for at least one hundred years.<br />
We are now especially in a favourable position to study the tritium pulse in water<br />
bodies such as lakes where the mixing is important making it therefore possible to<br />
define the tritium puise transferred from the atmosphere.<br />
654<br />
(*) Tritium Unit is 1 T-atom per lo1* H-atoms.
If considerable amounts of tritium are added to a body of water where the tritium<br />
concentration is rather low one can observe a dilution phenomenon, which is a function<br />
of the size of the water body and the amount of tritium added to the reservoir. To be<br />
more precise, the dilution wil be proportional to the ratio of the recharge and the reser-<br />
voir volume. As this latter is easily measured and known, the dilution of the tritium<br />
pulse in the reservoir should give us an idea about the recharge to the reservoir.<br />
This simple approach can be put to use especially in cases where the estimation<br />
of the annual recharge rates by standard techniques is difficult, cases where the reservoir<br />
has no definite outlets, i.e. lakes partly or completely drained by sinkholes, encountered<br />
in karst formations.<br />
DESCRIPTION OF THE LAKES<br />
South-western Turkey is one of the typical well-developed karst regions found in<br />
Mediterranean countries (fig. 2). The Taurus mountain range runs approximately<br />
parallel to the Mediterranean coast, forming a barrier between the coastal plains and<br />
upper Anatolian plateau with an 'elevation of about 900-1100 m A.M.S.L. Several<br />
lakes are formed in the depressions encountered in the Mezezoic limestone which is<br />
the predominant geological formation in the area. These lakes are invariably drained<br />
by sinkholes. Only two lakes, namely lake Egridir and lake Beysehir, have controlled<br />
surface outlets and the water available is used for irrigation and/or power production<br />
purposes. There are also several small lakes which can rightly be called ephemeral,<br />
because they are formed only in the rainy season, i.e. winter and drained completely<br />
at the end of spring.<br />
655
A feature which is common in all these lakes is their relatively shallow depths,<br />
the maximum depth being about 12 meters in the larger ones (lake Egridir). It seems<br />
that under the geologic and climatic conditions where these lakes are formed there is<br />
no possiL3ility for a lake to store water more than 10 meters deep; the development of<br />
the sinkholes which are all located along the shore prevents such a storage.<br />
36" N<br />
The sinkholes draining the lakes are either well defined caverns with arch-like<br />
entrances or systems of fractures where it is difficult to see the movement of the water<br />
but it is possible to hear the sound of the flowing water and see the accumulation<br />
of debris.<br />
In this paper only two lakes wil be considered for study due to the importance of<br />
their size and their economic value: The first one, lake Beysehir is a body of water<br />
656<br />
O<br />
25<br />
I
with a volume which during recent years fluctuated about 4 x lo9 m3 and a surface<br />
area of 700 km2. It is seen that this corresponds to a mean depth of 5.70 m. The<br />
maximum depth being approximately 8.50 m.<br />
There are several tributaries feeding the lake, the most important being a tributary<br />
flowing from the north. There are two others which are mainly fed by large springs<br />
located at the south of the lake. A fourth tributary is flowing from the west, a small<br />
creek which along its course sinks and reappears at several places. Finally, there is<br />
a fifth one flowing from the south-west, a creek which was diverted to the lake to<br />
increase the yield. The tributaries reaching the lake at the west shoreline are not very<br />
important.<br />
The lake has a controlled surface outlet in the town of Beysehir, A canal diverts<br />
the water from the lake to the Konya-Çumra irrigation system, which uses approxi-<br />
mately 300 x lo6 m3 irrigation water per year and is the main artery of the region.<br />
Because of its importance studies were started in 1957 in order to evaluate the water<br />
budget of the lake and eventually to increase the yield of the lake for irrigation and<br />
power production purposes.<br />
Preliminary studies showed that the decrease of the lake level during some summer<br />
months could not be accounted to evaporation losses and the irrigation release only.<br />
Losses of about 500 x lo6 m3 per year were estimated from the water balance equations.<br />
But surveys made by using Auoresceine to locate the sinkholes were fruitless.<br />
The water balance equation was:<br />
Mean annual evaporation 0.70 x IO9 m3<br />
Precipitation over the lake 0.35 x lo9 m3<br />
Irrigation release 0.30 x lo9 m3<br />
Losses through unknown sinkholes 0.50 x IO9 m3<br />
Inflow to the lake 1.15 x IO9 m3.<br />
During the winter 1964-65 some sinkholes could be identified by the surveys<br />
made by the Projects Investigations Office of the D.S.I. (Turkey State Hydraulic Works).<br />
Lake Egridir is similar in size to lake Beysehir but smaller. The area of the lake is<br />
about 470 km2 with a capacity of 3.5 x IO9 m3 and the mean and maximum depth<br />
7,50 m, 12,O m respectively. The water budget of the lake is not established yet, but<br />
it should have the same components as lake Beysehir, and studies made during the last<br />
decade indicated that the water available from this lake was about 250 x 106 m3 per<br />
year. Recent more detailed studies only confirmed this figure. Lake Egridir has several<br />
well-defined sinkholes at its western shoreline.<br />
The chloride analyses made of the 10 samples collected from the lake and some<br />
tributaries indicated that lake Beysehir could be considered as a mixed reservoir. The<br />
chloride concentration of water of the tributaries ranges from 0.8 ppm to 4.3 ppm.<br />
The mean concentration of the ten samples collected in the lake is 7.5 ppm with a<br />
standard error of 0.1 ppm, which shows how small the variation of chloride is in the<br />
lake. If it is assumed that the general direction of the flow in the lake follows the chloride<br />
gradient in the lake it is also possible to identify two sink areas, one at the northwest<br />
shore of the lake which might be indicative of the losses occurring at this shore line,<br />
and the second at the middle of the lake, indicating a sink area due to evaporation.<br />
The number of samples analysed, however, is not sufficient to support these directions<br />
of movement very firmly.<br />
The homogeneity of lake Beysehir with regard to chloride concentrations suggests<br />
that the samples collected for tritium analysis at Beysehir may be considered as being<br />
representative of the average tritium concentration prevailing in the lake. In this case,<br />
it is possible to make an attempt to interpret tritium data and estimate the mean<br />
inflow to the lake and even make an estimate of the losses occurring through sinkholes<br />
657<br />
.
Several studies have been made to analyse the relation between a discharge from<br />
a reservoir and the reservoir volume. The simplest relation being<br />
resulting in a recession curve in the form<br />
Q = Qo e-kt<br />
which is in agreement with most of the flow recession curves in nature.<br />
The contribution of the current year's recharge to the amount of tritium in the<br />
reservoir is:<br />
Co Qo<br />
CO being the concentration of tritium in recharge and Qo the annual recharge volume.<br />
The previous year<br />
c e-Y.l<br />
where y is the radioactive decay constant for tritium (y = 1/18 years-l) or<br />
cQ e-(y+k)l<br />
and the n-th year<br />
Q<br />
C,Q, e-(y+k)nI<br />
The amount of tritium in the reservoir will therefore be:<br />
where Vis the volume of the reservoir. We can replace<br />
(& = mean annual recharge)<br />
or<br />
C = k C,E, eë(y+k)n<br />
V by &/k which in turn gives<br />
where an = an/& is the ratio of the recharge rate of the n-th year to the average<br />
annual recharge.<br />
RECONSTRUCTION OF THE TRITIUM FALLOUT CURVE AND INTERPRETATION OF THE DATA<br />
Sampling to determine the tritium concentrations of the lakes and the precipitation<br />
in the region started in 1963. It was therefore necessary to make a correlation analysis<br />
in order to extend the limited data available. An attempt was made by plotting the<br />
concentration value observed in some central Anatolian meteorological stations versus<br />
concentrations observed in Vienna precipitation. Although the distance between these<br />
locatations is rather discouraging for such an attempt, the relation found was<br />
surprisingly good (fig. 3).<br />
The records of tritium concentration in Vienna precipitation cover only the period<br />
1961-65, so it was also necessary to extend the data available for Vienna. The longest<br />
record of tritium concentrations in precipitation is only available in Ottawa, Canada.<br />
658
Vienna values when plotted against concentration values observed in Ottawa again<br />
disclose a very significant correlation (fig. 4). Using these two recession curves the<br />
tritium fallout curve for the central Anatolian plateau where the lakes are located<br />
was developed. (Fig. 1)<br />
.<br />
I<br />
. AUUAW<br />
A KONYA<br />
. ~Zai~ia<br />
I BUPDUQ<br />
The recharge to the lakes has three components, surface runoff, spring flow and<br />
precipitation over the lakes. Of these components surface runoff is the most important<br />
one. To estimate tritium input to the lakes, only the period December-April, which<br />
is the period where the precipitation is effective in producing runoff, was taken into<br />
consideration.<br />
The precipitation occurring during this period is about 2/3 of the annual<br />
precipitation. Annual tritium inputs to the lakes were also weighted, using a non-<br />
dimensional parameter obtained from Manavgat river annual flow volumes.<br />
Although the final estimate of tritium concentration in the Central Anatolian<br />
plateau was obtained by using two recession curves and therefore should have a large<br />
standard error of estimate, it should be noted that the values which belong to recent<br />
years are either original values recorded in the region or values estimated from<br />
Vienna - Central Anatolian recession curve. It is difficult to claim, of course, that values<br />
obtained this way wil permit a rigorous quantitative analysis of the data, but it is<br />
worthwhile to attempt to interpret them in the light of our previous knowledge of<br />
the hydrology of the region.<br />
The data so far obtained from lakes Beysehir and Egridir are plotted in figure 5,<br />
together with the curves based on the tritium fallout in the region and well-mixed<br />
reservoir model.<br />
It is seen that the points belonging to lake Beysehir follow a trend close to the curve<br />
which represents a well-mixed reservoir with a turnover time of 3.5 years. This would<br />
give an average annual recharge volume of<br />
659
The annual outflow from the lake should be equal to this latter figure. The annual<br />
evaporation from the lake estimated from Class A pan records (pan coefficient 0.7)<br />
is approximately 700 x lo6 m3 and the annual irrigation release 300 x lo6 m3. Therefore<br />
the losses other than evaporation should be equal to<br />
(1.14-0.7-0.3) lo9 = 14Ox lo6 m3.<br />
This value is lower than that which was estimated from the balance equations. This<br />
difference might be due to the errors involved in the tritium input estimates and also<br />
to the dilution of the lake waters by the large spring flow to the lake.<br />
660
In fact, a spring which is located near Konya had tritium concentrations of about<br />
250 T.U. during the period 1963-65. Two other springs in the upper Manavgat basin,<br />
which are located at the south of the Beyqehir lake tributary basin, have concentrations<br />
less than 200 T.U. The annual spring flow is about II5 of the total inflow to the lake.<br />
In this case, the turnover time might well be three years which would give an annual<br />
recharge rate of 1.34 x IO9 m3, and losses of about 350 x lo8 m3 per year.<br />
In the case of lake Egridir the turnover time is 5.5 years, which gives an average<br />
annual recharge rate of<br />
-_-<br />
I' - 3S log = 635 x lo6 m3<br />
T 5.5<br />
The evaporation and the mean annual release from the lake during recent years are<br />
470 x IOG m3 and 200 x IOG m3 respectively. These figures, when added, approximately<br />
equal the figure found for annual average recharge to the lake, indicating no losses<br />
at all. Lake Egridir, however, is also diluted with spring flow as lake BeySehir. Because<br />
it is not possible to estimate the amount of the spring flow to the lake it is rather difficult<br />
to make a similar statement for lake Egridir, as was made for lake Beysehir. W e can<br />
only say that sinkhole losses in lake Egridir should be less important than those of<br />
lake Beysehir.<br />
CONCLUSION<br />
Although the data available is not sufficient to reach firm quantitative conclusions,<br />
it seems that the study of the tritium pulse in such lakes can shed light on the complex<br />
hydrologic systems where such lakes are situated. The main difficulty lies in determining<br />
the tritium input function to the lake. It would be interesting to separate the input<br />
into its components such as precipitation, surface runoff and spring flow to obtain<br />
better results, but the data available to the authors was not sufficient to make this<br />
refinement.<br />
661
A CONCEPTUAL MODEL OF KARSTIC EROSION<br />
BY GROUNDWATER<br />
S. MANDEL*, D. Sc.<br />
ABSTRACT<br />
In the saturated zone of calcareous aquifers the process of erosion by solution pro-<br />
ceeds at a very slow pace, and consists essentially of two correlated phenomena:<br />
a) Solution channels are formed and widened in thevicinity of springs where a strong<br />
concentration of flow occurs. The solution channels gradually develop in an<br />
upstream direction, until gradually one giant spring “captures” the ground water<br />
of an entire calcareous massif;<br />
b) Throughout the aquifer an intricate sytem of solution channels develops, the domi-<br />
nant characteristic of which is its direction towards the outlet. Broadly speaking<br />
and neglecting local details, the process should be regarded as the transformation<br />
of a more or less isotropic aquifer into a strongly an-isotropic one.<br />
The direction of ground water flow is the determining factor in the karstic develop-<br />
ment of calcareous aquifers, variations of lithology, faults, fissures, etc. are only of<br />
secondary importance.<br />
A regional system of solution channels can develop only if the general hydrological<br />
conditions, most especially the location of the base-level, remain practically constant<br />
during very long time intervals. The preferential directions of flow tend to become<br />
“fossilized”, and do not necessarily reflect the most recent geological events.<br />
From these considerations some practical consequences follow concerning the large-<br />
scale exploitation of ground water from calcareous aquifers.<br />
RESUME<br />
Modèle théoriqae de l’érosion karstique par les eaux souterraines<br />
Dans la zone saturée des aquifères calcaires, l’érosion par dissolution se produit très<br />
lentement et se caractérise essentiellement par deux phénomènes corrélatifs :<br />
a) Des canaux se forment et s’élargissent par dissolution, à proximité des sources où<br />
se produit une forte concentration de l’écoulement. Ces canaux se développent<br />
progressivement vers l’amont, jusqu’à ce qu’une source géante unique finisse par<br />
( capter )> l’écoulement souterrain de tout un massif calcaire;<br />
b) Dans l’ensemble de l’aquifère, il se forme un réseau complexe de canaux de disso-<br />
lution; dont la caractéristique principale est son orientation vers le point d’émer-<br />
gence. D’une manière générale et si l’on fait abstraction des particularités locales,<br />
ce phénomène doit être considéré comme la transformation d’un aquifère plus ou<br />
moins isotropique en un aquifère fortement anisotropique.<br />
La direction de l’écoulement des eaux souterraines est le facteur déterminant de<br />
l’évolution karstique des aquifèrescalcaires; lesvariations de la lithologie, les failles, les<br />
fissures, etc., n’ont qu’une importance secondaire.<br />
Un réseau régional de canaux de dissolution ne peut se former que si les conditions<br />
hydrologiques générales, notamment l’emplacement du niveau de base, restent à peu<br />
près constantes pendant de très longues périodes. Les directions préférentielles de<br />
l’écoulement ont tendance à se ( fossiliser ) et ne correspondent pas nécessairement<br />
aux événements géologiques les plus récents.<br />
De ces considérations découlent certaines conséquences pratiques concernant<br />
l’exploitation en grand des eaux souterraines d’aquifères calcaires.<br />
L’auteur donne des exemples régionaux d’aquifkres calcaires se trouvant en Israël.<br />
This paper is concerned with some theoretical aspects of solution processes in cal-<br />
careous aquifers. The author’s views are derived mainly from his experience in Israël,<br />
but a discussion of case histories has been excluded purposely, so as not obscure the<br />
general argument with a lengthy description of local details (for literature on regional<br />
662<br />
* Chief Hydrologist, TAHAL (Water Planning) Ltd. Tel Aviv, Israel.
aspects see references). The reader is asked to judge the relevancy of the ideas set forth<br />
in the light of his own experience.<br />
The term “Karstic erosion” was originally applied only to processes-observed or<br />
imagined-which form spectacular landscape features such as dolines.. . etc. This narrow<br />
definition caused serious misconceptions and acerbated discussions which are now,<br />
happily, a matter of the past. If the term “Karstic erosion” means essentially solution<br />
of calcareous rocks by water, then solution processes in calcareous aquifers must<br />
necessarily be included and one may even speak of “Karstic aquifers”.<br />
At the begin of our considerations stands a calcareous aquifer with more or less<br />
evenly distributed porosity. The pores may be “primary” such as in reef-limestone, or<br />
diagenetic such as caused by the dolomitization of limestone, or secondary such as a<br />
criss-cross pattern of fissures caused by complex faulting in an otherwise massive rock.<br />
Singular phenomena, such as one well defined shattered fault-line in an impermeable<br />
massif do not properly constitute an aquifer and are excluded from our considerations.<br />
Solution processes in this aquifer are a function of the following 4 parameters: (u)<br />
the rate of groundwater flow defined as yield through unit area, perpendicalur to the<br />
direction of flow, (b) the chemical and physical characteristics of the water, (e) the chemical<br />
and lithological characteristics of the rock, (d) the initial distribution of porespace<br />
within the aquifer (the distribution of pore-space conditions the rate of flow as<br />
under (a) but in addition it also conditions the speed of solution processes according<br />
to the relative size of the surface which is exposed to contact with the water).<br />
Parameter (a) can be singled out as being the really active one, all the other parameters<br />
come into play only to the extent to which they are activated by (u). In the long<br />
run-we are talking about processes on a quasi-geological time scale-the rate of flow<br />
wil practically govern the solution process in any given aquifer.<br />
In view of the ahove it x~y ou$ ‘Je expected that erosion by soiution 1s most pronounced<br />
just upstream from the natural outlets where the flow becomes concentrated.<br />
The development of solution channels causes a local increase of permeability and a local<br />
decline of groundwater potentials. This again, attracts the flow of groundwater from<br />
adjoining parts of the aquifer and enhances karstic erosion in them ... etc., the process<br />
repeats itself until a very large volume of aquifer is connected to one outlet by a network<br />
of solution channels.<br />
A giant karstic spring of this kind is frequently formed at the topographically lowest<br />
outcrops of the aquiferous formations, its catchment area may cut across several watersheds<br />
and even across well-defined structural lines. Vestiges of older springs which were<br />
dried up during the process are often found. The mere existence of a spring at a low<br />
outcrop can-of course-be expected, but the formation of one giant spring draining<br />
a very large area can only be explained by the development of a system of solution<br />
channels.<br />
In the aquifer the existence of solution channels is easily observed during drilling<br />
operations. Whenever the driller reports loss of “cuttings” or a sudden drop of drilling<br />
tools a cavern has been siruck. Core samples also often show small solution channels.<br />
Even in such a “karstic” aquifer a regular distribution of groundwater potentials and<br />
a “cone of depression” around each pumping borehole may be observed. In this respect<br />
the aquifer remains indistinguishable from the classical model of a porous aquifer.<br />
The existence of solution-channels only renders the aquifer strongly an-isotropic.<br />
The most pertinent mathematical model of this type of karstic erosion would consist<br />
of the transformation of the flow pattern in a more or less isotropic porous medium<br />
to the flow pattern in a strongly an-isotropic one.<br />
Unfortunately, good techniques to measure an-isotropy in the field are not available.<br />
The classical techniques of pumping tests presuppose an isotropic medium<br />
whereas the techniques of tracing, which are commonly applied in karst-hydrology<br />
assume tube-like connections between two or several points. The lack of suitable tech-<br />
663
niques of measurement should, however, not detract us from recognizing the impor-<br />
tance of the natural process. (A theoretical consequence bearing on anomalies of sea-<br />
water intrusion into karstic aquifers has been published elsewhere, ref. (5).<br />
Because of the very slow pace of karstic erosion by groundwater, the resultant pat-<br />
tern of solution channels tends to reflect mainly those geological and hydrological con-<br />
ditions, which were persistent during a quasi-geological period of time. The flow pat-<br />
tern becomes as it were “fossilized” and is unable to adapt itself to comparatively quick<br />
and recent changes of topography and geology. The flow pattern tends to reflect the<br />
oldest and stablest structural lines, it may sometimes stand in a puzzling contradiction<br />
to more recent upheavals such as faulting, ... etc.<br />
Large scale exploitation of a karstic aquifer should obviously follow the natural<br />
pattern of flow rather closely. To try and change the pattern of flow in an an-isotropic<br />
aquifer very radically by pumpage may only lead to very large draw-downs without<br />
assuring the desired resulta. It follows that, during the siting of boreholes and well fields<br />
in karstic aquifers, great attention should be paid to the most stable structural lines<br />
which probably determine the direction of flow.<br />
It is tempting to speculate on the later stages of this process of karstic erosion by<br />
groundwater. In all likelihood a few channels will become progressively larger whereas<br />
all the rest will eventually become clogged by calcitic deposits and by silt. The aquifer<br />
wil thus slowly be replaced by a few large solution channels in an almost impermeable<br />
rock, and thus approach the character of a classical “Karst”.<br />
In humid regions, where surface karstic erosion is very active, a direct connection<br />
often exists between concentrated areas of intake (dolines, sinkholes), and springs. It is<br />
open to doubt whether such a direct connection can eventually develop also in arid<br />
and semi-arid regions where surface karst is inactive.<br />
REFERENCES ON THE KARST HYDROLOGY OF ISRAEL<br />
PICARD L., History of groundwater exploration in Israel. Hebrew University of<br />
Jerusalem, Geol. Dept. Publication No. 216, May 1959.<br />
GOLDSCHMIDT M., Precipitation over and the replenishment of Yarkon and Naha1<br />
Ha’Taninim underground catchments. Jerusalem, Hydrological Service. 1958.<br />
MANDEL S., Geo-Hydrology of the Tanninim River Catchment Area. TAHAL<br />
Publication No. 21, 1959.<br />
MANDEL S., The Cretaceous Limestone Aquifer of Central Israel . A. i. H. Réunion<br />
de Liège 1958, pp. 48-50.<br />
MANDEL S., The Mechanism of Sea-water Intrusion into Calcareous Aquifer.<br />
IASH Publ. No. 64, Berkeley 1963.<br />
MERO F. and MANDEL S., Planned Exploitation of the A.quifer Feeding the Na’aman<br />
Spring. IASH Publ. No. 57, Voi. 2, Athens 1961.<br />
SCHNEIDER R., Relation of Temperature Distribution to Groundwater Movement<br />
in Carbonate Rocks of Central Israel. Geol. Soc. American Bulletin, Vol. 75, pp. 209-<br />
216, March 1964.<br />
664
L’AFFAISSEMENT DU SOL DE MEXICO PAR SUITE<br />
DU POMPAGE EXCESSIF DE LA NAPPE<br />
R~SLJMÉ<br />
Ignacio SAINZ ORTIZ*<br />
Mexico est une ville qui se trouve à 2230 mètres au-dessus du niveau de la mer et<br />
qui connaît un développement démographique extraordinaire (eile est passée de 906.000<br />
habitants en 1920 à 4.870.000 en 1960).<br />
Les ressources du bassin en eaux superficielles sont très limitées; les installations, de<br />
retenue et de régularisation sont rares et coûteuses. En conséquence, l’augmentation<br />
incessante de la demande a contraint dès 1936 les autorités à forer de nombreux puits<br />
profonds en de nombreux points de l’agglomération. Les aquifères sont limités par<br />
d’épaisses couches d’une argile volcanique très compressible.<br />
A l’heure actuelle, le rabattement moyen du niveau piézométrique des aquifères est<br />
de 27 mètres, ce qui provoque une contraction des couches d’argile et par conséquent<br />
un abaissement du sol. L’abaissement était de 5,77 m en moyenne en 1963; il atteignait<br />
un maximum de 7,99 m à la statue de Charles IV.<br />
Cet abaissement a, bien entendu, des effets désastreux. Les différences de tassement<br />
entraînent la dislocation et la rupture des égouts et des canalisations; les bàtiments<br />
penchent et se fissurent.<br />
Pour mettre un terme à cet affaissement, il faut arrêter le pompage des puits et<br />
fourn ir à la ville 8,5 m3/s d’eau d’origineex térieure, sans préjudice du volume nécessaire<br />
pour répondre à la demande croissante.<br />
SUMMARY<br />
STJBSDEKCE IN MEXICC CITÌ’ IN EELATION TO<br />
GROUND WATER OVERDRAFT<br />
Ignacio SAINZ ORTIZ*<br />
Mexico City, located in the southwest region of the Valley of Mexico, at an elevation<br />
of 2230 m above sea level, has had an unexpected rising demand for water supply,<br />
derived from a demographic and industrial overgrowth which is occurring since the<br />
beginning of this century, (from 906 O00 inhabitants in 1920 to more than 5 O00 O00<br />
in 1964).<br />
Surface water resources in the watershed are very limited; the storage and regulation<br />
facilities are scare and expensive. Notwithstanding that in 1936 a volume of 3.5 cu.m/sec<br />
of water was introduced from external sources at an elevated cost, the Authorities an<br />
several industrial enterprises were compelled to drill many deep wells throughout the<br />
city, in order to satisfy the rising demand. Actually, 11.7 cu.m/sec are obtained from<br />
ground water resources by means of more than 1250 deep wells, producing a serious<br />
overdraft.<br />
Aquifers in MexicoCity are confined; at the hills, by extense layers of volcanic tuff<br />
and at the plains by thick layers of highly compressible volcanic clay. The negative<br />
excess of pore pressure produced in the aquifers by the pumping of wells, causes da<br />
consolidation process in the clay layers and consequently the subsidence of the ground<br />
surface, as was demonstrated by Dr. Nabor Carrillo in 1947.<br />
Subsidence is not even over the plain; at each point, the magnitude is a function of<br />
the negative excess of pore pressure and of the thickness and mechanical properties of<br />
the clay.<br />
* Chef du Département des études spéciales de la Commission d’hydrologie de la<br />
Vallée du bassin de Mexico ; Ministère fédéral des ressources hydrauliques.<br />
* Head of the Special Studies Dept. of the Hydrological Commission of the Valley<br />
of Mexico Watershed. Federal Ministery of Hydraulic Resources.<br />
665
666<br />
ON3UY3l 130 53NO1YVA313
667
y:<br />
o<br />
8<br />
r¿<br />
1
ON THE LOCAL AND REGLONAL. MINERALISATION<br />
OF KARST GROUNDWATERS AND THEIR VARIATIONS<br />
FROM DEVONIAN LIMESTONES OF<br />
THE RHENISH SHIEFERGEBIRGE<br />
(WESTERN GERMANY)<br />
SUMMARY<br />
Horst Robert LANGGUTH*<br />
In the northern part of Rhenish Shiefergebirge karst aquifers are formed by steeply<br />
dipping limestone intercalations of about 200 to 400 m thickness within shales.<br />
The limestones are subdivided by faults into isolated hydrological segments with<br />
-t- small catchment areas, including the surrounding shale areas. The chemistry of the<br />
karst groundwaters corresponds with these segments depending on the geological<br />
conditions in the given catchment area, mainly on the covering strata and their bio-<br />
logical activity. Connected with this a regional increasing of the mineralisation in a<br />
western direction can be observed.<br />
At one test point the quality of the water is very homogeneous. Only weak variations<br />
are caused by variations of calcium and non-hydrogencarbonate components.<br />
Under complete tertiary cover the waters are characteristicdiiy different; they show<br />
cation-exchange and reduction of some anions, while passing glauconitic iayers.<br />
RESUME<br />
Dans la partie Nord des Montagnes Schisteuses Rhénanes, des nappes karstiques<br />
sont formées par des intercalations calcaires plongeant de façon> abrupte et présentant<br />
une épaisseur de 200 à 400 m entre les ardoises.<br />
Les calcaires sont subdivisés par des failles en segments hydrologiquement isolés<br />
avec des zones d’alimentation plus ou moins étendues, comprenant les zones d’ardoises<br />
voisines. La-himie des eaux de ce karst correspond avec ces segments et dépend des<br />
conditions géologiques dans les bassins d’alimentation, particulièrement avec les<br />
conditions des conches de couverture et avec leur activité biologique. En relation avec<br />
ces considérations, on observe une augmentation régionale de la minéralisation vers<br />
l’Ouest. A un point donné, la qualité de l’eau est très homogène. Seules de faibles<br />
variations en calcium et,en composés carbonés non hydrogénés sont constatées.<br />
Sous couverture tertiaire complète, les eaux diffèrent d’une façon caractéristique :<br />
elles montrent des échanges de cations et des réductions de certains anions quand elles<br />
passent des couches de glauconie.<br />
1, INTRODUCTION<br />
In the Velbert Anticlinal area on the Northern margin of Rhenish Schiefergebirge<br />
(fig. I) karstificated limestones appear forming karst aquifers. The mineralisation of<br />
these waters has been investigated, which is most interesting in the following aspects:<br />
- The limestones form steeply dipping intercalations of 200 to 400 m thickness within<br />
shales.<br />
- Contrary to the limestones the shales only bear groundwater in the surface zone<br />
of desintegration, but no deeper ground-water.<br />
- The thick-bedded or massive limestones form no unique aquifers, although they<br />
have a strike over more than 10 km. Indeed, they are subdivided by oblique faults<br />
into isolated hydrological segments (like “shipsegments ”). Between these segments<br />
the ground-water flow is interrupted or diminished. Consequently only relatively<br />
* Author’s adress: Lehrstuhl für angewandte Geologie, Technische Hochschule<br />
Aachen, (51) Aachen, Deutschland.<br />
672
I<br />
/i ri’<br />
ouferop<br />
Of the<br />
basernrnl<br />
Fig. 1 - Map showing the investigation area.<br />
10 20 30<br />
Liim<br />
673
weak karst springs appear in the investigated region, mostly discharging less than<br />
10 I/s, the maximum being 25 lis. corresponding only to small catchment areas.<br />
- The water balance of single limestone segments is dependent on the waters of the<br />
neighbouring shale areas, as far as they belong to the direct catchment area. All<br />
these waters flow supraterraneously or subterraneously into the limestones. This can<br />
be observed by many sink-holes, infiltration from brooks etc.<br />
The quantity of these shale waten is calculated in some cases as more than 50% of<br />
the total water balance.<br />
2. GENERAL CHEMICAL CHARACTERISTICS<br />
The following chemical characteristics can be stated:<br />
- Taken as a whole the ground-waters of the limestones represent a relatively homogeneous<br />
alkali earth-hydrogen-carbonate type as shown on figures 2a and 26. The<br />
fluctuations of the total content in equivalents per million (epm) and of the single<br />
ions too, are very gradual.<br />
- Contrary to this the water from shale formations shows higher fluctuations of total<br />
epm as weil as of the range of concentration of single components. For example a<br />
synoptic diagram of the shale waters of the so-called Velberter Schichten is shown<br />
on figures 3a and 3b.<br />
Finally it may be mentioned that deeper and higher concentrated waters, like salty<br />
or minerai waters, are not known.<br />
In the limestone aquifers an homogenization of all waters takes place. Therefore<br />
following aspects of the chemistry of limestone water have to be considered:<br />
a) What is the chemical behaviour of a particular test point over long time intervals?<br />
b) Can a regional geological interdependence of mineralisation be observed?<br />
3. THE CHEMICAL FLUCTUATIONS AT ONE TEST POINT<br />
Jn the investigation area chemical tests have been made for long periods from several<br />
catchment stations of karst waters. One karst spring with 25 1/s yield is now considered<br />
as a representative test point, which has been analysed over 30 years.<br />
The general behaviour of this spring is also relatively uniform, et there are characteristics<br />
weak fluctuations, concerning mainly the total hardness (= epm of alkali<br />
earths). In this connection the range of concentration of calcium is much more changeable<br />
than [hat of magnesium. Figure 4 represents the Ca- and Mg- contents and their<br />
ratio. Utilizing the proportion of calcium to magnesium by means of a frequency curve,<br />
a maximum of between 9:i and 8:l can be seen. On the contrary the single figures range<br />
from a ratio of 6: I to 13:l. It is clear that the fluctuations of Ca-Mg-ratio are also caused<br />
by the fluctuations of calcium content. Figure 4 shows, furthermore, that under such<br />
conditions the Ca-Mg-ratio cannot be utilized as a means of differentiating groundwater<br />
under regional and systematic aspects. On the other hand a single test is practically<br />
useless.<br />
In order to consider the content and the fluctuations of anions, figure 5 shows the<br />
range of concentrations of Ca, Mg, total hardness and carbonate hardness (German<br />
degrees). Only fluctuations of nori-hydrogencarbonate components can be observed,<br />
while the carbonate hardness remains nearly constant ranging from 10,5-12,0 German<br />
degrees, i.e. 3,7-4,3 epm.<br />
Summing up, the fluctuations of total concentration are only caused by calcium<br />
674
ions and non-hydrogencarbonate components. It is not immediately possible to find<br />
the real reason for this phenomena, for the following aspects have to be considered:<br />
- The limestones are generally relatively poor in magnesium. Magnesium content is<br />
mostly less than 5% by weight, ofter less than 2%. When the actual proportion of<br />
dissolved calcium to dissolved magnesium is 8: 1, magnesium is relatively increased.<br />
Fig. 2a - Analysis of groundwaters from Karstificated limestones in the Velbert<br />
Region. Trilinear diagram in epm - %.<br />
- On the other hand large quantities of groundwater from neighboured shale districts<br />
flow into the karst. Yet, the increase of total concentration of karst waters cannot<br />
be explained by these shale waters, because their concentration is not on average,<br />
higher (see fig. 3). Besides, shale waters have a similar proportion of calcium to<br />
magnesium.<br />
4. THE REGIONAL INTERDEPENDENCE OF MINERALISATION OF KARST WATERS<br />
The mineralisation generally increases from the eastern part to the western part of<br />
Velbert region. This phenomena can be demonstrated by a series of test samples,<br />
taken from springs and wells of the practically E-W-striking limestone on the southem<br />
675
Fig. 2b -Analysis of groundwaters from karstificated limestones in the Velbert region.<br />
Diagram showing the total concentration (in epm) and the individual one of<br />
Ca+ Mg and CHO (in eprn-x).<br />
676
margin of Velbert anticline. These samples are spread over about 7 km (see fig. 6).<br />
Only in the eastern side of this investigated region is the basement free from covering<br />
strata. In western direction covering strata increase, so that first the basement is incom-<br />
pletely, then totally covered by residual loam, loess loam and locally by ca!cifcrous<br />
loess. Finally there is a Tertiary cover of glauconitic marine sandy and ri2y layers. In<br />
the same direction the height of terrain diminishes from 200 m to 65 above sea level.<br />
The chemical datas are given on figure 6.<br />
Fig. 3a - Analyses of groundwaters from shales in the Velbert Region. Trilinear<br />
diagram in epm-%.<br />
The increase of mineralisation can be described in terms of the total concentration<br />
(epm), total hardness and carbonate hardness. So clear development is observed on<br />
sulfates, nitrates and chlorides. It is seen that the karst water is only increasing in alkali<br />
earths and HC.03-inns step by step. Therefore the increased mineraiisation can be<br />
explained by the original quantity of free carbon dioxide contained in the water.<br />
Carbon dioxide gase can, however, be dissolved in the bio-active zone of the covering<br />
stratas. while rain water is percolating. On the other hand the total of the primarily<br />
dissolved carbon dioxide can be considered as a index of the biological activity of the<br />
soils in the given catchment area. Consequently in the columns 1-3 figure 6 there are<br />
calculated the quantities which are necessary for the solution of carbonates and for the<br />
677
Fig. 3b - Analysis of groundwaters from shales in the Velbert region. Diagram<br />
showing the total concentration (in epm) and the individual one of Ca+ Mg and<br />
HCO (in epm-yJ.<br />
678
0:1 u9 #:1 ID:l<br />
4<br />
' I ;<br />
Y--<br />
T # e to ri 12 Q M II<br />
_IC PPm*"<br />
Pig. 4 - Concentrations of Ca++ and Mg" and Ca-Mg-ratio. Karst spring-water from<br />
WÜlfrath/Velbert region.
jl=<br />
I *<br />
+* .<br />
++++ /*<br />
i<br />
l<br />
2<br />
+<br />
/ *<br />
/<br />
+<br />
++* C.<br />
t + 8<br />
++*<br />
++<br />
$:<br />
++<br />
Fig. 5 -Total hardness (GH), carbonate hardness (KH) (in German degrees -=Od)<br />
in relation to Ca*- and Mg*- concentration. Karst spring-water Wiilfrath/Velbert<br />
region.<br />
680<br />
.
68 1
682<br />
I l i<br />
I<br />
P<br />
.- M<br />
u<br />
o"<br />
c<br />
,
COZ-HC03-equilibrium. Usually in the hydrochemical literature it is stated that Mg-<br />
HCO3 ions are stable in solution without the presence of free equilibrium carbon<br />
dioxide.<br />
In the column 1 the whole carbonate hardness is calculated as hardness of calcium.<br />
In the column 2 the free carbon dioxide only refers to calcium equivalents. By the<br />
figures in brackets it is stated that the calcium equivalents are higher than the hydrogen-<br />
carbonate equivalents. In the third column calcium and magnesium are distributed in<br />
real proportions to carbonate hardness.<br />
All columns show that the primary content of free carbon dioxide increases from<br />
East to West, totally for about 50% of the Eastern data. This increase is adequate to<br />
differentiate between covering stratas of the basement, like blown sands, residual<br />
loam, loess loam, loes and finally to the Tertiary cover. This connection can only be<br />
reduced to the different soil types and their biological activities.<br />
5. GROUND-WATER OF KARSTIFICATED LIMESTONES UNDER COMPLETE TERTIARY COVER<br />
In the western part of the Velbert region, i.e. the marginal blocks bordering the<br />
Tertiary basin of Lower Rhine area, the basement is completely covered by marine<br />
glauconitic sandy ans silty layers. Limestones and neighboured shales have here no<br />
connection with the surface hydrostatis base level. Yet, in this position deeper ground-<br />
water is found, which shows characteristic chemical difierences: (see fig. 6, sample 9).<br />
- The Ca-Mg-content is clearly lower<br />
- The epm-value of HC03 is as high or higher than that of alkali earths<br />
- The content of anions is the of the same orders in the neighbourhood<br />
- The epm-value of alkali reaches 40% of the total equivalents per million<br />
- In contrast to normal limestone waters this waters has low content of free dissolved<br />
oxygen; the content of nitrates is less: in some cases ammonia nitrogen, iron and<br />
mangenese are dissolved.<br />
This water can be explained by cation-exchange and reduction of some anions,<br />
while passing the marin glauconitic layers. Any influence of deeper salty water seems<br />
impossible.<br />
6. CONCLUSIONS<br />
An example is given of the chemical behaviour of karst ground-waters of temperate<br />
zones. The chemistry of these groundwaters depends on the geological conditions in the<br />
catchment area, mainly on the covering stratas and their biological activity. Furthermore,<br />
the quality of water is very homogeneous. The fluctuations of concentration<br />
cannot simply be explained by mixing with other waters, which flow into the limestone<br />
aquifers. Some remarks are given to local and regional behaviour and to the utilization<br />
of the Ca-Mg-ratio in temperate regions.<br />
683
SUMMARY<br />
ON THE TYPES OF TUFA-DEPOSITING WATERS<br />
AND ON THE CORROSION INTENSITY<br />
IN THE NORTH-WESTERN DINARIC KARST<br />
Ivan GAMS<br />
(Yougoslavic)<br />
On the basis of hydrochemical measurements it is stated that in the karstic rivers<br />
Krka in Lower Carniola(S1ovenia) and in Plitvica Lakes (Croatia) tufa deposition occurs<br />
after affluents of broocks rich in MgO, in Krka below Knin (Dalmatia) rich in SOa.<br />
Absence of transported coars load and some other factors are also needed. Karstic<br />
springs in Slovenia, which deposit tufa, are rich in Ca0 or CaO+MgO or in other<br />
minerals.<br />
For drainage areas in Slovene Karst the corrosion intensity is calculated on the basis<br />
of formule Z = 4 E T/100 (I = rocks in solution In mS/kmz/year, E = runoff in dm,<br />
T = rocks in solution in mg/l in the rivers. The highest corrosion intensity in Slovenia<br />
occurs on the carbonate sediments with high runoff and covered with soil, The differ-<br />
rences in corrosion intensity in some river basins are explained with geological compo-<br />
sition, vegetation, soil, precipitations and land use. Some drainage areas in SO Dinaric<br />
Karst are dealt with to make a comparison.<br />
Tufa deposits and corrosion intensity in the Dinaric Karst are extensive and complicated<br />
themes. In such a short report I was able to stress only some results of explorations<br />
carried out with hydrochemical measurements. As my measurements are not<br />
yet completed, this report is only preliminary. Its main purpose is to promote the systematic<br />
and collective research of these two themes. The classical Dinaric Karst is the<br />
largest Karst area in Europe. These results are therefore of special interest.<br />
The hydrochemical causes of tufa deposits, presented here as the only one, do not<br />
exclude other causes described in the Yugoslav literature especially by 2. PavletiC<br />
(1955, 1960) and in the older foreign literature mainly by S. Prat (1962). As the tufadepositing<br />
waters have special hydrochemical characteristics, the opinions of J. CvijiC<br />
(1962) and of H. Ivekovif (1958, p. 264), that the biologica1 factors have a secondary<br />
importance, seems to be justified. Biological factors were dealt with especially by Prevalek<br />
(1925, 1953, 1955).<br />
There are more than a hundred smaller or bigger tufa-depositing brooks in Slovenia.<br />
Yet the amount of the tufa masses is relatively small. As in the last glacial epoch, a<br />
glacial or periglacial climate prevailed, the tufa masses are mostly of postwiirmian age.<br />
By means of hydrochemical measurements the tufa-depositing waters can be divided<br />
into the following types.<br />
I. Karst springs in organogenic limestone with enormously high calcium hardness.<br />
The tufa in the greatest quarry of Slovenia at Jezersko (Kamnik Alps) has been deposited<br />
by a spring from coral reef limestone in Mt. Virnikov Grintovec (1,654 m.). On<br />
10 June 1963 thecalcium hardness of 14.3"GD (GermanDegrees. 1"GD = 1.79 French<br />
degrees, 1.25 English degrees, 1 .O4 American degrees) were measured. Immediately<br />
after springing the waters of this type deposit tufa in form of terraces.<br />
II. Tufa-depositing waters with high Mg content:<br />
(p) Springs which deposit tufa immediately after appearing on the surface, have usually<br />
more than 43 % of total hardness in the form of Mg hardness. In Slovenia, waters<br />
of this kind are the most numerous among tufa-depositing waters. The brooks<br />
often occur in groups, and deposit tufa on the slopes. The greatest part of dolomites<br />
from which tufa-depositing waters rise, are of triassic age. The greatest tufa accumulations<br />
are in the triassic dolomite belt between the villages StiCna and Sentnipert in<br />
684
the transitional territory from Posavski hribì to Dinaric Karst in lowland Slovenia<br />
(Lower Carniola). The main tufa accumulations can be found in Dedni dol, Kosca,<br />
Izerk and Sp. Draga. The total hardness of these waters is 16.0-17.1, carbon. hardness<br />
15.1-15.9, Ca hardness 8.0-9.4 and M g hardness 7.7-8.0'GD. On Triassic dolomite tufa<br />
depositions also occur at the village Gozd (Trebeljno), in the canyon IHki Vintgar, in<br />
the eastern Karawanke (Razbor, Mezica), etc.<br />
(b) After the confluence of two streams of high Mg hardness, the tufa deposits even<br />
occur if the dolomite hardness in the miced water is as low as 30% of the total hardness<br />
Experiments have shown that added Mg in small quantities checks the precipitation of<br />
carbonates (Roques, 1964). But Natur shows that in mixing waters with high Mg<br />
content the soluted carbonates get instable.<br />
The causes for this phenomenon are not yet known. But the solution of this question<br />
is economically important with a view to preventing tufa deposits in water pipes and<br />
water channels. The accumulation of tufa in the Cave KriZna jama with the mossless 22<br />
lakes proves that mosses are very little blame for tufa formation. In that cave, tufa<br />
deposits occur only after the confluence of the two brooks coming from a dolomite<br />
tract and containing much Mg. On 25 September 1964 their hardness was:<br />
Water temperature<br />
Hardness in "GD<br />
-<br />
in Oc Carbon Total Ca0 MgO<br />
Matja5ev rov 8.6 12.9 13.4 8.1 5.3<br />
Blatni rov 9.4 12.5 14.1 8.0 6.1<br />
The most famous Slovene river with tufa barriers, causing 2 m. high cascades, is<br />
the Krka in Lower Carniola. But the travertin deposits exist only in some stretches of<br />
the upper course of the river. Our study (Gams, 1962) has found the following causes of<br />
the deposits: total hardness over 1 I'GD, Mg hardness in summer more than 31 % of<br />
the total hardness, absence of solid bed load. The flow on the alluvia hinders the tufa<br />
depositing. Each of the three mentioned reasons may suffice, if strong enough. In the<br />
upper course of the JSrka, tufa occurs after the Krka is joined by three tributaries: the<br />
surface rivulet ViHnjica and the two karst springs Virje and Izer. But the deposits in<br />
the river begin as far as several hundred metres or even 1-2 km. downstream.<br />
The same holds at the Plitvice Lakes which are the most famous tufa lakes in Yugos-<br />
lavia. All their tributaries have high Mg content. After the confluence of Bijela and<br />
Crna Rijeka, the stream Malica is running on alluvions, which hinders the tufa depo-<br />
siting. The solid river transport also precludes tufa formations, and this material has<br />
even destroyed existent tufa barriers (RogliC, 1962). The hydrochemical composition<br />
of the Plitvice Lakes has been published by H. Ivekovik (1952). My own analysis of the<br />
tributaries on 1 July 1963 has given the following figures for low water in summer.<br />
(See table page 000)<br />
Tufa formations in the lakes are mainly due to the confluence of the Crna Rijeka,<br />
Bijela Rijeka and Suganjski potok (2 km downstream of it are the main dams of ProS-<br />
Eansko jezero) and the couñuence of the Rijeka (2 km downstream of it are the main<br />
barriers at the end of Kozjak Lake). With relative low dolomite content the tributary<br />
Plitvica has not a great influence on tufa depositing and, actually, soon after the con-<br />
fluence the tufa deposits in the Korana diminishes. So the Lakes have been wrongly<br />
named after the Plitvica brook.<br />
685
% of the<br />
Water Hardness in 'GD total hard-<br />
temperature -- ness in form<br />
in Oc Carbon Total Cao MgO of Mghard-<br />
ness<br />
~~ ~ ~ ~~ ~ ~~<br />
Crna Rijeka 21.4 13.6 14.2 7.9 6.3 44<br />
Bijela Rijeka 21.5 13.6 14.0 7.8 6.2 44<br />
Matica 22.5 13.2 13.6 8.4 5.2 38<br />
SuSanjski potok<br />
Krmeca potok<br />
21.5<br />
21.4<br />
14.3<br />
13.7<br />
15.0<br />
14.4<br />
8.4<br />
7.8<br />
6.6<br />
6.5<br />
44<br />
46<br />
Gradinsko jezero 22.2 10.5 10.8 6.4 4.4 41<br />
RijeEica 21.4 15.1 15.3 8.3 7.3 46<br />
Kozjak, end of the<br />
Lake<br />
Plitvica, water-fall<br />
Korana at the end<br />
21.2<br />
29.6<br />
11.8<br />
12.0<br />
12.1<br />
12.8<br />
7.1 5.0<br />
7.4 5.4<br />
40<br />
42<br />
of the barriers 29.6 10.1 10.6 5.8 4.8 45<br />
According to the published data the river Pliva belongs to another type of tufa-<br />
depositing water. Its tributary Janja, arriving from dolomite has great influence on the<br />
tufa deposits in the Pliva (Kanaet, 1959).<br />
III. Tufa-depositing water with high content of so3. The river Krka (of Skradin)<br />
upstream of Knin and its tributaries have hydrochemical conditions for tufa formation,<br />
but the solid river load prevents it. The Veliki buk dam is an example of recent des-<br />
troying of older tufa formations, by increased solid river load caused by deforestation<br />
and soil erosion.<br />
The analysis of 18 July 1963 at middle water level gave the following figures:<br />
Water temperature<br />
in "C<br />
Hardness in "GD<br />
Carbon. Total Ca0 MgO<br />
~ ~ ~~ ~~~ ~~ ~ ~~ ~<br />
ButiSnica at Knin 15.5 9.2 29.1 23.2 5.9<br />
Krka at Knin 13.8 10.2 12.4 9.2 3.2<br />
Cikola at DrniS - 8.7 12.8 11.1 1.7<br />
Krka at Skradinski buk - 8.3 11.7 9.7 2.0<br />
The main factor for the tufa dams in Krka is the confluence of the upper Krka with<br />
ButiHnica brook which has anomalous total and calcium hardness. This high value is<br />
because of its high concentration of sos. At the village of Luke immediately before the<br />
first dam in the lower course of the Krka, before the BiluSiC buk the Krka water contained<br />
on 18 July 1963:<br />
Sioz - 1.2 mg/l<br />
SO3 - 119.7 mg/l<br />
(This analysis was made in the Institute for Analytic Chemistry of the University in<br />
Ljubljana by Dr. Milan Dular.)<br />
IV. Some tufa-depositing brooks in the Slovene mountains have low total and also Mg<br />
hardness. Such a brook in BaSka grapa has the total hardness of 8.2-10.4"GD, dolomite<br />
hardness of 0.8-2.6'GD. Similar are some brooks on the southern slope of Mt. Manos<br />
and Mt. HrugCica running on breccie. The hydrochemical causes are not yet known.<br />
Here, the tufa masses are insignificant.
Corrosion intensity is shown in table I for larger drainage areas, for which more<br />
certain hydrological data are known. The basis for calculating the annual amount of<br />
rocks in solution per square kilometre is the measurement of total and Ca and M g hard-<br />
ness (with different weight of soluted minerals comprised in I'GD). On some rivers<br />
my own measurements are few and all are undertaken at low water in summer. But<br />
the monthly measurements of the Ljubljanica river in the last four years have offered a<br />
criterion for the evaluation of the single measurements. The annual moving of the total<br />
hardness of the river Ljubljanica reaches the annual average value in July (ii.S0GD).<br />
The mean total hardness of high water is 10.1'GD. At water level which at an average<br />
lasts 3 months per annum, 36% of the annual water mass flows off. At increased water<br />
level mainly in winter and springs, the total hardness falls. This is, up to a certain level<br />
of the rising water, not the case in autumn.<br />
If the same relation between Ca and M g carbonate hardness remains, the total<br />
hardness of the total water masses of Ljubljanica due to the run-off is nearly 5 % lower<br />
than the mean annual hardness. The reduction of the mean total hardness for the river<br />
Sava upstream from Ljubljana at summer middle water stage amounts to nearly 30%.<br />
The results for the Ljubljanica are applied to the karst streams, and the results for<br />
the Sava are applied to the surface streams (Sota, aka, Kolpa, Neretva, etc.).<br />
The difference of total hardness of the rivers are mainly due to the soil and vegeta-<br />
tion cover and to the petrographical composition. In the barren Karst above the tree-<br />
line in the Julian Alps, the total hardness of 3-5'GD prevails. The thickest soil cover<br />
of the Yugoslav Dinaric Karst is in southern Istria where the hardness amounts to<br />
20"GD (cams, 1963). On dolomites and dolomitized limestones higher hardness occurs<br />
than on pure limestone. In lower Carniola the rocks on dolomites have 14-18'GD of<br />
the total hardness.<br />
The annual amount of solved carbonate rocks per square kilometre of the drainage<br />
area cannot be exactly defined because of the poor data available as to the run-off, size<br />
of the drainage area of karstic rivers, etc. and because of the in sufficient number of<br />
hydrochemical measurements. Notwithstanding, we may compare the drainage areas<br />
amongst themselves.<br />
Sources of the data in the columns:<br />
2.4 and 5 - power sources of Yugoslavia. Beograd 1956.<br />
2 - F. Bidovec, Die empirischen Formeln für die Berechnung des Durchflusses<br />
im Vergleich mit dem tatschlichen Wassermengen der Flüsse im<br />
Alpengebiet Sloveniens. VI. Internationale Tagung für Alpine Meteorologie,<br />
Rled, Jugoslawien 1960.<br />
12 - Accordipg to the formula: S = 4 E S/100 (S = rocks in solution in<br />
m3/km2 of the drainage area, E = mean runoff of the precipitations in<br />
dm, T = rocks in solution m3/km2 of the drainage area).<br />
It is clear that locally within each drainage area great divergences in the corrosion<br />
intensity occur. They are due to the different petrographical composition, vegetation,<br />
soil cover, land use, kind of vertical water circulation, amount of underground caverns<br />
where because of dripstone sedimentation the hardness ofthe dripping water diminishes,<br />
etc. But this local factor forms the mean corrosion at the total drainage area and the<br />
mutual comparison of the results relating to the drainage areas is justified. As in all<br />
drainage areas of the Dinaric Karst, carbonate rocks prevail, the differences in the<br />
corrosion intensity, as figured in table i, are due mainly to the amount of annual<br />
precipitations to vegetation and soil cover. The Montenegrin-Hercegovian littoral<br />
mountains receive up to 5,000 mm precipitations annually but the total hardness of the<br />
rivers at the summer low water is usually 8-9"GD. owing to the bare karst surface. On<br />
687
the other side of the Dinaric Karst, Trnovski gozd (Trnovo forest) has only 3,000 mm,<br />
of the precipitations per year and is widely covered with soil and throughout bosky.<br />
Therefore the source of the river Indrijca has a run-off of nearly 100 I/sec/kma<br />
l/sec/km2 and the measurements have even in the winter stated a total hardness of at<br />
least 8'GD. The annual corrosion intensity amounts more than 139 m3 of rocks in<br />
solution per square kilometre. It seems that in the prealpine area (the drainage areas<br />
of Sota, Idrijca, HotederStica, etc.) the greatest corrosion occurs. The summit tract of<br />
Mt. Orjen (with 5,000 mm of precipitations and the run-off coefficient of 85 %) on bare<br />
ground the corrosion intensity would reach the same value as in the above-mentioned<br />
prealpine area, if the total hardness amounted to 7.8'GD.<br />
TABLE<br />
Mean runoff Precipitations Mean runoff<br />
River station Drainage area 1/sec/km2 in mm coefficient in<br />
in km2 %<br />
Ljubljanica-Ljubljana<br />
1 2 3 4 5<br />
-<br />
Krka - PodboTje 2,137 27.8<br />
Sava - Ljubljana 44<br />
SoCa - Kobarid 450 82.3<br />
Sota - Solkan 2,550 2,030 0.87<br />
Mirna - mouth 560 1,080 0.80<br />
Notranjska reka - Skocjan 1,000 1,480 0.65<br />
Idrija - Podroteja 104<br />
Kolpa - Petrinja 404 67.5<br />
Dobra - mouth 1,600 O. 7<br />
Mreinica - mouth 1,500 0.1<br />
Korana - mouth 1.400 0.7<br />
Lika-ponor 1<br />
Gorka - ponor<br />
2,400<br />
Krka - mouth at Skradin 2,250<br />
Zrmanja - mouth 780<br />
Neretva with the TrebiSnjica<br />
688<br />
31<br />
1,530 0.45<br />
1,260 0.55<br />
1,390 0.66<br />
1,580 O. 65
Mean hardness at measurements in "GD<br />
Mean runoff Number Weight of Rocks in<br />
of precip- of hydro- solved rocks solution<br />
itations chemical mg/l of the m3/km2/<br />
in mm measure- Total Calcium Magnesium total water year<br />
ments masses<br />
6 7 8 9 10 Il 12<br />
9.8 70 11.5 8.4 3.1 186 73<br />
8.8 11.7 10.0 1.7 200 70<br />
13.8 12 8.4 5.8 2.6 132 73<br />
25.8 6 6.7 5.4 1.3 108 111<br />
17.6 5 7.2 6.0 1.2 116 82<br />
8.64 1 13.7 235 79<br />
9.6 13 9.0 7.3 1.7 166.2 63.7<br />
mors 25.0 10 8.8 6.1 2.7 139 more 139<br />
21.3 2 8.4 5.6 2.8 133 113<br />
11.2 1 10.2 6.9 3.3 166 74<br />
10.5 1 9.7 7.0 2.8 160 67.2<br />
1 10.0 7.1 2.9 164 56<br />
6.9 2 11.1 8.8 2.3 168 46<br />
9.8 1 11.7 9.8 1.9 192 75<br />
9.17 1 9.4 1.4 2.0 153 56<br />
10.2 1 9.0 150 61<br />
689
(B 628) Imprimé en Belgique par Ceuterick s.a.<br />
Brusselsestraat 153 Louvain<br />
Adm.-dir. L. Pitci Bertemcebaan 25 Veltem-Beisem