

Current Population Survey Design and Methodology - Census Bureau
Current Population Survey Design and Methodology - Census Bureau
Current Population Survey Design and Methodology - Census Bureau

You also want an ePaper? Increase the reach of your titles
YUMPU automatically turns print PDFs into web optimized ePapers that Google loves.
espondents, obtaining answers to only a couple of critical<br />
questions. Another change in the data collection procedures<br />
was an increased reliance on using centralized telephone<br />
interviewing. Households not interviewed by the<br />
computer-assisted telephone interviewing (CATI) centers<br />
are recycled back to the field representatives continuously<br />
during the survey week. However, cases recycled late in<br />
the survey week (some reach the field as late as Friday<br />
morning) can present difficulties for the field representatives<br />
because there are only a few days left to make contact<br />
before the end of the interviewing period.<br />
As depicted in Figure 16-2, there has been greater variability<br />
in the monthly Type A nonresponse rates in CPS since<br />
the transition in January 1994. The annual overall Type A<br />
rate, the refusal rate, <strong>and</strong> noncontact rate (which includes<br />
temporarily absent households <strong>and</strong> other noncontacts) are<br />
shown in Table 16−1 for the period 1993−1996 <strong>and</strong> 2003.<br />
Table 16−1. Components of Type A Nonresponse Rates,<br />
Annual Averages for 1993−1996 <strong>and</strong> 2003,<br />
National Estimates<br />
[Percent distribution]<br />
Nonresponse rate 1993 1994 1995 1996 2003<br />
Overall Type A ......... 4.69 6.19 6.86 6.63 7.25<br />
Noncontact ............ 1.77 2.30 2.41 2.28 2.58<br />
Refusal ................ 2.85 3.54 3.89 4.09 4.10<br />
Other .................. .13 .32 .34 .25 .57<br />
Panel nonresponse. Households are selected into the<br />
CPS sample for a total of 8 months in a 4-8-4 pattern as<br />
described in Chapter 3. Many families in these households<br />
may not be in the CPS the entire 8 months because of<br />
moving (movers are not followed, but the new household<br />
members are interviewed). Those who live in the same<br />
household during the entire time they are in the CPS<br />
sample may not agree to be interviewed each month.<br />
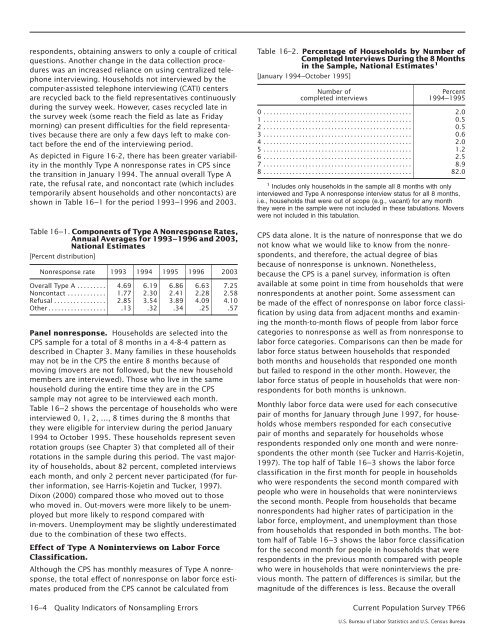
Table 16−2 shows the percentage of households who were<br />
interviewed 0, 1, 2, …, 8 times during the 8 months that<br />
they were eligible for interview during the period January<br />
1994 to October 1995. These households represent seven<br />
rotation groups (see Chapter 3) that completed all of their<br />
rotations in the sample during this period. The vast majority<br />
of households, about 82 percent, completed interviews<br />
each month, <strong>and</strong> only 2 percent never participated (for further<br />
information, see Harris-Kojetin <strong>and</strong> Tucker, 1997).<br />
Dixon (2000) compared those who moved out to those<br />
who moved in. Out-movers were more likely to be unemployed<br />
but more likely to respond compared with<br />
in-movers. Unemployment may be slightly underestimated<br />
due to the combination of these two effects.<br />
Effect of Type A Noninterviews on Labor Force<br />
Classification.<br />
Although the CPS has monthly measures of Type A nonresponse,<br />
the total effect of nonresponse on labor force estimates<br />
produced from the CPS cannot be calculated from<br />
Table 16–2. Percentage of Households by Number of<br />
Completed Interviews During the 8 Months<br />
in the Sample, National Estimates 1<br />
[January 1994−October 1995]<br />
Number of<br />
completed interviews<br />
Percent<br />
1994−1995<br />
0 .............................................. 2.0<br />
1 .............................................. 0.5<br />
2 .............................................. 0.5<br />
3 .............................................. 0.6<br />
4 .............................................. 2.0<br />
5 .............................................. 1.2<br />
6 .............................................. 2.5<br />
7 .............................................. 8.9<br />
8 .............................................. 82.0<br />
1 Includes only households in the sample all 8 months with only<br />
interviewed <strong>and</strong> Type A nonresponse interview status for all 8 months,<br />
i.e., households that were out of scope (e.g., vacant) for any month<br />
they were in the sample were not included in these tabulations. Movers<br />
were not included in this tabulation.<br />
CPS data alone. It is the nature of nonresponse that we do<br />
not know what we would like to know from the nonrespondents,<br />
<strong>and</strong> therefore, the actual degree of bias<br />
because of nonresponse is unknown. Nonetheless,<br />
because the CPS is a panel survey, information is often<br />
available at some point in time from households that were<br />
nonrespondents at another point. Some assessment can<br />
be made of the effect of nonresponse on labor force classification<br />
by using data from adjacent months <strong>and</strong> examining<br />
the month-to-month flows of people from labor force<br />
categories to nonresponse as well as from nonresponse to<br />
labor force categories. Comparisons can then be made for<br />
labor force status between households that responded<br />
both months <strong>and</strong> households that responded one month<br />
but failed to respond in the other month. However, the<br />
labor force status of people in households that were nonrespondents<br />
for both months is unknown.<br />
Monthly labor force data were used for each consecutive<br />
pair of months for January through June 1997, for households<br />
whose members responded for each consecutive<br />
pair of months <strong>and</strong> separately for households whose<br />
respondents responded only one month <strong>and</strong> were nonrespondents<br />
the other month (see Tucker <strong>and</strong> Harris-Kojetin,<br />
1997). The top half of Table 16−3 shows the labor force<br />
classification in the first month for people in households<br />
who were respondents the second month compared with<br />
people who were in households that were noninterviews<br />
the second month. People from households that became<br />
nonrespondents had higher rates of participation in the<br />
labor force, employment, <strong>and</strong> unemployment than those<br />
from households that responded in both months. The bottom<br />
half of Table 16−3 shows the labor force classification<br />
for the second month for people in households that were<br />
respondents in the previous month compared with people<br />
who were in households that were noninterviews the previous<br />
month. The pattern of differences is similar, but the<br />
magnitude of the differences is less. Because the overall<br />
16–4 Quality Indicators of Nonsampling Errors <strong>Current</strong> <strong>Population</strong> <strong>Survey</strong> TP66<br />
U.S. <strong>Bureau</strong> of Labor Statistics <strong>and</strong> U.S. <strong>Census</strong> <strong>Bureau</strong>


