On the measurement quality of UTC time transfer - BIPM
On the measurement quality of UTC time transfer - BIPM
On the measurement quality of UTC time transfer - BIPM

Create successful ePaper yourself
Turn your PDF publications into a flip-book with our unique Google optimized e-Paper software.
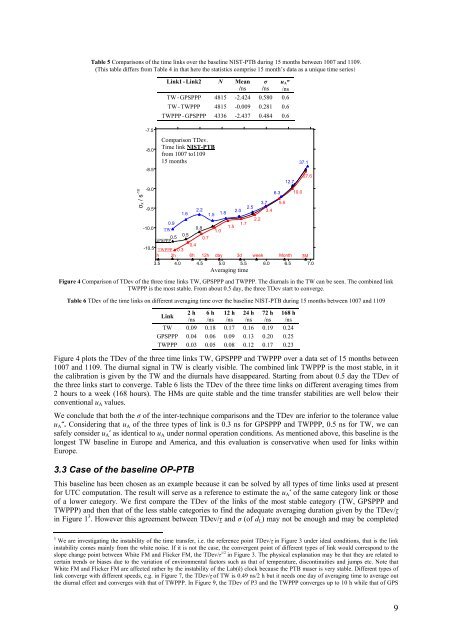
Table 5 Comparisons <strong>of</strong> <strong>the</strong> <strong>time</strong> links over <strong>the</strong> baseline NIST-PTB during 15 months between 1007 and 1109.<br />
(This table differs from Table 4 in that here <strong>the</strong> statistics comprise 15 month’s data as a unique <strong>time</strong> series)<br />
Link1-Link2 N Mean<br />
/ns<br />
σ<br />
/ns<br />
uA”<br />
/ns<br />
TW-GPSPPP 4815 -2.424 0.580 0.6<br />
TW-TWPPP 4815 -0.009 0.281 0.6<br />
TWPPP-GPSPPP 4336 -2.437 0.484 0.6<br />
Figure 4 Comparison <strong>of</strong> TDev <strong>of</strong> <strong>the</strong> three <strong>time</strong> links TW, GPSPPP and TWPPP. The diurnals in <strong>the</strong> TW can be seen. The combined link<br />
TWPPP is <strong>the</strong> most stable. From about 0.5 day, <strong>the</strong> three TDev start to converge.<br />
Table 6 TDev <strong>of</strong> <strong>the</strong> <strong>time</strong> links on different averaging <strong>time</strong> over <strong>the</strong> baseline NIST-PTB during 15 months between 1007 and 1109<br />
Link<br />
2 h<br />
/ns<br />
6 h<br />
/ns<br />
12 h<br />
/ns<br />
24 h<br />
/ns<br />
72 h<br />
/ns<br />
168 h<br />
/ns<br />
TW 0.09 0.18 0.17 0.16 0.19 0.24<br />
GPSPPP 0.04 0.06 0.09 0.13 0.20 0.25<br />
TWPPP 0.03 0.05 0.08 0.12 0.17 0.23<br />
Figure 4 plots <strong>the</strong> TDev <strong>of</strong> <strong>the</strong> three <strong>time</strong> links TW, GPSPPP and TWPPP over a data set <strong>of</strong> 15 months between<br />
1007 and 1109. The diurnal signal in TW is clearly visible. The combined link TWPPP is <strong>the</strong> most stable, in it<br />
<strong>the</strong> calibration is given by <strong>the</strong> TW and <strong>the</strong> diurnals have disappeared. Starting from about 0.5 day <strong>the</strong> TDev <strong>of</strong><br />
<strong>the</strong> three links start to converge. Table 6 lists <strong>the</strong> TDev <strong>of</strong> <strong>the</strong> three <strong>time</strong> links on different averaging <strong>time</strong>s from<br />
2 hours to a week (168 hours). The HMs are quite stable and <strong>the</strong> <strong>time</strong> <strong>transfer</strong> stabilities are well below <strong>the</strong>ir<br />
conventional uA values.<br />
We conclude that both <strong>the</strong> σ <strong>of</strong> <strong>the</strong> inter-technique comparisons and <strong>the</strong> TDev are inferior to <strong>the</strong> tolerance value<br />
uA“. Considering that uA <strong>of</strong> <strong>the</strong> three types <strong>of</strong> link is 0.3 ns for GPSPPP and TWPPP, 0.5 ns for TW, we can<br />
safely consider uA’ as identical to uA under normal operation conditions. As mentioned above, this baseline is <strong>the</strong><br />
longest TW baseline in Europe and America, and this evaluation is conservative when used for links within<br />
Europe.<br />
3.3 Case <strong>of</strong> <strong>the</strong> baseline OP-PTB<br />
σx / s -10<br />
-7.5<br />
-8.0<br />
-8.5<br />
-9.0<br />
Comparison TDev.<br />
Time link NIST-PTB<br />
from 1007 to1109<br />
15 months<br />
0.5 0.5<br />
-9.5<br />
0.9<br />
-10.0 TW<br />
GPSPPP<br />
1.6<br />
2.5<br />
2.2<br />
2.0<br />
1.5<br />
1.8<br />
2.2<br />
1.7<br />
0.8<br />
1.5<br />
1.0<br />
0.7<br />
3.7<br />
3.4<br />
-10.5 TWPPP<br />
0.3<br />
0.4<br />
h 2h 6h 12h day 3d week<br />
3.5 4.0 4.5 5.0 5.5 6.0 6.5<br />
Averaging <strong>time</strong><br />
This baseline has been chosen as an example because it can be solved by all types <strong>of</strong> <strong>time</strong> links used at present<br />
for <strong>UTC</strong> computation. The result will serve as a reference to estimate <strong>the</strong> uA’ <strong>of</strong> <strong>the</strong> same category link or those<br />
<strong>of</strong> a lower category. We first compare <strong>the</strong> TDev <strong>of</strong> <strong>the</strong> links <strong>of</strong> <strong>the</strong> most stable category (TW, GPSPPP and<br />
TWPPP) and <strong>the</strong>n that <strong>of</strong> <strong>the</strong> less stable categories to find <strong>the</strong> adequate averaging duration given by <strong>the</strong> TDev/τ<br />
in Figure 1 3 . However this agreement between TDev/τ and σ (<strong>of</strong> dL) may not be enough and may be completed<br />
3 We are investigating <strong>the</strong> instability <strong>of</strong> <strong>the</strong> <strong>time</strong> <strong>transfer</strong>, i.e. <strong>the</strong> reference point TDev/τ in Figure 3 under ideal conditions, that is <strong>the</strong> link<br />
instability comes mainly from <strong>the</strong> white noise. If it is not <strong>the</strong> case, <strong>the</strong> convergent point <strong>of</strong> different types <strong>of</strong> link would correspond to <strong>the</strong><br />
slope change point between White FM and Flicker FM, <strong>the</strong> TDev/τ 1/2 in Figure 3. The physical explanation may be that <strong>the</strong>y are related to<br />
certain trends or biases due to <strong>the</strong> variation <strong>of</strong> environmental factors such as that <strong>of</strong> temperature, discontinuities and jumps etc. Note that<br />
White FM and Flicker FM are affected ra<strong>the</strong>r by <strong>the</strong> instability <strong>of</strong> <strong>the</strong> Lab(k) clock because <strong>the</strong> PTB maser is very stable. Different types <strong>of</strong><br />
link converge with different speeds, e.g. in Figure 7, <strong>the</strong> TDev/τ <strong>of</strong> TW is 0.49 ns/2 h but it needs one day <strong>of</strong> averaging <strong>time</strong> to average out<br />
<strong>the</strong> diurnal effect and converges with that <strong>of</strong> TWPPP. In Figure 9, <strong>the</strong> TDev <strong>of</strong> P3 and <strong>the</strong> TWPPP converges up to 10 h while that <strong>of</strong> GPS<br />
6.3<br />
5.5<br />
12.7<br />
10.0<br />
37.1<br />
27.6<br />
Month 3M<br />
7.0<br />
9