On the measurement quality of UTC time transfer - BIPM
On the measurement quality of UTC time transfer - BIPM
On the measurement quality of UTC time transfer - BIPM

Create successful ePaper yourself
Turn your PDF publications into a flip-book with our unique Google optimized e-Paper software.
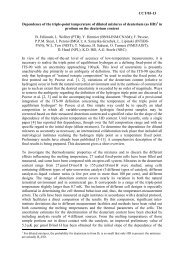
etween 1007 and 1109. The P3 link is more stable than <strong>the</strong> MC link. It converges with TWPPP up to 10 hours.<br />
The TDev <strong>of</strong> <strong>the</strong> three links converge from about 2 days.<br />
Figure 7 TDev <strong>of</strong> GPSMC C/A, GPS P3 and TWPPP over <strong>the</strong> baseline OP-PTB evaluated over 15 months from 1007 to 1109. The P3 link is<br />
more stable than <strong>the</strong> MC. It converges to <strong>the</strong> most stable link TWPPP up to 10 h. The TDev <strong>of</strong> <strong>the</strong> three links converge from about 2 days<br />
Table 7 Statistics <strong>of</strong> all link types and dL on <strong>the</strong> baseline OP-PTB over 15 months between 1007 and 1109.<br />
(See notation for <strong>the</strong> meanings <strong>of</strong> uA, uA’, uA”, σ, σ and TDev/τ etc. A value in <strong>the</strong> table can be labelled by <strong>the</strong> numbers <strong>of</strong> line (A, B, …) and<br />
column (1, 2, …), e.g. <strong>the</strong> uA <strong>of</strong> TWPPP is uA(B2)=0.3 ns; uA”(C2)=1.3 ns, etc.)<br />
Lk2 TW TWPPP GPSGLN MC P3 PPP GLN SC<br />
/ns /ns /ns /ns /ns /ns /ns ns<br />
Lk1 1 2 3 4 5 6 7 8<br />
TW<br />
uA<br />
σ<br />
TDev/τ<br />
uA’<br />
TWPPP<br />
uA”/uA<br />
σ/σ<br />
TDev/τ<br />
uA’<br />
GPSGLN<br />
uA”/uA<br />
σ/σ<br />
TDev/τ<br />
uA’<br />
MC<br />
uA”/uA<br />
σ/σ<br />
TDev/τ<br />
uA’<br />
P3<br />
uA”/uA<br />
σ/σ<br />
TDev/τ<br />
uA’<br />
PPP<br />
uA”/uA<br />
σ/σ<br />
TDev/τ<br />
uA’<br />
GLN<br />
uA”/uA<br />
σ/σ<br />
TDev/τ<br />
uA’<br />
SC<br />
uA”/uA<br />
σ/σ<br />
TDev/τ<br />
uA’<br />
A<br />
B<br />
C<br />
D<br />
E<br />
F<br />
G<br />
H<br />
σx / s -10<br />
-7.6<br />
-8.0<br />
-8.4<br />
TTTT<br />
0.5<br />
0.710<br />
0.40/2 h<br />
0.6<br />
TGTB<br />
0.6<br />
0.664<br />
TRTB<br />
1.3<br />
1.078<br />
TMTA<br />
1.6<br />
1.253<br />
TGTA<br />
0.9<br />
0.886<br />
TGT3<br />
0.7<br />
0.756<br />
TRTR<br />
1.6<br />
1.135<br />
TSTA<br />
3.1<br />
-<br />
-<br />
T3B3<br />
0.3<br />
0.429<br />
0.25/2 h<br />
0.3<br />
2.5<br />
GRBB<br />
1.3<br />
0.852<br />
GMBA<br />
1.6<br />
1.109<br />
GGBA<br />
0.8<br />
0.669<br />
GGB3<br />
0.5<br />
0.705<br />
RGRB<br />
1.6<br />
0.968<br />
GSBA<br />
3.1<br />
-<br />
-<br />
4.0<br />
GRB1<br />
1.2<br />
1.066<br />
0.81/10h<br />
1.0<br />
RMBA<br />
2.0<br />
0.117<br />
RGBA<br />
1.4<br />
1.077<br />
RGB3<br />
1.3<br />
1.161<br />
RRBR<br />
2.0<br />
0.186<br />
RSAR<br />
3.3<br />
-<br />
-<br />
MMMA<br />
1.5<br />
1.154<br />
0.95/10 h<br />
1.5<br />
MPAA<br />
1.7-2.6<br />
0.605?<br />
MGA3<br />
1.6-2.6<br />
1.042<br />
RMRA<br />
2.2<br />
0.277<br />
SMAA<br />
3.4-4.0<br />
-<br />
-<br />
PPPA<br />
0.7<br />
0.744<br />
0.7/10 h<br />
0.7<br />
GGA3<br />
0.8<br />
0.566<br />
RGRA<br />
1.7<br />
0.897<br />
SPAA<br />
3.1<br />
-<br />
-<br />
333A<br />
0.3<br />
0.176<br />
0.31/2 h<br />
0.3<br />
RGR3<br />
1.6<br />
1.027<br />
S3AA<br />
3.1<br />
-<br />
-<br />
RRRC<br />
1.5<br />
1.180<br />
0.94/10 h<br />
1.5<br />
SRAC<br />
3.4-4.0<br />
-<br />
-<br />
SSSA<br />
3.0<br />
2.567<br />
1.1/24 h<br />
2.5<br />
Table 7 provides <strong>the</strong> results <strong>of</strong> <strong>the</strong> statistics <strong>of</strong> all types <strong>of</strong> link and link differences over <strong>the</strong> baseline OP-PTB<br />
during 15 months between 1007 and 1109. The <strong>of</strong>f-diagonal elements list <strong>the</strong> results <strong>of</strong> inter-technique<br />
comparisons while <strong>the</strong> diagonal elements list <strong>the</strong> statistic results <strong>of</strong> <strong>the</strong> reported links. The table is given in <strong>the</strong><br />
form <strong>of</strong> matrix. An element in <strong>the</strong> table can be identified by <strong>the</strong> labels <strong>of</strong> line (A, B, …) and column (1, 2, …),<br />
e.g. for TWPPP uA(B2)=0.3 ns; for GPSGLN uA”(C2)=1.3 ns, etc. The terms, e.g. TTTT(A1), T3B3(B2) etc. are<br />
20.7<br />
33.2<br />
-8.8<br />
13.4 19.7<br />
7.9<br />
GPSMC<br />
-9.2<br />
5.8<br />
GPS P3<br />
7.4<br />
4.9<br />
7.4<br />
5.1<br />
10.4<br />
8.5<br />
6.1 8.6<br />
6.5<br />
12.6<br />
-9.6<br />
Comparison TDev.<br />
Time link OP-PTB<br />
from 1007 to 1109<br />
15 months<br />
TWPPP<br />
51.4<br />
30.6<br />
123<br />
47.6<br />
116<br />
210<br />
206<br />
h 2h 6h 12h day 3d week Month 3M<br />
3.5 4.0 4.5 5.0 5.5 6.0 6.5 7.0<br />
Averaging <strong>time</strong><br />
94<br />
86<br />
11