On the measurement quality of UTC time transfer - BIPM
On the measurement quality of UTC time transfer - BIPM
On the measurement quality of UTC time transfer - BIPM

You also want an ePaper? Increase the reach of your titles
YUMPU automatically turns print PDFs into web optimized ePapers that Google loves.
BUREAU INTERNATIONAL DES POIDS ET MESURES<br />
Rapport <strong>BIPM</strong>-2011/07<br />
<strong>On</strong> <strong>the</strong> <strong>measurement</strong> <strong>quality</strong> <strong>of</strong> <strong>UTC</strong> <strong>time</strong> <strong>transfer</strong><br />
- Evolution and Reevaluation <strong>of</strong> Measurement Uncertainty in [<strong>UTC</strong>-<strong>UTC</strong>(k)]<br />
Z. Jiang and W. Lewandowski<br />
2011<br />
Pavillon de Breteuil, F-92312 SEVRES Cedex<br />
1
<strong>On</strong> <strong>the</strong> <strong>measurement</strong> <strong>quality</strong> <strong>of</strong> <strong>UTC</strong> <strong>time</strong> <strong>transfer</strong><br />
- Evolution and Reevaluation <strong>of</strong> Measurement Uncertainty in [<strong>UTC</strong>-<strong>UTC</strong>(k)]<br />
Z. Jiang and W. Lewandowski<br />
Bureau International des Poids et Mesures (<strong>BIPM</strong>)<br />
Pavillon de Breteuil F-92312, SEVRES CEDEX, France<br />
zjiang@bipm.org<br />
Abstract................................................................................................................................................................... 2<br />
Notation AND ABBREVIATIONS: ............................................................................................................. 3<br />
1. Introduction......................................................................................................................................................... 3<br />
1.1 Background .................................................................................................................................................. 4<br />
1.2 Component <strong>of</strong> uA .......................................................................................................................................... 4<br />
2. Method ................................................................................................................................................................ 5<br />
3. Statistic analysis based on <strong>UTC</strong> data .................................................................................................................. 7<br />
3.1 The data........................................................................................................................................................ 7<br />
3.2 Case <strong>of</strong> <strong>the</strong> baseline NIST-PTB ................................................................................................................... 7<br />
3.3 Case <strong>of</strong> <strong>the</strong> baseline OP-PTB ....................................................................................................................... 9<br />
3.4 Discussion: how good approximations can be obtained by using an optimal Vondrak smoothing............ 12<br />
4. Re-evaluation <strong>of</strong> <strong>the</strong> uA’ for all <strong>the</strong> present <strong>UTC</strong> links...................................................................................... 13<br />
5. Conclusion ........................................................................................................................................................ 14<br />
Reference .............................................................................................................................................................. 15<br />
Annex. Configurations <strong>of</strong> <strong>the</strong> <strong>UTC</strong> worldwide <strong>time</strong> <strong>transfer</strong> networks in 2004 and at present ............................ 16<br />
Abstract<br />
Coordinated Universal Time (<strong>UTC</strong>) is computed at <strong>the</strong> International Bureau <strong>of</strong> Weights and Measures (<strong>BIPM</strong>)<br />
in Sèvres, France. The calculation is derived using data from about four hundred atomic clocks located in<br />
contributor laboratories worldwide. Numerically it is represented by <strong>the</strong> differences between <strong>UTC</strong> and <strong>the</strong> <strong>UTC</strong><br />
realization <strong>of</strong> a contributing laboratory k, [<strong>UTC</strong>-<strong>UTC</strong>(k)]; <strong>the</strong> Type A standard uncertainties <strong>of</strong> <strong>the</strong>se differences,<br />
denoted uA in <strong>BIPM</strong> Circular T, are dominated by <strong>the</strong> uncertainty in <strong>time</strong>-<strong>transfer</strong> <strong>measurement</strong>s accounting for<br />
<strong>measurement</strong> noise and random effects with a typical duration between 1 day and 30 days.<br />
The first global evaluation <strong>of</strong> <strong>the</strong> Type A uncertainty <strong>of</strong> <strong>time</strong> links was published in 2002 and introduced into<br />
Circular T 194 in 2004. Since <strong>the</strong>n <strong>time</strong>-<strong>transfer</strong> techniques have improved significantly, with <strong>the</strong> introduction<br />
into <strong>the</strong> calculation <strong>of</strong> <strong>UTC</strong> <strong>of</strong> new links based on GPS P3, All in View, PPP (Precise Point Positioning), a<br />
combination <strong>of</strong> <strong>the</strong> TW (Two-Way Satellite Time and Frequency Transfer) and GPS carrier phase (TWPPP),<br />
GLONASS and a combination <strong>of</strong> GPS and GLONASS. With <strong>the</strong>se additions <strong>the</strong> configuration <strong>of</strong> <strong>the</strong> <strong>UTC</strong> <strong>time</strong><strong>transfer</strong><br />
network has been transformed to adapt <strong>the</strong>se new developments.<br />
In this paper, we first review <strong>the</strong> Type A uncertainty <strong>of</strong> <strong>time</strong> links evaluation undertaken in 2002 and <strong>the</strong>n <strong>the</strong><br />
Type A uncertainty <strong>of</strong> TWPPP links, which are currently <strong>the</strong> most precise type <strong>of</strong> link available. By selecting<br />
one short and one long baseline where all <strong>the</strong> link types are available, we can estimate <strong>the</strong> uA <strong>of</strong> <strong>the</strong> o<strong>the</strong>r links<br />
relative to <strong>the</strong> TWPPP link and study <strong>the</strong> relationship between <strong>the</strong>se uA and <strong>the</strong> <strong>time</strong> deviation <strong>of</strong> <strong>the</strong> links. From<br />
this relationship we can estimate uA for o<strong>the</strong>r baselines where no TWPPP link is available. Finally, we carry out<br />
a global re-evaluation <strong>of</strong> uA using a method that is consistent for all 67 <strong>UTC</strong> <strong>time</strong> links.<br />
The results obtained were introduced into <strong>the</strong> generation <strong>of</strong> <strong>UTC</strong> in December 2011, with <strong>the</strong> publication <strong>of</strong><br />
Circular T 287. We recommend that such a global re-evaluation <strong>of</strong> uA should be carried out regularly – at least<br />
every four years – for <strong>the</strong> calculation <strong>of</strong> <strong>UTC</strong>.<br />
2
Notation AND ABBREVIATIONS:<br />
GUM 1 : ‘Evaluation <strong>of</strong> <strong>measurement</strong> data - Guide to <strong>the</strong> expression <strong>of</strong> uncertainty in <strong>measurement</strong>’, JCGM (Joint<br />
Committee for Guides in Metrology) 100:2008 [3]<br />
Link: Time-<strong>transfer</strong> link. The result is <strong>the</strong> clock comparison between two laboratories<br />
dL: Time link difference between two Links 1 and 2 <strong>of</strong> a common clock baseline: dL = Link1 – Link2<br />
uA: The Type A standard uncertainty in a ‘link’ as defined between February 2004 and November 2011 and<br />
evaluated in Section 6 <strong>of</strong> <strong>BIPM</strong> Circular T 194-286 [1]. Because it dominates <strong>the</strong> Type A uncertainty in [<strong>UTC</strong>-<br />
<strong>UTC</strong>(k)] and is <strong>the</strong>refore <strong>the</strong> key concept discussed in this paper<br />
uA ’ : The present estimation <strong>of</strong> uA as defined and evaluated in Section 6 <strong>of</strong> Circular T 287 and since December<br />
2011 [20]<br />
uA”: Standard uncertainty <strong>of</strong> dL defined as uA”=√[uA²(Link1) + uA²(Link2)]. It serves in this paper as a criterion<br />
<strong>of</strong> <strong>the</strong> tolerance for <strong>the</strong> outliers in <strong>the</strong> dL<br />
σ: Standard deviation <strong>of</strong> <strong>the</strong> dL<br />
σ: Standard deviation <strong>of</strong> <strong>the</strong> Vondrak smoothing residuals <strong>of</strong> a link<br />
TDev/τ: Time Deviation corresponding to <strong>the</strong> averaging <strong>time</strong> τ indicating <strong>the</strong> flicker PM segment [9,10]<br />
YYMM: Year and month <strong>of</strong> a particular <strong>UTC</strong> computation month, e.g. 1101 stands for January 2011.<br />
TW: TWSTFT, Two-Way Satellite Time and Frequency Transfer<br />
AV: All in View <strong>time</strong> <strong>transfer</strong> [13,14]<br />
CV: Common View <strong>time</strong> <strong>transfer</strong><br />
GPS: US Global Positioning System<br />
GLN: GLONASS, Russian Global Navigation Satellite System<br />
GPSGLN: Combination <strong>of</strong> GPS C/A and GLN L1C codes [6]<br />
SC: Single channel GPS<br />
MC: Multi-channel GPS or GLN receiver<br />
P3: Ionosphere-free code obtained with <strong>the</strong> linear combination <strong>of</strong> <strong>the</strong> two precise codes P1 and P2 [7]<br />
PPP: Time and frequency <strong>transfer</strong> using <strong>the</strong> Precise Point Positioning method [8]<br />
CP: Carrier phase. Used to obtain <strong>the</strong> GPS PPP<br />
TWPPP: Combination <strong>of</strong> TW and CP [5]<br />
HM: Hydrogen-Maser<br />
1. Introduction<br />
According to <strong>the</strong> report from JCGM 100:2008 [3], <strong>the</strong> total uncertainty in a measurand can be considered to<br />
consist <strong>of</strong> two parts [11,12]: <strong>the</strong> Type A component (uA) which is estimated by statistical means, and <strong>the</strong> Type B<br />
component (uB) estimated by o<strong>the</strong>r methods.<br />
In <strong>the</strong> case <strong>of</strong> <strong>UTC</strong>, <strong>the</strong> dominant contributions to both <strong>the</strong> Type A and Type B uncertainties <strong>of</strong> [<strong>UTC</strong>-<strong>UTC</strong>(k)]<br />
relate to <strong>the</strong> <strong>time</strong> links [<strong>UTC</strong>(k)–<strong>UTC</strong>(PTB)] 2 . The evolution, and <strong>the</strong>refore <strong>the</strong> evaluation, <strong>of</strong> <strong>the</strong> uncertainty in<br />
[<strong>UTC</strong>-<strong>UTC</strong>(k)] corresponds almost exactly to that in <strong>the</strong> <strong>time</strong>-<strong>transfer</strong> techniques, although <strong>the</strong> clock weighting<br />
strategy in <strong>the</strong> algorithm <strong>of</strong> <strong>UTC</strong> generation also has some limited impact on uncertainty propagation [12].<br />
Taking examples from Circular T 287 [20], <strong>the</strong> Type A uncertainties <strong>of</strong> [<strong>UTC</strong>-<strong>UTC</strong>(k)] and <strong>of</strong> <strong>the</strong> links<br />
[<strong>UTC</strong>(k)–<strong>UTC</strong>(PTB)] differ by no more than 0.1 ns (see Table 1). The same is true for uB. uB is not discussed in<br />
this paper.<br />
1<br />
GUM 1993, GUM 1995 and JCGM 100:2008 are different editions <strong>of</strong> <strong>the</strong> same document [4].<br />
2<br />
After <strong>the</strong> introduction <strong>of</strong> <strong>the</strong> AV in 2006, all <strong>UTC</strong>(k) are linked directly with PTB (Physikalisch-Technische Bundesanstalt), i.e. [<strong>UTC</strong>(k)–<br />
<strong>UTC</strong>(PTB)], cf. <strong>the</strong> Annex.<br />
3
Table 1 Examples <strong>of</strong> <strong>the</strong> Type A uncertainties (uA) in [<strong>UTC</strong>-<strong>UTC</strong>(k)] and in <strong>the</strong> link [<strong>UTC</strong>(k)–<strong>UTC</strong>(PTB)]<br />
k Link type uA in [<strong>UTC</strong>-<strong>UTC</strong>(k)] /ns uA in link [<strong>UTC</strong>(k)–<strong>UTC</strong>(PTB)]. / ns<br />
USNO PPP 0.3 0.3<br />
NICT TWPPP 0.3 0.3<br />
NIS P3 0.8 0.8<br />
SU GPSGLN 1.0 1.0<br />
NPLI MC 2.0 2.0<br />
ORB PPP 0.4 0.3<br />
NTSC MC 1.5 1.4<br />
Our study <strong>the</strong>refore focuses on <strong>the</strong> determination <strong>of</strong> <strong>the</strong> Type A uncertainty for different types <strong>of</strong> <strong>time</strong> link. It is<br />
based on a previous global study <strong>of</strong> <strong>the</strong> uncertainties [11], undertaken in conformity with GUM [3].<br />
1.1 Background<br />
The <strong>BIPM</strong> has <strong>the</strong> mandate to compute <strong>the</strong> international <strong>time</strong> scale Coordinated Universal Time (<strong>UTC</strong>) in <strong>the</strong><br />
form <strong>of</strong> [<strong>UTC</strong>-<strong>UTC</strong>(k)] and its uncertainty [1,20].<br />
The first global estimation <strong>of</strong> <strong>the</strong> uncertainty <strong>of</strong> <strong>the</strong> <strong>time</strong> links was published in December 2002 [11] based on a<br />
GUM-type analysis [2]). This 2002 evaluation was <strong>of</strong>ficially adopted in Circular T 194 <strong>of</strong> February 2004 [1]. At<br />
that <strong>time</strong> <strong>the</strong>re were 53 <strong>time</strong> links in total: 44 GPS CV links and 9 TW links. The <strong>UTC</strong> <strong>time</strong>-<strong>transfer</strong> network<br />
was structured around four pivotal laboratories: USNO (United States Naval Observatory ), NIST (National<br />
Institute <strong>of</strong> Standards and Technology), CRL (now NICT, National Institute <strong>of</strong> Information and Communications<br />
Technology) and PTB, cf. <strong>the</strong> Annex. The links were classified into four categories according to <strong>the</strong> type <strong>of</strong> link:<br />
(1) TW, (2) GPS CV MC operated under normal conditions, (3) GPS CV SC operated under normal conditions<br />
and (4) GPS links in poor conditions [11]. The number <strong>of</strong> TW <strong>measurement</strong> points was low, with only 2 or 3<br />
points per week, making it difficult to estimate <strong>the</strong> short-term uncertainty <strong>of</strong> TW links. Fur<strong>the</strong>rmore, <strong>the</strong> TW link<br />
<strong>measurement</strong> noise was masked by <strong>the</strong> clock noise so that <strong>the</strong> only indicator, TDev, could be interpreted as <strong>the</strong><br />
maximum uA <strong>of</strong> <strong>the</strong> TW links. Hence, <strong>the</strong> 2002 evaluation was based on <strong>the</strong> TDev over <strong>the</strong> least noisy hydrogen<br />
maser–hydrogen maser baseline available in each category.<br />
Since <strong>the</strong> 2002 evaluation, <strong>time</strong>-<strong>transfer</strong> techniques in <strong>the</strong> generation <strong>of</strong> <strong>UTC</strong> have evolved significantly with <strong>the</strong><br />
introduction <strong>of</strong> P3 CV (2004) [7], GPS All in View (2006) [13,14], PPP (2008) [8,16], TWPPP (2010) [5] as<br />
well as GLN (2009) and GPSGLN (2011) [6,15]. The conventional Type A uncertainties <strong>of</strong> <strong>the</strong>se new<br />
techniques are listed in Table 2. Considering this significant improvement in <strong>time</strong>-<strong>transfer</strong> techniques and <strong>the</strong><br />
possibility <strong>of</strong> directly comparing independent techniques, a new global re-evaluation <strong>of</strong> uA is <strong>time</strong>ly.<br />
Table 2 The Type A standard uncertainties <strong>of</strong> <strong>the</strong> <strong>time</strong>-<strong>transfer</strong> techniques introduced since 2005 in <strong>UTC</strong> <strong>time</strong> links<br />
Type <strong>of</strong> link uA / ns Introduced in<br />
P3 CV/AV 0.7 2004/2006<br />
GPSPPP 0.3 2008<br />
TWPPP 0.3 2011<br />
GLN 1.5 2009<br />
GPSGLN 1.2 2011<br />
1.2 Component <strong>of</strong> uA<br />
At present, <strong>the</strong>re are a total <strong>of</strong> 68 laboratories contributing to <strong>UTC</strong> (67 operational links).<br />
Until <strong>BIPM</strong> Circular T 286 (October 2011), uA was defined in Section 6 [1] as uA is <strong>the</strong> statistical uncertainty<br />
evaluated by taking into account: (1) <strong>the</strong> level <strong>of</strong> phase noise in <strong>the</strong> raw data, (2) <strong>the</strong> interpolation interval<br />
between data points, and (3) effects with typical duration between 5 and 30 days.<br />
In view <strong>of</strong> <strong>the</strong> currently available short <strong>measurement</strong> intervals, item (2) is insignificant: <strong>the</strong> TW <strong>measurement</strong><br />
interval has been reduced from typically 2 to 4 days (in 2002) to 1 to 2 hours [19]; <strong>the</strong> interval for GPS and GLN<br />
codes in CGGTTS format is 16 minutes, and for GPSPPP it is 5 minutes. The interpolation uncertainties are<br />
hence negligible. The third item has generally been determined first through a qualitative analysis <strong>of</strong> <strong>the</strong> main<br />
effects for each technique, and secondly through <strong>the</strong> comparisons <strong>of</strong> <strong>the</strong> independent link technique as well as<br />
<strong>the</strong> <strong>time</strong> series statistics and analysis. As an example, to estimate uA for GPS single frequency code<br />
<strong>measurement</strong>s, we estimate first <strong>the</strong> possible magnitude <strong>of</strong> ionospheric and tropospheric mismodelling and <strong>of</strong><br />
4
multipaths with <strong>the</strong> help <strong>of</strong> <strong>the</strong> geodetic experiences. This result is <strong>the</strong>n confirmed by <strong>the</strong> comparison <strong>of</strong> <strong>the</strong> link<br />
in question to that <strong>of</strong> a higher category. These are completed by <strong>the</strong> information given by <strong>the</strong> TDev and <strong>the</strong><br />
smoothing residual analysis. In this paper, we base our estimates on inter-technique common clock comparisons,<br />
which provide a more objective method <strong>of</strong> estimating <strong>the</strong> uA for a given technique, e.g., short-term comparisons<br />
for <strong>the</strong> <strong>measurement</strong> noise and long-term comparisons for effects with typical duration up to 30 days.<br />
Our new evaluation is <strong>the</strong>refore: “uA is <strong>the</strong> standard uncertainty accounting for <strong>measurement</strong> noise and random<br />
effects with a typical duration between 1 day and 30 days”. Examples <strong>of</strong> random effects include <strong>the</strong> diurnals in<br />
TW and <strong>the</strong> daily and monthly discontinuities in GPSPPP, which cannot easily be seen in <strong>the</strong> averaged or<br />
smoo<strong>the</strong>d results, but which can be observed when analyzing <strong>the</strong> <strong>time</strong> deviations TDev or by comparing TW and<br />
GPSPPP data.<br />
Although <strong>UTC</strong> <strong>time</strong> links are computed using <strong>the</strong> smoo<strong>the</strong>d data, <strong>the</strong> estimate <strong>of</strong> uA is based on <strong>the</strong> raw<br />
<strong>measurement</strong> data so our evaluation still has a margin or acceptable error.<br />
In Section 2<strong>the</strong> method used for <strong>the</strong> re-evaluation is presented. In Section 3 <strong>the</strong> numerical analysis and <strong>the</strong><br />
statistical results for two selected baselines is given, while in Section 4 <strong>the</strong> uA’ evaluation for all <strong>the</strong> <strong>UTC</strong> links is<br />
provided and finally we draw our conclusions.<br />
2. Method<br />
The method to evaluate uA under <strong>the</strong> new definition by using a consistent method is presented. The major<br />
difficulty remains <strong>the</strong> same as in 2002, that is that <strong>the</strong> instabilities <strong>of</strong> <strong>the</strong> linked clocks may affect <strong>the</strong> estimation<br />
<strong>of</strong> uA <strong>of</strong> <strong>the</strong> links. However, compared to <strong>the</strong> 2002 evaluation, <strong>the</strong> situation has improved significantly:<br />
1) As shown in Table 2, <strong>the</strong> precision <strong>of</strong> <strong>the</strong> GPS CP solution PPP has improved by one order <strong>of</strong> magnitude, and<br />
<strong>the</strong> number <strong>of</strong> TW <strong>measurement</strong>s has increased thirty-fold. As <strong>the</strong> highest category, <strong>the</strong>se two techniques<br />
supply a good scale to evaluate each o<strong>the</strong>r and <strong>the</strong> lower categories by analyzing dL; this occurs because more<br />
than one third <strong>of</strong> <strong>the</strong> <strong>UTC</strong> laboratories operate at least one backup <strong>time</strong> <strong>transfer</strong> technique. This rich<br />
redundant data allows us to study <strong>the</strong> <strong>measurement</strong> uncertainty through a comparison <strong>of</strong> <strong>the</strong> independent<br />
<strong>time</strong> links;<br />
2) Long-term link comparisons have being computed since 2005 on a monthly basis and since 2008 statistically<br />
analyzed. The results, including <strong>the</strong> plots and <strong>the</strong> ASCII data <strong>of</strong> <strong>the</strong> <strong>of</strong>ficial <strong>UTC</strong> and certain back-up links,<br />
link differences (dL), Modified Allan Deviation and Time Deviation are published monthly on <strong>the</strong> <strong>BIPM</strong> ftp<br />
site: ftp://tai.bipm.org/TimeLink/LkC/ and ftp://tai.bipm.org/TimeLink/LkC/LongTerm/ [18]. This gives an<br />
easy and precise way to assess <strong>the</strong> <strong>quality</strong> <strong>of</strong> <strong>the</strong> <strong>time</strong> links and <strong>the</strong> related clocks based on <strong>the</strong>ir historical<br />
behaviors;<br />
3) The number <strong>of</strong> laboratories equipped with masers has been greatly increased. Following <strong>the</strong> introduction <strong>of</strong><br />
<strong>the</strong> AV [13, 14] in 2006, PTB was <strong>the</strong> only pivotal laboratory in <strong>the</strong> <strong>UTC</strong> world-wide <strong>time</strong> <strong>transfer</strong> network,<br />
and since 2011 its master clock has been a very stable hydrogen maser (HM). This suggests that only <strong>the</strong><br />
Lab(k) clock, if it is unstable, may impact <strong>the</strong> uA’ evaluation. Through <strong>the</strong> accuracy and number <strong>of</strong> masers<br />
used by contributing laboratories any clock instability affects <strong>the</strong> uA less than it did previously as<br />
demonstrated by <strong>the</strong> 2002 calculation.<br />
The 2002 evaluation scheme consisted firstly <strong>of</strong> classifying <strong>the</strong> links into four categories according to <strong>the</strong>ir<br />
<strong>measurement</strong> <strong>quality</strong> (Table 3) and <strong>the</strong>n studying <strong>the</strong> relationship between <strong>the</strong> link uncertainty and its TDev<br />
through some selected baselines where all <strong>the</strong> types and <strong>the</strong> categories <strong>of</strong> <strong>the</strong> links are available. The master<br />
clocks are stable to identify <strong>the</strong> white noise and <strong>the</strong> biases in link <strong>measurement</strong>s. The classical statistical<br />
information, such as <strong>the</strong> standard deviation <strong>of</strong> <strong>the</strong> smoothing residuals etc., is also shown.<br />
Table 3 The four categories <strong>of</strong> links, grouped according to <strong>the</strong>ir ‘old’ uA values which are considered as <strong>the</strong> a priori<br />
values for <strong>the</strong> new evaluation<br />
Category Type <strong>of</strong> link uA / ns<br />
Ia TW, GPSPPP, TWPPP 0.3 to 0.6<br />
Ib TW 0.6 to 1.0<br />
II P3 0.7 to 1.0<br />
III GPSGLN, GPSMC 1.2 to 1.5<br />
IV GPSMC, GPSSC > 1.5<br />
TWPPP and PPP are <strong>the</strong> most precise techniques and can be used to estimate <strong>the</strong> uA <strong>of</strong> each o<strong>the</strong>r and <strong>of</strong> <strong>the</strong> less<br />
stable categories. The uA <strong>of</strong> <strong>the</strong> PPP links has been estimated previously through geodetic and <strong>time</strong>-<strong>transfer</strong><br />
5
experiments [16]. To better characterize <strong>the</strong> uncertainty <strong>of</strong> a link and its components, we select two baselines –<br />
one short and one long - between laboratories NIST, OP (Observatoire de Paris) and PTB where all <strong>the</strong> link<br />
types and stable maser clocks are available. We <strong>the</strong>n estimate <strong>the</strong> uA’ <strong>of</strong> a link, e.g. a P3 link, by comparing it to<br />
<strong>the</strong> TWPPP link, and considering its relationship to <strong>the</strong> TDev obtained using only <strong>the</strong> P3 raw <strong>measurement</strong> data.<br />
In turn we can use this relationship to estimate <strong>the</strong> uA’ for o<strong>the</strong>r P3 links where TWPPP data are not available.<br />
That is, <strong>the</strong> TDev is first validated by <strong>the</strong> dL analysis <strong>of</strong> <strong>the</strong> selected baselines and <strong>the</strong>n used as a general case. In<br />
this study, we analyze all <strong>UTC</strong> links for which continued data are available for at least nine months. If necessary,<br />
we consulted <strong>the</strong> historical behaviors <strong>of</strong> <strong>the</strong> link, using data held on <strong>the</strong> <strong>BIPM</strong> ftp server [18].<br />
The re-evaluation is realized through <strong>the</strong> following steps:<br />
� The old estimation values <strong>of</strong> uA are used as <strong>the</strong> a priori uA’ (Table 3);<br />
� The uA’ <strong>of</strong> TW, GPSPPP and TWPPP links are established first, by analyzing <strong>the</strong> NIST-PTB baseline<br />
for fifteen months (1007 to 1109);<br />
� The baseline OP-PTB, where all <strong>the</strong> techniques are available (GPS SC, MC, P3, PPP, GLN MC, TW<br />
and <strong>the</strong> combined solutions TWPPP and GPSGLN), is analyzed using <strong>the</strong> uA’ <strong>of</strong> TWPPP as a reference;<br />
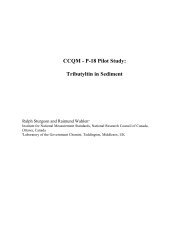
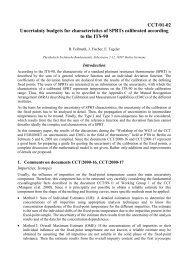
� The relationship between <strong>the</strong> TDev <strong>of</strong> <strong>the</strong> raw data and <strong>the</strong> σ <strong>of</strong> dL vs. TWPPP is investigated. Here we<br />
take <strong>the</strong> slope change in Figure 1, termed TDev/τ, between Flicker PM and White FM as <strong>the</strong> reference<br />
point for <strong>the</strong> estimation <strong>of</strong> uA’. TDev/τ is used for <strong>the</strong> estimation <strong>of</strong> uA’ <strong>of</strong> <strong>the</strong> less stable categories. The<br />
values will be confirmed initially by comparison with <strong>the</strong> TWPPP or GPSPPP in <strong>the</strong> selected test<br />
baselines. Fifteen months data (1007-1109) were used for this detailed numerical analysis;<br />
� The 67 <strong>UTC</strong> links were re-evaluated based on <strong>the</strong> TDev analysis with <strong>the</strong> raw link data. At least nine<br />
months <strong>of</strong> data (1101 to 1109) were used;<br />
For dL analysis (<strong>the</strong> inter-technique link comparisons), smoo<strong>the</strong>d data were considered, using <strong>the</strong> standard<br />
Vondrak parameters for <strong>the</strong> <strong>UTC</strong> link computations. Raw link data were used for TDev.<br />
-9<br />
2 GPSGLN<br />
13ns<br />
-11<br />
-13<br />
-15<br />
Agrees with classical<br />
variance at τ 0<br />
White PM<br />
τ -1/2<br />
Variance <strong>of</strong><br />
<strong>the</strong> Mean<br />
Flicker FM<br />
Flicker PM<br />
τ 0<br />
White FM<br />
τ 1/2<br />
•<br />
reference point for uA‘<br />
estimation TDev/τ<br />
After Allan et al. FCS 1991<br />
0 2 4 6 8<br />
log τ<br />
Figure 1 TVar optimally estimates <strong>time</strong> instability with White PM and distinguishes o<strong>the</strong>r noise types<br />
Finally, we consider <strong>the</strong> basic tool we used. The TDev, square root <strong>of</strong> <strong>the</strong> Time Allan Variation (TVar), is<br />
particularly useful for measuring <strong>the</strong> stability <strong>of</strong> a <strong>time</strong> distribution network. Time <strong>transfer</strong> systems, such as<br />
GNSS codes used in <strong>the</strong> CV or AV modes, are well modeled using white-noises PM [9]. As illustrated in<br />
Figure 1, <strong>the</strong> bottom end <strong>of</strong> <strong>the</strong> variance ranges show those points where <strong>the</strong>se variances are no longer<br />
convergent. It allows <strong>the</strong> white phase, flicker phase and random walk phase to be distinguished. These three<br />
noise processes are particularly useful models for systems where <strong>time</strong> <strong>measurement</strong>s are important. Here we take<br />
<strong>the</strong> slope change, termed TDev/τ, between Flicker PM and White FM as <strong>the</strong> reference point for <strong>the</strong> uA’<br />
estimation. In <strong>the</strong> following, TDev/τ is used for <strong>the</strong> estimation <strong>of</strong> <strong>the</strong> low categories. The TDev suggested<br />
estimates should first be validated by <strong>the</strong> comparison to <strong>the</strong> TWPPP or GPSPPP in <strong>the</strong> selected test baselines<br />
before using in general cases.<br />
τ 1<br />
RW FM<br />
τ 3/2<br />
6
3. Statistic analysis based on <strong>UTC</strong> data<br />
3.1 The data<br />
Two sets <strong>of</strong> <strong>the</strong> <strong>UTC</strong> <strong>time</strong> links have been exhaustively analyzed. The 15 months’ data set between 1007 and<br />
1109 is available for a dozen <strong>of</strong> baselines <strong>of</strong> <strong>the</strong> most stable category. The nine months’ data set between 1101<br />
and 1109 were used for lower category <strong>time</strong> links. All <strong>the</strong> results are given in <strong>the</strong> Rapport <strong>BIPM</strong> [17]. Many<br />
analyses have been performed and <strong>the</strong>y cannot be all presented in this paper. We discuss <strong>the</strong>refore <strong>the</strong> examples<br />
<strong>of</strong> two typical long and short baselines NIST-PTB and OP-PTB to show <strong>the</strong> application <strong>of</strong> <strong>the</strong> method in <strong>the</strong><br />
re-evaluation.<br />
3.2 Case <strong>of</strong> <strong>the</strong> baseline NIST-PTB<br />
NIST-PTB is a HM to HM baseline operating TW and GPSPPP. TWPPP has been used for <strong>the</strong> <strong>UTC</strong><br />
computation since 1101. The present uA values for TW, GPSPPP and TWPPP are respectively 0.5 ns, 0.3 ns and<br />
0.3 ns, as given in Table 3. We prove in this section if <strong>the</strong> above uA a priori is correct. The NIST-PTB baseline is<br />
one <strong>of</strong> <strong>the</strong> longest baselines and hence <strong>the</strong> conclusions drawn here and used for shorter baselines <strong>of</strong> <strong>the</strong> same<br />
category should be correct.<br />
The major disturbances <strong>of</strong> TW are <strong>the</strong> diurnals [5] <strong>the</strong> cause <strong>of</strong> which is not clear. The amplitudes may be up to<br />
0.5 ns or even bigger. This disturbance can be reduced by averaging or smoothing in <strong>the</strong> standard <strong>UTC</strong> link<br />
procedures but <strong>the</strong> result may still be biased. The major problem with GPSPPP is <strong>the</strong> discontinuity between <strong>the</strong><br />
consecutive intervals <strong>of</strong> computation due to residual noise in <strong>the</strong> code <strong>measurement</strong>s and possible frequency shift<br />
in <strong>the</strong> GPS receiver [16]. Such discontinuities can some<strong>time</strong>s reach 0.5 ns.<br />
Table 4 shows <strong>the</strong> monthly comparisons <strong>of</strong> <strong>the</strong> <strong>time</strong> links over <strong>the</strong> baseline NIST-PTB during <strong>the</strong> 15 months<br />
between 1007 and 1109. By <strong>the</strong> notation, <strong>the</strong> combined uncertainty in dL can be computed by using <strong>the</strong><br />
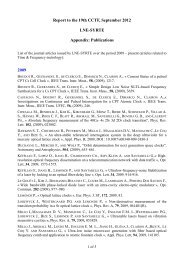
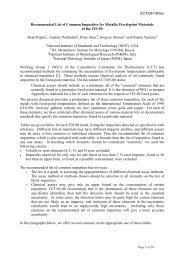
propagation law: uA”= √[uA²(TW)+uA²(PPP)]= 0.58 ns < 0.6 ns. Figure 2 demonstrates <strong>the</strong> 15 months’ point to<br />
point comparison <strong>of</strong> <strong>the</strong> <strong>time</strong> links between TW (black crosses) and GPSPPP (blue points) over <strong>the</strong> baseline<br />
NIST-PTB from 1007 to 1109. Figure 3 illustrates <strong>the</strong> distribution <strong>of</strong> <strong>the</strong> monthly mean values given in Table 4.<br />
The TW data is noisier than GPSPPP. The latter however presents several discontinuities about MJD 55700. In<br />
<strong>the</strong> Table 4, <strong>the</strong> only case <strong>of</strong> σ > uA” is in TW-GPSPPP in 1012. Its σ is 0.726 ns. As illustrated in Figure 2, this<br />
large σ is due to outliers. Towards <strong>the</strong> end <strong>of</strong> 1012, <strong>the</strong>re were several outliers around MJD 55555 in which <strong>the</strong><br />
TW caused <strong>the</strong> bigger σ. It appears that <strong>the</strong> automatic cleaning TW raw data function in <strong>the</strong> <strong>UTC</strong> computation<br />
s<strong>of</strong>tware, Ts<strong>of</strong>t, was not operating correctly, o<strong>the</strong>rwise <strong>the</strong>se outliers would have been rejected. The biggest σ <strong>of</strong><br />
link differences between TW-TWPPP and TWPPP-GPSPPP is 0.476 ns in 1007. Depending on <strong>the</strong> algorithm<br />
used for <strong>the</strong> combined solution, <strong>the</strong> σ <strong>of</strong> <strong>the</strong> link difference TWPPP-GPSPPP is always smaller than that <strong>of</strong><br />
TW-GPSPPP. The monthly analysis suggests that <strong>the</strong> ‘old’ uA <strong>of</strong> 0.5 ns for TW and 0.3 ns for GPSPPP is<br />
reasonable even with <strong>the</strong> presence <strong>of</strong> <strong>the</strong> diurnals in TW and <strong>the</strong> discontinuities in GPSPPP.<br />
ns<br />
6.0<br />
4.0<br />
2.0<br />
0.0<br />
-2.0<br />
-4.0<br />
-6.0<br />
-8.0<br />
-10.0<br />
-12.0<br />
TW<br />
PPP<br />
55450 55500 55550 55600 55650 55700 55750 55800<br />
MJD<br />
Figure 2 15 months’ point to point comparison <strong>of</strong> <strong>the</strong> <strong>time</strong> links TW (lower black crosses) and GPSPPP (upper blue points) over <strong>the</strong> baseline<br />
NIST-PTB from 1007 to 1109. The TW data are noisy, e.g. <strong>the</strong> outliers around MJD 55555. The GPSPPP demonstrates <strong>the</strong> typical day and<br />
monthly boundary discontinuities, e.g. near MJD 55680. The diurnals in TW and <strong>the</strong> discontinuities in GPSPPP are all masked by <strong>the</strong> σ <strong>of</strong><br />
<strong>the</strong> dL and have been taken into account in <strong>the</strong> re-evaluated uA’ budget in <strong>the</strong> term ‘random effects with typical duration between 1 and 30<br />
days’<br />
7
Table 4 Monthly comparisons <strong>of</strong> <strong>the</strong> <strong>time</strong> links over <strong>the</strong> baseline NIST-PTB during 15 months between 1007 and 1109<br />
N is <strong>the</strong> number <strong>of</strong> <strong>the</strong> points to be compared. Note that <strong>the</strong> Mean <strong>of</strong> TWPPP agrees with TW because <strong>the</strong> calibration <strong>of</strong> <strong>the</strong> combination<br />
TWPPP is defined by TW. There is a σ > uA” (0.6 ns) only in 1012 (see <strong>the</strong> Notation for definitions <strong>of</strong> σ and uA”). The mean value <strong>of</strong> TW-<br />
GPSPPP is -2.38±0.44 ns which can be considered as <strong>the</strong> calibration difference. The mean value <strong>of</strong> <strong>the</strong> σ <strong>of</strong> TW-GPSPPP is 0.41±0.12<br />
which is bigger than that <strong>of</strong> TW-TWPPP and TWPPP-GPSPPP 0.30±0.11 ns and 0.22±0.08 ns, respectively. This suggests that <strong>the</strong> TWPPP<br />
keeps <strong>the</strong> calibration <strong>of</strong> TW and its precision approximates GPSPPP<br />
yymm Link1-Link2 N<br />
Mean<br />
/ns<br />
σ<br />
/ns<br />
TW-GPSPPP 346 -2.072 0.542<br />
1007 TW-TWPPP 346 0.000 0.476<br />
TWPPP-GPSPPP 345 -2.072 0.214<br />
TW-GPSPPP 439 -2.209 0.411<br />
1008 TW-TWPPP 439 0.000 0.315<br />
TWPPP-GPSPPP 438 -2.209 0.215<br />
TW-GPSPPP 377 -2.949 0.350<br />
1009 TW-TWPPP 377 -0.002 0.266<br />
TWPPP-GPSPPP 370 -2.949 0.164<br />
TW-GPSPPP 370 -2.829 0.461<br />
1010 TW-TWPPP 370 -0.000 0.309<br />
TWPPP-GPSPPP 369 -2.827 0.285<br />
TW-GPSPPP 312 -2.424 0.440<br />
1011 TW-TWPPP 312 -0.000 0.259<br />
TWPPP-GPSPPP 408 -2.413 0.324<br />
TW-GPSPPP 375 -2.348 0.726<br />
1012 TW-TWPPP 375 -0.000 0.590<br />
TWPPP-GPSPPP 374 -2.345 0.359<br />
TW-GPSPPP 373 -2.999 0.521<br />
1101 TW-TWPPP 373 -0.000 0.427<br />
TWPPP-GPSPPP 372 -3.000 0.229<br />
TW-GPSPPP 358 -2.406 0.364<br />
1102 TW-TWPPP 358 -0.000 0.289<br />
TWPPP-GPSPPP 357 -2.406 0.173<br />
yymm Link1-Link2 N<br />
Mean<br />
/ns<br />
σ<br />
/ns<br />
TW-GPSPPP 358 -2.418 0.331<br />
1103 TW-TWPPP 358 -0.000 0.237<br />
TWPPP-GPSPPP 357 -2.418 0.183<br />
TW-GPSPPP 377 -2.399 0.418<br />
1104 TW-TWPPP 377 -0.001 0.247<br />
TWPPP-GPSPPP 408 -2.389 0.263<br />
TW-GPSPPP 356 -2.763 0.413<br />
1105 TW-TWPPP 356 -0.000 0.211<br />
TWPPP-GPSPPP 355 -2.762 0.313<br />
TW-GPSPPP 374 -1.686 0.221<br />
1106 TW-TWPPP 374 -0.000 0.166<br />
TWPPP-GPSPPP 373 -1.685 0.105<br />
TW-GPSPPP 349 -1.412 0.252<br />
1107 TW-TWPPP 349 -0.000 0.192<br />
TWPPP-GPSPPP 408 -1.422 0.103<br />
TW-GPSPPP 432 -2.129 0.396<br />
1108 TW-TWPPP 432 0.001 0.301<br />
TWPPP-GPSPPP 468 -2.115 0.233<br />
TW-GPSPPP 355 -2.621 0.317<br />
1109 TW-TWPPP 355 0.000 0.290<br />
TWPPP-GPSPPP 408 -2.636 0.111<br />
Mean TW-GPSPPP 370 -2.38±0.44 0.41±0.12<br />
<strong>of</strong> 15 TW-TWPPP 370 0.00±0.00 0.30±0.11<br />
months TWPPP-GPSPPP 387 -2.38±0.44 0.22±0.08<br />
Table 5 shows <strong>the</strong> results <strong>of</strong> <strong>the</strong> comparison between different types <strong>of</strong> <strong>time</strong> links over <strong>the</strong> baseline NIST-PTB<br />
during 15 months between 1007 and 1109. Unlike Table 4, <strong>the</strong> statistics (mean and σ) are made with a unique<br />
<strong>time</strong> series <strong>of</strong> 15 continuous months. As can be seen in <strong>the</strong> table, it always holds that σ < uA”. The biggest σ<br />
value is 0.580 ns for <strong>the</strong> comparison TW-GPSPPP. The σ also masks <strong>the</strong> middle-term (up to 30 days) and longterm<br />
(over 1 year) variations (or biases) between TW and GPSPPP.<br />
ns<br />
-1,2<br />
-1,4<br />
-1,6<br />
-1,8<br />
-2<br />
-2,2<br />
-2,4<br />
-2,6<br />
-2,8<br />
-3<br />
-3,2<br />
1007 1009 1011 1101 1103 1105 1107 1109<br />
Figure 3 15 monthly mean values <strong>of</strong> <strong>the</strong> differences TW-GPSPPP in Table 4. c.f. <strong>the</strong> notation for <strong>the</strong> definition <strong>of</strong> <strong>the</strong> combined uncertainty<br />
uA” (0.6 ns). Certain systematical variation presents and reaches maximum in 1106 and 1107 (June and July 2011)<br />
+ uA”<br />
- uA”<br />
8
Table 5 Comparisons <strong>of</strong> <strong>the</strong> <strong>time</strong> links over <strong>the</strong> baseline NIST-PTB during 15 months between 1007 and 1109.<br />
(This table differs from Table 4 in that here <strong>the</strong> statistics comprise 15 month’s data as a unique <strong>time</strong> series)<br />
Link1-Link2 N Mean<br />
/ns<br />
σ<br />
/ns<br />
uA”<br />
/ns<br />
TW-GPSPPP 4815 -2.424 0.580 0.6<br />
TW-TWPPP 4815 -0.009 0.281 0.6<br />
TWPPP-GPSPPP 4336 -2.437 0.484 0.6<br />
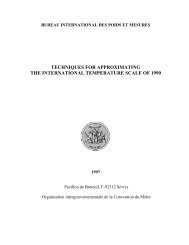
Figure 4 Comparison <strong>of</strong> TDev <strong>of</strong> <strong>the</strong> three <strong>time</strong> links TW, GPSPPP and TWPPP. The diurnals in <strong>the</strong> TW can be seen. The combined link<br />
TWPPP is <strong>the</strong> most stable. From about 0.5 day, <strong>the</strong> three TDev start to converge.<br />
Table 6 TDev <strong>of</strong> <strong>the</strong> <strong>time</strong> links on different averaging <strong>time</strong> over <strong>the</strong> baseline NIST-PTB during 15 months between 1007 and 1109<br />
Link<br />
2 h<br />
/ns<br />
6 h<br />
/ns<br />
12 h<br />
/ns<br />
24 h<br />
/ns<br />
72 h<br />
/ns<br />
168 h<br />
/ns<br />
TW 0.09 0.18 0.17 0.16 0.19 0.24<br />
GPSPPP 0.04 0.06 0.09 0.13 0.20 0.25<br />
TWPPP 0.03 0.05 0.08 0.12 0.17 0.23<br />
Figure 4 plots <strong>the</strong> TDev <strong>of</strong> <strong>the</strong> three <strong>time</strong> links TW, GPSPPP and TWPPP over a data set <strong>of</strong> 15 months between<br />
1007 and 1109. The diurnal signal in TW is clearly visible. The combined link TWPPP is <strong>the</strong> most stable, in it<br />
<strong>the</strong> calibration is given by <strong>the</strong> TW and <strong>the</strong> diurnals have disappeared. Starting from about 0.5 day <strong>the</strong> TDev <strong>of</strong><br />
<strong>the</strong> three links start to converge. Table 6 lists <strong>the</strong> TDev <strong>of</strong> <strong>the</strong> three <strong>time</strong> links on different averaging <strong>time</strong>s from<br />
2 hours to a week (168 hours). The HMs are quite stable and <strong>the</strong> <strong>time</strong> <strong>transfer</strong> stabilities are well below <strong>the</strong>ir<br />
conventional uA values.<br />
We conclude that both <strong>the</strong> σ <strong>of</strong> <strong>the</strong> inter-technique comparisons and <strong>the</strong> TDev are inferior to <strong>the</strong> tolerance value<br />
uA“. Considering that uA <strong>of</strong> <strong>the</strong> three types <strong>of</strong> link is 0.3 ns for GPSPPP and TWPPP, 0.5 ns for TW, we can<br />
safely consider uA’ as identical to uA under normal operation conditions. As mentioned above, this baseline is <strong>the</strong><br />
longest TW baseline in Europe and America, and this evaluation is conservative when used for links within<br />
Europe.<br />
3.3 Case <strong>of</strong> <strong>the</strong> baseline OP-PTB<br />
σx / s -10<br />
-7.5<br />
-8.0<br />
-8.5<br />
-9.0<br />
Comparison TDev.<br />
Time link NIST-PTB<br />
from 1007 to1109<br />
15 months<br />
0.5 0.5<br />
-9.5<br />
0.9<br />
-10.0 TW<br />
GPSPPP<br />
1.6<br />
2.5<br />
2.2<br />
2.0<br />
1.5<br />
1.8<br />
2.2<br />
1.7<br />
0.8<br />
1.5<br />
1.0<br />
0.7<br />
3.7<br />
3.4<br />
-10.5 TWPPP<br />
0.3<br />
0.4<br />
h 2h 6h 12h day 3d week<br />
3.5 4.0 4.5 5.0 5.5 6.0 6.5<br />
Averaging <strong>time</strong><br />
This baseline has been chosen as an example because it can be solved by all types <strong>of</strong> <strong>time</strong> links used at present<br />
for <strong>UTC</strong> computation. The result will serve as a reference to estimate <strong>the</strong> uA’ <strong>of</strong> <strong>the</strong> same category link or those<br />
<strong>of</strong> a lower category. We first compare <strong>the</strong> TDev <strong>of</strong> <strong>the</strong> links <strong>of</strong> <strong>the</strong> most stable category (TW, GPSPPP and<br />
TWPPP) and <strong>the</strong>n that <strong>of</strong> <strong>the</strong> less stable categories to find <strong>the</strong> adequate averaging duration given by <strong>the</strong> TDev/τ<br />
in Figure 1 3 . However this agreement between TDev/τ and σ (<strong>of</strong> dL) may not be enough and may be completed<br />
3 We are investigating <strong>the</strong> instability <strong>of</strong> <strong>the</strong> <strong>time</strong> <strong>transfer</strong>, i.e. <strong>the</strong> reference point TDev/τ in Figure 3 under ideal conditions, that is <strong>the</strong> link<br />
instability comes mainly from <strong>the</strong> white noise. If it is not <strong>the</strong> case, <strong>the</strong> convergent point <strong>of</strong> different types <strong>of</strong> link would correspond to <strong>the</strong><br />
slope change point between White FM and Flicker FM, <strong>the</strong> TDev/τ 1/2 in Figure 3. The physical explanation may be that <strong>the</strong>y are related to<br />
certain trends or biases due to <strong>the</strong> variation <strong>of</strong> environmental factors such as that <strong>of</strong> temperature, discontinuities and jumps etc. Note that<br />
White FM and Flicker FM are affected ra<strong>the</strong>r by <strong>the</strong> instability <strong>of</strong> <strong>the</strong> Lab(k) clock because <strong>the</strong> PTB maser is very stable. Different types <strong>of</strong><br />
link converge with different speeds, e.g. in Figure 7, <strong>the</strong> TDev/τ <strong>of</strong> TW is 0.49 ns/2 h but it needs one day <strong>of</strong> averaging <strong>time</strong> to average out<br />
<strong>the</strong> diurnal effect and converges with that <strong>of</strong> TWPPP. In Figure 9, <strong>the</strong> TDev <strong>of</strong> P3 and <strong>the</strong> TWPPP converges up to 10 h while that <strong>of</strong> GPS<br />
6.3<br />
5.5<br />
12.7<br />
10.0<br />
37.1<br />
27.6<br />
Month 3M<br />
7.0<br />
9
y <strong>the</strong> σ (<strong>of</strong> <strong>the</strong> Vondrak smoothing residuals), cf. notation for <strong>the</strong> meaning <strong>of</strong> each term. All <strong>the</strong>se statistical<br />
results are considered toge<strong>the</strong>r in <strong>the</strong> evaluation <strong>of</strong> <strong>the</strong> uA’ for all types <strong>of</strong> links on this baseline taking into<br />
account <strong>of</strong> <strong>the</strong> values <strong>of</strong> uA”/uA, σ/σ and TDev/τ. Finally, <strong>the</strong> result is used to estimate <strong>the</strong> uA’ for o<strong>the</strong>r <strong>UTC</strong><br />
baselines.<br />
σx / s -10<br />
-7.6<br />
-7.8<br />
-8.0<br />
-8.2<br />
-8.4<br />
-8.6<br />
-8.8<br />
Comparison TDev.<br />
Time link OP-PTB<br />
from 1007 to 1109<br />
15 months<br />
12.5<br />
-9.0<br />
9.3 13.4<br />
7.6<br />
-9.2 4.9<br />
TW 6.0 6.0<br />
8.4<br />
-9.4 3.1<br />
PPP<br />
-9.6<br />
4.1<br />
TWPPP 2.5<br />
3h<br />
-9.8<br />
4.0<br />
6h 12h<br />
4.5<br />
day<br />
5.0<br />
3d<br />
5.5<br />
Week<br />
6.0<br />
Month<br />
6.5<br />
3M<br />
7.0<br />
Averaging <strong>time</strong><br />
Figure 5 TDev <strong>of</strong> TW, GPSPPP and TWPPP over baseline OP-PTB evaluated during 15 months from 1007 to 1109. The TWPPP is <strong>the</strong> most<br />
stable link and is used as <strong>the</strong> <strong>of</strong>ficial <strong>UTC</strong> link and <strong>the</strong> reference scale to study <strong>the</strong> instability <strong>of</strong> o<strong>the</strong>r links. The TW link is noisier than<br />
usual. As given later in Table 7, <strong>the</strong> re-evaluation <strong>of</strong> uA’ suggests 0.6 ns instead <strong>of</strong> <strong>the</strong> conventional value 0.5 ns. The TDev <strong>of</strong> <strong>the</strong> three links<br />
converge from about 16 hours averaging <strong>time</strong>.<br />
Figure 5 shows <strong>the</strong> TDev comparisons <strong>of</strong> TW, GPSPPP and TWPPP <strong>of</strong> <strong>the</strong> baseline OP-PTB during 15 months<br />
between 1007 and 1109. The TW link is ra<strong>the</strong>r noisier than <strong>the</strong> usual case. This can be also be seen by <strong>the</strong> link<br />
comparisons as given in <strong>the</strong> elements A1, B1, B2, F1 and F2 in Table 7. Therefore we suggest uA’(TW) = 0.6 ns<br />
instead <strong>of</strong> <strong>the</strong> present conventional value 0.5 ns, cf. Table 7. The TWPPP is <strong>the</strong> most stable link and is used as<br />
<strong>the</strong> <strong>of</strong>ficial <strong>UTC</strong> link. The TDev <strong>of</strong> <strong>the</strong> three links converge from about 16 hours averaging <strong>time</strong>.<br />
Figure 6 presents TDev comparisons <strong>of</strong> GLN/L1C, GPS C/A and <strong>the</strong> combined solution GPSGLN over <strong>the</strong><br />
baseline OP-PTB during 15 months between 1007 and 1109. As can be seen, <strong>the</strong> combined solution GPSGLN is<br />
<strong>the</strong> most stable and is introduced as <strong>the</strong> <strong>of</strong>ficial <strong>UTC</strong> link for <strong>the</strong> baselines SU-PTB and UME-PTB since<br />
January 2011. Since December 2011, GPSGLN has been introduced for o<strong>the</strong>r 4 baselines CAO-PTB, INPL-<br />
PTB, SMU-PTB and KZ-PTB. The TDev <strong>of</strong> <strong>the</strong> three links converge from about 20 hours averaging <strong>time</strong>.<br />
σx / s -10<br />
-7.6<br />
-7.8<br />
-8.0<br />
-8.2<br />
-8.4<br />
-8.6<br />
-8.8<br />
Comparison TDev.<br />
Time link OP-PTB<br />
from 1007 to 1109<br />
15 months<br />
3.0 3.5 4.0 4.5 5.0 5.5 6.0 6.5 7.0<br />
Averaging <strong>time</strong><br />
Figure 6 TDev <strong>of</strong> GLN/L1C, GPS C/A and GPSGLN over <strong>the</strong> baseline OP-PTB evaluated over 15 months from 1007 to 1109. The<br />
GPSGLN is <strong>the</strong> most stable and is used as <strong>the</strong> <strong>of</strong>ficial <strong>UTC</strong> link. The TDev <strong>of</strong> <strong>the</strong> three links converge from about 1 day<br />
Figure 7 plots <strong>the</strong> TDev <strong>of</strong> GPSMC C/A, GPS P3 and TWPPP over <strong>the</strong> baseline OP-PTB during 15 months<br />
MC and TWPPP up to 2 days. Higher categories converge faster than <strong>the</strong> lower categories. The convergent point <strong>of</strong> <strong>the</strong> link stability would<br />
locate near <strong>the</strong> TDev/τ 0 toward <strong>the</strong> TDev/τ 1/2 .<br />
21.4<br />
19.7<br />
-9.0 GLN L1C 8.1<br />
GPS C/A<br />
-9.2 GPSGLN 7.1<br />
h/2 h<br />
8.5 8.1<br />
8.1 10.3<br />
8.1<br />
6.9<br />
7.1<br />
3h 6h 12h day<br />
13.5<br />
3d Week Month 3M<br />
32<br />
34<br />
20<br />
55<br />
49<br />
30<br />
133<br />
119<br />
48<br />
117<br />
207<br />
213<br />
215<br />
90<br />
94<br />
10
etween 1007 and 1109. The P3 link is more stable than <strong>the</strong> MC link. It converges with TWPPP up to 10 hours.<br />
The TDev <strong>of</strong> <strong>the</strong> three links converge from about 2 days.<br />
Figure 7 TDev <strong>of</strong> GPSMC C/A, GPS P3 and TWPPP over <strong>the</strong> baseline OP-PTB evaluated over 15 months from 1007 to 1109. The P3 link is<br />
more stable than <strong>the</strong> MC. It converges to <strong>the</strong> most stable link TWPPP up to 10 h. The TDev <strong>of</strong> <strong>the</strong> three links converge from about 2 days<br />
Table 7 Statistics <strong>of</strong> all link types and dL on <strong>the</strong> baseline OP-PTB over 15 months between 1007 and 1109.<br />
(See notation for <strong>the</strong> meanings <strong>of</strong> uA, uA’, uA”, σ, σ and TDev/τ etc. A value in <strong>the</strong> table can be labelled by <strong>the</strong> numbers <strong>of</strong> line (A, B, …) and<br />
column (1, 2, …), e.g. <strong>the</strong> uA <strong>of</strong> TWPPP is uA(B2)=0.3 ns; uA”(C2)=1.3 ns, etc.)<br />
Lk2 TW TWPPP GPSGLN MC P3 PPP GLN SC<br />
/ns /ns /ns /ns /ns /ns /ns ns<br />
Lk1 1 2 3 4 5 6 7 8<br />
TW<br />
uA<br />
σ<br />
TDev/τ<br />
uA’<br />
TWPPP<br />
uA”/uA<br />
σ/σ<br />
TDev/τ<br />
uA’<br />
GPSGLN<br />
uA”/uA<br />
σ/σ<br />
TDev/τ<br />
uA’<br />
MC<br />
uA”/uA<br />
σ/σ<br />
TDev/τ<br />
uA’<br />
P3<br />
uA”/uA<br />
σ/σ<br />
TDev/τ<br />
uA’<br />
PPP<br />
uA”/uA<br />
σ/σ<br />
TDev/τ<br />
uA’<br />
GLN<br />
uA”/uA<br />
σ/σ<br />
TDev/τ<br />
uA’<br />
SC<br />
uA”/uA<br />
σ/σ<br />
TDev/τ<br />
uA’<br />
A<br />
B<br />
C<br />
D<br />
E<br />
F<br />
G<br />
H<br />
σx / s -10<br />
-7.6<br />
-8.0<br />
-8.4<br />
TTTT<br />
0.5<br />
0.710<br />
0.40/2 h<br />
0.6<br />
TGTB<br />
0.6<br />
0.664<br />
TRTB<br />
1.3<br />
1.078<br />
TMTA<br />
1.6<br />
1.253<br />
TGTA<br />
0.9<br />
0.886<br />
TGT3<br />
0.7<br />
0.756<br />
TRTR<br />
1.6<br />
1.135<br />
TSTA<br />
3.1<br />
-<br />
-<br />
T3B3<br />
0.3<br />
0.429<br />
0.25/2 h<br />
0.3<br />
2.5<br />
GRBB<br />
1.3<br />
0.852<br />
GMBA<br />
1.6<br />
1.109<br />
GGBA<br />
0.8<br />
0.669<br />
GGB3<br />
0.5<br />
0.705<br />
RGRB<br />
1.6<br />
0.968<br />
GSBA<br />
3.1<br />
-<br />
-<br />
4.0<br />
GRB1<br />
1.2<br />
1.066<br />
0.81/10h<br />
1.0<br />
RMBA<br />
2.0<br />
0.117<br />
RGBA<br />
1.4<br />
1.077<br />
RGB3<br />
1.3<br />
1.161<br />
RRBR<br />
2.0<br />
0.186<br />
RSAR<br />
3.3<br />
-<br />
-<br />
MMMA<br />
1.5<br />
1.154<br />
0.95/10 h<br />
1.5<br />
MPAA<br />
1.7-2.6<br />
0.605?<br />
MGA3<br />
1.6-2.6<br />
1.042<br />
RMRA<br />
2.2<br />
0.277<br />
SMAA<br />
3.4-4.0<br />
-<br />
-<br />
PPPA<br />
0.7<br />
0.744<br />
0.7/10 h<br />
0.7<br />
GGA3<br />
0.8<br />
0.566<br />
RGRA<br />
1.7<br />
0.897<br />
SPAA<br />
3.1<br />
-<br />
-<br />
333A<br />
0.3<br />
0.176<br />
0.31/2 h<br />
0.3<br />
RGR3<br />
1.6<br />
1.027<br />
S3AA<br />
3.1<br />
-<br />
-<br />
RRRC<br />
1.5<br />
1.180<br />
0.94/10 h<br />
1.5<br />
SRAC<br />
3.4-4.0<br />
-<br />
-<br />
SSSA<br />
3.0<br />
2.567<br />
1.1/24 h<br />
2.5<br />
Table 7 provides <strong>the</strong> results <strong>of</strong> <strong>the</strong> statistics <strong>of</strong> all types <strong>of</strong> link and link differences over <strong>the</strong> baseline OP-PTB<br />
during 15 months between 1007 and 1109. The <strong>of</strong>f-diagonal elements list <strong>the</strong> results <strong>of</strong> inter-technique<br />
comparisons while <strong>the</strong> diagonal elements list <strong>the</strong> statistic results <strong>of</strong> <strong>the</strong> reported links. The table is given in <strong>the</strong><br />
form <strong>of</strong> matrix. An element in <strong>the</strong> table can be identified by <strong>the</strong> labels <strong>of</strong> line (A, B, …) and column (1, 2, …),<br />
e.g. for TWPPP uA(B2)=0.3 ns; for GPSGLN uA”(C2)=1.3 ns, etc. The terms, e.g. TTTT(A1), T3B3(B2) etc. are<br />
20.7<br />
33.2<br />
-8.8<br />
13.4 19.7<br />
7.9<br />
GPSMC<br />
-9.2<br />
5.8<br />
GPS P3<br />
7.4<br />
4.9<br />
7.4<br />
5.1<br />
10.4<br />
8.5<br />
6.1 8.6<br />
6.5<br />
12.6<br />
-9.6<br />
Comparison TDev.<br />
Time link OP-PTB<br />
from 1007 to 1109<br />
15 months<br />
TWPPP<br />
51.4<br />
30.6<br />
123<br />
47.6<br />
116<br />
210<br />
206<br />
h 2h 6h 12h day 3d week Month 3M<br />
3.5 4.0 4.5 5.0 5.5 6.0 6.5 7.0<br />
Averaging <strong>time</strong><br />
94<br />
86<br />
11
<strong>the</strong> standard extensions <strong>of</strong> <strong>the</strong> file names <strong>of</strong> <strong>BIPM</strong> link and link comparisons [18], cf. also <strong>the</strong> ReadMe file in<br />
ftp://tai.bipm.org/TimeLink/LkC/.<br />
The TDev <strong>of</strong> TW, GPSPPP and TWPPP for averaging <strong>time</strong> <strong>of</strong> 2 h are 0.40 ns (A1), 0.25 ns (B2) and 0.31 ns<br />
(F6) respectively. However <strong>the</strong> σ (smoothing residuals) and <strong>the</strong> σ demonstrate greater instability as shown in A1,<br />
B1, B2, F1 and F2. Therefore <strong>the</strong> uA’ for TW, GPSPPP and TWPPP are estimated to be 0.6, 0.3 and 0.3 ns higher<br />
than <strong>the</strong> old values: 0.5, 0.3 and 0.3 ns. The reason for this may be found in <strong>the</strong> TW link; <strong>the</strong> <strong>measurement</strong>s were<br />
disturbed for two weeks due to Satellite (T-11N) frequency which changed on 27 July 2011, MJD 55769. Here,<br />
we see that by verifying at least six months’ data a poor record will degrade <strong>the</strong> uncertainty estimation. The uA’<br />
for o<strong>the</strong>r link types: GPS MC/SC/P3, GLN L1C and GPSGLN are estimated in <strong>the</strong> same way. The results <strong>of</strong> uA’<br />
are listed in <strong>the</strong> diagonal elements in Table 7.<br />
3.4 Discussion: how good approximations can be obtained by using an optimal<br />
Vondrak smoothing<br />
So far, <strong>the</strong> TDev is an important indicator in <strong>the</strong> study. This and o<strong>the</strong>r indicators such as <strong>the</strong> σ etc. are based on<br />
<strong>the</strong> raw <strong>time</strong> link <strong>measurement</strong> data. However, <strong>the</strong> link values used in <strong>the</strong> <strong>UTC</strong> <strong>time</strong> <strong>transfer</strong>s are those <strong>of</strong> <strong>the</strong><br />
smoo<strong>the</strong>d Vondrak. In <strong>the</strong> standard <strong>UTC</strong> computation procedure, <strong>the</strong> Vondrak smoothing powers are grouped<br />
according to <strong>the</strong> link types: 10 3 for GPS SC, 10 4 for GPS MC C/A or GLN MC L1C, 10 5 for GPS P3 and TW,<br />
and 10 9 for GPSPPP. As will be shown in <strong>the</strong> following discussion, <strong>the</strong>y are not <strong>the</strong> optimal power settings.<br />
How <strong>the</strong> smoo<strong>the</strong>d data can approximate <strong>the</strong> true values is <strong>the</strong>n an interesting issue. In this section, we see that,<br />
given <strong>the</strong> stable HM at PTB and Lab(k), <strong>the</strong> optimal Vondrak smoothing power “reduces” significantly <strong>the</strong> noise<br />
level in a <strong>UTC</strong> <strong>time</strong> link. Because <strong>the</strong> code link noise is higher than that <strong>of</strong> HM clocks, we are sure that only <strong>the</strong><br />
link noise has been smoo<strong>the</strong>d ou,. and thanks to <strong>the</strong> high precision in GPSPPP, this ‘reduction’ can be<br />
numerically demonstrated. In <strong>the</strong> following discussion, because <strong>the</strong> true value is unknown, we take <strong>the</strong> GPSPPP<br />
as a reference and study how closely <strong>the</strong> different Vondrak smoothing results approximate <strong>the</strong> GPSPPP by<br />
varying <strong>the</strong> smoothing powers. Because <strong>the</strong> re-evaluation <strong>of</strong> uA’ is based on <strong>the</strong> ‘raw’ data statistics, <strong>the</strong>re is,<br />
<strong>the</strong>refore, still <strong>the</strong> potential to improve <strong>the</strong> uncertainty. We discuss <strong>the</strong> cases <strong>of</strong> TW, GPS MC C/A and GPS P3.<br />
Compared to GPSPPP (0.3 ns), TW (0.5 ns) is noisier. This can be “improved” by a Vondrak smoothing with an<br />
optimal smoothing power. Note that <strong>the</strong> TW is completely independent <strong>of</strong> GPSPPP. The σ <strong>of</strong> <strong>the</strong> dL (TW-<br />
GPSPPP) contains <strong>the</strong> uncertainties from both links. As can be seen in Table 8, a 10 % gain in σ is possible.<br />
Because TW and GPSPPP are both <strong>the</strong> first category, this gain is already significant.<br />
Table 8 Comparison <strong>of</strong> σ between <strong>the</strong> GPSPPP and TW links computed with linear and different Vondrak smoothing powers (using <strong>the</strong> 0907<br />
data between Mjd 55014 and 55039, N is <strong>the</strong> number <strong>of</strong> <strong>the</strong> points to be compared, Vdkx stands for <strong>the</strong> Vondrak smoothing with <strong>the</strong><br />
smoothing power x)<br />
Baseline N Linear Vdk0 Vdk1 Vdk2 Vdk3 Vdk4 Vdk5 Vdk6 Vdk7 Vdk8 Vdk9<br />
_____ /ns /ns /ns /ns /ns /ns /ns /ns /ns /ns /ns<br />
USNO-PTB 293 0.530 0.606 0.548 0.505 0.476 0.473 0.487 0.503 0.514 0.520 0.527<br />
USNX-PTBX 293 0.412 0.556 0.479 0.421 0.367 0.353 0.369 0.390 0.402 0.404 0.410<br />
NIST-PTB 370 0.294 0.584 0.479 0.406 0.349 0.322 0.300 0.289 0.289 0.286 0.291<br />
NPL-PTB 354 0.414 0.608 0.500 0.433 0.385 0.363 0.348 0.348 0.356 0.377 0.405<br />
In <strong>the</strong> standard <strong>UTC</strong> computation, <strong>the</strong> default smoothing power Vdk4 is used for GPS MC. Table 9 lists <strong>the</strong> σ <strong>of</strong><br />
<strong>the</strong> dL (GPS MC-GPS PPP) by using different powers <strong>of</strong> Vondrak smoothing from Vdk0 to Vdk7. They are all<br />
HM links. The smallest σ is 0.462 ns for KRIS-PTB with Vdk2. The σ is 0.405 ns for ROA-PTB Vdk1. However<br />
for this baseline, <strong>the</strong> σ values are not significantly different fromVdk0, i.e. 0.405 ns against 0.410 ns. For all <strong>the</strong><br />
o<strong>the</strong>rs, <strong>the</strong> smallest σ is an outlier in <strong>the</strong> smoothing Vdk0, e.g. <strong>the</strong> σ <strong>of</strong> GPS MC-GPS PPP for NICT-PTB is<br />
0.29 ns, noting that <strong>the</strong> conventional uA <strong>of</strong> GPSPPP is 0.3 ns! The ratios <strong>of</strong> <strong>the</strong> smallest and largest σ <strong>of</strong> <strong>the</strong> ratio<br />
1:3. Significant gains can be obtained by varying <strong>the</strong> smoothing powers.<br />
Table 9 Comparison <strong>of</strong> σ between <strong>the</strong> GPSPPP and GPS MC C/A links with different Vondrak smoothing powers (using <strong>the</strong> 1101 data,<br />
Vdkx stands for <strong>the</strong> Vondrak smoothing with <strong>the</strong> smoothing power x, <strong>the</strong> number <strong>of</strong> <strong>the</strong> compared points and <strong>the</strong> σ are listed)<br />
Smooth IT-PTB SG-PTB TL-PTB KRIS-PTB NICT-PTB ROA-PTB USNO-PTB .<br />
__ /ns /ns /ns /ns /ns /ns /ns<br />
Vdk7 2912 0.780 2510 1.737 1017 1.428 1519 1.113 2931 1.160 2783 0.841 2109 1.135<br />
Vdk6 2912 0.703 2510 1.573 1017 1.326 1519 1.035 2931 1.079 2783 0.757 2109 1.073<br />
Vdk5 2912 0.610 2510 1.216 1017 1.196 1519 0.875 2931 0.828 2783 0.659 2109 0.912<br />
Vdk4 2912 0.462 2510 0.759 1017 0.995 1519 0.618 2931 0.519 2783 0.517 2109 0.670<br />
Vdk3 2912 0.363 2510 0.569 1017 0.873 1519 0.481 2931 0.388 2783 0.434 2109 0.521<br />
Vdk2 2912 0.340 2510 0.517 1017 0.786 1519 0.462 2931 0.336 2783 0.411 2109 0.458<br />
Vdk1 2912 0.329 2510 0.492 1017 0.695 1519 0.521 2931 0.313 2783 0.405 2109 0.413<br />
Vdk0 2912 0.317 2510 0.486 1017 0.573 1519 0.589 2931 0.290 2783 0.410 2109 0.367<br />
12
For <strong>the</strong> MC links equipped with HM clocks, <strong>the</strong> optimal smoothing is likely to be Vdk0. The σ varies between<br />
0.290 ns (NICT-PTB, about 10,000 km in distance and <strong>the</strong> longest baseline in <strong>the</strong> <strong>UTC</strong> network) to 0.573 ns<br />
(TL-PTB, also a very long Asia-Europe baseline). The average is 0.433 ns. This is much lower than <strong>the</strong><br />
conventional uA (MC) 1.5 ns. If <strong>the</strong> Vondrak smoothing power is optimal, <strong>the</strong> potential uA <strong>of</strong> GPS MC would be<br />
0.5 ns to 0.8 ns for <strong>the</strong> stable clock <strong>transfer</strong>s. For <strong>the</strong> clocks with background noise, <strong>the</strong> power <strong>of</strong> <strong>the</strong> smoothing<br />
provides no obvious influence statistically. Generally speaking, a lower smoothing, e.g. Vdk0 or Vdk1, is more<br />
suitable for <strong>the</strong> MC C/A link and this greatly increases <strong>the</strong> <strong>quality</strong> <strong>of</strong> <strong>UTC</strong> links <strong>of</strong> which nearly half are <strong>of</strong> <strong>the</strong><br />
C/A code. The Vdk4 power used seems too high.<br />
Similar to <strong>the</strong> above, we studied GPS P3. Table 10 lists <strong>the</strong> results. As for those results provided in Table 9, for<br />
<strong>the</strong> stable maser baselines, <strong>the</strong> lower power smoothing suggests significant gains, e.g. for <strong>the</strong> baseline ROA-<br />
PTB, <strong>the</strong> σ <strong>of</strong> <strong>the</strong> standard smoothing Vdk5 is 0.659 ns while that <strong>of</strong> Vdk1 is only 0.208 ns, three <strong>time</strong>s smaller,<br />
noting again that <strong>the</strong> conventional uA <strong>of</strong> GPSPPP is 0.3 ns!<br />
Table 10 Comparison <strong>of</strong> σ between <strong>the</strong> GPSPPP and GPS P3 links with different Vondrak smoothing powers (using <strong>the</strong> 1101 data, Vdkx<br />
stands for <strong>the</strong> Vondrak smoothing with <strong>the</strong> smoothing power x, <strong>the</strong> number <strong>of</strong> <strong>the</strong> compared points and <strong>the</strong> σ are listed)<br />
Smooth IT-PTB OP-PTB SG-PTB TL-PTB KRIS-PTB NICT-PTB ROA-PTB USNO-PTB SP-PTB ORB-PTB.<br />
_ _ ___/ns /ns /ns /ns /ns /ns /ns /ns /ns /ns<br />
Vdk9 2869 0.249 2526 0.470 3003 0.438 2919 0.333 3017 0.419 3006 0.579 2895 0.938 2927 0.484 3002 0.372 2965 0.699<br />
Vdk8 2869 0.214 2523 0.439 3003 0.410 2918 0.291 3017 0.371 3007 0.522 2881 0.890 2925 0.440 3001 0.339 2959 0.670<br />
Vdk7 2868 0.184 2518 0.424 3003 0.368 2918 0.269 3016 0.311 3006 0.391 2859 0.797 2921 0.400 3001 0.297 2939 0.694<br />
Vdk6 2868 0.160 2510 0.438 3003 0.337 2918 0.247 3015 0.237 2996 0.263 2830 0.726 2918 0.357 3001 0.261 2905 0.775<br />
Vdk5 2868 0.143 2506 0.467 3001 0.328 2918 0.226 3016 0.176 2989 0.234 2805 0.659 2919 0.328 3001 0.238 2834 0.899<br />
Vdk4 2868 0.127 2504 0.513 3001 0.302 2918 0.208 3015 0.159 2985 0.203 2780 0.443 2920 0.309 3000 0.184 2703 1.002<br />
Vdk3 2868 0.124 2485 0.607 2999 0.289 2918 0.198 3014 0.151 2977 0.181 2694 0.251 2918 0.290 2997 0.137 2861 1.242<br />
Vdk2 2868 0.125 2429 0.747 2998 0.300 2918 0.195 3015 0.179 2973 0.177 2659 0.220 2917 0.278 2997 0.129 2759 1.357<br />
Vdk1 2868 0.130 2318 0.855 2998 0.334 2918 0.194 3009 0.273 2972 0.175 2646 0.208 2917 0.270 2998 0.127 2843 1.629<br />
Vdk0 2868 0.149 2482 1.053 2994 0.370 2918 0.197 3000 0.391 2969 0.180 2646 0.219 2917 0.269 2999 0.153 2736 1.883<br />
We conclude that a stronger smoothing for <strong>the</strong> baselines with stable clocks (clock noise less than link noise)<br />
allows <strong>the</strong> <strong>measurement</strong> uncertainty reduced for GPS MC C/A within 0.5-0.8 ns and for GPS P3 within 0.2-0.5<br />
ns. The TW links may also be improved with a 10% gain.<br />
4. Re-evaluation <strong>of</strong> <strong>the</strong> uA’ for all <strong>the</strong> present <strong>UTC</strong> links<br />
Multi indicators are used to estimate <strong>the</strong> uA’ as discussed in sections 2 and 3.3: σ, σ and TDev/τ, cf. <strong>the</strong> notation<br />
for <strong>the</strong> meaning. We also investigated <strong>the</strong> relationship between <strong>the</strong>se indicators. This is particularly useful for <strong>the</strong><br />
baselines where <strong>the</strong> high category link is not available. The ‘old’ evaluation <strong>of</strong> uA is considered as <strong>the</strong> a priori<br />
estimation and <strong>the</strong> experience accumulated from observations over <strong>the</strong> last decade <strong>of</strong> <strong>the</strong> <strong>UTC</strong> links are<br />
considered.<br />
Numerical analysis and statistics are based on long-term data at least nine months from 1101 to 1109. A poor<br />
historical record in a link during this period may degrade <strong>the</strong> uA estimation.<br />
The difficulty in separating <strong>the</strong> instabilities <strong>of</strong> <strong>the</strong> clock in Lab(k) from those <strong>of</strong> <strong>the</strong> link <strong>measurement</strong>s between<br />
Lab(k) and <strong>the</strong> pivotal laboratory PTB remain. The instability <strong>of</strong> <strong>the</strong> HM at <strong>the</strong> PTB, for example, can be<br />
considered negligible, at least for <strong>the</strong> less stable categories. The uA’ values given in Table 11 partially mask clock<br />
instability. If <strong>the</strong> TDev contains some clock instability, it is not critical, since we prefer to give a uA’ value that is<br />
ra<strong>the</strong>r conservative.<br />
Table 11 lists <strong>the</strong> ‘old’ uA values <strong>of</strong> <strong>the</strong> <strong>UTC</strong> <strong>time</strong> links as given in <strong>the</strong> Section 6 <strong>of</strong> <strong>BIPM</strong> Circular T [1] and <strong>the</strong><br />
‘new’ uA’ values obtained from this reevaluation. Here: TDev/τ = <strong>the</strong> conventional value <strong>of</strong> <strong>time</strong> deviation in<br />
nanoseconds for averaging <strong>time</strong> τ in a hour. The minimum value is 0.1 ns even if <strong>the</strong> true value is less than that.<br />
In <strong>the</strong> TDev/τ column, * stands a TDev value dominated by clock noise and not applicable for uA’. These new<br />
evaluations have been applied in Circular T 287 published since in December 2011 [20].<br />
13
Table 11 Uncertainty in <strong>the</strong> <strong>UTC</strong> <strong>time</strong> links in Section 6 <strong>of</strong> <strong>BIPM</strong> Circular T<br />
(c.f. <strong>the</strong> notation for <strong>the</strong> meaning <strong>of</strong> <strong>the</strong> terms)<br />
Link Type uA TDev/τ τ uA’ Link Type uA TDev/τ τ uA’<br />
/ns /ns /h /ns /ns /ns /h /ns<br />
AOS-PTB TWPPP 0.4 0.1 4 0.3 NIMT-PTB GPS P3 1.0 0.7 8 1.0<br />
APL-PTB GPS MC 1.5 0.7 24 1.0 NIS-PTB GPS P3 0.8 0.6 8 0.8<br />
AUS-PTB GPSPPP 0.3 0.5* 4 0.3 NIST-PTB TWPPP 0.3 0.1 2 0.3<br />
BEV-PTB GPS MC 1.5 1.0 24 1.5 NMIJ-PTB GPSPPP 0.3 0.1 2 0.3<br />
BIM-PTB GPS MC 2.0 1.1 4 1.5 NMLS-PTB GPS MC 2.0 1.2 24 1.5<br />
BIRM-PTB GPS MC 2.0 1.0 7 1.5 NPL-PTB TWPPP 0.3 0.1 2 0.3<br />
BY-PTB GPS MC 2.0 0.8 24 1.5 NPLI-PTB GPS MC 2.5 1.7 24 2.0<br />
CAO-PTB GPS MC 1.5 1.2 6 1.5 NRC-PTB GPSPPP 0.3 1.2* 2 0.3<br />
CH-PTB TWPPP 0.3 0.1 2 0.3 NRL-PTB GPSPPP 0.3 0.1 2 0.3<br />
CNM-PTB GPS MC 2.5 2.0 24 2.5 NTSC-PTB GPS MC 1.5 0.8 24 1.5<br />
CNMP-PTB GPS MC 3.0 1.0 24 2.0 ONBA-PTB GPS MC 7.0 4.0 3 6.0<br />
DLR-PTB GPSPPP 0.4 0.5* 3 0.4 ONRJ-PTB GPS MC 4.0 1.3 24 2.0<br />
DMDM-PTB GPS MC 2.0 1.6 24 2.0 OP-PTB TWPPP 0.3 0.3* 2 0.3<br />
DTAG-PTB GPSPPP 0.3 0.3* 2 0.3 ORB-PTB GPSPPP 0.3 0.9* 2 0.3<br />
EIM-PTB GPS MC 5.0 4.0 24 5.0 PL-PTB GPS MC 1.5 1.1 8 1.5<br />
HKO-PTB GPS MC 2.5 1.5 24 2.5 ROA-PTB TWPPP 0.4 0.3 2 0.3<br />
IFAG-PTB GPSPPP 0.3 0.4* 24 0.3 SCL-PTB GPS MC 3.0 2.2 24 2.5<br />
IGNA-PTB GPS MC 2.5 1.1 24 1.5 SG-PTB GPSPPP 0.3 0.2 2 0.3<br />
INPL-PTB GPS MC 1.5 0.8 24 1.5 SIQ-PTB GPS SC 5.0 2.4 12 4.0<br />
INTI-PTB GPS MC 4.0 2.0 24 3.0 SMD-PTB GPS MC 1.5 0.9 24 1.5<br />
IPQ-PTB GPSPPP 0.4 0.3* 2 0.4 SMU-PTB GPS MC 1.5 0.9 8 1.5<br />
IT-PTB TWPPP 0.3 0.1 2 0.3 SP-PTB TWPPP 0.3 0.1 2 0.3<br />
JATC/NTSC INT LK 0.2 - 0.2 SU-PTB GPSGLN 1.2 0.5 48 1.0<br />
JV-PTB GPS GT 5.0 - 5.0 TCC-PTB GPSPPP 0.3 0.1 2 0.3<br />
KIM-PTB GPS MC 3.0 1.7 3 2.0 TL-PTB GPSPPP 0.3 0.1 2 0.3<br />
KRIS-PTB GPSPPP 0.3 0.1 2 0.3 TP-PTB GPSPPP 0.3 0.3* 2 0.3<br />
KZ-PTB GPS MC 2.0 1.0 8 1.5 UA-PTB GPS MC 1.5 1.1 48 1.5<br />
LT-PTB GPS MC 2.0 1.5 6 2.0 UME-PTB GPSGLN 1.3 0.8 8 1.0<br />
MIKE-PTB GPSPPP 0.3 0.1 2 0.3 USNO-PTB GPSPPP 0.3 0.1 2 0.3<br />
MKEH-PTB GPS MC 2.0 2.3 24 2.5 VMI-PTB GPSPPP 0.3 0.6* 6 0.3<br />
MSL-PTB GPS P3 1.5 1.2 6 1.5 VSL-PTB TWPPP 0.3 0.2 2 0.3<br />
NAO-PTB GPS MC 3.0 1.6 24 2.0 ZA-PTB GPS P3 1.5 1.0 8 1.5<br />
NICT-PTB GPSPPP 0.3 0.1 6 0.3<br />
NIM-PTB GPS P3 0.7 0.4 24 0.7<br />
NIMB-PTB GPSPPP 0.3 0.9* 2 0.3<br />
5. Conclusion<br />
The standard uncertainty in [<strong>UTC</strong>-<strong>UTC</strong>(k)] as reported in <strong>BIPM</strong> Circular T is dominated by standard<br />
uncertainty in <strong>the</strong> <strong>time</strong> <strong>transfer</strong>. Therefore <strong>the</strong> evaluation and <strong>the</strong> evolution <strong>of</strong> <strong>the</strong> uncertainty in [<strong>UTC</strong>-<strong>UTC</strong>(k)]<br />
is almost <strong>the</strong> same as that in <strong>the</strong> <strong>UTC</strong> <strong>time</strong> <strong>transfer</strong>. The focus this and our previous study is <strong>measurement</strong><br />
uncertainty in <strong>time</strong> links. Our main interest is Type A standard uncertainty based on ISO 1993 and <strong>the</strong> JCGM<br />
100:2008 [2,3].<br />
The first global evaluation <strong>of</strong> uA in <strong>the</strong> <strong>UTC</strong> <strong>time</strong> links was made in 2002 [11] based on types <strong>of</strong> <strong>UTC</strong> <strong>time</strong> links.<br />
From <strong>the</strong> results in that study <strong>the</strong> uncertainty values <strong>of</strong> uA were published in Section 6 <strong>of</strong> Circular T in 2004 for<br />
<strong>the</strong> first <strong>time</strong>.. A year laterin 2005, <strong>the</strong> uncertainty in [<strong>UTC</strong>-<strong>UTC</strong>(k)] was evaluated and published in Section 1 <strong>of</strong><br />
Circular T.<br />
During last decade, new <strong>time</strong> <strong>transfer</strong> techniques have been incorporated into <strong>the</strong> calculation <strong>of</strong> <strong>the</strong> links for<br />
<strong>UTC</strong>. In this paper, we present a revision <strong>of</strong> <strong>the</strong> method used in 2002 for <strong>the</strong> calculation <strong>of</strong> uA taking into<br />
account <strong>the</strong> improvement <strong>of</strong> techniques and methods in clock comparison., As a result <strong>of</strong> our calculations we<br />
propose new uA’ values for all current 67 <strong>UTC</strong> links. <strong>On</strong>e <strong>of</strong> <strong>the</strong> advantages presented in this work compared to<br />
<strong>the</strong> investigations <strong>of</strong> uA values carried out in 2002 is that <strong>the</strong> new precise methods studied, e.g. TWPPP supply a<br />
reliable indicator <strong>of</strong> <strong>the</strong> estimated uA through inter-technique comparisons.<br />
In addition to <strong>the</strong> improved techniques available, ma<strong>the</strong>matical methods may also be used to improve<br />
<strong>measurement</strong> uncertainty in <strong>the</strong> <strong>time</strong> links. In this paper, we investigated <strong>the</strong> optimal smoothing parameters using<br />
Vondrak. For a Lab(k) operating a stable clock, <strong>the</strong> <strong>time</strong> link <strong>measurement</strong> noise can be significantly reduced<br />
especially for <strong>the</strong> code links, such as P3 or C/A codes.<br />
14
We suggest a complete revision <strong>of</strong> <strong>the</strong> uA’ values every 4 years to take into account <strong>the</strong> progress in <strong>time</strong> <strong>transfer</strong><br />
techniques and methods.<br />
6. Acknowledgements<br />
We thank all <strong>the</strong> <strong>UTC</strong> laboratories for <strong>the</strong>ir contributions to <strong>the</strong> <strong>UTC</strong> computation and for maintaining <strong>the</strong><br />
backup techniques which made this study possible. We are grateful to Dr. J. Miles and Mr R. Sitton for <strong>the</strong>ir<br />
helpful comments and careful corrections <strong>of</strong> <strong>the</strong> English text We also thank our colleagues Drs. F.E. Arias, G.<br />
Petit and G. Panfilo for <strong>the</strong>ir pr<strong>of</strong>essional comments during this study.<br />
Reference<br />
[1] <strong>BIPM</strong> Circular T 194-286 http://www.bipm.org/jsp/en/TimeFtp.jsp?TypePub=publication<br />
[2] ISO 1993 Guide to <strong>the</strong> expression <strong>of</strong> uncertainty in <strong>measurement</strong> (Geneva, International Organization for Standardization), corrected<br />
and reprinted in 1995<br />
[3] JCGM 100:2008, Evaluation <strong>of</strong> <strong>measurement</strong> data – Guide to <strong>the</strong> expression <strong>of</strong> uncertainty in <strong>measurement</strong>,<br />
http://www.bipm.org/utils/common/documents/jcgm/JCGM_100_2008_E.pdf#page=15<br />
[4] Bich W, Cox M G, Harris P 2006 Evolution <strong>of</strong> <strong>the</strong> ‘Guide to <strong>the</strong> expression <strong>of</strong> uncertainty in <strong>measurement</strong>’, Metrologia 43, S161<br />
[5] Jiang Z and Petit G 2009 Combination <strong>of</strong> TWSTFT and GNSS for accurate <strong>UTC</strong> <strong>time</strong> <strong>transfer</strong>, Metrologia 46(3) 305-314<br />
[6] Jiang Z and Lewandowski W 2012, Use <strong>of</strong> Glonass in <strong>UTC</strong> <strong>time</strong> <strong>transfer</strong>, Metrologia, 49(1), 57-61, doi:10.1088/0026-1394/49/1/009<br />
[7] Defraigne P. and Petit G., 2003, Time <strong>transfer</strong> to TAI using geodetic receivers Metrologia 40(4), 184-188<br />
[8] Petit G and Jiang Z 2008 Precise Point Positioning for TAI computation, International Journal <strong>of</strong> Navigation and Observation, vol.<br />
2008<br />
[9] Allan D W, Weiss M A, Jespersen J L 1991 A frequency-domain view <strong>of</strong> <strong>time</strong>-domain characterization <strong>of</strong> clocks and <strong>time</strong> and frequency<br />
distribution system, Proc. 45 th Frequency Control Symposium, pp 667-678<br />
[10] NIST 2008 Handbook <strong>of</strong> Frequency Stability Analysis, NIST Special Publication 1065<br />
[11] Azoubib J and Lewandowski W 2002 Uncertainties <strong>of</strong> <strong>time</strong> links used for TAI, Proc. PTTI 2002, pp 413-24<br />
[12] Lewandowski W., D. N. Matsakis, G. Panfilo and P. Tavella 2005 <strong>On</strong> <strong>the</strong> Evaluation <strong>of</strong> <strong>the</strong> Uncertainties in <strong>UTC</strong>-<strong>UTC</strong>(k), Proc. EFTF<br />
2005, March 2005, Besançon, France, p. 83<br />
[13] Jiang Z and Petit G 2004 Time <strong>transfer</strong> with GPS All in View, Proc. Asia-Pacific Workshop on Time and Frequency pp 236–43<br />
[14] Petit G and Jiang Z 2008 GPS All in View <strong>time</strong> <strong>transfer</strong> for TAI computation, Metrologia 45(1), 35-45<br />
[15] Lewandowski W and Jiang Z. 2009, Use <strong>of</strong> GLONASS at <strong>the</strong> <strong>BIPM</strong>, Proc. PTTI2009, 5-13<br />
[16] Petit G et al 2011 The <strong>time</strong> stability <strong>of</strong> PPP links for TAI, Proc. EFTF 2011<br />
[17] Jiang Z 2011 <strong>On</strong> <strong>the</strong> <strong>measurement</strong> <strong>quality</strong> <strong>of</strong> <strong>UTC</strong> <strong>time</strong> <strong>transfer</strong>, <strong>BIPM</strong> Technical Memoridum, TM200 pp56<br />
[18] Arias F, Jiang Z, Petit G and Lewandowski W 2005 <strong>BIPM</strong> Comparison <strong>of</strong> Time Transfer Techniques, Proc. Joint IEEE Int. FCS and<br />
PTTI, pp 312-315<br />
[19] Jiang Z, Lewandowski W, Harmegnies A, Piester D and V. Zhang Z 2011 Restoration <strong>the</strong> TWSTFT link calibration using GPSPPP<br />
bridging after <strong>the</strong> satellite change on Mjd 55769/27 July 2011, <strong>BIPM</strong> Technical Memorandum TM198<br />
[20] <strong>BIPM</strong> Circuler T 287 (2011) http://www.bipm.org/jsp/en/TimeFtp.jsp?TypePub=publication<br />
15
Annex. Configurations <strong>of</strong> <strong>the</strong> <strong>UTC</strong> worldwide <strong>time</strong> <strong>transfer</strong> networks<br />
in 2004 and at present<br />
In 2004, <strong>the</strong>re were 53 <strong>time</strong> links in total: 44 GPS CV links and 9 TW links. The <strong>UTC</strong> <strong>time</strong>-<strong>transfer</strong> network was<br />
structured around four pivot laboratories: USNO, NIST, CRL (now NICT) and PTB, as illustrated in Figure A-1.<br />
The links were classed into four categories according to <strong>the</strong> type <strong>of</strong> link: 1) TW, 2) GPS CV MC operated under<br />
normal conditions, 3) GPS CV SC operated under normal conditions and 4) GPS links in poor conditions, see<br />
Table A-1.<br />
North America Europe Asia<br />
NRC<br />
USNO<br />
CNMP CNM<br />
APL<br />
NIST<br />
ONBA TCC IGMA ONRJ CSIR<br />
ORB DLR IFAG CH LDS JV SP<br />
SMU<br />
OP<br />
NMC<br />
IEN<br />
UME<br />
NPL<br />
VSL<br />
ROA DTAG BEV AOS PL LT SU NIMB<br />
South America Africa Oceania<br />
Laboratory equipped with TWSTFT GPS CV single-channel link<br />
TWSTFT GPS CV single-channel back-up link<br />
TWSTFT by Ku band with X band back-up GPS CV multi-channel link<br />
Laboratory equipped with dual frequency reception GPS CV multi-channel back-up link<br />
GPS CV dual frequency link<br />
GPS CV dual frequency back-up link<br />
PTB<br />
Figure A-1 Status in March 2004 <strong>of</strong> <strong>the</strong> <strong>UTC</strong> <strong>time</strong> <strong>transfer</strong> network and <strong>the</strong> techniques used. There were 4 pivots: PTB, USNO, NIST and<br />
CRL (now NICT)<br />
Table A-1 The 2002 evaluation <strong>of</strong> <strong>the</strong> uA <strong>of</strong> <strong>the</strong> four categories <strong>of</strong> <strong>the</strong> <strong>UTC</strong> <strong>time</strong> links<br />
Category Type <strong>of</strong> link uA / ns Number %<br />
I TW 0.3 11 21<br />
IIa GPS MC 1.5 6 11<br />
IIb GPS MC 2.5 to 4.0 6 11<br />
IIIa GPS SC 2.0 to 2.5 21 40<br />
IIIb GPS SC 3.5 to 4.0 5 9<br />
IV O<strong>the</strong>rs 5 to 10 4 8<br />
Table A-1 gives a summary <strong>of</strong> <strong>the</strong> 2002 evaluation. The <strong>of</strong>ficially adopted conventional value <strong>of</strong> uA for TW links<br />
was 0.5 ns instead <strong>of</strong> 0.3 ns.<br />
Since <strong>the</strong> 2002 evaluation, <strong>time</strong>-<strong>transfer</strong> techniques in <strong>the</strong> generation <strong>of</strong> <strong>UTC</strong> have evolved significantly (see<br />
Figure 2) with <strong>the</strong> introduction <strong>of</strong> P3 CV, AV, PPP, TWPPP as well as GLN and GPSGLN. The conventional<br />
Type A uncertainties <strong>of</strong> <strong>the</strong>se new techniques are listed in Table A-2..<br />
Table A-2 The Type A standard uncertainties <strong>of</strong> <strong>the</strong> <strong>time</strong>-<strong>transfer</strong> techniques introduced since 2005 in <strong>UTC</strong> <strong>time</strong> links<br />
TP<br />
OMH<br />
CAO<br />
Type <strong>of</strong> link uA / ns Introduced in<br />
P3 CV/AV 0.7 2004/2006<br />
GPSPPP 0.3 2008<br />
TWPPP 0.3 2011<br />
GLN 1.5 2009<br />
GPSGLN 1.2 2011<br />
KRIS<br />
SG<br />
NPLI<br />
INPL<br />
NTSC<br />
JATC<br />
AUS<br />
NIMT NMLS BIRM<br />
ORGANIZATION OF THE INTERNATIONAL TIME LINKS March 2004<br />
CRL<br />
MSL<br />
SCL<br />
NIM<br />
NAO<br />
NMIJ<br />
TL<br />
16
At present, <strong>the</strong>re are a total <strong>of</strong> 68 laboratories contributing to <strong>UTC</strong> (67 operational links). Figure A-2 illustrates<br />
<strong>the</strong> status <strong>of</strong> <strong>the</strong> <strong>UTC</strong> <strong>time</strong> link network as <strong>of</strong> September 2011, showing <strong>the</strong> <strong>time</strong>-<strong>transfer</strong> techniques employed<br />
and indicating <strong>the</strong>ir uA uncertainties.<br />
2 O<strong>the</strong>r<br />
19 GPSPPP<br />
0.3 ns<br />
9 TWPPP<br />
0.3 ns<br />
2 GPSGLN<br />
1.3 ns<br />
1 GPS SC / 2 ns<br />
5 GPS P3<br />
0.7 ns<br />
29 GPS MC<br />
1.5 to 3 ns<br />
Figure A-2 The one-pivot <strong>UTC</strong> <strong>time</strong> link network, present status , and <strong>the</strong> <strong>time</strong> <strong>transfer</strong> techniques with an indication <strong>of</strong> <strong>the</strong>ir uncertainty uA.<br />
There are in total 68 national <strong>UTC</strong> contributing laboratories with 67 links<br />
17