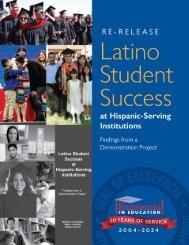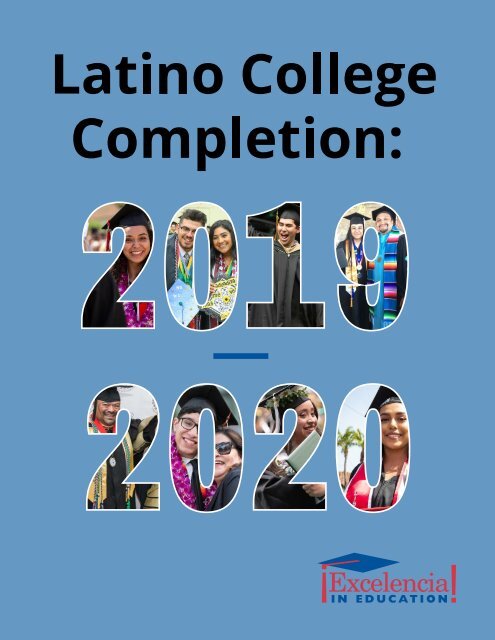
Latino College Completion - 2019 - 2020
While Latino enrollment decreased in 2020, we continue to see an increase in Latino college completion. This brief provides the most up to date overview of Latino college completion.
While Latino enrollment decreased in 2020, we continue to see an increase in Latino college completion. This brief provides the most up to date overview of Latino college completion.

You also want an ePaper? Increase the reach of your titles
YUMPU automatically turns print PDFs into web optimized ePapers that Google loves.
<strong>Latino</strong> <strong>College</strong> <strong>Completion</strong>: <strong>2019</strong>-<strong>2020</strong><br />
While <strong>Latino</strong> enrollment decreased in <strong>2020</strong>, we continue to see an increase in <strong>Latino</strong> college completion.<br />
This brief provides an overview of past and current context of <strong>Latino</strong> college completion through the first<br />
months of the pandemic, including the top institutions where <strong>Latino</strong>s earn degrees, and progress towards<br />
the goal of Ensuring America’s Future through 6.2 million more <strong>Latino</strong> undergraduate degrees by 2030.<br />
Educational Attainment: Overall<br />
• <strong>Latino</strong> adults had lower degree attainment than all adults. In 2021, 21% of <strong>Latino</strong> adults (25 and<br />
older) had earned a bachelor’s degree or higher compared to 38% of all adults in the U.S. In addition,<br />
almost one-third (30%) of <strong>Latino</strong> adults had earned an associate degree or higher compared to 48%<br />
of all adults. 1<br />
Degrees Earned: <strong>2019</strong>-<strong>2020</strong><br />
• <strong>Latino</strong>s represented the second largest group earning certificates or degrees. <strong>Latino</strong>s<br />
represented 17% of all students earning degrees, compared to White (51%), Black (11%), Asian<br />
(6%), and other (14%) students.<br />
• Of degrees earned by <strong>Latino</strong>s, the majority were at the baccalaureate level. Over one-third<br />
(34%) of <strong>Latino</strong>s earned a bachelor’s, 28% an associate, 26% a certificate, and 11% a graduate<br />
degree.<br />
• <strong>Latino</strong>s represented a small share of all graduate degree earners. Of all graduate degrees<br />
earned, <strong>Latino</strong>s represented 10%.<br />
By Sector<br />
• The majority of <strong>Latino</strong>s earned their degrees at a public institution. Over 70% of <strong>Latino</strong>s that<br />
earned a certificate or degree did so at a public four-year (42%) or public two-year (29%).<br />
By Location<br />
• The top 5 locations where <strong>Latino</strong>s enroll are also where they graduate. Almost two-thirds (65%)<br />
of <strong>Latino</strong>s earned a degree in California (29%), Texas (15%), Florida (10%), New York (6%), and<br />
Puerto Rico (5%), and these five locations enrolled 63% of <strong>Latino</strong>s.<br />
By Field of Study<br />
• <strong>Latino</strong>s earned degrees in concentrated fields. About 1 in 4 (27%) of <strong>Latino</strong>s earned certificates<br />
or degrees in these five fields of study: 1) Liberal Arts and Sciences, 2) Business Administration and<br />
Management, 3) Registered Nursing, 4) Psychology, and, 5) General Studies.<br />
Figure 1. Degrees <strong>Latino</strong>s Earn by Top 5 Fields of Study<br />
1<br />
U.S. Census Bureau, Current Population Survey, 2021 Annual Social and Economic Supplement (CPS ASEC).<br />
Source: Excelencia in Education analysis using U.S. Department of Education, National Center for Education Statistics (NCES), Integrated Postsecondary<br />
Education Data System (IPEDS), 2015 through <strong>2020</strong> <strong>Completion</strong>s and Institutional Characteristics Surveys.<br />
Published: July 13th, 2022<br />
www.EdExcelencia.org
Top Institutions Where <strong>Latino</strong>s Earn Certificates and Degrees<br />
<strong>Latino</strong> <strong>College</strong> <strong>Completion</strong>: <strong>2019</strong>-<strong>2020</strong><br />
• Over half of <strong>Latino</strong>s who earned a degree did so at a Hispanic-Serving Institution (HSI). HSIs<br />
awarded 55% of the degrees <strong>Latino</strong>s earned in <strong>2019</strong>-20. 2<br />
• The majority of institutions in the top 25 awarding degrees to <strong>Latino</strong>s were HSIs. Almost all<br />
institutions in the top 25 awarding degrees to <strong>Latino</strong>s at the undergraduate level were HSIs. Further,<br />
half of the institutions in the top 25 awarding degrees at the graduate level were HSIs.<br />
• A concentrated number of institutions are awarding degrees to <strong>Latino</strong>s at all award levels. The<br />
top 25 institutions awarded between 20% and 33% of all certificates and degrees earned by <strong>Latino</strong>s.<br />
Figure 2. Concentrated <strong>Latino</strong> <strong>Completion</strong> Among Top 25 Institutions<br />
• Seal of Excelencia certified 3 institutions graduate a large number of <strong>Latino</strong> students. At every<br />
award level, Seal certified institutions are among the top 25 institutions awarding degrees to <strong>Latino</strong>s.<br />
• Half of all Seal certified institutions are in the top 25 awarding baccalaureate degrees to<br />
<strong>Latino</strong>s. Of the 24 Seal certified institutions, 12 are among the top 25 institutions awarding degrees<br />
to <strong>Latino</strong>s at the baccalaureate level.<br />
Table 1. HSIs and Seal Certified Institutions Among Top 25 Awarding Degrees to <strong>Latino</strong>s<br />
Award Level HSIs in Top 25 Seal Certified in Top 25<br />
Certificates 23 3<br />
Associate 25 3<br />
Baccalaureate 22 12<br />
Master’s 14 5<br />
Doctoral 11 5<br />
First Professional 13 4<br />
2<br />
There were 559 HSIs in Fall <strong>2020</strong> based on the latest year of data available. HSIs are accredited, degree-granting public or private nonprofit<br />
institutions of higher education with 25% or more total undergraduate Hispanic full-time equivalent (FTE) student enrollment as defined in Title V<br />
of the Higher Education Opportunity Act, amended in 2008. To see this list of HSIs and learn more visit:<br />
https://www.EdExcelencia.org/research/series/hsi-<strong>2020</strong>-2021<br />
3<br />
The Seal of Excelencia is a national certification of institutions that strive to go beyond enrollment to intentionally SERVE <strong>Latino</strong> students. To<br />
learn more visit: www.EdExcelencia.org/Seal-Excelencia<br />
Source: Excelencia in Education analysis using U.S. Department of Education, National Center for Education Statistics (NCES), Integrated Postsecondary<br />
Education Data System (IPEDS), 2015 through <strong>2020</strong> <strong>Completion</strong>s and Institutional Characteristics Surveys.<br />
Published: July 13th, 2022<br />
www.EdExcelencia.org
Trends Over Time: 2014-2015 to <strong>2019</strong>-<strong>2020</strong><br />
<strong>Latino</strong> <strong>College</strong> <strong>Completion</strong>: <strong>2019</strong>-<strong>2020</strong><br />
• <strong>Latino</strong> degree completion has increased in the last five years. <strong>Latino</strong>s have earned over 215,000<br />
more certificates and degrees, an increase of 31%.<br />
• While <strong>Latino</strong> degree completion has grown over the last five years, it did so at a slower pace<br />
in <strong>2020</strong>. <strong>Latino</strong>s’ degree completion has increased steadily by 6% each year from 2015 until <strong>2020</strong><br />
when it increased only by 3%.<br />
• <strong>Latino</strong> degree earners accounted for the majority of the increase in degree completion overall.<br />
Of the 250,000 increase in certificates and degrees earned overall in the last five years, <strong>Latino</strong>s<br />
accounted for 85% of this increase.<br />
• <strong>Latino</strong>s have made significant gains at the associate, baccalaureate, and master’s degree<br />
level. <strong>Latino</strong>s’ highest growth was at the master’s (44%), associate (39%), and baccalaureate (37%)<br />
degree level.<br />
Figure 3. Increase in <strong>Latino</strong>s Earning Certificates/Degrees by Award Level (2015-<strong>2020</strong>)<br />
Source: Excelencia in Education analysis using U.S. Department of Education, National Center for Education Statistics (NCES), Integrated Postsecondary<br />
Education Data System (IPEDS), 2015 through <strong>2020</strong> <strong>Completion</strong>s and Institutional Characteristics Surveys.<br />
Published: July 13th, 2022<br />
www.EdExcelencia.org
Degree <strong>Completion</strong> Projections to 2030<br />
<strong>Latino</strong> <strong>College</strong> <strong>Completion</strong>: <strong>2019</strong>-<strong>2020</strong><br />
• The United States needs more <strong>Latino</strong>s with degrees. In order to close the equity gap in degree<br />
completion, <strong>Latino</strong>s will need to earn an additional 6.2 million undergraduate degrees by 2030. 4<br />
• <strong>Latino</strong>s are earning more degrees every year. Between 2017 and <strong>2020</strong>, <strong>Latino</strong>s earned almost<br />
half a million (491,321) additional degrees toward the goal of 6.2 million degrees by 2030.<br />
• Faster acceleration in <strong>Latino</strong> degree attainment will be needed to close the gap. In 2017 and<br />
2018, the additional degrees <strong>Latino</strong>s earned exceeded projections. However, in <strong>2019</strong> and <strong>2020</strong>,<br />
<strong>Latino</strong> degree completion did not say on this accelerated pace.<br />
Figure 4. Additional Undergraduate <strong>Latino</strong> Degrees Needed to Close Equity Gap, Projected vs. Actual<br />
Table 2. Projected Additional <strong>Latino</strong> Undergraduate Degrees Needed to Close Equity Gap<br />
Year Projected <strong>Latino</strong> Degrees Needed Year Projected <strong>Latino</strong> Degrees Needed<br />
2017 51,728 2024 460,926<br />
2018 105,093 2025 526,441<br />
<strong>2019</strong> 160,229 2026 594,120<br />
<strong>2020</strong> 216,796 2027 663,162<br />
2021 275,073 2028 734,088<br />
2022 335,133 2029 806,911<br />
2023 397,130 2030 881,882<br />
Source: Excelencia in Education. (<strong>2020</strong>). Ensuring America’s Future: Benchmarking <strong>Latino</strong> <strong>College</strong> <strong>Completion</strong> to 2030. Excelencia in<br />
Education. Washington, D.C.<br />
4<br />
Excelencia in Education projections. Additional degrees are over and above a baseline of the annual average degrees earned from 2014 to 2016.<br />
Source: Excelencia in Education analysis using U.S. Department of Education, National Center for Education Statistics (NCES), Integrated Postsecondary<br />
Education Data System (IPEDS), 2015 through <strong>2020</strong> <strong>Completion</strong>s and Institutional Characteristics Surveys.<br />
Published: July 13th, 2022<br />
www.EdExcelencia.org