VibePro Online
VibePro Online
VibePro Online

You also want an ePaper? Increase the reach of your titles
YUMPU automatically turns print PDFs into web optimized ePapers that Google loves.
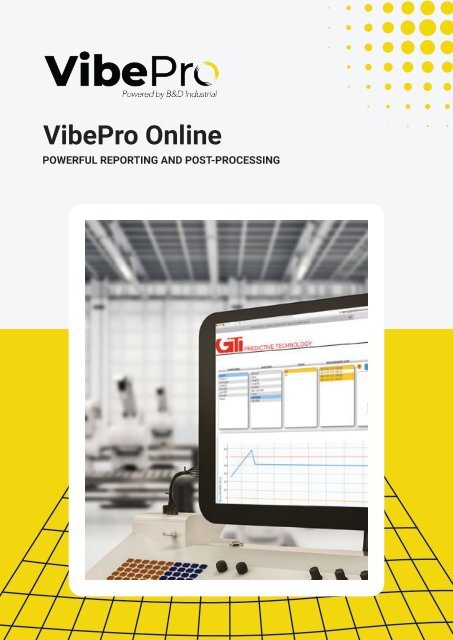
<strong>VibePro</strong> <strong>Online</strong><br />
POWERFUL REPORTING AND POST-PROCESSING
OVERVIEW<br />
<strong>VibePro</strong> 7 and above were built from the ground up to work with a comprehensive web app. The <strong>VibePro</strong> database is<br />
easily uploaded directly within the iPad app. VIBEPRO’s web apps allow companies to have multiple personnel analyze<br />
the data on their desktop or laptop computer.<br />
VIBEPRO ONLINE<br />
<strong>VibePro</strong> <strong>Online</strong> provides an extensive collection of reporting and analysis tools. Reports are available at any place<br />
found in the <strong>VibePro</strong> route hierarchy, which includes plant, machine, point, and individual measurement reports.<br />
Reports include a variety of data points including: a heat map, machine severity pie chart, asset photo, RMS values,<br />
severity level, measurement date, spectrum image, waterfall plot of frequency spectra, trend chart, peak values,<br />
bearing info, machine speed, and more. Custom logos can also be used in reports.<strong>VibePro</strong> <strong>Online</strong> utilizes algorithms<br />
that allow you to focus on what really matters. VIBEPRO leverages our extensive knowledge in vibration analysis to<br />
inform users on the true health of their assets.<br />
ALGORITHM FEATURES<br />
VIBEPROPULSE<br />
A custom vibration signature recognition algorithm developed by VIBEPRO brings a new fault<br />
detection t echnology not offered elsewhere. The fault detection algorithm will provide a good<br />
starting point for your technicians to fix the asset and return it back to normal vibration levels.<br />
VIBEPRO HEATMAP<br />
A custom vibration degradation algorithm developed by VIBEPRO brings a new visualization<br />
tool to the health of a plant’s assets. The larger the box the faster that asset is degrading.<br />
VIBEPRO HeatMap for the first time provides an accurate look at a plant’s health. Green assets<br />
that are rapidly failing will show up well before an emergency repair is needed. VIBEPRO<br />
HeatMap can also be a helpful tool to ensure thresholds are being properly setup.<br />
VIBEPRO ONLINE POWERFUL REPORTING AND POST-PROCESSING // 2
VIBEPRO ONLINE FEATURES<br />
DIRECT UPLOAD: Upload from vibepro directly to the web app<br />
MAP INTEGRATION: View location of where measurement was taken<br />
CUSTOM LOGO: Use custom logos for reports<br />
OVERALL VIBRATION TREND CHART: View a trend chart of a measurement point<br />
PHOTO SUPPORT: View a photo of the asset<br />
SPECTRUM VIEW: Full spectrum With Zoom And Mark Up Support<br />
WATERFALL PLOT: View readings in waterfall mode<br />
TEMPERATURE TREND: View temperature data from VIBEPRO-220 sensor or manual entry in <strong>VibePro</strong><br />
HZ OR CPM OPTION: View spectrum in either Hz or CPM<br />
BEARING MARKERS: View bearing markers setup in <strong>VibePro</strong><br />
RPM MARKERS: View up to 5x RPM markers (4x max on Lite)<br />
SORT HIERARCHY: View database in alpha or entry order<br />
REPORTING: Print reports (measurement level only on Lite)<br />
MULTIPLE DATABASE SUPPORT: Create and manage multiple <strong>VibePro</strong> databases<br />
VIBEPULSE: Fault detection algorithm to advise corrective actions<br />
VIBEPRO HEATMAP: Total plant visual overview with custom VIBEPRO algorithm to alert user of assets failing at a fast rate<br />
ADVANCED SPECTRUM: More options to post-process spectrum<br />
MAINTENANCE EVENTS: View events created on the iPad and events are included in reports<br />
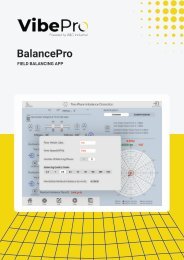
TIME WAVE FORM SUPPORT: Post process TWF data; view data as TWF, acceleration FFT, velocity FFT or displacement FFT and generate reports<br />
VIBEPRO ONLINE FEATURES<br />
TRENDING: View vibration and<br />
temperature trend charts.<br />
Colored threshold lines indicate<br />
when a measurement has<br />
passed user configured<br />
vibration threshold limits.<br />
TOTAL PLANT REPORTS: View<br />
an overview of your entire plant<br />
or plants. A pie chart is<br />
automatically generated to<br />
provide an immediate status<br />
update.<br />
SPECTRUM ANALYSIS: View<br />
all past spectrum captures.<br />
Bearing markers and RPM<br />
markers are available to assist<br />
in spectrum analysis.<br />
VIBEPRO ONLINE POWERFUL REPORTING AND POST-PROCESSING // 3
VIBEPRO ONLINE<br />
SCREENSHOTS<br />
VIBEPRO HEAT-<br />
HIERARCHY WITH WATERFALL VIEW:<br />
TIME WAVE FORM ANALYSIS:<br />
VIBEPRO ONLINE POWERFUL REPORTING AND POST-PROCESSING // 4
888.473.9675 // 33 Zachary Road // Manchester, NH 03109<br />
http://getvibepro.com<br />
The contents of this publication are the copyright of the publisher and may not be<br />
reproduced (even extracts) unless prior written permission is granted. Every care has<br />
been taken to ensure the accuracy of the information contained in this publication but no<br />
liability can be accepted for any loss or damage whether direct, indirect or consequential<br />
arising out of the use of the information contained herein.