EpiCurve® TT - Laytec
EpiCurve® TT - Laytec
EpiCurve® TT - Laytec

You also want an ePaper? Increase the reach of your titles
YUMPU automatically turns print PDFs into web optimized ePapers that Google loves.
Application Note 50<br />
<strong>EpiCurve®</strong> <strong>TT</strong> : GaN LED growth optimisation with<br />
LayTec’s new bowing sensor<br />
As the diameter of the sapphire, SiC and Si substrates for GaN LED and laser production is<br />
increasing, so does the wafer bowing. In close collaboration with University of Magdeburg,<br />
Ferdinand-Braun-Institute (FBH) in Berlin and several industrial customers LayTec has<br />
developed and applied the <strong>EpiCurve®</strong> <strong>TT</strong> sensor which measures wafer bowing, reflectance<br />
and true temperature simultaneously and in-situ. The sensor helps to understand the<br />
influence of parameter changes on the bow and to optimise LED growth under tight in-situ<br />
control.<br />
Blue and white LEDs are mainly grown on materials with a high lattice mismatch like sapphire, SiC or<br />
Si. Numerous curvature measurements for standard GaN LED growth have been performed at FBH to<br />
understand the physical effects causing curvature changes on sapphire substrates [1].<br />
wafer temperature / °C<br />
curvature (1/km)<br />
1100<br />
1000<br />
900<br />
800<br />
700<br />
600<br />
500<br />
waveguide<br />
400<br />
150 GaN<br />
100<br />
50<br />
0<br />
-50<br />
desorption<br />
GaN-NL<br />
GaN-Buffer<br />
GaN:Si<br />
AlGaN/<br />
GaN-SL<br />
Cladding<br />
430 μm sapphire (single side polish)<br />
0 5000 10000<br />
run time (s)<br />
15000 20000<br />
Fig. 1: Transients of surface temperature and wafer<br />
curvature during growth of a typical InGaN/GaN laser<br />
in a planetary AIX2600G3-HT system with a 11x2"<br />
configuration.<br />
InGaN-MQW<br />
Cool down<br />
concave<br />
convex<br />
Fig. 1 shows a typical curvature measurement<br />
obtained during growth of a GaN/AlGaN/InGaN<br />
structure on top of a sapphire wafer. Most wafers<br />
show a bowing effect already when the sapphire<br />
substrate is being heated up for oxide desorption.<br />
This can be attributed to the temperature<br />
gradient between the wafer back and front side<br />
which is the result of the low thermal<br />
conductivity of sapphire. Simulations of the<br />
effect showed that this vertical temperature<br />
gradient reaches a maximum of only 2K at the<br />
growth temperature of 1060°C.<br />
When the growth of GaN is started, the wafer<br />
bow increases with growing film thickness. The<br />
slope of the curvature signal can be used to<br />
determine the lattice constant of the growing<br />
materials, as the curvature is related to the<br />
lattice constant (Stoney equation).<br />
The third reason for the considerable curvature changes is the thermal mismatch between the<br />
growing layers: each time the temperature is ramped, a strong increase or decrease in the bowing<br />
measurements is observed. While during growth concave bowing takes place, after the final cooldown<br />
to room temperature the wafers are bowed in a convex shape! This complex interaction of at<br />
least three bowing mechanisms in a single growth run demonstrates how important in-situ control<br />
is to optimize new LED designs for higher yield and efficiency.
Application Note 50<br />
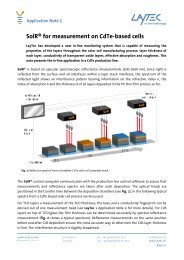
Any variation of the aluminum content causes a different slope in the curvature signal (see Fig. 2).<br />
Further experiments at FBH proved that a proper analysis of the curvature slope during GaN buffer<br />
layer growth enables accurate in-situ determination of Al composition by measuring and analyzing<br />
the curvature slope during the subsequent AlGaN growth [1].<br />
However, if AlGaN films exceed the critical layer thickness, crack formation in the material leads<br />
to a reduced total stress. This effect can be clearly seen in Fig. 2b (blue curve). When growing AlGaN<br />
with 12% aluminum, the layer cracks after reaching a thickness of approximately 0.6 μm and the<br />
curvature signal no longer increases. The signal becomes more noisy because of aspheric bowing<br />
effects. Fig. 3 shows a microscope picture of the structure after crack formation for an AlGaN layer<br />
with 12% aluminium (corresponds to blue curve in Fig. 2b)<br />
curvature (1/m)<br />
0,20<br />
0,15<br />
0,10<br />
0,05<br />
GaN<br />
Al(0.03)GaN<br />
Al(0.06)GaN<br />
330 µm sapphire<br />
meas.<br />
0,00 0,25 0,50 0,75 1,00<br />
layer thickness (µm )<br />
calc.<br />
6.7<br />
Fig. 2a: Bowing measurements during AlGaN growth with<br />
different Al-content. For comparison: calculations via<br />
Stoneys equation are plotted as straight lines.<br />
concave<br />
10<br />
20<br />
R (m)<br />
0,00 0,25 0,50 0,75 1,00<br />
layer thickness (µm)<br />
Fig. 2b: For a thick AlGaN layer (blue line) strain relaxation<br />
by crack formation leads to a visible change in slope of<br />
wafer curvature.<br />
Fig. 3: Microscope picture of an AlGaN layer showing crack<br />
formation as observed with the <strong>EpiCurve®</strong> <strong>TT</strong> (corresponds<br />
to blue curve in Fig. 2b).<br />
<strong>EpiCurve®</strong> <strong>TT</strong> sensors are available for AIX 200 RF-S and all types of Planetary MOCVD reactors as<br />
well as for TSSEL CCS reactors. Existing Epi<strong>TT</strong> sensors can be up-graded to <strong>EpiCurve®</strong> <strong>TT</strong>. For further<br />
information please contact: info@laytec.de or your local LayTec distribution partner.<br />
[1] F. Brunner et.al., Quantitative analysis of in-situ wafer bowing measurements for III-Nitride<br />
growth on Sapphire, to be published in the ICNS conference proceedings (2007).<br />
curvature (1/m)<br />
0,20<br />
0,15<br />
0,10<br />
0,05<br />
GaN<br />
Al(0.06)G aN<br />
Al(0.12)G aN<br />
calc.<br />
critical<br />
layer thickness<br />
430 µm sapphire<br />
meas.<br />
concave<br />
6.7<br />
10<br />
20<br />
R (m)<br />
Version 20101220