- Page 4 and 5:
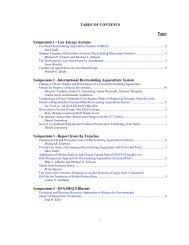
TABLE OF CONTENTS PAPERS & ABSTRACT
- Page 6 and 7:
Evaluation of On-board Handling Tec
- Page 8 and 9:
oduction of a Sardine Substitute Jo
- Page 10 and 11:
Effects of Temperature and Humidity
- Page 12 and 13:
Force. and the U.S. Coast Guard. Th
- Page 14 and 15:
for the program, showing that state
- Page 16 and 17:
12/18/92 such as diversion. The lat
- Page 18 and 19:
. Establish a formal database on th
- Page 20 and 21:
8. Standard reporting for seafood-b
- Page 22 and 23:
38. Education effort/materials on b
- Page 24 and 25:
egional business and industry may n
- Page 26 and 27:
PROJECT CODE: 95/PH/A10,13/P2 PROJE
- Page 28 and 29:
PROJECT CODE: 95/PH/A28/P1 PROJECT
- Page 30 and 31:
PROJECT CODE: 95/PH/A29/P3 PROJECT
- Page 32 and 33:
t PROJECT CODE: 95/PH/A37/P2 PROJEC
- Page 34 and 35:
investigate the problem. The ISSC w
- Page 36 and 37:
strategic plan for conference actio
- Page 38 and 39:
(4) advisory committee, and all con
- Page 40 and 41:
IRRADIATION TO ENSURE HYGIENIC QUAL
- Page 42 and 43:
food. Often, food manufacturers hav
- Page 44 and 45:
BACTERIA D-VALUE (kGy) E. coli 0.15
- Page 46 and 47:
ECONOMICS OF IRRADIATION OF FISH AN
- Page 48 and 49:
B. Market Testing of Irradiated Foo
- Page 50 and 51:
The Agreement on the Application of
- Page 52 and 53:
Table 1. Optimum radiation dose lev
- Page 54 and 55:
Loaharanu, P. 1973. Gamma irradiati
- Page 56 and 57:
EFFECTS OF LOW-DOSE GAMMA IRRADIATI
- Page 58 and 59:
diving bell and lowered into the wa
- Page 60 and 61:
12 1 Survival Curve for Standard Pl
- Page 62 and 63:
6 D value = 0.05 kGy ‘A. 0 / I I
- Page 64 and 65:
Dvalue=O.S9kGy 3.8 a’, 3.6 . 3.4
- Page 66 and 67:
8 0 . 0.1 0.2 0.3 0.4 0.S 0.6 rlrah
- Page 68 and 69:
Conclusion In this study, low dose
- Page 70 and 71:
processed and packaged product. A m
- Page 72 and 73:
Table l.Procedures schematic for ef
- Page 74 and 75:
(hydrogen peroxide) produced from t
- Page 76 and 77:
Johns, H.E. and Cunningham, J.R. 19
- Page 78 and 79:
k TBF#hoursCtime between split dose
- Page 80 and 81:
AUTOMATED OHMIC THAWING OF SHRIMP B
- Page 82 and 83:
A computer program was developed in
- Page 84 and 85:
RESULTS AND DISCUSSION The computer
- Page 86 and 87:
78 Quadrant 1 0 20 40 60 80 100 Tim
- Page 88 and 89:
FUTURE WORK The ohmic system perfor
- Page 90 and 91:
Using Edible Film to Improve Smoked
- Page 92 and 93:
LOG CFU / Sq cm 0 3 6 9 12, 15 18 2
- Page 94 and 95:
FIG-l.5 AE SMOKE LOG CFU / Sq cm FI
- Page 96 and 97:
FIG-2.1 PSYCHRQT SMOKE LOG CFU / Sq
- Page 98 and 99:
For samples stored at l0°C, no sig
- Page 100 and 101:
(3) 10 oz copolymer polyethylene ca
- Page 102 and 103:
Total Volatile Base Components of P
- Page 104 and 105:
Log Anaerobic Plate Counts of Packa
- Page 106 and 107:
0, 600 500 - :: 7 400 - 2 z 300 - k
- Page 108 and 109:
Log Aerobic Plate Counts of Package
- Page 110 and 111:
The variables that correlated well
- Page 112 and 113:
Woyewoda, A.D., S.J. Shaw, P.J. Ke,
- Page 114 and 115:
used to evaluate both heating and c
- Page 116 and 117:
minimize the chances for product re
- Page 118 and 119:
Part II Evaluation of the cooling p
- Page 120 and 121:
Table 1. Laboratory analyses on con
- Page 122 and 123:
REFERENCES APHA, 1984. Compendium o
- Page 124 and 125:
market and economic studies focusin
- Page 126 and 127:
The foreign demand for U.S. exports
- Page 128 and 129:
The survey of California-based seaf
- Page 130 and 131:
The Gulf butterfish (and harvestfis
- Page 132 and 133:
during the same period. The butterf
- Page 134 and 135:
48,693 mt/yr in 198690. The primary
- Page 136 and 137:
U.S. Landings consistently increase
- Page 138 and 139:
Christmas, J., D. Etzold, T. McIlwa
- Page 140 and 141:
Perkins, G. 1977. Potential for exp
- Page 142 and 143:
EFFECT OF WASHING WATER pH ON COLOR
- Page 144 and 145:
Figure 1, Whole Fish I Dehead (M-07
- Page 146 and 147:
138 Hematin concentration, expresse
- Page 148 and 149:
Table 1. Mean carotenoids, hematin,
- Page 150 and 151:
Table 2. Treatments Mean moisture v
- Page 152 and 153:
side). These adjustments are essent
- Page 154 and 155:
Siggia S. 1963. Methods for trace q
- Page 156 and 157:
work on combining acetates and phos
- Page 158 and 159:
untreated fresh fillets and treated
- Page 160 and 161:
Fig. 3. 10 0 m control tJ 0.1% MKP-
- Page 162 and 163:
negative bacteria such as Pseudomon
- Page 164 and 165:
concentrations up to 1% could be us
- Page 166 and 167:
Fey, M.S., and Regenstein, J.M. 198
- Page 168 and 169:
Schaack, M.M., and Marth E.H. 1988.
- Page 170 and 171:
MATERIALS AND METHODS Materials Liv
- Page 172 and 173: . , FIGURE 1. ANAEROBIC PLATE COUNT
- Page 174 and 175: il . --.-_._ 1+_- /: _- : _ _ _ _ _
- Page 176 and 177: , I . ‘ r , r , c I, , -1 ’ I .
- Page 178: I I ’ , ’ . I : , I ’ I 1 * :
- Page 181 and 182: Reed, R. J., G. R. Ammerman, and T.
- Page 183 and 184: Antioxidants can be added to increa
- Page 185 and 186: Table 1. Effect of wash treatment o
- Page 187 and 188: Table 2. Effect of antioxidant trea
- Page 189 and 190: (1993) for whole dressed catfish. C
- Page 191 and 192: Anonymous. 1992. Processing up 11%
- Page 193 and 194: Sin&_&x, R. O. and Yu, T. C. 1958.
- Page 195 and 196: 1. Materials MATERIALS AND METHODS
- Page 197: RESULTS AND DISCUSSION Aroma profil
- Page 200 and 201: .z%M 5 =w B 14 29 39 4142 53 64 25
- Page 202 and 203: .s CM 8 C s-t B W S' a .g CM $ C .-
- Page 204 and 205: Marshall, G.A. Moody, M.W., Hackney
- Page 206 and 207: AN OVERVIEW OF THE NMFS PRODUCT QUA
- Page 208 and 209: STORAGE CHARACTERISTICS OF FROZEN B
- Page 210 and 211: OPTIMUM CONDITIONS FOR THE PREPARAT
- Page 212 and 213: 3 BUILDING STRATEGIC PARTNERSHIPS F
- Page 214 and 215: for aquaculture supporting developm
- Page 216 and 217: problem solving of complex regional
- Page 218 and 219: DESIGN OF AN AUTOMAT EVALUATION DEV
- Page 220 and 221: sides of the shrimp were averaged.
- Page 224 and 225: REFERENCES Balaban, M. O., Yeralan,
- Page 226 and 227: QUALITIES OF FRESH AND PREVIOUSLY F
- Page 228 and 229: For the samples stored for six mont
- Page 230 and 231: stored for six month, had lower bac
- Page 232 and 233: Table 1. Psychrotrophic bacterial p
- Page 234 and 235: Table 7. Juiciness of refrigerated
- Page 236 and 237: Table 12. Cohesiveness of baked ref
- Page 238 and 239: Table 16. Shear force and centrifti
- Page 240 and 241: SAS Institute Inc. 1987. “SAS/STA
- Page 242 and 243: with a color chart. In this paper,
- Page 244 and 245: TABLE 1 Comparison of Histamine Tes
- Page 246 and 247: 11, Chassande, O., Renard, S., Barb
- Page 248 and 249: FIGURE 1 Time Course for Histamine
- Page 250 and 251: BACKGROUND A Rapid, Easily Used Tes
- Page 252 and 253: We acknowledge with thanks the inte
- Page 254 and 255: AOAC Add 1 ml Extract to 8 cm Prepa
- Page 256 and 257: 248 . Fig. 4 pnitroaniline in HCl N
- Page 258 and 259: 1 O .’ REFLECTANCE (arbitrary uni
- Page 260 and 261: 552 650 600 Salt Effects in the Fig
- Page 262 and 263: IMMUNOLOGIC APPROACHES TO THE IDENT
- Page 264 and 265: Table 1. Fish collected in Biscayne
- Page 266 and 267: Based on unpublished data comparing
- Page 268 and 269: 2. 3. 4. Hartmann, J.X., Poyer, J.C
- Page 270 and 271: irradiated foods look like. After t
- Page 272 and 273:
silver carp Wpophthalmichthys molit
- Page 274 and 275:
,$mory Analysis. Sensory data were
- Page 276 and 277:
Table 3. Percentage of panelists wh
- Page 278 and 279:
Table 5. Percent response of paneli
- Page 280 and 281:
McNulty, T, 1996. Personal communic
- Page 282 and 283:
in a stainless steel tank (SOL) wit
- Page 284 and 285:
Mineral Content Five macro-elements
- Page 286 and 287:
TBble 1 _ Yield of surimi made from
- Page 288 and 289:
Table 4 - Proximate composition of
- Page 290 and 291:
goatfish lizardfish, ponyfish, ther
- Page 292 and 293:
Table 7 - Amino acid composition of
- Page 294 and 295:
Gel Strength For surimi gels, stres
- Page 296 and 297:
288 &f&odan, Y., Toyohara, H., and
- Page 298 and 299:
CONSUMER SURVEY OF POND RAISED CATF
- Page 300 and 301:
Accept&i&y scores of male and femal
- Page 303 and 304:
-I- -T-
- Page 305 and 306:
100 90 80 70 60 50 40 30 20 10 0 Fi
- Page 307 and 308:
+ 5:
- Page 309 and 310:
This study evaluated the feasibilit
- Page 311 and 312:
1000000 100000 10000 9 1000 > 1 . T
- Page 313 and 314:
100000 PIs 10000 E 1000 z 8 100 UJ
- Page 315 and 316:
100000 10000 P 12 > 1000 10 1 � T
- Page 317 and 318:
THE EFFECT OF IONIZING Kvulnificus
- Page 319 and 320:
io Vulnificus: Past, Present, and F
- Page 321 and 322:
conce op on Vibrio vulnificus in 19
- Page 323 and 324:
LEVEL 4 L WA TEMPERATURE** TIME TO
- Page 325 and 326:
isregard include the education of o
- Page 327 and 328:
USE OF “COOL PASTEURIZATION” TO
- Page 329 and 330:
Survival rate of V: vuZnificus in o
- Page 331 and 332:
REFERENCES BAM. 1992. Bacteriologic
- Page 333 and 334:
0 To promote the cooperation and a
- Page 335 and 336:
SAFETY CONCERN IN THE USE OF MODIFI
- Page 337 and 338:
CONCLUSION According to some resear
- Page 339 and 340:
32 MATERIAL AND METHODS Product Pre
- Page 341 and 342:
FLOWCHART DIAGRAM FOR THE CANNING P
- Page 343 and 344:
Americans consume almost four pound
- Page 345 and 346:
pursuing such agreements and expect
- Page 347 and 348:
ABSTRACTS PROTECTION ACTIVPTIESOFTF
- Page 349 and 350:
Mildred Chaparro Food Science and T
- Page 351 and 352:
GENICALLY AND BLAST FROZEN PACKAGIN
- Page 353 and 354:
S TO ENSURE SEAFOOD SAFETY AND SEAF
- Page 355 and 356:
XYGEN-DE FRJZE ICALS AND LIPID PERO
- Page 357 and 358:
IIOTOXINS: PREVENTION, CONTROL SEAF
- Page 359 and 360:
ASPECTS OF CIGUATERA FIS POISONING
- Page 361 and 362:
BRETTANBMYCES CL-4 USSENII AS A CON
- Page 363 and 364:
USE OF ANTI ANTS IN FRESH AND FROZE
- Page 365 and 366:
INTERNATIONAL ASPECTS FOR HACCP E.


