An Introduction to Wavelet Transform Tidal Analysis Methods
An Introduction to Wavelet Transform Tidal Analysis Methods
An Introduction to Wavelet Transform Tidal Analysis Methods

Create successful ePaper yourself
Turn your PDF publications into a flip-book with our unique Google optimized e-Paper software.
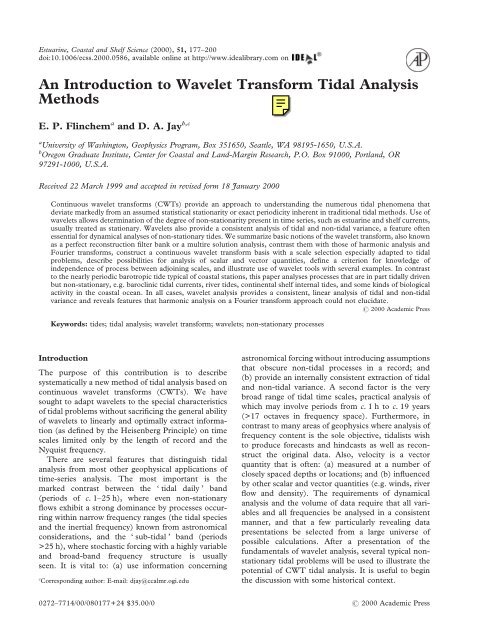
Estuarine, Coastal and Shelf Science (2000), 51, 177–200<br />
doi:10.1006/ecss.2000.0586, available online at http://www.idealibrary.com on<br />
<strong>An</strong> <strong>Introduction</strong> <strong>to</strong> <strong>Wavelet</strong> <strong>Transform</strong> <strong>Tidal</strong> <strong>An</strong>alysis<br />
<strong>Methods</strong><br />
E. P. Flinchem a and D. A. Jay b,c<br />
a<br />
University of Washing<strong>to</strong>n, Geophysics Program, Box 351650, Seattle, WA 98195-1650, U.S.A.<br />
b<br />
Oregon Graduate Institute, Center for Coastal and Land-Margin Research, P.O. Box 91000, Portland, OR<br />
97291-1000, U.S.A.<br />
Received 22 March 1999 and accepted in revised form 18 January 2000<br />
Continuous wavelet transforms (CWTs) provide an approach <strong>to</strong> understanding the numerous tidal phenomena that<br />
deviate markedly from an assumed statistical stationarity or exact periodicity inherent in traditional tidal methods. Use of<br />
wavelets allows determination of the degree of non-stationarity present in time series, such as estuarine and shelf currents,<br />
usually treated as stationary. <strong>Wavelet</strong>s also provide a consistent analysis of tidal and non-tidal variance, a feature often<br />
essential for dynamical analyses of non-stationary tides. We summarize basic notions of the wavelet transform, also known<br />
as a perfect reconstruction filter bank or a multire solution analysis, contrast them with those of harmonic analysis and<br />
Fourier transforms, construct a continuous wavelet transform basis with a scale selection especially adapted <strong>to</strong> tidal<br />
problems, describe possibilities for analysis of scalar and vec<strong>to</strong>r quantities, define a criterion for knowledge of<br />
independence of process between adjoining scales, and illustrate use of wavelet <strong>to</strong>ols with several examples. In contrast<br />
<strong>to</strong> the nearly periodic barotropic tide typical of coastal stations, this paper analyses processes that are in part tidally driven<br />
but non-stationary, e.g. baroclinic tidal currents, river tides, continental shelf internal tides, and some kinds of biological<br />
activity in the coastal ocean. In all cases, wavelet analysis provides a consistent, linear analysis of tidal and non-tidal<br />
variance and reveals features that harmonic analysis on a Fourier transform approach could not elucidate.<br />
� 2000 Academic Press<br />
Keywords: tides; tidal analysis; wavelet transform; wavelets; non-stationary processes<br />
<strong>Introduction</strong><br />
The purpose of this contribution is <strong>to</strong> describe<br />
systematically a new method of tidal analysis based on<br />
continuous wavelet transforms (CWTs). We have<br />
sought <strong>to</strong> adapt wavelets <strong>to</strong> the special characteristics<br />
of tidal problems without sacrificing the general ability<br />
of wavelets <strong>to</strong> linearly and optimally extract information<br />
(as defined by the Heisenberg Principle) on time<br />
scales limited only by the length of record and the<br />
Nyquist frequency.<br />
There are several features that distinguish tidal<br />
analysis from most other geophysical applications of<br />
time-series analysis. The most important is the<br />
marked contrast between the ‘ tidal daily ’ band<br />
(periods of c. 1–25 h), where even non-stationary<br />
flows exhibit a strong dominance by processes occurring<br />
within narrow frequency ranges (the tidal species<br />
and the inertial frequency) known from astronomical<br />
considerations, and the ‘ sub-tidal ’ band (periods<br />
>25 h), where s<strong>to</strong>chastic forcing with a highly variable<br />
and broad-band frequency structure is usually<br />
seen. It is vital <strong>to</strong>: (a) use information concerning<br />
c Corresponding author: E-mail: djay@ccalmr.ogi.edu<br />
astronomical forcing without introducing assumptions<br />
that obscure non-tidal processes in a record; and<br />
(b) provide an internally consistent extraction of tidal<br />
and non-tidal variance. A second fac<strong>to</strong>r is the very<br />
broad range of tidal time scales, practical analysis of<br />
which may involve periods from c. 1h <strong>to</strong> c. 19 years<br />
(>17 octaves in frequency space). Furthermore, in<br />
contrast <strong>to</strong> many areas of geophysics where analysis of<br />
frequency content is the sole objective, tidalists wish<br />
<strong>to</strong> produce forecasts and hindcasts as well as reconstruct<br />
the original data. Also, velocity is a vec<strong>to</strong>r<br />
quantity that is often: (a) measured at a number of<br />
closely spaced depths or locations; and (b) influenced<br />
by other scalar and vec<strong>to</strong>r quantities (e.g. winds, river<br />
flow and density). The requirements of dynamical<br />
analysis and the volume of data require that all variables<br />
and all frequencies be analysed in a consistent<br />
manner, and that a few particularly revealing data<br />
presentations be selected from a large universe of<br />
possible calculations. After a presentation of the<br />
fundamentals of wavelet analysis, several typical nonstationary<br />
tidal problems will be used <strong>to</strong> illustrate the<br />
potential of CWT tidal analysis. It is useful <strong>to</strong> begin<br />
the discussion with some his<strong>to</strong>rical context.<br />
0272–7714/00/080177+24 $35.00/0 � 2000 Academic Press
178 E. P. Flinchem and D. A. Jay<br />
46°30'<br />
46°20'<br />
46°10'<br />
N5<br />
Pacific<br />
Ocean<br />
N3<br />
<strong>An</strong>alysis and prediction of coastal tides was one of<br />
the great triumphs of 19th century mathematical<br />
physics. Inspired by New<strong>to</strong>n’s theory of gravitation,<br />
the celestial mechanics of Laplace, and the metaphor<br />
of a perfect clockwork mechanism in perpetual<br />
motion, physicists endeavoured <strong>to</strong> predict the tide at a<br />
given station for all past and future time by fitting <strong>to</strong><br />
the observed tide a set of coefficients for the amplitude<br />
and phase of a finite sum of sinusoids with the<br />
precisely known orbital periodicities of the earthmoon-sun<br />
system. For a record at a typical coastal<br />
station [e.g. Figure 1, 2(a)], the harmonic method<br />
reduces as much as 98% of the variance <strong>to</strong> a table of<br />
a few dozen numbers. The harmonic approach<br />
performs as well as it does because the tides at coastal<br />
stations obey relatively linear dynamics forced by<br />
lunisolar motions; they are, almost literally, an earthly<br />
manifestation of the music of the spheres.<br />
Lord Kelvin first proposed a least-squares tidal<br />
harmonic analysis (HA) in the 1860s, from which<br />
Darwin (1886, 1891, 1893) formulated a practically<br />
useful method. Doodson (1922) perfected Kelvin’s<br />
theory by elaborating the formal treatment of the<br />
slowest astronomical periodicities; his symbolism is<br />
still in use <strong>to</strong>day <strong>to</strong> denote the various tidal species<br />
and constituentes. Munk and Cartwright (1965) and<br />
Cartwright (1968) reformulated the tidal problem in<br />
terms of admittances <strong>to</strong> account for the presence of a<br />
continuous spectrum of background noise (‘ the<br />
response method ’). This work, however, resulted in<br />
little change in practical tidal analysis procedures.<br />
Aside from the technical refinements introduced by<br />
Doodson, HA as it is used in practice has remained<br />
O5<br />
N1<br />
S3<br />
K1<br />
TS<br />
NC TP<br />
Columbia River Estuary<br />
124°00' 123°30'<br />
10 km<br />
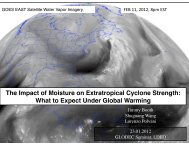
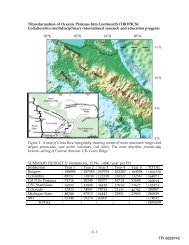
Figure 1. Station locations and place names: TP=Tongue Point, Ts=Tansy Point, BV=Beaver.<br />
nearly static for c. 100 years. The improvements that<br />
have occurred since 1921 have been related <strong>to</strong><br />
removal of the effects of minor constituents that<br />
cannot be determined from a one-year record,<br />
inference from one station <strong>to</strong> another, more precise<br />
specification of astronomical inputs, treatment of<br />
unevenly spaced data, treatment of vec<strong>to</strong>r data, and<br />
development of numerically efficient software (e.g.<br />
Godin, 1972; Foreman, 1977).<br />
The simpler forms of the analysis/prediction<br />
problem have been solved, but many significant tidal<br />
processes remain that are quasi-periodic, and therefore,<br />
less amenable <strong>to</strong> study and prediction by established<br />
methods. <strong>Tidal</strong> phenomena may be irregular<br />
either because an aperiodic input is competing with<br />
tidal forcing or the oceanic response <strong>to</strong> tidal forcing is<br />
being modulated by some internal process. Variable<br />
wind stress and sea-level pressure are examples of the<br />
former. <strong>An</strong> example of the latter is modulation of<br />
fluvial tides by river flow [Figure 2(b)]. Increasing<br />
stream flow damps the tidal wave frictionally, thereby<br />
decreasing the range of the observed tide (Dronkers,<br />
1964; Godin, 1991; Jay & Flinchem, 1997). More<br />
rigorously speaking, however, aperiodic forcing and<br />
aperiodic modulation are two aspects of a continuum.<br />
Unambiguous examples of the extremes of the continuum<br />
are rarely found, the two limits being deeply<br />
intertwined via the nonlinear terms in the Navier–<br />
S<strong>to</strong>kes equations. <strong>An</strong> intermediate example is the very<br />
unsteady internal tidal activity on continental shelves<br />
and in fjords (Sandstrom, 1991). The origin and<br />
propagation of internal tides depend strongly on the<br />
density field, which can be altered rapidly by wind<br />
BV
ht (m)<br />
ht (m)<br />
4<br />
3<br />
2<br />
1<br />
3<br />
2<br />
1<br />
0<br />
(a)<br />
490<br />
(b)<br />
500<br />
510<br />
520<br />
490 500 510 520 530 540 550 560 570 580<br />
Time, days from 1/10/94<br />
mixing, advection, upwelling, and freshwater runoff.<br />
Other examples include internal tidal asymmetry, a<br />
mechanism of baroclinic current generation in stratified<br />
estuaries that is driven by tidal advection of the<br />
<strong>Introduction</strong> <strong>to</strong> wavelet transform tidal analysis methods 179<br />
Beaver Flow, Observed Ht and Low-pass Ht<br />
530 540 550<br />
Time, days from 1/10/94<br />
560<br />
Tongue Pt Observed Ht and Low-pass Ht<br />
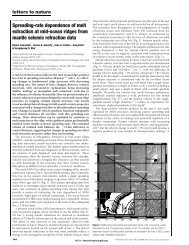
Figure 2. Detail of surface elevation time series for: (a) a fluvial station (BV in Figure 1) and (b) an estuarine station (TP<br />
in Figure 1). The time period (3+ months) includes a major winter freshet (c. day 497) and part of the spring freshet (c. day<br />
575). Fluvial tides are strongly modulated by river flow. Low-passed river elevation is influenced primarily by tides, but<br />
secondarily by s<strong>to</strong>rm surges. Estuarine tides are weakly modulated by river flow. Low-passed elevation in the estuary is<br />
strongly influenced, however, by coastal processes; compare surge effects on c. day 507 with the spring freshet period at<br />
c. 570.<br />
570<br />
580<br />
590<br />
590<br />
density field (Jay & Musiak, 1994), and the interaction<br />
between tide and s<strong>to</strong>rm surge (Prandle & Wolf 1981).<br />
Practical forecasting of such phenomena would<br />
require: (a) an invertible analysis method suitable <strong>to</strong><br />
3<br />
2<br />
1<br />
Flow (10 000 m 3 s –1 )
180 E. P. Flinchem and D. A. Jay<br />
non-stationary processes; and (b) a method of forecasting<br />
the s<strong>to</strong>chastic processes that modify the astronomical<br />
tide. The practicality of the second task<br />
depends on the problem; we concentrate, therefore,<br />
on the CWT as a means of accomplishing the<br />
first task. As Munk and Cartwright (1965) observed,<br />
‘. . . predicting and learning are in a sense orthogonal,<br />
and the most interesting effects are those that cause<br />
the most trouble with a forecasting . . .’.<br />
The forecasting power of HA derives from the<br />
infinite extent of its basis functions or, equivalently, its<br />
representation of the tide by a line spectrum consisting<br />
of a finite number of infinitely narrow peaks at<br />
fixed, predetermined frequencies, each with a definite<br />
amplitude and phase. A time series with such a<br />
spectrum is a stationary signal, i.e. one that may be<br />
divided in<strong>to</strong> multiple, statistically indistinguishable<br />
segments. Of course reality is not so simple, and the<br />
presence of noise must be acknowledged even for<br />
stationary tidal processes. For such a signal, however,<br />
it is still usually sensible <strong>to</strong> use Gaussian statistics <strong>to</strong><br />
determine the accuracy with which various quantities<br />
are known. Indeed, careful investigation of their<br />
spectral properties has been, for over a century, a<br />
major fac<strong>to</strong>r in improving conceptual models of the<br />
tides.<br />
A non-stationary signal has, in contrast, a frequency<br />
content that evolves over time. If a non-stationary<br />
times series is dissected, the statistical properties of<br />
the parts will not all be similar <strong>to</strong> each other or <strong>to</strong> the<br />
statistics of the whole, and the usual Gaussian statistics<br />
based on the whole record will be deceptive. Two<br />
common examples of non-stationary signals are<br />
speech and music. The meaning of a spoken sentence<br />
or of a musical performance is in the whole and in the<br />
sequence of the parts—removing words or notes or<br />
altering their order can change the meaning of the<br />
whole or garble it completely. Therefore, the information<br />
content depends on frequency, duration, and<br />
sequence, all three <strong>to</strong>gether, as opposed <strong>to</strong> any one<br />
alone. In oceanography, <strong>to</strong>o, non-stationary signals<br />
pose intriguing questions. In particular, nonstationary<br />
tidal signals provide the opportunity <strong>to</strong><br />
deepen our understanding of tidal dynamics.<br />
Harmonic analysis and the Fourier transform convert<br />
the information content in the time domain of a<br />
signal, which may be thought of as evolutionary content,<br />
in<strong>to</strong> static, averaged frequency information. The<br />
limitation of analysis methods that yields only a static<br />
picture of the frequency content of a non-stationary<br />
signal is apparent in a comparison of the power<br />
spectra, plotted in Figure 3(a,b) of the records shown<br />
in Figure 2(a,b). The signals evolve quite differently in<br />
time, but prima facie, their spectral representations are<br />
nearly indistinguishable. Clearly, such a transformation<br />
conceals certain quite striking features visible in<br />
the time domain. <strong>An</strong>alogously, imagine a piece of<br />
music played first forwards and then backwards.<br />
Power spectra for the two performances would have<br />
exactly the same shape, though the phases would<br />
change. The human ear, which naturally analyses<br />
changes in frequency content through time, would<br />
immediately distinguish the two cases and assign<br />
them different meanings. As will be seen, wavelet<br />
techniques translate the idea of evolving frequency<br />
content in<strong>to</strong> mathematics, turning intuitions about<br />
non-stationary signals in<strong>to</strong> a useful scientific <strong>to</strong>ol.<br />
The previous paragraphs suggest that a mathematical<br />
technique is needed that will transform a onedimensional<br />
input signal (a function of time) in<strong>to</strong> a<br />
two-dimensional field showing the amplitude and<br />
phase behaviour of the input as a function of both<br />
frequency and time. A key link is the Heisenberg<br />
uncertainty relation:<br />
� �� t�(4�) �1<br />
(1)<br />
which says that the product of � t (the uncertainty in<br />
time; i.e. the duration) and � � (uncertainty in frequency)<br />
is greater than or equal <strong>to</strong> a constant. These<br />
terms have meanings analogous <strong>to</strong> the concept of the<br />
standard deviation in statistics:<br />
where g(t) describes any envelope imposed on the<br />
input time series, gˆ(�) is the Fourier transform of g(t),<br />
�x� 2 �xx*, and x* is the complex conjugate of x.<br />
For any method of time-frequency analysis,<br />
Equation (1) limits the possibility of simultaneous,<br />
mathematical knowledge of the time evolution and<br />
frequency content of data. The best known role of<br />
Equation (1) is in quantum mechanics, where it<br />
has given rise <strong>to</strong> a series of wave-particle duality<br />
paradoxes. But Equation (1) is not an empirical law.<br />
Rather, it follows from the definition of frequency (or<br />
wavenumber) itself. At issue is not noise or imperfect<br />
calculations, but simply that it is inconsistent for the<br />
two questions ‘ when ’ and ‘ what frequency? ’ both <strong>to</strong><br />
have exact answers with respect <strong>to</strong> the same data.<br />
Infinite precision in frequency implies infinite duration<br />
in time. On the other hand, exact time precision<br />
precludes any knowledge of frequency.<br />
<strong>An</strong> HA of a long, stationary record represents a<br />
limiting case of Equation (1) in which � t (the duration
Log10 energy<br />
Log10 energy<br />
–2<br />
–3<br />
–4<br />
–5<br />
–6<br />
–7<br />
–1.5<br />
–2<br />
–2.5<br />
–3<br />
–3.5<br />
–4<br />
–4.5<br />
–1<br />
–1.5<br />
BV Ht Power Spectrum<br />
Log10 frequency day –1<br />
–1 –0.5 0 0.5<br />
N1 7m {u, v} Power Spectrum<br />
Log10 frequency day –1<br />
–0.5 0 0.5<br />
of the record) is large and � q is accordingly very small,<br />
allowing resolution of closely spaced frequencies. To<br />
examine evolution of frequency content in a nonstationary<br />
record, it is necessary <strong>to</strong> choose a smaller,<br />
variable � t, with the consequence that � � will grow in<br />
inverse proportion. Turning attention away from<br />
natural systems which approach the ‘ clockwork ’<br />
model and focusing instead on the numerous deviations<br />
from that ideal, it is necessary <strong>to</strong> set aside the<br />
line-spectrum concept as the primary intellectual<br />
framework because it is an idealization inappropriate<br />
<strong>to</strong> the investigation of non-stationary processes. This<br />
stance is not a criticism of either the HA or Fourier<br />
methods, merely a recognition of the fact that<br />
Equation (1) precludes, a priori, any one technique<br />
from addressing all research questions of interest. A<br />
CWT approach is complementary <strong>to</strong> HA and Fourier<br />
methods. In fact, a power spectrum or HA that<br />
determines the average frequency content of a record<br />
is often a good starting point for a CWT analysis.<br />
<strong>Introduction</strong> <strong>to</strong> wavelet transform tidal analysis methods 181<br />
1<br />
1<br />
Log10 energy<br />
Log10 energy<br />
–1<br />
–3<br />
–4<br />
–5<br />
–6<br />
–8<br />
–2.5<br />
–3<br />
–3.5<br />
–4<br />
–4.5<br />
–1<br />
–1.5<br />
TP Ht Power Spectrum<br />
Log10 frequency day –1<br />
–1 –0.5 0 0.5<br />
S3 56m {u, v} Power Spectrum<br />
Log10 frequency day –1<br />
–0.5 0 0.5<br />
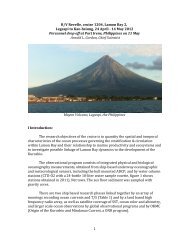
Figure 3. Power spectra [above, (a) and (b)] for BV (left) and TP (right) surface elevation records. <strong>Tidal</strong> peaks are clear at<br />
both stations, but tidal monthly peaks are obscured by competing processes—river flow and atmospheric effects. Power<br />
spectra [below, (c) and (d)] of alongshore currents in the CR plume are quite diverse; see (below left) stations N1 (always in<br />
plume) and (below right) S3 (intermittently in plume). The two year elevation records provide higher resolution than the<br />
shorter current records (3–5 months), but most of the differences arise from physical processes.<br />
–2<br />
–7<br />
Two alternative analyses have been developed that<br />
are premised upon the existence of basis functions<br />
with finite time durations, and non-zero spectral<br />
width. A short-time Fourier transform [STFT; also<br />
Gabor or Weyl-Heisenberg transform (Gabor,<br />
1946)] divided a record in<strong>to</strong> segments of equal<br />
length; each piece is separately Fourier transformed<br />
using an appropriate window g(t). In the STFT,<br />
g(t) fixes � t and � �, with the result that a single scale<br />
� set by the duration of g(t) is uniquely privileged in<br />
the analysis. Events with a characteristic period close<br />
<strong>to</strong> � or a little smaller are well resolved by the<br />
analysis, but bursts of high frequency activity with<br />
durations �� will be poorly resolved. Components of<br />
the signal at periods long compared <strong>to</strong> � cannot<br />
be correctly resolved without using longer filters.<br />
<strong>Tidal</strong> studies typically involve periods ranging from<br />
hours <strong>to</strong> months or longer, a range of scales unsuitable<br />
<strong>to</strong> the STFT; it will not be considered any<br />
further.<br />
1<br />
1
182 E. P. Flinchem and D. A. Jay<br />
The second approach is a wavelet transform in<br />
which a single pro<strong>to</strong>type function, � 0(t), similar <strong>to</strong> a<br />
bandpass filter, is built in<strong>to</strong> a complete basis set for<br />
L 2 (D), the class of functions whose integrated squared<br />
value is finite, by the introduction of scaling and<br />
translation parameters a and b, such that: � a,b(t)=a �p<br />
� 0[(t+b)/a], usually with p=0·5 or 1. The wavelet<br />
analysis approach used here relies upon the continuous<br />
wavelet transform (CWT), as opposed <strong>to</strong><br />
discrete, wavelet transform (DWT). In this context,<br />
‘ continuous ’ implies that an arbitrary number of<br />
basis functions built up from � 0(t) may be used<br />
<strong>to</strong> match tidal frequencies, as is necessary <strong>to</strong> make<br />
optimal use of information concerning astronomical<br />
forcing of the tides. The basis functions will not be<br />
orthogonal but are still complete. A DWT built up<br />
from functions with geometrically spaced frequencies<br />
can be both complete and orthogonal, but lacks the<br />
necessary frequency flexibility for tidal analysis. When<br />
applied <strong>to</strong> data, both DWTs and CWTs must be<br />
defined at a set of discrete points in time, as usual for<br />
digital filters. As a general rule, CWTs are better<br />
for dynamical analyses, while DWTs are preferred<br />
for data compression (Farge, 1992).<br />
Complex demodulation or CM (Bloomfield, 1976)<br />
is also sometimes used <strong>to</strong> calculate time-varying tides,<br />
usually for only a few frequencies. Complex demodulation<br />
is, however, a less systematic form of the<br />
techniques discussed here. Were it <strong>to</strong> be used <strong>to</strong><br />
extract a spectrum of information, it would have <strong>to</strong> be<br />
implemented as either a CWT or a STFT. Given the<br />
limitations of STFT, it is only through CWTs that the<br />
time and frequency uncertainties can be systematically<br />
treated <strong>to</strong> provide a useful approach <strong>to</strong> non-stationary<br />
tides; i.e. <strong>to</strong> give an optimal, self-consistent and<br />
approximately invertible extraction of an entire<br />
spectrum of tidal and non-tidal variance.<br />
<strong>Wavelet</strong> analysis represents a synthesis of developments<br />
in mathematics, physics, electrical engineering,<br />
and computer science. Some aspects of wavelet theory<br />
were prefigured in papers dating back <strong>to</strong> Harr (1910),<br />
as reviewed by Meyer (1993). But the first exposition<br />
of the modern wavelet transform was Morlet et al.<br />
(1982). Vetterli and Herley (1992) and Rioul and<br />
Vetterli (1991) provide broad overviews of the main<br />
concepts in wavelet analysis with minimal mathematical<br />
detail. More formal approaches are presented<br />
by Heil and Walnut (1989), Kaiser (1994) and<br />
Daubechies (1988, 1992). Farge (1992) provides a<br />
summary of work in turbulence research making use<br />
of wavelets. Selected geophysical applications are<br />
reviewed by Kumar and Foufoula-Georgiou (1997),<br />
mostly using DWTs or wavelet packet analysis.<br />
Oceanographic usage of wavelets is not yet common,<br />
and the closest analogue <strong>to</strong> what follows has been<br />
CWT analysis of wind waves (e.g. Liu, 1994; Donelan<br />
et al., 1996). Still, tidal analysis using CWTs remains<br />
distinctive in its constraints on the selection of frequencies<br />
and its range of scales, among other fac<strong>to</strong>rs.<br />
Almost inseparable from the idea of times-series<br />
analysis is the issue of reliability of spectral estimates.<br />
<strong>An</strong>alysis of the physics of non-stationary signals is<br />
straightforward only when the dynamically forced part<br />
of its variance is substantially greater than the random<br />
(e.g. instrumental) part. This is true because the<br />
statistics of distributions are not relevant <strong>to</strong> a nonstationary<br />
time series as a whole, and cannot, taking<br />
the dissection of the time series <strong>to</strong> its logical and<br />
necessary conclusion, be used <strong>to</strong> define error bounds<br />
on the calculated frequency content at any particular<br />
time. A CWT of a time series is essentially a representation<br />
of the data on a different set of basis vec<strong>to</strong>rs.<br />
Individual components thereof no more have reliability<br />
estimates than a single data point viewed in isolation.<br />
Yet it is these individual estimates that are<br />
required <strong>to</strong> analyse the events making up a nonstationary<br />
record. Furthermore, familiar time-series<br />
statistics are not applicable <strong>to</strong> processes that do not<br />
conform <strong>to</strong> a Gaussian distribution. Many nonstationary<br />
processes, for example the shelf internal<br />
tides discussed here, are strongly influenced by large,<br />
relatively infrequent events (freshets or s<strong>to</strong>rms)<br />
imposed on a background of smaller fluctuations in<br />
non-tidal forcing. To argue that non-parametric<br />
statistics could be applied <strong>to</strong> the distributions of<br />
transformed data misses the point—statistics based on<br />
distributions cannot inform us as <strong>to</strong> the reliability of<br />
individual, dynamically crucial results in a nonstationary<br />
time series (e.g. tidal amplitudes during a<br />
brief s<strong>to</strong>rm). Suggested below is an alternative point of<br />
view of the reliability of such transformed data, based<br />
on the Heisenberg Principle.<br />
The aim in the remainder of this paper is <strong>to</strong><br />
summarize the mathematical basis of CWTs in a<br />
context familiar <strong>to</strong> oceanographers, <strong>to</strong> show how their<br />
properties complement those of HA and the Fourier<br />
transform, <strong>to</strong> illustrate their strengths with example<br />
calculations drawn from concrete research problems,<br />
and <strong>to</strong> provide a level of detail sufficient for others <strong>to</strong><br />
begin applying the technique <strong>to</strong> their own research.<br />
Approach <strong>to</strong> tidal analysis<br />
Harmonic analysis<br />
To motivate the introduction of CWT analysis, it is<br />
helpful <strong>to</strong> examine the foundations of HA and the<br />
critical assumptions about the tide in the ocean which
must be satisfied for HA <strong>to</strong> apply. HA describes the<br />
changing elevation of the sea surface at a point as a<br />
sum of a finite number of cosine waves with specific<br />
amplitudes, frequencies, and phases, H(t)=�A icos(� i<br />
�+� i). The frequencies � i are given, a priori, asthe<br />
small integer multiples, sums, and differences of six<br />
fundamental periodicities of the earth-moon-sun system.<br />
The A i and � i are free parameters which are<br />
matched <strong>to</strong> observations by the method of leastsquares.<br />
Doodson (1922) identified c. 400 terms in<br />
the gravitational potential with magnitudes >10 �4<br />
relative <strong>to</strong> the largest fac<strong>to</strong>r, including periods as long<br />
as 19 years. Six primary assumptions about the tide<br />
and how it is measured need <strong>to</strong> be satisfied for HA <strong>to</strong><br />
meet its full potential; specifically:<br />
(a) The only forcing affecting sea level is the<br />
oscillating gravitational potential.<br />
(b) The gravitational potential is descried by a finite<br />
number of harmonic terms, all of which have<br />
been identified and have precisely determined<br />
frequencies.<br />
(c) The sea surface behaves like a damped, driven<br />
dynamical system oscillating in a stationary state.<br />
There are no transient excitations; only a timeless,<br />
particular solution <strong>to</strong> the inhomogeneous problem<br />
is present. This assumption contains the<br />
premise that the structure of the ocean’s density<br />
field is either constant or irrelevant.<br />
(d) The tide gauge is passive, hence measuring the<br />
system without disturbing it.<br />
(e) The tide gauge has a known response function<br />
that may be de-convolved from the data.<br />
(f) The input record is longer than the period of the<br />
lowest frequency in the forcing and its sampling<br />
rate is more than twice the frequency of the fastest<br />
term in the forcing.<br />
If all six assumptions hold, then HA will yield an<br />
exact description of the input time series, and it may<br />
be inverted <strong>to</strong> reconstruct the input and <strong>to</strong> predict<br />
the tide for past and future times. Certainly (b), (d),<br />
and (e) are all safe or represent technical, not fundamental,<br />
impediments. Darwin (1886) was aware that<br />
(a) and (c) are, in practice, questionable. His aim<br />
was <strong>to</strong> isolate the stationary tide, so he recommended<br />
avoiding confounding fac<strong>to</strong>rs: ‘ (t)he height<br />
of the water is subject <strong>to</strong> considerable perturbation<br />
from the weather, and the most perfect tide table is<br />
. . . when abstraction is made of the disturbing<br />
causes ’. The issues raised by (a) and (c) are more<br />
complex, however, than this statement indicates: the<br />
tidal processes of interest are influenced or modified<br />
by non-tidal processes.<br />
<strong>Introduction</strong> <strong>to</strong> wavelet transform tidal analysis methods 183<br />
Harmonic analysis involves, moreover, a non-linear<br />
transformation of the data, and this can cause difficulties<br />
when dealing with non-stationary data. Godin<br />
(1998) demonstrates a variety of unrealistic results<br />
from HA that can result from the nonlinear and<br />
mutually dependent behaviour of nearby spectral<br />
bands, even when the non-stationarity is mild relative<br />
<strong>to</strong> the examples considered below. Jay and Flinchem<br />
(1999) define the mathematical properties of HA that<br />
lead <strong>to</strong> such behaviour. Short HA analysis windows<br />
cause mixing of information amongst tidal frequencies<br />
and between tidal frequencies and frequencies not<br />
included in the HA. This issue is of little concern for<br />
analysis of long records of stationary data, because the<br />
interaction terms are inversely proportional <strong>to</strong> analysis<br />
window length and become negligible for window<br />
lengths >15–30 days. Conversely, this non-linearity<br />
poses a major challenge for analyses of non-stationary<br />
processes and short records, where � lim �t����0 (t)=O<br />
�� 0(t)dt=0 (3)
184 E. P. Flinchem and D. A. Jay<br />
Figure 4. Real ( ) and imaginary ( ) parts of typical Kaiser-filter D 1,D int, D 2 and D 3 wavelets used for hourly data. Each<br />
filter has c. 6 cycles; the D 1 filter is 145 h long. The scaling is such that a unit input wave at each scale yield unit output<br />
amplitude.<br />
where unless otherwise specified, integration is over<br />
the entire real line. These properties guarantee that<br />
the wavelet is ‘ wavelike ’ (has no zero-frequency<br />
energy) and localized in time-frequency space. The<br />
constraints of Equation (5) are quite broad, and there<br />
is wide latitude in the choice of the form of � 0(t).<br />
From � 0(t) a two-parameter family of functions<br />
is defined by scaling and translating the argument<br />
(Figure 4). For 0>a>� and ��>b>�:<br />
If a and b are continuous, � a,b(t) forms a complete<br />
basis for L 2 (D), analogous <strong>to</strong> the Fourier integral<br />
transform basis set [exp(i2��t)] over [��+�]. Setting<br />
p=0·5 ensures that all basis functions have the<br />
same variance, regardless of scale, i.e.: ��� 0(t)� 2<br />
dt=�� a,b(t)� 2 dt for all a, b, a>0. Choosing p=1 causes<br />
an input wave with unit amplitude 1 <strong>to</strong> have unit<br />
output for all scales.<br />
The forward wavelet transform is a convolution<br />
similar <strong>to</strong> a Fourier transform:<br />
Zy a,b=ga,b [Z(t)]��Z(t)� *<br />
a,bdt (5)<br />
(where the inverted hat denotes the transformed<br />
quantity) so that Zy is the CWT of Z. Like the Fourier<br />
transform, the CWT has an inverse, or synthetic form:<br />
The completeness of the set {� a,b(t)} means that<br />
Equations (5) and (6) form a reversible transform<br />
pair, analogous <strong>to</strong> Equation (3). Consequently, the<br />
CWT shares with the Fourier transform the desirable<br />
property of conserving variance. The inverse formula,<br />
Equation (6), valid in continuous time and scale<br />
domain (scale is inverse <strong>to</strong> frequency), has an<br />
analogue in discrete, finite implementations, but a<br />
boundable error is then incurred (Kaiser, 1994).<br />
Other important properties of wavelet transforms<br />
The Heisenberg Principle [Equation (1)] defined the<br />
minimum product of time and frequency uncertainties<br />
that may be achieved by any analysis. It is clear from<br />
definitions (2) and (5) that:<br />
� t(� a,b)=a � t(� 0) � �(� a,b)=a �1 � �(� 0) (7)<br />
Therefore, the CWT maintains the relation<br />
� ��t =constant, with constant close <strong>to</strong> the optimum<br />
allowed by Equation (1) for all basis vec<strong>to</strong>rs across all<br />
scales. This is a property unique <strong>to</strong> wavelet transforms,<br />
and one of the key facts that make them useful.<br />
<strong>An</strong>other essential property of wavelet transforms is<br />
their linearity; they are additive and distributive:
for any wavelet transforms g i, functions Z in L 2 (D)<br />
and any complex constant � (Holschneider, 1995).<br />
These properties guarantee that results in one frequency<br />
band are independent of those in other bands,<br />
so that the frequency responses of a wavelet and of a<br />
CWT analysis using a series of wavelet filters are<br />
well-defined functions. This is emphatically not the<br />
case for HA, and short HA windows have frequency<br />
responses that depend on the details of the data<br />
analysed and the number of analysis frequencies<br />
chosen.<br />
Practical application <strong>to</strong> tides<br />
A strategy for wavelet tidal analysis will be defined<br />
here. Application of Equations (4) and (5) requires<br />
that a and b be discretized, with a chosen <strong>to</strong> match<br />
tidal frequencies. Certain choices of a�2, b and � 0<br />
will still form a complete basis. In most wavelet<br />
applications, data compression is optimized and<br />
redundancy avoided by expressing a and b in geometric<br />
series, so that the time step bn increases in size<br />
along with scale an: n n<br />
an=a0 ,110 million oscillations of the highest<br />
audible frequency, allowing precise inversion and<br />
great compression. Despite its imperfect analysis of<br />
low-frequency variance, CWT methods still possess<br />
an important advantage for tidal records—frequency<br />
spacing can be made more or less constant with scale,<br />
rather than decreasing at the low-frequency end, as<br />
with an FFT or HA.<br />
A dense, even sampling in scale and time yields only<br />
small errors in reproduction of the data after transformation;<br />
sparse sampling introduces larger errors. A<br />
partially redundant approach with >1 voice per octave<br />
is useful for tidal analysis, because this: (a) matches<br />
the expected tidal frequencies, (b) eases restrictions<br />
on wavelet form, (c) provides robustness in the face of<br />
noisy data, and (d) allows a smooth transition between<br />
the distinct analysis needs in the tidal and sub-tidal<br />
bands. The result is a ‘ snug frame ’ that approximately<br />
conserves variance and allows reconstruction<br />
of the signal from its CWT. Dynamical studies (as<br />
opposed <strong>to</strong> optimal data compression) also dictate<br />
maintenance of a constant b for all scales, so that<br />
time-series at different scales may be compared <strong>to</strong><br />
each other and <strong>to</strong> external forcing. If one output<br />
per input is produced at each scale, then the analysis<br />
is said <strong>to</strong> have ‘ maximum overlap ’ (Percival &<br />
Mojfield, 1997). For tidal analysis, decimation of<br />
hourly data <strong>to</strong> 6, 12 or 24 h estimates at each frequency<br />
is typical. This is redundant at low frequencies,<br />
and only the highest tidal frequencies suffer<br />
a loss of detail during reconstruction.<br />
The idea that analysis needs for the tidal and<br />
subtidal bands require rather different approaches<br />
bears further explanation. In typical wavelets applications<br />
(e.g. image processing) there are no preferred<br />
frequencies, and the emphasis is on representation of<br />
the data as completely and compactly as possible. But<br />
even non-stationary tidal processes usually show,<br />
within the tidal band, a concentration of energy at<br />
tidal frequencies [e.g. Figure 3(a,c)]. Considering this<br />
and other fac<strong>to</strong>rs, most investigations of tidal dynamics<br />
should: (a) employ wavelets that look as much like<br />
a linear wave as possible, (b) provide information<br />
concerning processes occurring at tidal frequencies,
186 E. P. Flinchem and D. A. Jay<br />
Response<br />
1<br />
0.8<br />
0.6<br />
0.4<br />
0.2<br />
–2<br />
–1.5<br />
(c) allow inversion (and thus, possible prediction),<br />
and (d) minimize overlap between tidal frequencies,<br />
without presuming that non-tidal processes are absent<br />
in the tidal band. The spacing of major tidal species<br />
D 1 (diurnal), D 2 (semidiurnal), D 3 (terdiurnal), D 4<br />
(quarterdiurnal), D 6 (sixth-diurnal), D 8 (eighthdiurnal)<br />
. . . up <strong>to</strong> the Nyquist frequency gives two<br />
voices (filters) per octave except between D 1 and D 2.<br />
This series is completed by adding filters known as:<br />
(a) D Int, centred at the local intertial frequency,<br />
conveniently between D 1 and D 2 in temperate latitudes,<br />
and (b) D H centred at (1·41 day �1 ), <strong>to</strong> match<br />
smoothly <strong>to</strong> subtidal filters (Figure 5). This scheme<br />
gives, a 0=√2 inEquation (9), with all values of n close<br />
<strong>to</strong> integral. � 0 is chosen so that overlap between the<br />
tidal species is as small as possible. The result is good<br />
compromise—there is some unevenness in frequency<br />
spacing <strong>to</strong> accommodate tidal and inertial signals, but<br />
(because of finite filter width) little loss of non-tidal<br />
variance present in the tidal band. One may further<br />
add species such as D 5,D 7 . . . if desired, though this<br />
will increase overlap between frequencies.<br />
There are, in contrast <strong>to</strong> the tidal band, usually no<br />
preferred frequencies in the subtidal band. Given the<br />
more or less continuous frequency distribution, overlap<br />
between frequency bands is desirable, for robustness<br />
against noise and completeness. Several<br />
approaches are possible here. One is <strong>to</strong> continue down<br />
through the subtidal with two voices per octave<br />
Log10 frequency, cy day –1<br />
–1<br />
–0.5<br />
Figure 5. Response functions for the five subtidal filters (left; 30 days <strong>to</strong> 2 days) and seven tidal filters (right; D H <strong>to</strong> D 6)<br />
typically used with hourly data for records of length up <strong>to</strong> c.0·5 years. Longer records allow use of additional low-frequency<br />
scales. Shorter sampling intervals (0·5 h or less) allow additional high-frequency scales. See text for discussion of filter<br />
properties.<br />
0<br />
0.5<br />
[a 0=√2 in Equation (9)] <strong>to</strong> the lowest frequency<br />
allowed by the length of record. Such a procedure will<br />
optimize reconstruction and maximize consistency in<br />
approach between the tidal and subtidal data. But the<br />
short length of oceanographic time series is frequently<br />
a problem, and the long resulting filters limit the<br />
lowest frequency that can be resolved. <strong>An</strong>other<br />
choice, followed here, is <strong>to</strong> reduce the number of<br />
‘ wiggles ’ (decrease �) in the basis function � 0 for the<br />
subtidal filters, shortening the subtidal filters while<br />
broadening their frequency response. It is then possible<br />
<strong>to</strong> represent subtidal frequencies with one voice<br />
per octave [a 0=2 in Equation (9)] and simultaneously<br />
<strong>to</strong> reach slightly lower frequencies. One can capture<br />
(Figure 5) tidal monthly variability with filters centred<br />
at 2 days, 3·75 days, 7·5 days, c. 15 days, c. 29·5 days<br />
. . . Some variability in � is also needed at lower<br />
frequencies <strong>to</strong> accommodate 6 month and 1 year<br />
filters.<br />
It is also necessary <strong>to</strong> choose a specific wavelet � 0(t)<br />
<strong>to</strong> implement. A major fac<strong>to</strong>r in this regard is the<br />
problem of energy leakage in<strong>to</strong> the side-lobes. Optimal<br />
for minimizing side-lobe energy under discrete<br />
convolution are the prolate spheroidal wave functions.<br />
Unfortunately, they cannot be expressed in a closed<br />
form convenient for computation. Kaiser (1974),<br />
however, derived an accurate approximation <strong>to</strong> the<br />
prolate windows in terms of zero-order modified<br />
Bessel functions, I 0(t). The Kaiser window also has<br />
1
the highly desirable effect of minimizing Equation (1)<br />
<strong>to</strong> the point that � ��t �(4�) �1 , in a sense achieving<br />
the best transform theoretically possible. A wavelet is<br />
employed here constructed by windowing a complex<br />
exponential with a Kaiser filter:<br />
� a,b(t)=a �1 norm(�, a) � 0[(t�b)/a] (10b)<br />
where: side-lobe suppression is controlled by �, the<br />
number of cycles on either side of the central point is<br />
�, and norm(�,a) is a normalization fac<strong>to</strong>r that provides<br />
unit response for waves of unit amplitude. If<br />
frequencies are evenly spaced, norm is independent<br />
of a.<br />
Filter design always involves a balancing of fac<strong>to</strong>rs;<br />
side-band rejection (i.e. frequency resolution) and<br />
filter length (i.e. time resolution) are the primary<br />
issues here. For a Kaiser filter length specified by �,<br />
the frequency response of � a,0 around the frequency<br />
specified by a is controlled by �. Large values of �<br />
broaden the central peak of the Kaiser filter and<br />
increase the rejection of side-band energy. For<br />
example, �=6·755 gives a filter roll-off such that the<br />
first side-lobe is diminished by 70 db; �=4·533 yields<br />
a narrower central peak but a first sidelobe rejection<br />
of only 50 db. A large � is useful for the subtidal<br />
band where some overlap of central peaks is desired;<br />
this also provides very strong rejection of sidelobe<br />
response. However, � cannot be arbitrarily increased,<br />
or a very long filter will be required. Small values of �<br />
narrow the central peak at the cost of putting more<br />
energy in<strong>to</strong> the side bands. Decreasing � modestly<br />
from 6·755 allows shorter filters <strong>to</strong> function well in the<br />
tidal band. But sideband energy from D 2 and other<br />
large peaks can contaminate estimates in other bands,<br />
if � is <strong>to</strong>o small. Increasing filter length by increasing �<br />
tightens the response around the central point but<br />
has no effect on relative side-lobe height, which is<br />
controlled solely by �.<br />
Choosing �=�2–4 and � c.4·5–6 is compatible<br />
with a D 1 window of 96–192 h (4 <strong>to</strong> 8 wave periods);<br />
other tidal filters scale accordingly. This choice allows<br />
resolution of D H,D 1,D Int, D 2,D 3,D 4,D 6,D 8 ...,<br />
the maximum being determined according <strong>to</strong> the<br />
Nyquist criterion. If �> c.4, D 5 and D 7 can be<br />
resolved as well. For a record that is stationary over<br />
c. 15 days, �=c. 8–10 allows resolution of the three<br />
major semidiurnal constituents (M 2, N 2, and S 2)<br />
within the D 2 band. Using �=c. 2 and �=6–8 for the<br />
<strong>Introduction</strong> <strong>to</strong> wavelet transform tidal analysis methods 187<br />
subtidal band provides a desirable overlap between<br />
species in this part of the spectrum and mimimizes the<br />
length of the longer filters. A short data record will<br />
occasionally force �=2 for the tidal band; reducing<br />
� <strong>to</strong> 4–5 may then be desirable. However, species<br />
separated in frequency by a fac<strong>to</strong>r or two overlap for<br />
filters with �3 months is required <strong>to</strong> determine the three<br />
largest constituents. Designation of bands with tidal<br />
species nomenclature (D 1,D 2, etc.) does not mean,<br />
however, that the variance captured by such bands is<br />
exclusively tidal in origin.<br />
Discussion of examples<br />
The purpose here is <strong>to</strong> illustrate CWT analysis procedures<br />
and <strong>to</strong> demonstrate the utility of wavelets in<br />
tidal problems. In both of the two cases discussed,<br />
CWT methods lead <strong>to</strong> questions or hypotheses that<br />
would have been difficult <strong>to</strong> develop with other tidal<br />
methods, because least-square analyses cannot<br />
provide accurate results on the necessary time scales<br />
(Jay & Flinchem, 1999). It is not, however, the intent<br />
here <strong>to</strong> present detailed analyses, because this would,<br />
in each case, require an entire paper.
188 E. P. Flinchem and D. A. Jay<br />
Internal tides in a buoyant shelf plume<br />
Internal tides are no<strong>to</strong>riously unsteady (Sandstrom,<br />
1991), because their generation and propagation are<br />
strongly dependent on highly variable ambient<br />
density. Non-linearity of internal tides is recognized in<br />
principle (Maas & Zimmerman, 1989), but little is<br />
known about it in practice. A common, analytically<br />
difficult and physically complex example of internal<br />
tides arises when a buoyant river plume enters an open<br />
shelf environment. For reasons based in the difficulty<br />
of obtaining and analysing data concerning internal<br />
tides, internal tide analyses usually assume that:<br />
(a) there is a spectral separation between tidal and<br />
subtidal processes in both the velocity and density<br />
field; (b) only the D2 (and at some latitudes D1) motions are important; and (c) horizontal density<br />
gradients are small relative <strong>to</strong> those in the vertical, so<br />
that the vertical tide may be deduced from tidal<br />
excursions of the density field. <strong>An</strong>alyses show, in fact,<br />
that all three of the above assumptions are violated by<br />
the plume internal tides of interest here.<br />
The marked unsteadiness and non-linear nature of<br />
plume internal tides has several causes:<br />
(a) there are multiple forcing mechanisms, each of<br />
which is episodic or non-stationary;<br />
(b) the position of the buoyant plume that supports<br />
the internal tides is highly variable so that an<br />
instrument may be intermittently within the<br />
plume (Hickey et al., 1997)<br />
(c) a buoyant plume often occupies only a small<br />
fraction of the <strong>to</strong>tal water shelf column, leading <strong>to</strong><br />
finite amplitude non-linearity and <strong>to</strong> a possibly<br />
supercritical surface layer. Non-stationarity is<br />
enhanced because small alterations in layer thickness<br />
or external forcing can cause large changes in<br />
these very non-linear motions;<br />
(d) non-tidal processes (e.g. wind stress and shelf<br />
waves) may intrude in<strong>to</strong> the tidal band,<br />
forcing non-stationary tidal-frequency motions of<br />
non-tidal origin.<br />
The data analysed here come from a winter 1990–<br />
1991 Columbia River plume study. The period of<br />
observation was s<strong>to</strong>rmy, but without major freshet<br />
events [Figure 6(a,b)]. The low-frequency picture for<br />
stations that are in the path of the mean plume (e.g.<br />
N1, N2 and N5) is that river flow events lead <strong>to</strong><br />
increases in the stratification that supports internal<br />
tides, whereas s<strong>to</strong>rm winds destroyed stratification.<br />
Plume position is strongly influenced by winds, and<br />
this means that details of stratification time series<br />
north (the N and K stations) and south (station O5) of<br />
the estuary entrance differ. But all stratification time<br />
series show a dominant effect of stratification by river<br />
flow and destruction thereof by strong windstress<br />
events.<br />
The spatial variability of the internal tides within<br />
the plume area can be seen from their time-average<br />
spectral qualities [Figure 3(c,d)]. Station N1 shows a<br />
velocity power spectrum reminiscent of estuarine<br />
currents, with well-defined D 1,D 2 and overtide peaks.<br />
Energy at the intertial peak is insignificant. Station S3,<br />
south of the estuary entrance (Figure 1), was only<br />
intermittently in the plume. This record provides a<br />
cautionary lesson for any method of tidal<br />
analysis—should we assert, despite the poor spectral<br />
separation of the D 1 peak, that the D 1 and D 2 peaks<br />
are both tidal? The signal cannot be described as<br />
‘ band-limited ’, and the fact that CWT or HA<br />
routines detect energy at a tidal frequency does not<br />
mean that the energy is tidal in origin. Still, examination<br />
of the S3 time series show that a qualified answer<br />
of ‘ yes ’ <strong>to</strong> the above question is merited—there are<br />
time periods when the tidal signal is clear and similar<br />
<strong>to</strong> other nearby stations. Note also that CWT<br />
methods are better than HA for records like<br />
Figure 3(d), because of the linearity of CWTs—<br />
energy falling outside of the tidal bands has no effect<br />
on results for the tidal bands. Finally, there is one<br />
common feature for stations N1 and S3—the band<br />
from c. 4 days <strong>to</strong> D 4 is more energetic than the lower<br />
frequencies (at least those whose amplitude can be<br />
determined with the available record).<br />
The tidal flow at N1 is highly non-stationary,<br />
despite the reasonably discrete power spectrum in<br />
Figure 3(c). <strong>An</strong> attempt <strong>to</strong> connect the observed<br />
temporal variability <strong>to</strong> the forcing functions shown in<br />
Figure 6 will help in the development of hypotheses<br />
concerning the processes generating internal tides in<br />
the plume area. A convenient way <strong>to</strong> examine time<br />
evolution of frequency structure is through a scaleogram,<br />
where amplitude (or phase) is plotted as a<br />
function of frequency over time. Windstress and<br />
stratification scaleograms [Figure 7(a,b)] show a continuity<br />
of energy across the tidal and near-subtidal<br />
that is sometimes, but not always, mirrored in the<br />
velocity field major and minor axes (not shown).<br />
<strong>Tidal</strong>-band wind fluctuations arise from the rapid<br />
succession of fronts characteristic of winter s<strong>to</strong>rms in<br />
the area. Little wonder then, that inertial frequency<br />
motion is stronger than D 1 (e.g. at Station S3) and<br />
even than D 2 at some other locations.<br />
These observations raise two methodological<br />
points. First, any analysis methods used <strong>to</strong> examine<br />
shelf tides should include the local inertial frequency,<br />
because of its physical importance and the often<br />
broad-band nature of atmospheric forcing. Especially
Fluxes (10 4 m 3 s –1 )<br />
δ sigma-t<br />
2<br />
1<br />
0<br />
5<br />
20<br />
15<br />
10<br />
5<br />
0<br />
0<br />
0<br />
20<br />
20<br />
if it is not included in a HA, then inertial energy not<br />
accounted for can dis<strong>to</strong>rt the remainder of the analysis<br />
(Jay & Flinchem, 1999). Second, an event in time<br />
(formally a mathematical singularity) will show a<br />
40<br />
Lowpassed O5, K5, N5, N3, and N1 Offset Strat<br />
40<br />
<strong>Introduction</strong> <strong>to</strong> wavelet transform tidal analysis methods 189<br />
Low-Pass River Flow, <strong>Tidal</strong> Flux and Total Windstress<br />
60<br />
80<br />
Days from 1/10/90<br />
60<br />
80<br />
Days from 1/10/90<br />
100<br />
100<br />
120<br />
120<br />
–2<br />
140<br />
Figure 6. Relationship of [above, (a)] river flow ( m 3 s �1 ), tidal outflow ( m 3 s �1 ), and negative of <strong>to</strong>tal windstress<br />
( dyne cm �2 ) �10 with the low-pass stratification [below, (b)] at stations O5 ( ), K5 (*), N5 ( ), N3 ( ), and N1 ( ),<br />
bot<strong>to</strong>m <strong>to</strong> <strong>to</strong>p in lower panel, all in sigma-t units offset for clarity by 0, 2, 4, 6, 8 units, respectively. River flow provides the<br />
buoyancy that supports plume stratification. Tides have a mixed effect, providing more buoyant outflow and stronger<br />
advection of low density water, but also more vertical turbulent mixing. Negative of the windstress is plotted, because of the<br />
destruction of stratification by wind-induced mixing. Stratification is calculated by subtracting a 2–5 m sigma-t at each station<br />
from a reference value taken at 65 m depth south of the entrance. The reference value varies temporally by c.�0·75 units<br />
from its mean. Its temporal structure has little influence on the frequency structure of the stratification, because near-surface<br />
fluctuations are much greater.<br />
140<br />
vertical ‘ influence cone ’ on a scaleogram that spreads<br />
(in time) <strong>to</strong>ward larger scales with longer filters. In<br />
the present case, separate events have influence cones<br />
that overlap at low frequencies. A stationary process<br />
0<br />
–1<br />
Stress (N m –2 )
190 E. P. Flinchem and D. A. Jay<br />
Figure 7. Amplitude scaleograms for (above) alongshore windstress and (below) for stratification at N5. Both records show<br />
substantial variation at 2–15 days. There are also sporadic, strong incursions of windstress in<strong>to</strong> the tidal band, and a definite<br />
continuity of process between the tidal and subtidal bands in the stratification record. Correlation of atmospheric, fluvial and<br />
tidal forcing functions (e.g. at 15 days periods) with each other makes unambiguous separation of cause and effect difficult<br />
with regard <strong>to</strong> tidal fluctuations in the velocity and density.
will, in contrast, produce horizontal con<strong>to</strong>urs on a<br />
scaleogram.<br />
The continuous nature of the stratification<br />
spectrum across the tidal band has important implications<br />
for tidal analysis. First, linear tidal theory<br />
assumes the existence of a spectral separation between<br />
mean and tidal components of the velocity and density<br />
field. <strong>Tidal</strong> variations in density then arise from tidal<br />
advection, as described by the usual ‘ two-timing<br />
assumption ’. The relatively continuous velocity and<br />
stratification spectra observed at most stations in the<br />
plume do not fit the linear paradigm. These features<br />
are likely connected <strong>to</strong> one another, in that irregular<br />
advection of strong horizontal density gradients by<br />
fluctuating winds can flatten the velocity and density<br />
spectra. Second, isopycnal motions at individual<br />
moorings cannot be used <strong>to</strong> define the vertical tide,<br />
because they represent an unresolvable mix of<br />
horizontal and vertical advection. Finally, linear<br />
internal tide theories may also not be very useful in<br />
such a non-linear regime.<br />
The reasons for the variable response of the tidalband<br />
velocity field <strong>to</strong> wind forcing can be examined<br />
using a wavelet cross-coherence C xz defined for any<br />
two time series X and Z:<br />
where the brackets KL in the denomina<strong>to</strong>r denote a<br />
time average. The time-varying cross-product in the<br />
numera<strong>to</strong>r of Equation (11) has been normalized by<br />
the product of the time-mean amplitudes for the time<br />
series (equivalent <strong>to</strong> the usual practice in the Fourier<br />
realm), rather than the product of the instantaneous<br />
amplitudes (as per Liu, 1994). Normalization by the<br />
instantaneous amplitude product yields 0�C xz�1 (as<br />
in the Fourier realm), but the resulting C then conveys<br />
no information concerning the absolute amplitude of<br />
the processes relative <strong>to</strong> the mean. Normalization by<br />
the mean amplitudes yields C xz�0 (and sometimes<br />
�1), with the largest values indicating times when the<br />
two processes are strong and coherent.<br />
Windstress-velocity C xz scaleograms [Figure 8(a,b)]<br />
tell an interesting s<strong>to</strong>ry. Windstress encroaches on the<br />
tidal band during almost every s<strong>to</strong>rm, always forcing<br />
the inertial band, but exciting a variable reaction from<br />
the internal tides. In particular, the onshore D 1 and<br />
D 2-wind correlations are weak until December. We<br />
hypothesize, therefore, that there is a connection<br />
between river flow, background stratification, and<br />
windstress generation of internal tides. The connection<br />
may be as follows. Buoyancy input creates stratification,<br />
while windstress has more complex effects.<br />
<strong>Introduction</strong> <strong>to</strong> wavelet transform tidal analysis methods 191<br />
Winds destroy stratification by vertical mixing and<br />
advect the plume, but may also excite broad-spectrum<br />
oscillations including the tidal band. Perhaps the wind<br />
events early in the record (while river flow levels are<br />
low) fail <strong>to</strong> excite a substantial internal tide response<br />
because they reduce the background stratification <strong>to</strong>o<br />
severely before a substantial tidal response can<br />
develop. Complicating this situation is the subtidal<br />
wind-velocity correlation after c. 330 days. This variable,<br />
broad-band nature of the wind-tide correlation<br />
renders analysis of cause and effect difficult, in comparison<br />
for example, <strong>to</strong> the clear forcing of D 1 internal<br />
tides of California by a diurnal sea breeze (Rosenfeld,<br />
1990). Still, the atmospheric forcing of internal tides<br />
might have been <strong>to</strong>tally missed in this case without a<br />
CWT analysis of the windstress field.<br />
In summary, internal tidal frequency currents in<br />
the Columbia River plume are non-stationary and<br />
non-linear, and have multiple driving mechanisms.<br />
Figures 6–8 suggest that there are two internal tidal<br />
mechanisms active in the plume area: (a) propagation<br />
from the shelf break, and (b) generation by rapid wind<br />
fluctuations associated with frontal passages. If the<br />
data are probed further here, it is seen that the pattern<br />
of spatial and temporal overtides suggests a third<br />
mechanism, non-linear excursions of the interface at<br />
the estuary entrance. It was these complex dynamics<br />
and difficulties in application of HA <strong>to</strong> this data set<br />
that first caused the authors <strong>to</strong> investigate CWTs as an<br />
alternative tidal analysis method. The brief discussion<br />
here also shows that many traditional time-series<br />
analysis <strong>to</strong>ols (e.g. the cross-coherence and a rotary<br />
presentation of current species) have analogues in the<br />
wavelet world. CWTS provide the flexibility <strong>to</strong> use<br />
such <strong>to</strong>ols <strong>to</strong> examine evolution of the frequency<br />
content. Once the evolution of frequency content is<br />
known, then it is possible <strong>to</strong> analyse (only qualitatively<br />
here) the multiple internal tide forcing processes.<br />
Furthermore, analysis of all the fluctuating variance,<br />
not just the tidal component thereof, leads <strong>to</strong> a<br />
different view of tidal processes than would be the<br />
case with the usual methods.<br />
<strong>Tidal</strong>ly modulated microbial productivity in an estuarine<br />
turbidity maximum<br />
The second example investigates the possibilities of<br />
expanding tidal analysis <strong>to</strong> study tidally influenced<br />
biological processes, and suggests a new form of<br />
significance calculation appropriate <strong>to</strong> non-stationary<br />
data. Time series of biological variables with the<br />
requisite sampling interval and duration for tidal<br />
analysis are scarce, largely because of the difficulties in<br />
obtaining observations. But time-series analysis has in
192 E. P. Flinchem and D. A. Jay<br />
Figure 8. <strong>Wavelet</strong> coherence as a function of scale and time for (above) onshore internal velocity and windstress and (below)<br />
alongshore internal velocity and windstress. Vertical structures crossing the tidal band are indicative of a broad-band response<br />
<strong>to</strong> wind forcing that is often continuous across the tidal band. There is also considerable velocity-windstress coherence at 15<br />
days, which renders separation of tidal and atmospheric effects on the velocity field difficult.<br />
principle the same power <strong>to</strong> elucidate biological<br />
processes as has proven <strong>to</strong> be the case in fluid mechanics.<br />
Considered here is particle-attached bacterial<br />
productivity (PABP) in an ETM; PABP is small<br />
outside the ETM. Microbes play a major role in<br />
detritally based estuarine food chains, and understanding<br />
controls on their productivity is an important<br />
issue (Baross et al., 1994; Crump et al., 1997).<br />
Because microbes are small, their productivity can<br />
respond rapidly <strong>to</strong> environmental changes. Observations<br />
in the Columbia River ETM show that PABP<br />
and <strong>to</strong>tal bacterial productivity are similar in magnitude<br />
and temporal structure in that system, because<br />
the after column bacterial productivity is always much<br />
smaller than that associated with particles; only PABP<br />
is considered here.<br />
The data employed here come from an c. 9 day<br />
occupation of station NC (Figure 1) in the Columbia<br />
River North Channel ETM during a moderate spring<br />
freshet in May 1995. Observations (every 2 h for<br />
biological parameters, every 0·25–0·5 h for physical<br />
variables) begin during a weak spring and evolve<br />
<strong>to</strong>ward the neap tide. The diurnal inequality of the<br />
tides and location of this station was such that each<br />
greater ebb removed all salt from the water column,<br />
while salt remained near the bed on each lesser ebb.<br />
This pattern is fortui<strong>to</strong>us but very useful in analysing<br />
controls on PABP, because the time series of PABP
µg c 1 h –1<br />
ht (m on MSL)<br />
5<br />
4<br />
3<br />
2<br />
1<br />
0<br />
–10<br />
0<br />
131 132 133 134 135 136 137 138<br />
Time (Julian days 1995)<br />
–20<br />
131<br />
132<br />
133<br />
shows a very striking pattern. There are three maxima<br />
and one minimum every tidal day [Figure 9(a)]. The<br />
minimum occurs during the greater ebb when salt is<br />
removed from the near-bed area, bedstress is very<br />
strong, and sand is transported in suspension. There is<br />
a maximum on each flood and on the weaker ebb; the<br />
latter is sometimes the strongest peak of the day. In<br />
the frequency domain, PABP shows very strong<br />
diurnal and terdiurnal responses [Figure 10(b)].<br />
The question naturally arises in attempting <strong>to</strong> understand<br />
controls on PABP, what physical variables<br />
show a frequency domain signature similar <strong>to</strong> PABP?<br />
In fact, this particular signature is rather exotic and<br />
does not match any of the usual parameters, e.g.<br />
velocity, bedstress, density, and suspended particulate<br />
matter (SPM) levels. It does, however, strongly<br />
<strong>Introduction</strong> <strong>to</strong> wavelet transform tidal analysis methods 193<br />
Total, attached and free bacterial production<br />
<strong>Tidal</strong> height, bed depth and depth of maximum N2<br />
134 135 136<br />
Julian day, 1995 L1 series<br />
Figure 9. Above: time-series of <strong>to</strong>tal ( ), particle attached bacterial production (PABP) ( ) and free ( ) bacterial<br />
production. PABP is the dominant signal and is closely related <strong>to</strong> maximum N 2 in the water column. Below: tidal elevation<br />
on Mean Lower Low Water (MLLW) ( ), depth of maximum N 2 (�) and bot<strong>to</strong>m depth ( ) on MLLW. Maximum N 2<br />
moves higher in the water column on flood and down <strong>to</strong>ward the bed on ebb, as salt is advected/mixed in and out of the<br />
system. Maximum N 2 is high on each flood and on lesser ebb. Total absence of salt on greater ebb is indicated by intersection<br />
of maximum N 2 with the bed. Oscilla<strong>to</strong>ry bot<strong>to</strong>m depth is caused by swinging of the sampling vessel.<br />
137<br />
138<br />
139<br />
139<br />
resemble the time series of near-bed maximum in<br />
water column stability N 2 =g/� 0 )�/)z [Figures 9(b)<br />
and 10(a)]. Maximum gradient Richardson number<br />
Ri g=N 2 /S 2 (where S 2 =|)U H/)z| 2 and U H is the horizontal<br />
velocity) also shows a similar frequency signature<br />
<strong>to</strong> PABP, but the ADCP data used <strong>to</strong> determine<br />
shear are coarse in terms of spatial resolution, relatively<br />
noisy and do not always reach close enough <strong>to</strong><br />
the bed <strong>to</strong> reach the level of maximum stratification.<br />
We consider, therefore, the relevance of N 2 , remembering<br />
that it may be a surrogate for Ri g. Shear stress<br />
at the bed is necessary <strong>to</strong> suspend the aggregates<br />
[O(1 mm) in diameter in the Columbia ETM] that<br />
support PABP, but <strong>to</strong>o much shear disrupts the<br />
aggregates, apparently decreasing PABP in the process.<br />
There was sufficient shear during the c. 9 day
194 E. P. Flinchem and D. A. Jay<br />
Figure 10. Amplitude scaleograms of maximum N 2 (above) and PABP (below). Both show dominantly D 1 and D 3 <strong>to</strong> D 5<br />
energy. The sharpness of overtide peaks seen especially in maximum N 2 reflects the reorganization of the water column on<br />
greater ebbs, and is seen in the velocity field was well.<br />
period <strong>to</strong> allow some re-suspension of aggregates,<br />
either locally on the bed at NCA or at locations<br />
upstream. PABP was then highest under relatively<br />
stable conditions (N 2 high), so that aggregate were not<br />
disrupted.<br />
Several qualifications and comments are in order.<br />
First, the above statistical resemblance between N 2<br />
and PABP time/frequency domain signatures does not<br />
prove the existence of a causal connection between the<br />
two. The resemblance might be merely a non-causal<br />
coincidence. However, a plausible mechanism is available.<br />
<strong>An</strong>d given the present state of knowledge concerning<br />
physical controls on PABP, the above result<br />
provides a valuable starting point for experimentation<br />
(perhaps in the labora<strong>to</strong>ry) <strong>to</strong> determine the actual<br />
mechanism. Second, more or less energetic tides or<br />
lower river flows might reveal other controls. Finally, a<br />
slightly different balance of tidal amplitude, diurnal<br />
inequality, fluvial forcing and sampling position might<br />
have caused salt <strong>to</strong> be absent twice a day, <strong>to</strong>tally<br />
altering the frequency structures of N 2 and PABP. If<br />
these were high either twice or four times a day, then<br />
they would resemble many other tidal parameters,<br />
rendering the search for controls on PABP more<br />
difficult.<br />
This data set also illustrates two methodological<br />
points. The first is the utility of using shorter windows<br />
for smaller scales, conserving the uncertainty product<br />
in Equation (1). <strong>An</strong>alysis of this short (c. 9 days) data<br />
set required the use of the shortest possible filters, <strong>to</strong><br />
allow resolution of temporal change. The filters were<br />
97 h for D 1 [�=2 in (10) or four wave cycles at each<br />
scale] and correspondingly shorter for the smaller<br />
scales out <strong>to</strong> D 5, the highest possible frequency for the
sampling interval of 2 h available with the biological<br />
variables. Short filters exact a price in frequency<br />
resolution according <strong>to</strong> Equation (1), the effects of<br />
which we examine in the next paragraph. The use of<br />
these very short filters has, however, a positive side<br />
effect in terms of time resolution. The alongshore<br />
velocity amplitude scaleogram (Figure 11) shows a<br />
curious banded structure of D 3 and D 4 (filter lengths<br />
33 and 25 h, respectively). We hypothesize that once a<br />
day on the greater ebb when the velocity profile is<br />
<strong>to</strong>tally barotropic for c. 6 h, the overtide structure of<br />
<strong>Introduction</strong> <strong>to</strong> wavelet transform tidal analysis methods 195<br />
Figure 11. Amplitude scaleograms of D 2 (above) and D 3 (below) alongchannel currents. The D 2 record shows no signs of<br />
perturbation by the change in velocity structure on greater ebb. Over-tides like D 3 and D 4 show a complete re-organization<br />
once per tidal day.<br />
the flow changes drastically. This dynamical effect is<br />
not perfectly resolved even with CWTs, because the<br />
filter windows encompass several overtide wave<br />
periods <strong>to</strong> achieve the necessary frequency resolution.<br />
It would, however, be <strong>to</strong>tally missed in a STFT or<br />
HA approach, wherein in all windows have a length<br />
determined by the need <strong>to</strong> resolve D 1 and D 2.<br />
The second methodological point concerns the<br />
issue of the ‘ validity ’ of CWT estimates at each time<br />
and scale. As discussed above, it is not possible with<br />
non-stationary data <strong>to</strong> apply the sort of significance
196 E. P. Flinchem and D. A. Jay<br />
estimates used with power spectra, because these are<br />
appropriate only <strong>to</strong> stationary time series. It is possible,<br />
however, <strong>to</strong> define an approach based on the<br />
Heisenberg principle. Uncertainties in CWT estimates<br />
arise from ‘ cross-talk ’ between frequencies,<br />
because finite filters have finite-width spectral<br />
responses. Note that this cross-talk is not an error in<br />
the usual sense—the finite breadth of response of a<br />
filter may be useful or frustrating, depending on the<br />
context. <strong>An</strong> error arises only if one assigns all the<br />
variance captured through application of a broad filter<br />
(perhaps encompassing several tidal peaks) <strong>to</strong> the<br />
central species for which the filter is named. Still, a<br />
tidalist normally wishes <strong>to</strong> separately tally the variance<br />
in each species, and it is useful <strong>to</strong> know the fraction of<br />
variance in a output CWT band that may be associated<br />
with neighbouring frequencies. One way <strong>to</strong><br />
bound the degree of cross-talk is <strong>to</strong> use the frequency<br />
response function �(n,m) of each filter (the response at<br />
a scale m of the filter centred scale n) <strong>to</strong> compute a<br />
ratio R � of the output amplitude at scale n <strong>to</strong> the<br />
maximum amplitude of the cross-talk from adjacent<br />
(smaller and larger) scales (n�1):<br />
<strong>An</strong> R ��1 indicates only a small potential for interference<br />
between frequencies. R ��O(1) or less indicates<br />
that a given output is <strong>to</strong>o small <strong>to</strong> be reliably<br />
separated from outputs at neighbouring frequencies at<br />
a particular time. A small R � value is not, per se, bad;<br />
e.g.: (a) if a given frequency is not of interest, as is the<br />
case for inertial variations in PABP in an ETM where<br />
inertial currents are negligible; or (b) in analysis of an<br />
event that is, by definition, a multi-scale process. On<br />
the other hand, if one wishes <strong>to</strong> make dynamical<br />
comparisons between transform outputs and possible<br />
forcing functions, R �>1 is manda<strong>to</strong>ry and R ��1<br />
preferable.<br />
PABP serves as a good example of the cross-talk<br />
problem. The PABP scaleogram [Figure 10(b)] shows<br />
a mix of horizontal con<strong>to</strong>urs, indicative of continuity<br />
of process, and vertical ‘ event cones ’. To what degree<br />
are the frequencies distinguishable? Figure 12 shows<br />
R + (the cross-talk at a given scale from the next higher<br />
scale) and R � (the cross-talk at a given scale from the<br />
next lower scale) for selected PABP scales as an<br />
example. Cross-talk for the dominant D 1 and D 3<br />
scales in the PABP is negligible, but D 2 is sometimes<br />
only marginally significant, especially in the downscale<br />
direction.<br />
In summary, CWTs allow time series analyses<br />
methods <strong>to</strong> be applied <strong>to</strong> non-stationary biological<br />
variables, yielding hypotheses that would be difficult<br />
<strong>to</strong> generate otherwise. While spectral significance<br />
estimates (familiar from the realm of power spectra)<br />
cannot be applied, it is possible <strong>to</strong> define a cross-over<br />
ratio R �. This ratio is a measure of the possibility<br />
of establishing as a function of time, independent<br />
knowledge of processes between neighbouring<br />
frequencies.<br />
Summary and conclusions<br />
We have summarized the basic formulation of the<br />
CWT, shown how its properties complement those of<br />
HA and Fourier methods, defined a wavelet basis for<br />
unevenly spaced tidal frequencies, demonstrated how<br />
<strong>to</strong> adapt CWT <strong>to</strong>ols <strong>to</strong> concrete problems, described<br />
possibilities for analysis of scalar and vec<strong>to</strong>r quantities,<br />
defined a criterion for knowledge of independence of<br />
process between adjoining scales, illustrated the<br />
strengths of the method with calculations relevant <strong>to</strong><br />
two oceanographic problems, and provided details of<br />
the algorithms sufficient for the reader <strong>to</strong> begin applying<br />
CWTs <strong>to</strong> tidal problems. The results show how<br />
subtle features of the evolving frequency content of a<br />
non-stationary time series can be brought in<strong>to</strong> sharp<br />
relief for comparison <strong>to</strong> theory. The CWT enables a<br />
new mode of interplay between observation and<br />
theory which can only serve <strong>to</strong> invigorate the<br />
oceanographic sciences.<br />
<strong>Wavelet</strong> techniques are expected <strong>to</strong> prove invaluable<br />
<strong>to</strong> future studies of the non-linear, time dependent<br />
dynamics of estuaries and coastal seas. Likely<br />
applications include analyses of internal tides, short<br />
internal wave dynamics, effects of atmospheric forcing,<br />
and internal tidal asymmetry. Attention has been<br />
focused on tidal problems because they have a structure<br />
perfectly suited <strong>to</strong> showcasing the strengths of the<br />
wavelet transform. We believe, however, that wavelet<br />
methods will be applied routinely <strong>to</strong> a wide variety of<br />
wavelike and unsteady oceanographic processes,<br />
regardless of whether they are dynamical, chemical, or<br />
biological in nature.<br />
Finally, a word about prediction of tides with wavelets<br />
is appropriate. The potential utility of CWT<br />
analysis for forecast or hindcast activities depends on<br />
the character of the data. Given a stationary time<br />
series of sufficient length with a low noise level, all of<br />
the usual constituents within the tidal species may be<br />
resolved with CWT analysis. CWT analysis however,<br />
possesses, no particular advantages over HA for predictions<br />
in such circumstances. Moving in the direction<br />
of more difficult prediction problems, CWT<br />
methods first become competitive with HA for short<br />
stationary, but noisy records where extraction of the
Non-Dim<br />
Non-Dim<br />
Non-Dim<br />
4<br />
3<br />
2<br />
1<br />
0<br />
2<br />
1<br />
0<br />
–1<br />
–2<br />
4<br />
3<br />
2<br />
1<br />
0<br />
133<br />
133<br />
133<br />
134<br />
134<br />
134<br />
maximum number of constituents is necessary; e.g.<br />
for the problem of extracting the three major<br />
semidiurnals from
198 E. P. Flinchem and D. A. Jay<br />
reasonably accurate numerical models of the non-tidal<br />
forcing are available. In more complex cases such as<br />
the shelf internal tides discussed here, predictions may<br />
still be possible in a statistical sense. Thus, clima<strong>to</strong>logy<br />
might be used <strong>to</strong> define shelf circulation scenarios<br />
for a location and season and the frequency of occurrence<br />
of each scenario. Inversion of CWT analyses of<br />
data for the various scenarios could then be used <strong>to</strong><br />
predict the distribution of internal tidal responses for<br />
the period, if not the actual sequence of events.<br />
Acknowledgements<br />
Definition of CWT tidal analysis methods was supported<br />
primarily by the Office of Naval Research<br />
through Grant N00014-94-1-0009, and secondarily<br />
by National Science foundation Grants OCE-<br />
8918193 (Columbia River Plume Project) and OCE-<br />
9807118 (Columbia River Land-Margin Ecosystem<br />
Research Project; LMER). We thank Drs L. J.<br />
Pietrafesa of North Carolina State University and<br />
B. M. Hickey of the University of Washing<strong>to</strong>n for<br />
providing us with Columbia River plume data (collected<br />
under grant OCE-8918193). Revision of this<br />
manuscript by the second author was supported in<br />
part by Oceanographic and Environmental Characterization<br />
of Coastal Regions (OECCR; ONR Grant<br />
N00014-96-1-089). We are indebted <strong>to</strong> Dr J. Barross<br />
and B. Crump of the University of Washing<strong>to</strong>n for<br />
providing LMER microbial production data. Beaver<br />
tidal elevation and Columbia River flow data were<br />
provided by the US Geological Survey. Tongue Pt<br />
tidal data were provided by the National Ocean<br />
Survey.<br />
References<br />
Baross, J. A., Crump, B. & Simenstad, C. A. 1994 Elevated<br />
‘microbial loop’ activity in the Columbia river estuary turbidity<br />
maximum. In Changing Particle Fluxes in Estuaries: Implications<br />
from Science <strong>to</strong> Management (Dyer, K. & Orth, R., eds). Olsen and<br />
Olsen, Friedensborg, pp. 459–464.<br />
Bloomfield, P. 1976 Fourier <strong>An</strong>alysis of Time Series: an <strong>Introduction</strong>.<br />
John Wiley and Sons, New York, pp. 118–150.<br />
Cartwright, D. 1968 A unified analysis of tides and surges round<br />
north and east Britain. Philosophical Transactions of the Royal<br />
Society of London A263, 1–55.<br />
Crump, B. C., Baross, J. A. & Simenstad, C. A. 1997 Dominance<br />
of particle-attached bacteria in the Columbia River estuary.<br />
Aquatic Microbial Ecology 14, 7–18.<br />
Daubechies, I. 1988 Orthonormal bases of compactly supported<br />
wavelets. Communications in Pure and Applied Mathematics XLI,<br />
901–996.<br />
Daubechies, I. 1992 Ten Lectures on <strong>Wavelet</strong>s. SIAM, Philadelphia,<br />
357 pp.<br />
Darwin, G. H. 1886 A general article on the tides. In Admiralty<br />
Scientific Manual. The Admiralty, London, pp. 53–91.<br />
Darwin, G. H. 1891 On tidal prediction. Philosophical Transactions<br />
of the Royal Society of London A182, 159–229.<br />
Darwin, G. H. 1893 On an apparatus for facilitating the reduction<br />
of tidal observations, Proceedings of the Royal Society of London<br />
A52, 345–389.<br />
Doodson, A. T. 1922 The harmonic development of the tidegenerating<br />
potential. Proceedings of the Royal Society of London<br />
A100, 305–329.<br />
Donelan, M. A., Drennan, W. M. & Magnuson, A. K. 1996<br />
Nonstationary analysis of the directional properties of<br />
propagating waves. Journal of Physical Oceanography 26,<br />
1901–1914.<br />
Dronkers, J. J. 1964 <strong>Tidal</strong> Computations in Rivers and Coastal Waters.<br />
North-Holland, Amsterdam, pp. 219–304.<br />
Farge, M. 1992 <strong>Wavelet</strong> transforms and their applications <strong>to</strong><br />
turbulence. <strong>An</strong>nual Review of Fluid Mechanics 24, 395–475.<br />
Foreman, M. G. G. 1977 Manual for <strong>Tidal</strong> Heights <strong>An</strong>alysis and<br />
Prediction. IOS, Sidney, B.C., 101 pp.<br />
Gabor, D. 1946 Theory of communication. Journal of IEEE 93,<br />
429–457.<br />
Godin, G. 1972 The <strong>An</strong>alysis of Tides. University of Toron<strong>to</strong> Press,<br />
Toron<strong>to</strong>, 264 pp.<br />
Godin, G. 1991 Frictional effect in river tides. In Progress in <strong>Tidal</strong><br />
Hydrodynamics (Parker, B. B., ed.) John Wiley, New York,<br />
pp. 379–402.<br />
Godin, G. 1998 The propagation of tides up rivers, with special<br />
considerations on the Upper Saint Lawrence River. Estuarine,<br />
Coastal and Shelf Science 48, 307–324.<br />
Harr, A. 1910 Zur theorie der orthogonalen funktionensysteme.<br />
Math. <strong>An</strong>al. 69, 331–371.<br />
Heil, C. E. & Walnut, D. F. 1989 Continuous and discrete wavelet<br />
transforms. SIAM Review 31, 628–666.<br />
Hickey, B. M., Pietrafesa, L. J., Jay, D. A. & Boicourt, W. C. 1997<br />
The Columbia River plume study: subtidal variability in the<br />
velocity and salinity field. Journal of Geophysical Research 103,<br />
10339–10368.<br />
Holschneider, M. 1995 <strong>Wavelet</strong>s, <strong>An</strong> <strong>An</strong>alysis Tool. Clarendon<br />
Press, Oxford, pp. 1–31.<br />
Jay, D. A. & Flinchem, E. P. 1997 Interaction of fluctuating river<br />
flow with a barotropic tide: a test of wavelet tidal analysis<br />
methods. Journal of Geophysical Research 102, 5705–5720.<br />
Jay, D. A. & Flinchem, E. P. 1999 A comparison of methods<br />
for analysis of tidal records containing multi-scale non-tidal<br />
background energy. Continental Shelf Research 19, 1695–1732.<br />
Jay, D. A. & Musiak, J. D. 1994 Particle trapping in estuarine<br />
turbidity maxima. Journal of Geophysical Research 99,<br />
20 446–20 461.<br />
Kaiser, J. F. 1974 Nonrecursive digital filter design using the lo-sinh<br />
window function. In Proceedings of the IEEE International<br />
Symposium on Circuits and Systems. IEEE, New York, pp. 20–23.<br />
Kaiser, J. F. 1994 A Friendly Guide <strong>to</strong> <strong>Wavelet</strong>s. Birkhäuser, 300 pp.<br />
Kumar, P. & Foufoula-Georgiou, E. 1997 <strong>Wavelet</strong> analysis for<br />
geophysical applications. Reviews in Geophysics 35, 385–412.<br />
Liu, P. C. 1994 <strong>Wavelet</strong> spectrum analysis and ocean wind waves.<br />
In <strong>Wavelet</strong>s in Geophysics (Foufoula-Georgiou, E. & Kumar, P.,<br />
eds), pp. 151–166.<br />
Maas, L. R. M. & Zimmerman, J. T. F. 1989 Tide-<strong>to</strong>pography<br />
interactions in a stratified shelf sea l. Basic equations for quasinonlinear<br />
internal tides. Geophysical and Astrophysical Fluid<br />
Dynamics 45, 1–35.<br />
Meyer, Y. 1993 <strong>Wavelet</strong>s: Algorithms and Applications. SIAM,<br />
Philadelphia, 133 pp.<br />
Morelet, J., Arens, G., Fourgeau, E. & Giard, D. 1982 Wave<br />
propagation and sampling theory, Part v: Complex signal and<br />
scattering in multilayered media. Geophysics 47, 203–221.<br />
Munk, W. H. & Cartwright, D. E. 1965 <strong>Tidal</strong> spectroscopy and<br />
prediction. Philosophical Transactions of the Royal Society of London<br />
A259, 533–581.<br />
Percival, D. B. & Mojfield, H. O. 1997 <strong>An</strong>alysis of subtidal coastal<br />
sea level fluctuations using wavelets. Journal of the American<br />
Statistical Association 92, 868–880.
Prandle, D. & Wolf, J. 1981 The interaction of surge and tide in the<br />
North Sea and River Thames. Geophysical Journal of the Royal<br />
Astronomical Society 55, 203–316.<br />
Rioul, O. & Vetterli, M. 1991 <strong>Wavelet</strong>s and signal processing. IEEE<br />
Signal Processing Magazine 8, 14–38.<br />
Rosenfeld, L. K. 1990 Baroclinic semidiurnal tidal currents over the<br />
continental shelf off Northern California. Journal of Geophysical<br />
Research 95, 22153–22173.<br />
Sandstrom, H. 1991 The origin of internal tides. In Progress in <strong>Tidal</strong><br />
Hydrodynamics (Parker, B. B., ed.). John Wiley, New York,<br />
pp. 437–448.<br />
Vetterli, M. & Herley, C. 1992 <strong>Wavelet</strong>s and filter banks: theory<br />
and design. IEEE Transactions in Signal Processing 40, 2207–2232.<br />
Appendix<br />
The purpose of this Appendix is <strong>to</strong> provide sufficient<br />
information that readers could themselves write a<br />
wavelet tidal analysis program. The code described<br />
here was written in the Mathematica � language,<br />
though there is nothing (aside from convenience)<br />
about the problem that especially suggests the use<br />
of this language. Matlab � or any other higher-level<br />
language would, do as well. A code written in C or<br />
Fortran might be more efficient computationally, but<br />
would be more difficult <strong>to</strong> implement. Commerical<br />
wavelet transform packages do not usually allow<br />
unevenly spaced frequencies matched <strong>to</strong> the tides,<br />
‘ maximum overlap ’ output, or different filter properties<br />
in the tidal and subtidal bands; these features<br />
require special-purpose software. Sample routines are<br />
available from U.S. Geological Survey’s SeaMat<br />
Web-site: http://crusty.er.usgs.gov/sea-mat/<br />
Described here is a program that analyses only a<br />
single scalar time series. Vec<strong>to</strong>r time series add the<br />
additional issue of rotary calculations based on wavelet<br />
transform results (not discussed here), but the<br />
initial transform of each vec<strong>to</strong>r component is carried<br />
out as below. ADCPs produce vec<strong>to</strong>r time series at<br />
multiple depths, but again, the fundamental analysis<br />
method is the same. Data <strong>to</strong> be analysed should be<br />
evenly spaced in time, with a time interval, �t,<br />
suitable <strong>to</strong> tidal data; typically a few minutes <strong>to</strong> c<br />
1 h. The program described here does not use absolute<br />
astronomical phases, as would typically be<br />
defined by a harmonic analysis routine. While absolute<br />
phases could be implemented, experience with<br />
results from non-stationary oceanographic timeseries<br />
does not suggest that this would be a useful<br />
exercise. Whenever a tidal time-series is sufficiently<br />
non-stationary that an analysis of the sort described<br />
here is actually necessary, resolution of tidal constituents<br />
is not possible. The multiple constituents<br />
within each species then cause considerable phase<br />
variability, which can only be increased by non-tidal<br />
processes.<br />
<strong>Introduction</strong> <strong>to</strong> wavelet transform tidal analysis methods 199<br />
The code described here employs a direct, CWT<br />
transformation of the data. It is computationally more<br />
efficient <strong>to</strong> calculate the wavelet transform indirectly<br />
from a fast Fourier transform (FFT) of the data.<br />
There are several reasons why we did not pursue this<br />
approach:<br />
(a) Use of an FFT requires a number of data points<br />
that is a power or two, or the data must be assumed<br />
periodic. Given non-stationary data and a desire <strong>to</strong><br />
achieve a quantitative output, truncation of the data<br />
set <strong>to</strong> the next lowest power of two is the only<br />
alternative for an FFT analysis. Most oceanographic<br />
data sets are <strong>to</strong>o short <strong>to</strong> make this an attractive<br />
strategy.<br />
(b) The FFT approach cannot deal with crucial lowfrequency<br />
information as optimally as the direct<br />
CWT.<br />
(c) The direct transform approach is far more flexible<br />
in choice of frequencies and choice of filters than an<br />
FFT. Although the issue is not discussed here, it is<br />
also possible with a CWT (as with HA) <strong>to</strong> extract tidal<br />
information from data with gaps. This is not possible<br />
with a conventional FFT routine.<br />
The code is divided in<strong>to</strong> the following sections: (a)<br />
definition of data properties, (b) definition of analysis<br />
properties, (c) convolution, wavelet and filter definitions,<br />
(d) the actual transform calculations, and (e)<br />
plotting of results. The essential data properties that<br />
must be specified are: the time-series start time (in<br />
local time), the �t, the number of data and the station<br />
latitude (the latter for definition of the inertial frequency<br />
filter). The data are then loaded in<strong>to</strong> the<br />
analysis vec<strong>to</strong>r (a process which is carried out repeatedly<br />
for vec<strong>to</strong>r and ADCP analyses). The time basis of<br />
the program is seconds.<br />
Definition of the analysis properties includes several<br />
steps:<br />
(a) Base filter lengths are determined for the tidal<br />
and subtidal filters. The user sets the length of the<br />
D 1 filter (an odd number), and the lengths of other<br />
tidal filters vary with scale as in Equation (1). <strong>An</strong><br />
equivalent D 1 length (possibly shorter than that<br />
for the tidal frequencies) is then set for the subtidal<br />
filters. D 1 is obviously not a subtidal filter, but it is<br />
conceptually simple <strong>to</strong> choose the distinct resolution<br />
properties (determined in part by filter length) of the<br />
tidal and subtidal bands using the D 1 filter. Separate<br />
decimation fac<strong>to</strong>rs may also be employed for the tidal<br />
and subtidal analyses. Filter frequencies were discussed<br />
in the text and include the local inertial frequency,<br />
thus the necessity of including the latitude as<br />
an input.
200 E. P. Flinchem and D. A. Jay<br />
(b) The number of frequencies <strong>to</strong> be used is set for<br />
the tidal and for the subtidal bands <strong>to</strong> provide the<br />
maximum possible range of scales, as determined by<br />
record length and Nyquist criterion. The number of<br />
points in each filter (an odd number) is calculated<br />
from the filter base lengths and �t. Because both the<br />
record length and the �t value varies with the data<br />
set, it is convenient <strong>to</strong> index the tidal and subtidal<br />
frequencies separately, with the lowest indices pertaining<br />
<strong>to</strong> the lowest tidal and highest subtidal<br />
frequencies.<br />
(c) Phase calculations (below) require that the start<br />
time of each filter output be determined from the data<br />
start time and the filter length. One could calculate<br />
the centre times of the outputs, but decimation of the<br />
outputs complicates this approach.<br />
(d) Windowing shifts the frequency of a windowedsinusoid<br />
<strong>to</strong> a frequency slightly higher than the nominal<br />
frequency of the sinusoid itself. The astronomical<br />
frequencies are, therefore, adjusted slightly so that the<br />
peak of each wavelet’s response function will correspond<br />
<strong>to</strong> the desired astronomical frequency, after<br />
digitization and windowing. For a 145 h window, the<br />
actual frequency exceeds the nominal frequency by<br />
1.04%, for a 97 h window, the difference is 2.33%.<br />
Many aspects of this code would be simpler if the<br />
decimation fac<strong>to</strong>rs, �t and base filter lengths were<br />
invariant, but this would rob the code of its general<br />
utility for a large variety of problems.<br />
Convolution, wavelet, and filter definitions include<br />
the following aspects:<br />
(a) The convolution definition is conventional; if a<br />
built-in definition is available, it may be used.<br />
(b) The mother wavelet is defined according <strong>to</strong><br />
Equation (10), with � chosen separately for the tidal<br />
and subtidal filters, as described in the text.<br />
(c) Actual (complex) filter values are chosen for each<br />
filter, based on the filter lengths and �t, note that<br />
the filters use the complex conjugate of the mother<br />
wavelet, as per Equation (5).<br />
(d) A normalization constant is determined for each<br />
filter so that a unit input wave provides a unit output<br />
response in each case. Filter plots are optional.<br />
(e) The response of each filter at each other scale is<br />
then determined; this information may be used <strong>to</strong><br />
calculate R� but is not otherwise essential.<br />
(f) For convenience in further data analyses, we<br />
calculate a lowpass (i.e. subtidal) filter. A low-lowpass<br />
filter matched <strong>to</strong> the lowest-frequency subtidal<br />
wavelet may also be defined.<br />
The application of the wavelet filter bank <strong>to</strong> the data<br />
proceeds as follows:<br />
(a) The mean of the data is determined and subtracted<br />
from the input. A somewhat more sophisticated<br />
approach is <strong>to</strong> subtract a suitably chosen<br />
lowpass. Whatever strategy is adopted here, the intent<br />
is <strong>to</strong> address the problem that short filters inevitably<br />
suffer some leakage of low-frequency energy, because<br />
they do not (in discrete form) integrate exactly <strong>to</strong> zero.<br />
(b) The lowpass and wavelet filters are convolved<br />
successively with the data (with mean subtracted),<br />
resulting in a series of complex output vec<strong>to</strong>rs. The<br />
order of filter application is not important, because<br />
there is no subtraction of the output variance from the<br />
input time series.<br />
(c) <strong>An</strong> amplitude vec<strong>to</strong>r is determined from each<br />
complex output, as is the length of each output vec<strong>to</strong>r.<br />
(d) Phases are rendered ‘ absolute ’, relative <strong>to</strong> a<br />
reference time: 00.00h 1/1/1900 (local time), without<br />
any reference <strong>to</strong> astronomical properties. This operation<br />
requires two types of information: (a) the phase<br />
relative <strong>to</strong> the time of each output is determined from<br />
each ‘ raw ’ complex output, and (b) the phase of each<br />
output time is determined relative <strong>to</strong> the reference<br />
time. The primary purpose of ‘ unwrapping ’ the<br />
phase is <strong>to</strong> eliminate the dependence of output phase<br />
on filter central time. A collateral benefit is that<br />
comparisons of phases between time series (within the<br />
same time zone) may also be made.<br />
Plotting of results can occur in a variety of forms.<br />
Time series of amplitudes and phases at each scale is<br />
the obvious first item. Amplitude and phase scaleograms<br />
are often useful. The details of this process are<br />
<strong>to</strong>o data and language-dependent <strong>to</strong> merit further<br />
comment here.