DEPARTMENT OF FISHERIES ANNUAL REPORT TO THE ...
DEPARTMENT OF FISHERIES ANNUAL REPORT TO THE ...
DEPARTMENT OF FISHERIES ANNUAL REPORT TO THE ...

You also want an ePaper? Increase the reach of your titles
YUMPU automatically turns print PDFs into web optimized ePapers that Google loves.
SUMMARy <strong>OF</strong> <strong>THE</strong> yEAR � FINANCIAL OvERvIEw<br />
The cost of services is three per cent more<br />
than last year ($71.8m in 2010/11; $69.5m in<br />
2009/10). This cost includes depreciation and non<br />
cash items consumed in delivering services.<br />
The $18m increase in the Department’s total<br />
cost of services over the last five years ($71.9m<br />
in 2010/11; $53.8m in 2006/07) has been<br />
significantly impacted by major financial movements<br />
illustrated in Figure 2b.<br />
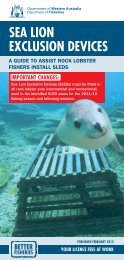
The figure shows the total cost of services in<br />
2006/07 and the major financial movements that<br />
have contributed to the cumulative increase in the<br />
total cost of services ending in 2010/11.<br />
Major policy decisions, an increase on<br />
demand for services, and cost escalations from<br />
Consumer Price Index-related increases and award<br />
adjustments are the largest contributors to the<br />
overall change in total cost of services.<br />
The introduction of the Recreational Fishing<br />
from Boat Licence in 2010 has resulted in<br />
additional activity in the area of recreational fishing.<br />
This has further contributed to the increase in the<br />
total cost of services for 2010/11 under major<br />
financial movement ‘Major policy decisions’ (see<br />
Figure 2b and Table 2b) although recreational<br />
licence fees help recover a proportion of the<br />
increase in costs for the related activities.<br />
See also Figure 2c and Table 2c for the list of<br />
major policy decisions that have impacted on total<br />
cost of services since 2006/07.<br />
Figure 2b. Summary of major financial movements between total cost of services<br />
in 2006/07 and 2010/11<br />
$' 000<br />
70,000<br />
60,000<br />
50,000<br />
40,000<br />
30,000<br />
20,000<br />
10,000<br />
0<br />
table 2b.<br />
53,799<br />
Total cost of<br />
services 2006/07<br />
-3,051<br />
One-off expenditure<br />
decrease from<br />
2006/07<br />
-2,032<br />
Shared services<br />
and other<br />
savings harvests<br />
9,095<br />
Major policy<br />
decisions (a)<br />
3,383<br />
Cost escalation<br />
and award<br />
adjustments (b)<br />
MAJOR FINANCIAL MOVEMENTS<br />
2,200<br />
One-off increase<br />
in employee<br />
long service leave<br />
entitlements (c)<br />
8,497 71,891<br />
Services offset<br />
by revenue and<br />
othercosts<br />
SummAry of mAJor fINANcIAl movemeNtS BetweeN totAl<br />
coSt of ServIceS IN 2006/07 ANd 2010/11<br />
$’000<br />
Major policy decisions (a) 9,095<br />
Cost escalation and award adjustments (b) 3,383<br />
One-off increase in employee long service leave entitlements (c) 2,200<br />
Services offset by revenue and other costs<br />
Less<br />
8,497<br />
One-off expenditure decrease from 2006/07 (3,051)<br />
Shared services and other savings harvests (2,032)<br />
totAl 18,092<br />
(a) See Table 1C for a list of policy decisions implemented over the last five years.<br />
(b) Cost escalations are mainly due to non salary related costs whilst award<br />
adjustments have increased salary costs.<br />
(c) See also notes with respect to Figure 21 ‘Employee Benefits Provision Ratio’.<br />
Total cost<br />
of services<br />
2010/11<br />
19