DEPARTMENT OF FISHERIES ANNUAL REPORT TO THE ...
DEPARTMENT OF FISHERIES ANNUAL REPORT TO THE ...
DEPARTMENT OF FISHERIES ANNUAL REPORT TO THE ...

Create successful ePaper yourself
Turn your PDF publications into a flip-book with our unique Google optimized e-Paper software.
DISCLOSURES AND LEgAL COMPLIANCE � DETAILED kEy PERFORMANCE INDICA<strong>TO</strong>RS<br />
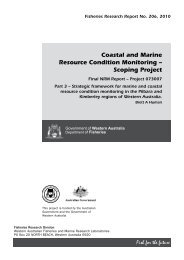
KPI Figure 8. Satisfaction rating of the broader<br />
community and the Department’s<br />
stakeholders 2001/02 – 2010/11<br />
PERCENTAGE<br />
100<br />
90<br />
80<br />
70<br />
60<br />
50<br />
40<br />
30<br />
20<br />
10<br />
0<br />
81<br />
2001/2002<br />
2002/2003<br />
83 84 84<br />
68<br />
2003/2004<br />
2004/2005<br />
74<br />
66<br />
2005/2006<br />
82<br />
2006/2007<br />
YEAR<br />
72<br />
79<br />
2007/2008<br />
81<br />
2008/2009<br />
65<br />
Community<br />
Stakeholders<br />
81<br />
75<br />
2009/2010<br />
2010/2011<br />
efficiency Indicators<br />
The Department’s efficiency indicators have been<br />
calculated by dividing the total service cost in<br />
a functional area by the hours delivered in that<br />
functional area.<br />
The measures enable analysis of variance in<br />
costs from year-to-year and provide a benchmark for<br />
comparison against like service delivery.<br />
The reported hourly cost includes a<br />
component to cover fixed indirect costs.<br />
In calculating the efficiency indicator targets,<br />
it is assumed that the Department will operate at<br />
full capacity (i.e. all positions occupied) for the full<br />
year. This is not normally the case and consequently<br />
67<br />
153<br />
the target cost per hour is normally less than the<br />
actual cost. This fact is demonstrated in the closer<br />
alignment between the actual results from one year<br />
to the next.<br />
Explanations for those variances greater than<br />
10 per cent have been included within each service.<br />
Outcome: Conservation and sustainable<br />
development of the State’s fish resources<br />
Service 1: fisheries management<br />
Service Description: Fisheries management includes<br />
licensing, the development of policy and procedural<br />
frameworks for the management of the State’s<br />
fisheries, aquaculture and the aquatic environment<br />
including legislation and management plans,<br />
consultation with fishing industry stakeholders and<br />
the community.<br />
Efficiency in Service 1 is described as the<br />
average cost per hour for services delivered<br />
excluding payments for grants and fisheries<br />
adjustment schemes.<br />
KPI table 2. Service 1<br />
Service 1 Fisheries Actual Target Actual Variance Variance<br />
Management<br />
Average cost<br />
2009/10 2010/11 2010/11 Actual Target<br />
per hour of<br />
management<br />
(excluding grants<br />
and fisheries<br />
adjustments)<br />
$117 $109 $152 $35 $43