DEPARTMENT OF FISHERIES ANNUAL REPORT TO THE ...
DEPARTMENT OF FISHERIES ANNUAL REPORT TO THE ... DEPARTMENT OF FISHERIES ANNUAL REPORT TO THE ...
DISCLOSURES AND LEgAL COMPLIANCE � DETAILED kEy PERFORMANCE INDICATORS PERCENTAGE 100% 80% 60% 40% 20% 0% 55% 2001/02 68% 2002/03 77% 2003/04 2004/05 86% 86% 2005/06 Percentage of fisheries where catch share is known Percentage of fisheries where catch share allocation is in progress 60% 2006/07 YEAR 53% 2007/08 59% 2008/09 2009/10 64% 61% 2010/11 KPI Figure 3. the proportion (%) of fisheries or fished stocks where estimates of catch shares are known and the proportion (%) of fisheries or fished stocks where catch sharing allocations are in progress or in place. Objective 2 – Maximise the economic Benefit to the State 2.1 the contribution to the State’s gross value of output The Department seeks to manage the State’s fisheries in an economically, socially and environmentally sustainable manner. This performance indicator deals with the economic component of the ‘triple bottom line’ approach. 147 Sustainably managed commercial fisheries provide benefits to the State as a result of significant local sales and export earnings from fish and fish products. Commercial fisheries that are not managed sustainably will suffer a reduced value of production as less fish products will be available to the catching and marketing sectors. The value, at first point of sale, of the production from WA’s commercial and pearling/ aquaculture sectors is published by the Australian Bureau of Agricultural and Resource Economics and Sciences (ABARES) annually, based on data supplied by industry to the Department’s Research Division. Information for the years 2007/08 to 2009/10 in broad groupings is provided in Table 1. The target is for production and value to be stable or increasing. The overall tonnage of commercially-caught crustaceans in 2009/10 was down compared to 2008/09, mainly reflecting the drop in lobster catch. The decline in production value was again exacerbated by the markets and the exchange rate affecting the value of the lobster, prawn and crab catches. Some improvements in lobster price helped to ameliorate the effects of the poor exchange rate. The production and value of the molluscan fisheries in 2009/10 were substantially lower than obtained in 2008/09. This was primarily due to low catches of scallops, especially in the Shark Bay scallop fishery, along with the effects of the poor exchange rate.
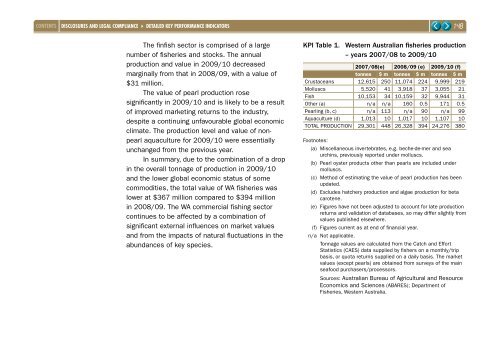
DISCLOSURES AND LEgAL COMPLIANCE � DETAILED kEy PERFORMANCE INDICATORS The finfish sector is comprised of a large number of fisheries and stocks. The annual production and value in 2009/10 decreased marginally from that in 2008/09, with a value of $31 million. The value of pearl production rose significantly in 2009/10 and is likely to be a result of improved marketing returns to the industry, despite a continuing unfavourable global economic climate. The production level and value of nonpearl aquaculture for 2009/10 were essentially unchanged from the previous year. In summary, due to the combination of a drop in the overall tonnage of production in 2009/10 and the lower global economic status of some commodities, the total value of WA fisheries was lower at $367 million compared to $394 million in 2008/09. The WA commercial fishing sector continues to be affected by a combination of significant external influences on market values and from the impacts of natural fluctuations in the abundances of key species. 148 KPI table 1. Western Australian fisheries production – years 2007/08 to 2009/10 2007/08(e) 2008/09 (e) 2009/10 (f) tonnes $ m tonnes $ m tonnes $ m Crustaceans 12,615 250 11,074 224 9,999 219 Molluscs 5,520 41 3,918 37 3,055 21 Fish 10,153 34 10,159 32 9,944 31 Other (a) n/a n/a 160 0.5 171 0.5 Pearling (b, c) n/a 113 n/a 90 n/a 99 Aquaculture (d) 1,013 10 1,017 10 1,107 10 TOTAL PRODUCTION 29,301 448 26,328 394 24,276 380 Footnotes: (a) Miscellaneous invertebrates, e.g. beche-de-mer and sea urchins, previously reported under molluscs. (b) Pearl oyster products other than pearls are included under molluscs. (c) Method of estimating the value of pearl production has been updated. (d) Excludes hatchery production and algae production for beta carotene. (e) Figures have not been adjusted to account for late production returns and validation of databases, so may differ slightly from values published elsewhere. (f) Figures current as at end of financial year. n/a Not applicable. Tonnage values are calculated from the Catch and Effort Statistics (CAES) data supplied by fishers on a monthly/trip basis, or quota returns supplied on a daily basis. The market values (except pearls) are obtained from surveys of the main seafood purchasers/processors. Sources: Australian Bureau of Agricultural and Resource Economics and Sciences (ABARES); Department of Fisheries, Western Australia.
- Page 99 and 100: AgENCy PERFORMANCE � SERvICE 3 -
- Page 101 and 102: AgENCy PERFORMANCE � CASE STUDy 4
- Page 103 and 104: AgENCy PERFORMANCE � SERvICE 4 -
- Page 105 and 106: AgENCy PERFORMANCE � CORPORATE SE
- Page 107 and 108: AgENCy PERFORMANCE � CORPORATE SE
- Page 109 and 110: DISCLOSURES AND LEgAL COMPLIANCE As
- Page 111 and 112: DISCLOSURES AND LEgAL COMPLIANCE
- Page 113 and 114: DISCLOSURES AND LEgAL COMPLIANCE
- Page 115 and 116: DISCLOSURES AND LEgAL COMPLIANCE
- Page 117 and 118: DISCLOSURES AND LEgAL COMPLIANCE
- Page 119 and 120: DISCLOSURES AND LEgAL COMPLIANCE
- Page 121 and 122: DISCLOSURES AND LEgAL COMPLIANCE
- Page 123 and 124: DISCLOSURES AND LEgAL COMPLIANCE
- Page 125 and 126: DISCLOSURES AND LEgAL COMPLIANCE
- Page 127 and 128: DISCLOSURES AND LEgAL COMPLIANCE
- Page 129 and 130: Reconciliation Reconciliations of t
- Page 131 and 132: 28 other lIABIlItIeS 2011 2010 $’
- Page 133 and 134: DISCLOSURES AND LEgAL COMPLIANCE
- Page 135 and 136: DISCLOSURES AND LEgAL COMPLIANCE
- Page 137 and 138: DISCLOSURES AND LEgAL COMPLIANCE
- Page 139 and 140: DISCLOSURES AND LEgAL COMPLIANCE
- Page 141 and 142: DISCLOSURES AND LEgAL COMPLIANCE
- Page 143 and 144: DISCLOSURES AND LEgAL COMPLIANCE
- Page 145 and 146: DISCLOSURES AND LEgAL COMPLIANCE
- Page 147 and 148: DISCLOSURES AND LEgAL COMPLIANCE
- Page 149: DISCLOSURES AND LEgAL COMPLIANCE
- Page 153 and 154: DISCLOSURES AND LEgAL COMPLIANCE
- Page 155 and 156: DISCLOSURES AND LEgAL COMPLIANCE
- Page 157 and 158: DISCLOSURES AND LEgAL COMPLIANCE
- Page 159 and 160: DISCLOSURES AND LEgAL COMPLIANCE
- Page 161 and 162: DISCLOSURES AND LEgAL COMPLIANCE
- Page 163 and 164: DISCLOSURES AND LEgAL COMPLIANCE
- Page 165 and 166: DISCLOSURES AND LEgAL COMPLIANCE
- Page 167 and 168: DISCLOSURES AND LEgAL COMPLIANCE
- Page 169 and 170: APPENDICES � ADvISORy COMMITTEES
- Page 171 and 172: APPENDICES � MAjOR PUbLICATIONS P
- Page 173 and 174: APPENDICES � LEgISLATIvE AMENDMEN
- Page 175 and 176: APPENDICES � LEgISLATIvE AMENDMEN
- Page 177 and 178: APPENDICES � LEgISLATIvE AMENDMEN
- Page 179 and 180: APPENDICES � LEgISLATIvE AMENDMEN
- Page 181 and 182: APPENDICES � LEgISLATIvE AMENDMEN
- Page 183 and 184: APPENDICES � STATE REgISTER OF AU
- Page 185 and 186: APPENDICES � STATE REgISTER OF AU
- Page 187 and 188: APPENDICES � STATE REgISTER OF AU
- Page 189 and 190: APPENDICES � STATE REgISTER OF AU
- Page 191 and 192: APPENDICES � STATE REgISTER OF AU
- Page 193 and 194: APPENDICES � STATE REgISTER OF AU
- Page 195 and 196: APPENDICES � STATE REgISTER OF AU
- Page 197 and 198: APPENDICES � STATE REgISTER OF AU
- Page 199 and 200: APPENDICES � STATE REgISTER OF AU
DISCLOSURES AND LEgAL COMPLIANCE � DETAILED kEy PERFORMANCE INDICA<strong>TO</strong>RS<br />
The finfish sector is comprised of a large<br />
number of fisheries and stocks. The annual<br />
production and value in 2009/10 decreased<br />
marginally from that in 2008/09, with a value of<br />
$31 million.<br />
The value of pearl production rose<br />
significantly in 2009/10 and is likely to be a result<br />
of improved marketing returns to the industry,<br />
despite a continuing unfavourable global economic<br />
climate. The production level and value of nonpearl<br />
aquaculture for 2009/10 were essentially<br />
unchanged from the previous year.<br />
In summary, due to the combination of a drop<br />
in the overall tonnage of production in 2009/10<br />
and the lower global economic status of some<br />
commodities, the total value of WA fisheries was<br />
lower at $367 million compared to $394 million<br />
in 2008/09. The WA commercial fishing sector<br />
continues to be affected by a combination of<br />
significant external influences on market values<br />
and from the impacts of natural fluctuations in the<br />
abundances of key species.<br />
148<br />
KPI table 1. Western Australian fisheries production<br />
– years 2007/08 to 2009/10<br />
2007/08(e) 2008/09 (e) 2009/10 (f)<br />
tonnes $ m tonnes $ m tonnes $ m<br />
Crustaceans 12,615 250 11,074 224 9,999 219<br />
Molluscs 5,520 41 3,918 37 3,055 21<br />
Fish 10,153 34 10,159 32 9,944 31<br />
Other (a) n/a n/a 160 0.5 171 0.5<br />
Pearling (b, c) n/a 113 n/a 90 n/a 99<br />
Aquaculture (d) 1,013 10 1,017 10 1,107 10<br />
<strong>TO</strong>TAL PRODUCTION 29,301 448 26,328 394 24,276 380<br />
Footnotes:<br />
(a) Miscellaneous invertebrates, e.g. beche-de-mer and sea<br />
urchins, previously reported under molluscs.<br />
(b) Pearl oyster products other than pearls are included under<br />
molluscs.<br />
(c) Method of estimating the value of pearl production has been<br />
updated.<br />
(d) Excludes hatchery production and algae production for beta<br />
carotene.<br />
(e) Figures have not been adjusted to account for late production<br />
returns and validation of databases, so may differ slightly from<br />
values published elsewhere.<br />
(f) Figures current as at end of financial year.<br />
n/a Not applicable.<br />
Tonnage values are calculated from the Catch and Effort<br />
Statistics (CAES) data supplied by fishers on a monthly/trip<br />
basis, or quota returns supplied on a daily basis. The market<br />
values (except pearls) are obtained from surveys of the main<br />
seafood purchasers/processors.<br />
Sources: Australian Bureau of Agricultural and Resource<br />
Economics and Sciences (ABARES); Department of<br />
Fisheries, Western Australia.


