Chapter 4 - DSpace at Waseda University
Chapter 4 - DSpace at Waseda University
Chapter 4 - DSpace at Waseda University

Create successful ePaper yourself
Turn your PDF publications into a flip-book with our unique Google optimized e-Paper software.
51<br />
<strong>Chapter</strong> 4<br />
problem_separ<strong>at</strong>ion_d<strong>at</strong>a() function is the main function in SL. For lastly, the<br />
problem_analysis() function is the main function in AL.<br />
4.4 Trace Point and Event Log<br />
Most of commonly used system performance tools and kernel analysis tools can be logging<br />
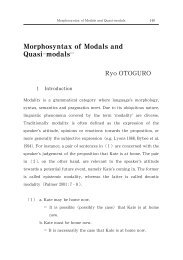
after adding trace point to the kernel source. Looking <strong>at</strong> Figure 4.12, a trace point is added to<br />
the kernel source and added trace point is recognized during a running event log tracer<br />
daemon and an added event is logged.<br />
Figure 4.12: Rel<strong>at</strong>ion between trace point and event log<br />
When there is a wanted event log is KAS, a trace point is added to LTTng. Then, the event<br />
log daemon of LTTng log event. Figure 4.13 is an example of adding the trace point. First, to<br />
trace event inform<strong>at</strong>ion from the kernel, the kernel source is modified. After th<strong>at</strong>, add the<br />
event name th<strong>at</strong> was added to the kernel source to event_name.h file. By doing this, it is