Septoria and Stagonospora Diseases of Cereals - CIMMYT ...
Septoria and Stagonospora Diseases of Cereals - CIMMYT ...
Septoria and Stagonospora Diseases of Cereals - CIMMYT ...

Create successful ePaper yourself
Turn your PDF publications into a flip-book with our unique Google optimized e-Paper software.
28<br />
Session 1 — S. Hamza, M. Medini, T. Sassi, S. Abdennour, M. Rouassi, A.B. Salah, M. Cherif, R. Strange, <strong>and</strong> M. Harrabi<br />
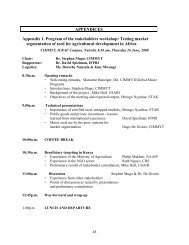
Table 2. Experimental code <strong>and</strong> origin <strong>of</strong> Mycosphaerella graminicola collected from Morocco<br />
<strong>and</strong> Tunisia to study genetic variation for virulence.<br />
Isolates collected from Tunisia Isolates collected from Morocco<br />
Origin Origin<br />
Code Location Wheat species Code Location Wheat species<br />
TUN1 Beja DW MAR1 Jemaa Sham BT<br />
TUN2 Mateur DW MAR2 Douyet BT<br />
TUN3 Mornag DW MAR3 Agadir BT<br />
TUN4 El Agba DW MAR4 Ain Orma BT<br />
TUN5 Zaghouane DW MAR5 Azrou BT<br />
TUN6 Siliana DW MAR6 Essaouira BT<br />
TUN7 Mjez El Bab DW MAR7 Tetouan BT<br />
were performed in a volume <strong>of</strong> 50<br />
µl containing 50 mM KCl, 10 mM<br />
Tris-HCl, pH8.3, 1.5 mM MgCl2,<br />
200 µM <strong>of</strong> dNTP, 50 pmole <strong>of</strong><br />
primer, 2.5 units <strong>of</strong> Taq<br />
polymerase (Boerhringer-<br />
Manheim) <strong>and</strong> 25 ng <strong>of</strong> genomic<br />
DNA. Reactions were run in a<br />
Thermolyne, Temptronic model<br />
thermal cycler for 30 cycles, each<br />
consisting <strong>of</strong> 15s at 94°C, 15 s at<br />
50°C, <strong>and</strong> 45 s at 72°C. An<br />
additional 5 min polymerization<br />
step at 72°C ended the<br />
amplification. The products were<br />
analyzed by electrophoresis <strong>of</strong> 20<br />
µl aliquot <strong>of</strong> each PCR sample on<br />
0.8% agarose gel.<br />
Specific DNA amplifications<br />
were performed as determined by<br />
Beck <strong>and</strong> Ligon (1995). ITS1 <strong>and</strong><br />
JB446 (5’-<br />
CGAGGCTGGAGTGGTGT-3’)<br />
primers were used for specific<br />
amplification <strong>of</strong> S. tritici DNA <strong>and</strong><br />
JB433 (5’-<br />
ACACTCAGTAGTTTACTACT-3’)<br />
<strong>and</strong> JB434 (5’-<br />
TGTGCTGCGTTCAATA-3’) were<br />
used to amplify S. nodorum DNA.<br />
PCR was performed as described<br />
above, except the annealing<br />
temperature was 57°C.<br />
ITS sequencing was performed<br />
using 90 ng <strong>of</strong> 500 bp amplified<br />
product with ITS1 <strong>and</strong> ITS4. The<br />
sequence was determined by the<br />
dideoxynucleotide chain<br />
termination method using an<br />
automated sequencer (Perkin<br />
Elmer) at the Darwin Building <strong>of</strong><br />
University College London<br />
(London, United Kingdom).<br />
Fungal DNA amplification in<br />
resistant <strong>and</strong> susceptible<br />
cultivars<br />
To evaluate the competition <strong>of</strong><br />
plant DNA with fungal DNA using<br />
ITS1 <strong>and</strong> ITS4 primers,<br />
amplification was performed using<br />
1 µl <strong>and</strong> 5 µl <strong>of</strong> plant DNA extract<br />
mixed with several amounts (<br />
0.001, 0.01; 0.1; 1; 10; 100 <strong>and</strong> 1000<br />
ng) <strong>of</strong> fungal DNA. The PCR<br />
conditions were the same as<br />
described before with a 57°C<br />
annealing temperature.<br />
The time course amplification<br />
using ITS1 <strong>and</strong> ITS4 primers was<br />
realized using 2 µl <strong>of</strong> DNA extract<br />
from one infected leaf at 3, 6, 9, 14,<br />
18, <strong>and</strong> 22 days after inoculation.<br />
The PCR conditions were the same<br />
as described before, with a 57°C<br />
annealing temperature.<br />
Results <strong>and</strong> Discussion<br />
Bread wheat derived isolates<br />
almost exclusively produced<br />
pycnidia in the bread cultivars,<br />
whereas pycnidial production by<br />
durum wheat derived isolates was<br />
almost entirely restricted to durum<br />
wheat isolates. The analysis <strong>of</strong><br />
variance (Table 3) shows highly<br />
significant differences (p