ROI 3.0 The Foundations of Market Mix Success (1)

Create successful ePaper yourself
Turn your PDF publications into a flip-book with our unique Google optimized e-Paper software.
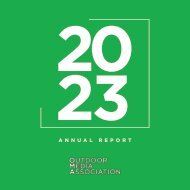
<strong>ROI</strong> <strong>3.0</strong><br />
THE FOUNDATIONS OF<br />
MARKET MIX SUCCESS<br />
How Out <strong>of</strong> Home media drives advertising <strong>ROI</strong>
FOREWORD by oOh!media<br />
This study marks the third Australian <strong>ROI</strong> research study that oOh!media has<br />
commissioned since 2014.<br />
We first undertook this study to provide evidence to agencies and clients that Out<br />
<strong>of</strong> Home media contributed to an advertiser’s <strong>ROI</strong>. Throughout the following studies<br />
with Analytic Partners we have gained many learnings around <strong>Market</strong>ing <strong>Mix</strong> Modelling<br />
(MMM) and the role that Out <strong>of</strong> Home media plays in generating a positive campaign<br />
result.<br />
This study has not been manufactured in any way to generate a desirable sales story.<br />
<strong>The</strong> data that Analytic Partners use is the average and norms <strong>of</strong> their media database<br />
<strong>of</strong> <strong>Market</strong>ing <strong>Mix</strong> Studies commissioned by their clients. It is the biggest database <strong>of</strong><br />
<strong>Market</strong>ing <strong>Mix</strong> Data available in the Australian market. At oOh! we are confident in our<br />
products and scale, it’s more about understanding best practice and how we can work<br />
better with our partners and other media companies to generate the best possible<br />
result for Australian advertisers.<br />
We believe these studies are the most accurate way to provide evidence <strong>of</strong> attribution<br />
because the model Analytic Partners uses factors in key <strong>ROI</strong> drivers like creative, price,<br />
promotion, competitor activity, even the weather, that a lot <strong>of</strong> other research methods<br />
don’t consider. We believe great advertising campaigns are effective when science and<br />
art come together as one to address a brand challenge.<br />
In this third study we challenged Analytic Partners to help us understand the importance<br />
<strong>of</strong> creative and copy to generate a <strong>ROI</strong>; their opinion on the insights and the creative<br />
tactics that lead to better performing Out <strong>of</strong> Home creative; a deep dive into how to<br />
get better bang for your dollar when investing in Out <strong>of</strong> Home media as part <strong>of</strong> your<br />
campaign strategy; and lastly – we are very proud <strong>of</strong> the Out <strong>of</strong> Home product we have<br />
in Australia – we wanted some pro<strong>of</strong> that it is globally leading.<br />
We hope you enjoy the insights provided in this study. We believe they are great learnings<br />
which you can apply in the future to generate Unmissable advertising campaigns.<br />
If you would like further clarity, please don’t hesitate to make contact and we can<br />
organise a time to discuss.<br />
Bruce Mundell<br />
Group Director - Customer Strategy<br />
bruce.mundell@oohmedia.com.au<br />
Ph: +61 2 9927 5555<br />
Click to watch: Introduction to <strong>ROI</strong> <strong>3.0</strong> Study
CONTENTS<br />
ANALYTIC PARTNERS OVERVIEW........................................................................................................................ 3<br />
STUDY METHODOLOGY................................................................................................................................................ 5<br />
REPORT FINDINGS.......................................................................................................................................................... 9<br />
SYNERGIES AND SCALE............................................................................................................................................. 11<br />
CREATIVE............................................................................................................................................................................ 15<br />
IMPORTANCE OF AUDIENCE TARGETING...................................................................................................... 19<br />
DEEP DIVE INTO OUT OF HOME MEDIA..........................................................................................................23<br />
<strong>ROI</strong> INDEXES....................................................................................................................................................................26<br />
CONFIDENTIAL & PROPRIETARY, © 2019 ANALYTIC PARTNERS, INC 2
ANALYTIC<br />
PARTNERS<br />
OVERVIEW<br />
Analytic Partners was founded over 19 years ago with the sole<br />
purpose <strong>of</strong> delivering customised marketing analytics and<br />
consultancy to help its clients improve sales performance by<br />
driving greater impact from marketing and sales programs<br />
(i.e. marketing <strong>ROI</strong>) and improving customer experiences.<br />
Analytic Partners years <strong>of</strong> experience in marketing analytics<br />
means it has an established solution, that was built and<br />
continuously refined using a strong platform <strong>of</strong> global talent,<br />
technology and expertise. This is what sets it apart from many <strong>of</strong><br />
the newer, less experienced players in market.<br />
3 CONFIDENTIAL & PROPRIETARY, © 2019 ANALYTIC PARTNERS, INC
Analytic Partners believes it <strong>of</strong>fers a differentiated solution from its<br />
competitors for the following reasons:<br />
Independence<br />
Analytic Partners is an independent, self-funded global analytics firm.<br />
This means:<br />
• It has no ties to media agencies or data providers so provides objective<br />
insights and unbiased recommendations.<br />
• It has the adaptability and flexibility to work with the appropriate and most<br />
effective data and media partners. Analytic Partners has developed data<br />
partnerships with the likes <strong>of</strong> Google, Facebook, Snapchat and Pinterest<br />
so that it can access data directly from these platforms to drive maximum<br />
insights for its clients.<br />
On top <strong>of</strong> the Forrester recognition, Analytic Partners has received the<br />
following accolades over the last few years:<br />
• I-COM recognised for innovative analytics and insights as well as thought<br />
leadership, being named “Smart Data Agency” <strong>of</strong> the Year 2017 and 2019.<br />
• I-COM Winner <strong>of</strong> Intel Challenge Hackathon 2017 and 2019.<br />
• ANA 2018 Genius Award for Data and Analytics Storytelling awarded to<br />
Scotts Miracle-Gro for their use <strong>of</strong> Analytic Partners’ Helio solution.<br />
• Effie Award for Effective Advertiser <strong>of</strong> the Year 2017 to ANZ Australia and<br />
Analytic Partners, as one <strong>of</strong> their partner agencies.<br />
• Gartner recognised for <strong>Market</strong>ing <strong>Mix</strong> and Attribution in their <strong>Market</strong> Guide.<br />
• Gartner recognised for Building Segments and Personas for Digital<br />
<strong>Market</strong>ing.<br />
A holistic view <strong>of</strong> measurement and true partnership with its clients<br />
This is supported by a global client retention rate <strong>of</strong> over 90%.<br />
An established global marketing analytics network<br />
Analytic Partners has established 10 <strong>of</strong>fices spread across the Americas,<br />
Europe and Asia-Pacific to service multinational and local brands in each<br />
market. Its analytic experience with engagements around the world equips<br />
the Analytic Partners’ team with a global knowledge <strong>of</strong> data, channels, and<br />
business environments, which means the team are adept and flexible at<br />
dealing with different contexts and issues.<br />
Analytic Partners is solely focused on enabling analytic adoption<br />
<strong>Market</strong>ing measurement and optimisation is what Analytic Partners does, and<br />
its focus is on unlocking potential through full-service consultancy. This has<br />
delivered an average <strong>of</strong> 30% improvement in <strong>ROI</strong> for its clients globally.<br />
Analytic Partners was rated globally as a leader in the most recent <strong>Market</strong>ing<br />
Measurement and Optimisation Waves by Forrester – in the Q2 2018 Global<br />
Wave (and also in the 2016 wave) and, in the Asia Pacific region in Q4 2018<br />
they were named the only leader in the region.<br />
30%<br />
Average <strong>ROI</strong><br />
improvement for our<br />
clients<br />
2m<br />
<strong>Market</strong>ing metrics<br />
Analytic Partners Offices<br />
Analytic Partners Experience<br />
45+<br />
Countries we work in<br />
107<br />
Business sectors<br />
analysed<br />
CONFIDENTIAL & PROPRIETARY, © 2019 ANALYTIC PARTNERS, INC 4
STUDY<br />
METHODOLOGY<br />
<strong>The</strong> Leading Edge first ran this study for oOh!media in 2014,<br />
previously looking at 145 campaigns across 80 different brands<br />
and a total marketing spend <strong>of</strong> more than $4billion. Since then<br />
Analytic Partners have joined the study – increasing the depth<br />
to cover 350 Australian campaigns across 140 brands and over<br />
$9billion <strong>of</strong> marketing spend.<br />
This <strong>ROI</strong> study is based on the combined work <strong>of</strong><br />
<strong>The</strong> Leading Edge and Analytic Partners.<br />
5<br />
CONFIDENTIAL & PROPRIETARY, © 2019 ANALYTIC PARTNERS, INC
Through running such studies over the past 19 years, Analytic Partners<br />
have collected a vast quantity <strong>of</strong> marketing intelligence across industries<br />
and countries. This intelligence lives and breathes in <strong>ROI</strong> Genome. <strong>ROI</strong><br />
Genome is an adaptive database that goes beyond traditional “you are here”<br />
benchmarking to understanding and quantifying the drivers <strong>of</strong> <strong>ROI</strong> and<br />
marketing success at a fundamental level to establish principles and truths.<br />
By understanding and quantifying how factors such as brand health,<br />
marketplace factors, country dynamics, and the competitive landscape all<br />
impact marketing performance for each type <strong>of</strong> <strong>of</strong>fline and online marketing<br />
activity, Analytic Partners can provide context and perspective for its clients.<br />
As part <strong>of</strong> its database, Analytic Partners has benchmarks for Australian<br />
media which it’s been collecting since 2012.<br />
In order for any insights to be released with a <strong>ROI</strong> Genome endorsement,<br />
they must demonstrate reliability and validity across multiple studies – in<br />
other words, they must be replicable and hold true consistently. To enable<br />
this rigour, <strong>ROI</strong> Genome:<br />
• Captures measurements from hundreds <strong>of</strong> billions <strong>of</strong> dollars in<br />
marketing spend across 22,000+ studies.<br />
• Captures more than two million marketing metrics.<br />
• Covers a global footprint; 45+ countries.<br />
• Covers 700+ brands.<br />
• Covers thousands <strong>of</strong> campaigns.<br />
• Comprises a cross-section <strong>of</strong> industries and tactics.<br />
<strong>The</strong> data presented in this report includes a mix <strong>of</strong> <strong>ROI</strong> Genome insights<br />
as well as specific Australian Out <strong>of</strong> Home insights collected across<br />
multiple studies, insights and years from both Analytic Partners and <strong>The</strong><br />
Leading Edge. Individual clients within the database are not named due to<br />
confidentiality.<br />
All the studies leverage <strong>Market</strong>ing <strong>Mix</strong> Modelling (MMM) as a foundation<br />
for measuring sales performance and identifying opportunities for<br />
maximising marketing <strong>ROI</strong>. MMM utilises a variety <strong>of</strong> statistical techniques to<br />
disaggregate and measure how different elements <strong>of</strong>, and executions within,<br />
a business’ marketing mix drives revenue.<br />
To ensure we can attribute brand building activities versus a price promotion,<br />
we look at a minimum <strong>of</strong> three years’ worth <strong>of</strong> weekly sales data and put it<br />
into an econometric model. We then take the full marketing program <strong>of</strong> the<br />
client; price, distribution, advertising, product recalls (everything we can<br />
get our hands on) and competitor activity and sales. This is combined with<br />
a range <strong>of</strong> environmental factors, i.e. weather, the economy, seasonality etc.<br />
This effectively lets us see the impact <strong>of</strong> any activity – as you do more <strong>of</strong> X,<br />
what is the impact on sales?<br />
In essence, Analytic Partners test a large amount <strong>of</strong> these relationships<br />
mathematically to measure the impact <strong>of</strong> each on sales. As these activities<br />
are all related and happening at the same time, we measure the relative level<br />
<strong>of</strong> them (i.e. how many TARPs you had in a week, rather then the fact that<br />
you were on TV) so that we can mathematically isolate the individual effects.<br />
Click to watch: Introduction to <strong>ROI</strong> <strong>3.0</strong> Study<br />
CONFIDENTIAL & PROPRIETARY, © 2019 ANALYTIC PARTNERS, INC 6
In this study, we took 350 campaigns across 140 different brands, with<br />
a total spend <strong>of</strong> more than $9billion to combine them into a giant <strong>ROI</strong><br />
study, to ensure the individual client information was not recognisable, but<br />
we were still able to look at the top line MMM results across a number <strong>of</strong><br />
categories, mediums and Out <strong>of</strong> Home formats and compared them using<br />
TV as a benchmark – mainly because all campaigns had TV as a constant<br />
and generally as the largest portion <strong>of</strong> the marketing mix, which delivers less<br />
volatile results due to size.<br />
Of course, it’s very important to keep individual <strong>ROI</strong> results confidential, so<br />
we use indexes throughout the presentation. This also makes everything<br />
comparable across categories and gets away from the fact that different<br />
margins in different categories drive higher <strong>ROI</strong> or lower <strong>ROI</strong> – without using<br />
media at all. After all, it’s more important to look at the relative difference in<br />
returns rather than the absolute returns.<br />
With all our studies, we always report the average return for media channels.<br />
However, we’ve broken down the elements <strong>of</strong> Out <strong>of</strong> Home across client<br />
categories to see the results. We haven’t been able to break out every single<br />
element we have evaluated but where we have over the statically accepted 10<br />
studies, for a particular element, then we have used the results.<br />
AUSTRALIAN DATABASE<br />
Cross section <strong>of</strong> industries and<br />
marketing tactics<br />
In depth understanding <strong>of</strong><br />
how marketing works<br />
140 Brands<br />
350 Studies<br />
$9 billion in spend<br />
GLOBAL DATABASE<br />
Cross section <strong>of</strong> industries and<br />
marketing tactics<br />
In depth understanding <strong>of</strong><br />
how marketing works<br />
2 million marketing metrics<br />
700+ Brands<br />
45 Countries<br />
$460 billion in spend<br />
7 CONFIDENTIAL & PROPRIETARY, © 2019 ANALYTIC PARTNERS, INC
CONFIDENTIAL & PROPRIETARY, © 2019 ANALYTIC PARTNERS, INC<br />
8
9<br />
REPORT<br />
FINDINGS<br />
EXECUTIVE SUMMARY
Your digital media investment returns halve if they are not being<br />
supported by the ‘heavy lifting’ channels <strong>of</strong> TV and Out <strong>of</strong> Home.<br />
<strong>The</strong>y are the foundation <strong>of</strong> your market mix and the most important<br />
channels to set up success.<br />
A multi-channel approach gets you stronger <strong>ROI</strong> as it drives you greater<br />
1+ reach – the key to <strong>ROI</strong> is driving scale by moving onto another channel once<br />
you have hit that point <strong>of</strong> diminishing return.<br />
Similarly, when planning effective Out <strong>of</strong> Home campaigns a multiple product<br />
approach works better than a single Out <strong>of</strong> Home product strategy.<br />
<strong>The</strong> creative/copy represents 41% to an Out <strong>of</strong> Home <strong>ROI</strong> performance.<br />
<strong>The</strong> drivers to great performing Out <strong>of</strong> Home creative is context, relevance and<br />
creative synergy.<br />
Smart audience targeting drives better <strong>ROI</strong>. You should be favouring data<br />
sets that use real data and that use a category buyer approach instead <strong>of</strong><br />
demographic. This will help eliminate wastage.<br />
Out <strong>of</strong> Home strategies that have a long-term approach perform better<br />
over time.<br />
Australia is one <strong>of</strong> the best performing global markets when it comes to Out <strong>of</strong> Home <strong>ROI</strong>.<br />
<strong>The</strong>se are the trends throughout the study, and Australian advertisers should<br />
be confident in investing more <strong>of</strong> their budget into Out <strong>of</strong> Home as it leads to a<br />
stronger campaign resul<br />
Click to watch: Summary <strong>of</strong> the top findings<br />
CONFIDENTIAL & PROPRIETARY, © 2019 ANALYTIC PARTNERS, INC<br />
10
11<br />
SYNERGIES<br />
AND SCALE
A single media channel does not enable you to leverage the<br />
synergy that multiple messages across different channels gives<br />
you. By using a single channel, you miss the opportunity to have<br />
a deeper influence and resonance by connecting with consumers<br />
across multiple touchpoints and contexts. A favourite example <strong>of</strong><br />
this is TV and Retail in the FMCG sector.<br />
You’ve spent millions building brand awareness and positive associations, and<br />
then just before consumers walk into a store to be bombarded by price, you<br />
can bring these positive brand associations to the front <strong>of</strong> the mind and give<br />
a reason to buy other than price.<br />
<strong>The</strong>re’s been a lot <strong>of</strong> discussion in recent years about what media channel<br />
is best to invest in. However it’s not about choosing one or the other. This<br />
would be like choosing between food or water, you need both to work<br />
together to sustain you and if you’re missing one then you’re not long for this<br />
life. <strong>The</strong> same is true for media investment. A campaign that has investment<br />
in more than one channel will generally deliver a higher <strong>ROI</strong> than a single<br />
media campaign. Furthermore, the more channels that you can add (budget<br />
permitting), the higher the <strong>ROI</strong>.<br />
This is because: Spreading money across multiple channels rather than<br />
putting it all in one budget increases the likelihood <strong>of</strong> driving incremental<br />
reach. We see a linear trend between reach and <strong>ROI</strong> – the more reach, the<br />
more <strong>ROI</strong>. By spreading your investment and broadening reach with more<br />
channels as well as using each channel to its best creatively, you’re helping<br />
maximise your incremental reach opportunity.<br />
<strong>ROI</strong> (INDEX)<br />
100<br />
Single Media<br />
Platform<br />
119<br />
Two Media<br />
Platform<br />
<strong>ROI</strong> STRATEGY COMPARISON<br />
SOURCE: Analytic Partners -<strong>ROI</strong> Genome <strong>Market</strong>ing Intelligence Report 2016 Analysis based on over 3,200 campaigns from<br />
2010-2015; Platforms include TV, Print, Radio, Display, Paid Search, Online Video, PR, Out <strong>of</strong> Home and Cinema<br />
123<br />
Three Media<br />
Platform<br />
131<br />
Four Media<br />
Platform<br />
135<br />
Five Media<br />
Platform<br />
Click to watch: Multi media campaigns increase campaign <strong>ROI</strong><br />
CONFIDENTIAL & PROPRIETARY, © 2019 ANALYTIC PARTNERS, INC 12
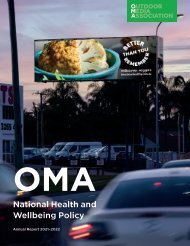
<strong>The</strong> effects <strong>of</strong> synergy on <strong>ROI</strong> vary by different combinations<br />
<strong>of</strong> media; it’s not just about combining lots <strong>of</strong> digital channels<br />
together or multiple <strong>of</strong>fline channels together and saying that you<br />
have a multi-channel strategy. When thinking about combining<br />
channels, usually the most efficient options come from<br />
combining both <strong>of</strong>fline and digital media options.<br />
<strong>The</strong> chart below shows the incremental multiplier from combining different<br />
channels with TV, digital and Out <strong>of</strong> Home delivering the highest multiplier<br />
versus<br />
TV only (as the base for the multiplier).<br />
What the chart below also shows is that using TV as your base media and<br />
layering other media on top, will give you the highest returns. However, Out<br />
<strong>of</strong> Home combinations also work well compared against a TV only strategy.<br />
TV + DIGITAL + OOH<br />
TV + DIGITAL +<br />
MAGAZINES<br />
TV + DIGITAL + RADIO<br />
TV + DIGITAL<br />
OOH + TV<br />
27%<br />
23%<br />
22%<br />
22%<br />
17%<br />
OOH + DIGITAL<br />
9%<br />
OOH + RADIO<br />
3%<br />
13 CONFIDENTIAL & PROPRIETARY, © 2019 ANALYTIC PARTNERS, INC
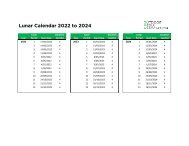
<strong>The</strong> key take-out is that there is actually a big impact on digital <strong>ROI</strong> if a<br />
campaign doesn’t include either TV or Out <strong>of</strong> Home. As the chart below<br />
summarises, when TV can’t be run, Out <strong>of</strong> Home holds up some <strong>of</strong> the<br />
results, but without this, digital results drop significantly.<br />
WITH CAMPAIGNS UNDER $1M, MOVING TO A DIGITAL AND OUT OF HOME STRATEGY CAN BE A<br />
MORE EFFECTIVE STRATEGY<br />
132%<br />
139%<br />
We’re <strong>of</strong>ten asked what this means for campaigns with a small budget –<br />
should they just put it all in one media channel to maximise the bang for their<br />
buck? But there’s an even greater need for synergy in small campaigns, to<br />
build awareness and then maintain a presence for as many weeks as possible.<br />
What’s more is that the data shows for campaigns under $1million, moving to<br />
a digital plus Out <strong>of</strong> Home strategy can be more effective – so Out <strong>of</strong> Home<br />
is not only just a viable option, it can be a better option.<br />
THERE IS A BIG IMPACT ON DIGITAL IF TV OR OUT OF HOME IS REMOVED FROM A CAMPAIGN<br />
100%<br />
100%<br />
79%<br />
50%<br />
TV TV + Digital Digital + OOH<br />
Digital returns with TV + OOH Digital returns with OOH Digital returns with neither<br />
Click to watch: Adding Out <strong>of</strong> Home to a digital campaign<br />
CONFIDENTIAL & PROPRIETARY, © 2019 ANALYTIC PARTNERS, INC 14
15<br />
CREATIVE
While the previous discussion has focused on how advertisers<br />
should think in terms <strong>of</strong> where to place their message or specific<br />
broad executional aspects <strong>of</strong> mix optimisation, it’s important<br />
not to forget about the influence that the creative message has.<br />
When you compare the influence the creative message has versus<br />
more specific executional elements within channels, you begin<br />
to see interesting trends. For audio visual platforms (TV and<br />
video), the quality <strong>of</strong> the creative itself – the amount <strong>of</strong> branding,<br />
communication <strong>of</strong> benefits, level <strong>of</strong> interest or engagement – is<br />
the most important to <strong>ROI</strong> outcome.<br />
41% OF OUT OF HOME<br />
EFFECTIVENESS COMES DOWN<br />
TO THE CREATIVE COPY<br />
In display channels, including Out <strong>of</strong> Home, the level <strong>of</strong> creative influence is<br />
less but it is not so small as to be disregarded.<br />
All this means is that it’s worth investing in copy. Not only does creative<br />
have an influence but increased copy quality can have a significant impact<br />
on a campaign’s success.<br />
38%<br />
65%<br />
<strong>ROI</strong> GENOME: COPY QUALITY CONTRIBUTION BY CHANNEL<br />
TV<br />
ONLINE DISPLAY<br />
62%<br />
35%<br />
59%<br />
30%<br />
ONLINE VIDEO<br />
OOH<br />
EXECUTIONAL ELEMENTS<br />
eg: flighting, duration, daypart, site<br />
COPY QUALITY/CREATIVE<br />
eg: content, communication engagement<br />
70%<br />
CONFIDENTIAL & PROPRIETARY, © 2019 ANALYTIC PARTNERS, INC 16<br />
41%
WHAT DRIVES GREAT OUT OF HOME CREATIVE?<br />
Copy quality in Out <strong>of</strong> Home has the same large impact that<br />
we see for other marketing channels.<br />
<strong>The</strong> impact <strong>of</strong> creative in Out <strong>of</strong> Home is huge, because there are many<br />
advertisers using a pack shot or the end frame <strong>of</strong> the TVC as the creative<br />
for a billboard. With all the discussion and debate around how the TVC<br />
works, so <strong>of</strong>ten the creative for Out <strong>of</strong> Home is an afterthought – and yet<br />
we have examples where putting this thought in (and actually testing the<br />
creative, here with Neuro Science) and getting a piece <strong>of</strong> creative that really<br />
maximises the synergy with the emotional component <strong>of</strong> TVC (vs the end<br />
frame) can drive results 250% higher than average.<br />
<strong>ROI</strong> IMPACT OF INCREASED COPY QUALITY<br />
<strong>The</strong> impact isn’t just about “good” creative either, but creative that is made<br />
to be relevant, not only to where it is being placed but also in terms <strong>of</strong> the<br />
connection, or action, that you want to evoke from the consumer who sees<br />
it. Creative that is made for channel (be it digital or Out <strong>of</strong> Home) can have a<br />
much larger impact than creative which is cut down or cut up shots <strong>of</strong> a TVC,<br />
put on a different screen. For Out <strong>of</strong> Home, thinking about how different<br />
formats can contextually play a role on a consumer’s journey should help to<br />
inform creative development.<br />
We also have insight that emotive creative works best on roadside billboards,<br />
whereas tactical messages work better in retail environments. Tactical<br />
creative doesn’t mean that retail media can only do point <strong>of</strong> purchase<br />
style advertising. That means; rather than strong theory <strong>of</strong> advertising<br />
with emotional triggers, use the weak theory <strong>of</strong> advertising that Andrew<br />
Ehrenberg and John Philip Jones propose instead and try to nudge<br />
consumers using distinctive assets and brand cues. Both drive consideration,<br />
both drive brand metrics. One tries to make people feel something, the other<br />
tries to make them think something.<br />
250%<br />
+27%<br />
+37%<br />
100%<br />
-16%<br />
100%<br />
-6%<br />
90%<br />
30%<br />
Client average 2nd Strongest campaign Neuro tested creative<br />
Large Format<br />
Average<br />
Large Format<br />
Tactical Creative<br />
Large Format<br />
Emotive Creative<br />
Retail Average<br />
Retail Tactical<br />
Creative<br />
Retail Emotive<br />
Creative<br />
17 CONFIDENTIAL & PROPRIETARY, © 2019 ANALYTIC PARTNERS, INC
As with the experimentation underway on how to best build a digital video<br />
and where to place it, we haven’t yet seen digital Out <strong>of</strong> Home utilised to<br />
its best consistently. With technological advances changing how Out <strong>of</strong><br />
Home ads can be activated, there are increasingly more opportunities to<br />
increase contextual relevance <strong>of</strong> Out <strong>of</strong> Home to consumers. <strong>The</strong> chart below<br />
illustrates an example <strong>of</strong> how weather triggered Out <strong>of</strong> Home can drive<br />
greater impact than non-contextually relevant messaging.<br />
+57%<br />
Digital OOH average<br />
Digital OOH with weather adjusted<br />
weights<br />
Click to watch: Increase campaign effectiveness from creative copy<br />
CONFIDENTIAL & PROPRIETARY, © 2019 ANALYTIC PARTNERS, INC<br />
18
19<br />
IMPORTANCE<br />
OF AUDIENCE<br />
TARGETING
TAKE A CATEGORY BUYER APPROACH<br />
TO ELIMINATE WASTAGE<br />
Case Study: <strong>The</strong> demographic buy was half as effective as the<br />
category buy<br />
Many marketers have followed the debate over targeted marketing, and<br />
whether mass marketing or micro targeting is the optimal approach. Whilst<br />
this is a debate that depends upon many factors (and the synergy already<br />
mentioned many times in this booklet) one element that is in agreement and<br />
isn’t debated is to avoid wastage.<br />
We see considerable improvements in campaigns where clients have had a<br />
great understanding <strong>of</strong> their customers and ensured that they are maximising<br />
the reach to all their possible consumers, but avoiding those that aren’t.<br />
Unfortunately in the current environment there are <strong>of</strong>ten budget constraints,<br />
so ensuring we reach the largest part <strong>of</strong> the market is vital. However,<br />
worrying about people less likely to be customers is something we may not<br />
have the budget for. For example, ensuring we maximise the reach <strong>of</strong> our<br />
beef ad with large format Out <strong>of</strong> Home might be important, but we should<br />
put the areas with the highest incidence <strong>of</strong> vegetarianism at the bottom <strong>of</strong><br />
the list.<br />
In this case study we were able to see the huge difference in a media<br />
buy that used this approach. This isn’t to suggest micro-targeting, as the<br />
category buyers were the large chunk <strong>of</strong> the population, but we were able<br />
to reduce the wastage <strong>of</strong> talking and identify the incremental oppertunity <strong>of</strong><br />
category buyers who sat outside a traditional demographic segment.<br />
CONFIDENTIAL & PROPRIETARY, © 2019 ANALYTIC PARTNERS, INC 20
BUILDING 1+ REACH DRIVES <strong>ROI</strong><br />
<strong>The</strong> more <strong>of</strong> it the better. <strong>The</strong> key to building effective 1+ reach<br />
is moving onto another channel once you have hit the point <strong>of</strong><br />
diminishing return.<br />
ADVERTISING RESPONSE TO DIFFERENT 4-WEEK REACH LEVELS<br />
Building reach is a strategy that works across every media channel. That’s<br />
not to say that it is the only strategy that works, but sometimes the focus on<br />
reach is lost- particularly as we combine media channels.<br />
<strong>The</strong> relationship between <strong>ROI</strong> and reach is linear. More reach builds more<br />
<strong>ROI</strong>, the more <strong>of</strong> it the better. However, at some point frequency stops<br />
adding incremental <strong>ROI</strong> to a campaign. Knowing this point <strong>of</strong> diminishing<br />
returns (which is different by media channel and brand) is key, so that<br />
you can switch investment into a new media channel to continue building<br />
incremental reach.<br />
ADVERTISING RELATIVE RESPONSE TO DIFFERENT 4-WEEK FREQUENCY LEVELS<br />
21 CONFIDENTIAL & PROPRIETARY, © 2019 ANALYTIC PARTNERS, INC
CONFIDENTIAL & PROPRIETARY, © 2019 ANALYTIC PARTNERS, INC<br />
22
23<br />
DEEP DIVE<br />
INTO OUT<br />
OF HOME<br />
MEDIA
This section outlines some key learnings for Out <strong>of</strong> Home which<br />
continues to grow – in 2018 Out <strong>of</strong> Home investment saw a 10.8%<br />
growth on 2017<br />
No OOH<br />
RELATIVE SHORT-TERM <strong>ROI</strong> PERFORMANCE OOH TO TOTAL MEDIA<br />
BY OOH SHARE OF MEDIA INVESTMENT<br />
0%<br />
Category<br />
2018 Total revenue<br />
‘000s*<br />
% Change<br />
(2018 on 2017)<br />
% Share<br />
Online 7,197,700 12.1% 48.1%<br />
OOH 927,176 10.8% 6.2%<br />
Radio 1,191,959 3.6% 7.9%<br />
Less than<br />
6% in OOH<br />
41%<br />
Print 1,899,460 1.8% 12.6%<br />
Cinema 129,750 0.2% 0.01%<br />
Television 3,627,425 -2.5% 24.2%<br />
Total 14,973,470 6.0% -<br />
More than<br />
6%+ in<br />
OOH<br />
57%<br />
SOURCE: CEASA 2018<br />
Higher total media <strong>ROI</strong> are observed amongst brands which have a higher<br />
share <strong>of</strong> Out <strong>of</strong> Home in their media mix.<br />
SHORT-TERM OOH VS LONG TERM OOH PERFORMANCE<br />
127%<br />
As the chart to the right illustrates, brands that have less than 6% <strong>of</strong> their<br />
investment in Out <strong>of</strong> Home have a total <strong>ROI</strong> 41% higher than those without<br />
any Out <strong>of</strong> Home. This increases to 57% when Out <strong>of</strong> Home represents more<br />
than 6% <strong>of</strong> the mix (i.e. greater than the industry spend average).<br />
100%<br />
Looking at site performance, long-term sites deliver almost 1.3 times the<br />
impact <strong>of</strong> short-term sites <strong>of</strong>fering the opportunity for ongoing creative<br />
engagement with consumers.<br />
Short term placement<br />
Long term placement<br />
CONFIDENTIAL & PROPRIETARY, © 2019 ANALYTIC PARTNERS, INC 24
<strong>The</strong> impact <strong>of</strong> synergy isn’t just across media platforms – it’s also within<br />
Out <strong>of</strong> Home as we can see below. As you maximise your chances <strong>of</strong> having<br />
an emotional message working on large format and have a call to action<br />
creative on a retail format, we see that the results just keep increasing.<br />
Getting this mix right as you get people coming into populated centers vs as<br />
they move around them with longer dwell times, means that the total return<br />
is greater than the sum <strong>of</strong> the parts as you work all the ways Out <strong>of</strong> Home<br />
can add <strong>ROI</strong>.<br />
Compared to global averages, Out <strong>of</strong> Home delivers a higher return here in<br />
Australia than in other countries. Part <strong>of</strong> this is because <strong>of</strong> the ease <strong>of</strong> hitting<br />
so much <strong>of</strong> the population in shopping centers, the quality <strong>of</strong> the Out <strong>of</strong><br />
Home initiatives and physical environments built over the last 10 years, and<br />
also the high TV costs in Australia vs other markets.<br />
This is also true as you add Out <strong>of</strong> Home formats to a campaign rather<br />
than focus on just one.<br />
<strong>ROI</strong> INDEX OF DIGITAL CAMPAIGNS WITH OR WITHOUT OFFLINE SUPPORT - AUSTRALIA<br />
121%<br />
129% 131%<br />
250%<br />
100%<br />
160%<br />
177%<br />
100%<br />
Single Media<br />
Platforms<br />
Two Media<br />
Platforms<br />
Three Media<br />
Platforms<br />
Four Media<br />
Platforms<br />
North America Asia OOH Europe OOH Australia OOH<br />
25 CONFIDENTIAL & PROPRIETARY, © 2019 ANALYTIC PARTNERS, INC
<strong>ROI</strong><br />
INDEXES<br />
CONFIDENTIAL & PROPRIETARY, © 2019 ANALYTIC PARTNERS, INC<br />
26
In order to make all our studies comparable (as different<br />
advertisers make different pr<strong>of</strong>it for their products) we made<br />
all the data relative to TV.<br />
<strong>ROI</strong> INDEXES: ALL MEDIA<br />
BASELINE: IF $1 SPEND ON TV = $1 RETURN<br />
DIGITAL<br />
192%<br />
That means if you made $1 for each $1 spent on TV, you’re getting $1.92<br />
for $1 spent on digital. However, it’s critically important to not use this<br />
chart simplistically – the <strong>ROI</strong> chart is this shape because <strong>of</strong> the interactions<br />
between channels. If we remove Out <strong>of</strong> Home and TV from a campaign, the<br />
effectiveness <strong>of</strong> digital channels drops significantly.<br />
TV<br />
MAGAZINES<br />
OOH<br />
100%<br />
89%<br />
75%<br />
All these results are dependent upon the level <strong>of</strong> investment in each <strong>of</strong><br />
the channels. If we think about there being a yield curve for each channel<br />
(which is unique to that channel) the <strong>ROI</strong> will increase as it moves to the<br />
point <strong>of</strong> diminishing returns, and then decrease past this point. This point <strong>of</strong><br />
diminishing returns is different for each category and even for each brand,<br />
but TV tends to take the largest investment for a campaign before you see<br />
diminishing returns, and channels such as Radio and Magazines tend to hit<br />
the point <strong>of</strong> diminishing returns earlier and so increasing investment from<br />
current levels wouldn’t be a great idea.<br />
NEWSPAPERS<br />
PR<br />
ON PA CK<br />
RADIO<br />
SPONSORSHIP<br />
18%<br />
32%<br />
68%<br />
63%<br />
59%<br />
Categories such as Sponsorship and Cinema tend to suffer in this analysis, as<br />
we are looking at the short-term impact only – and the impact <strong>of</strong> these tends<br />
to be far more in the long term. A channel such as Radio works strongly for<br />
some categories (particularly targeting SMEs for instance) or when there is<br />
a heavy local flavour to the execution, but we don’t see it work as well for<br />
broad messaging.<br />
CINEMA<br />
18%<br />
We <strong>of</strong>ten get asked about the performance <strong>of</strong> three channels<br />
What is driving digital returns?<br />
<strong>The</strong> best digital <strong>ROI</strong> drivers are Social; Mobile, Video and Paid Search. Desktop Display is not<br />
doing as well and is a big reason for digital’s drop in <strong>ROI</strong> performance over the last 5 years.<br />
Why do magazines do so well?<br />
Magazines have a very low cost <strong>of</strong> entry. Most magazine budgets these days are minimal so it’s a<br />
lot easier to get a <strong>ROI</strong>. If you actually spent big budgets on mags, it’s <strong>ROI</strong> would drop.<br />
27 CONFIDENTIAL & PROPRIETARY, © 2019 ANALYTIC PARTNERS, INC<br />
Why does radio not perform as well?<br />
Radio doesn’t get great scale and its harder to drive synergies with other media. It works well in<br />
synergy with promotions however its generally the promotion as the reason for the return.
<strong>ROI</strong> INDEXES: CONSUMER ELECTRONICS<br />
BASELINE: IF $1 SPEND ON TV = $1 RETURN<br />
<strong>ROI</strong> INDEXES: BEVERAGES/ALCOHOL<br />
BASELINE: IF $1 SPEND ON TV = $1 RETURN<br />
DIGITAL<br />
188%<br />
DIGITAL<br />
199%<br />
TV<br />
100%<br />
TV<br />
100%<br />
MAGAZINES<br />
87%<br />
MAGAZINES<br />
91%<br />
ON PA CK<br />
75%<br />
OOH<br />
71%<br />
OOH<br />
75%<br />
NEWSPAPERS<br />
69%<br />
PR<br />
72%<br />
PR<br />
62%<br />
NEWSPAPERS<br />
71%<br />
ON PA CK<br />
53%<br />
RADIO<br />
22%<br />
RADIO<br />
33%<br />
SPONSORSHIP<br />
21%<br />
SPONSORSHIP<br />
23%<br />
CINEMA<br />
18%<br />
CINEMA<br />
18%<br />
<strong>The</strong> importance <strong>of</strong> flagship brand communications means that TV can take a stronger role than<br />
average for consumer electronics. <strong>The</strong>se brand communications lay the strong groundwork<br />
to support constant product launches, meaning that media channels used for those launches<br />
such as on pack activity and PR can then be very effective. This means a strategy <strong>of</strong> burst<br />
communications that may seem appropriate for a launch actually misses the opportunity <strong>of</strong><br />
having brand messaging as maintenance throughout the year.<br />
<strong>The</strong> practical difficulty <strong>of</strong> being able to buy quality TV under the legal restrictions on alcohol<br />
advertising means TV struggles to be as effective in this space, and digital advertising<br />
(particularly online video and social) really comes into its own.<br />
Another important consideration in this category is the knowledge <strong>of</strong> how <strong>of</strong>f and on premises<br />
work differently. With <strong>of</strong>f premises being so price dominated, any media around the store<br />
struggles to have a strong performance and needs to be very call to action. <strong>The</strong> on-premises is<br />
very different though, where OOH can be one <strong>of</strong> the highest <strong>ROI</strong> channels and large format with<br />
emotive creative is the best approach.<br />
CONFIDENTIAL & PROPRIETARY, © 2019 ANALYTIC PARTNERS, INC 28
<strong>ROI</strong> INDEXES: RETAIL<br />
BASELINE: IF $1 SPEND ON TV = $1 RETURN<br />
<strong>ROI</strong> INDEXES: FMCG<br />
BASELINE: IF $1 SPEND ON TV = $1 RETURN<br />
DIGITAL<br />
193%<br />
DIGITAL<br />
189%<br />
TV<br />
100%<br />
TV<br />
100%<br />
MAGAZINES<br />
90%<br />
MAGAZINES<br />
89%<br />
OOH<br />
71%<br />
OOH<br />
72%<br />
ON PA CK<br />
59%<br />
NEWSPAPERS<br />
65%<br />
NEWSPAPERS<br />
59%<br />
ON PA CK<br />
59%<br />
PR<br />
57%<br />
PR<br />
54%<br />
RADIO<br />
38%<br />
RADIO<br />
31%<br />
SPONSORSHIP<br />
26%<br />
CINEMA<br />
17%<br />
CINEMA<br />
18%<br />
SPONSORSHIP<br />
16%<br />
Retail advertising is <strong>of</strong>ten used for call to action rather than brand building, so we tend to see<br />
channels that support this have a higher <strong>ROI</strong> – Digital, Newspapers, PR and Radio.<br />
This doesn’t mean that long term initiatives don’t work, it’s just that they don’t tend to be done at<br />
scale – we can see from the very strong sponsorship result that this is an area that can work very<br />
well when it has focused investment behind it.<br />
29 CONFIDENTIAL & PROPRIETARY, © 2019 ANALYTIC PARTNERS, INC<br />
<strong>The</strong> FMCG category has been severely impacted by price discounting and short-term discounting.<br />
This means many brands are under-invested in marketing, and some lack the funds to proactively<br />
ring fence budgets for investment in experimentation. This means some <strong>of</strong> the FMCG digital <strong>ROI</strong><br />
are lower, however we have seen the improvement <strong>of</strong> other media channels such as Magazines,<br />
purely because <strong>of</strong> the lower levels <strong>of</strong> investment – the levels are on the optimal part <strong>of</strong> the yield<br />
curve. This does mean that the <strong>ROI</strong> are unlikely to increase with increased spend, but the current<br />
mix is working well.<br />
<strong>The</strong> impact <strong>of</strong> heavy price promotions means getting the synergy <strong>of</strong> trade investment and media<br />
laydown is vital, and the use <strong>of</strong> retail Out <strong>of</strong> Home to target consumers on their way to stores is a<br />
big opportunity – the more that can be done to bring latent brand awareness and associations to<br />
the front <strong>of</strong> mind before consumers are bombarded with price messages<br />
the better.
<strong>ROI</strong> INDEXES: FINANCIAL SERVICES<br />
BASELINE: IF $1 SPEND ON TV = $1 RETURN<br />
<strong>ROI</strong> INDEXES: AUTO<br />
BASELINE: IF $1 SPEND ON TV = $1 RETURN<br />
DIGITAL<br />
174%<br />
DIGITAL<br />
169%<br />
TV<br />
100%<br />
TV<br />
100%<br />
MAGAZINES<br />
85%<br />
MAGAZINES<br />
84%<br />
OOH<br />
76%<br />
OOH<br />
76%<br />
NEWSPAPERS<br />
71%<br />
PR<br />
72%<br />
PR<br />
70%<br />
NEWSPAPERS<br />
64%<br />
RADIO<br />
28%<br />
RADIO<br />
26%<br />
CINEMA<br />
18%<br />
CINEMA<br />
18%<br />
SPONSORSHIP<br />
15%<br />
SPONSORSHIP<br />
17%<br />
With financial services having the benefit <strong>of</strong> so much e-fulfilment and measurable attribution,<br />
there has been a strong history <strong>of</strong> digital marketing. This means many opportunities have been<br />
taken up already, and investment is further along the yield curve meaning the difference between<br />
<strong>of</strong>fline and online is not as stark. It also shows that TV is a strong channel in this category, as its<br />
strong performance means all other media is lower relative to TV. However, it does also show the<br />
stronger performance <strong>of</strong> Out <strong>of</strong> Home when strong distinctive assets (such as colour) are used<br />
well.<br />
With the long purchase funnel for auto, there is a considerable variability <strong>of</strong> marketing channels<br />
– for instance TV has a stronger influence on awareness while incentives are more impactful on<br />
purchase intent. This means strong branding and awareness are important to build a synergy<br />
across media channels – but we need to ensure that those synergistic media channels aren’t<br />
forgotten once a strong awareness base has been built.<br />
CONFIDENTIAL & PROPRIETARY, © 2019 ANALYTIC PARTNERS, INC 30
<strong>ROI</strong> INDEXES: TELCO<br />
BASELINE: IF $1 SPEND ON TV = $1 RETURN<br />
<strong>ROI</strong> INDEXES: BRAND BUILDING CAMPAIGNS<br />
BASELINE: IF $1 SPEND ON TV = $1 RETURN<br />
DIGITAL<br />
189%<br />
DIGITAL<br />
190%<br />
TV<br />
100%<br />
TV<br />
100%<br />
MAGAZINES<br />
86%<br />
MAGAZINES<br />
92%<br />
OOH<br />
73%<br />
OOH<br />
78%<br />
NEWSPAPERS<br />
73%<br />
PR<br />
68%<br />
NEWSPAPERS<br />
61%<br />
RADIO<br />
29%<br />
RADIO<br />
28%<br />
CINEMA<br />
18%<br />
CINEMA<br />
19%<br />
SPONSORSHIP<br />
15%<br />
SPONSORSHIP<br />
18%<br />
Media needs to be evaluated not just on the impact it has on acquisition, but also on the impact<br />
<strong>of</strong> churn reduction which is <strong>of</strong>ten overlooked. This means that brand building can work very well,<br />
and we see a strong impact from TV making other media channels look low, but also from short<br />
term focused activity such as PR, and certain digital activity (such as search and social).<br />
Brand building campaigns tend to benefit the most from reach building activities and from<br />
moving pictures. We see TV perform very strongly, followed by Online Video and Cinema, all<br />
relative to other objectives.<br />
<strong>The</strong> <strong>ROI</strong> <strong>of</strong> brand building campaigns tend to be lower in the short-term but have a significantly<br />
higher long term (3-5yr) <strong>ROI</strong> when measured.<br />
<strong>The</strong> impact <strong>of</strong> creative is even stronger for brand building, which is why understanding and<br />
leveraging your creative assets are vital to drive the strongest performance. For Out <strong>of</strong> Home ,<br />
we see a huge variance in campaigns that do this well with a strong visual identity that has been<br />
consistent over time, and consistent across other media channels.<br />
31 CONFIDENTIAL & PROPRIETARY, © 2019 ANALYTIC PARTNERS, INC
<strong>ROI</strong> INDEXES: CALL TO ACTION CAMPAIGNS<br />
BASELINE: IF $1 SPEND ON TV = $1 RETURN<br />
<strong>ROI</strong> INDEXES: PRODUCT LAUNCH CAMPAIGNS<br />
BASELINE: IF $1 SPEND ON TV = $1 RETURN<br />
DIGITAL<br />
206%<br />
DIGITAL<br />
196%<br />
TV<br />
100%<br />
TV<br />
100%<br />
MAGAZINES<br />
87%<br />
MAGAZINES<br />
93%<br />
OOH<br />
73%<br />
OOH<br />
81%<br />
NEWSPAPERS<br />
73%<br />
PR<br />
73%<br />
PR<br />
58%<br />
NEWSPAPERS<br />
70%<br />
RADIO<br />
34%<br />
RADIO<br />
33%<br />
CINEMA<br />
15%<br />
CINEMA<br />
19%<br />
Call to action campaigns have the strongest relative performance on channels such as social,<br />
search and radio. However even here, it is important to remember the synergy <strong>of</strong> other media<br />
channels – without the impact <strong>of</strong> reach building activity from TV and/or Out <strong>of</strong> Home, the returns<br />
from a media campaign are going to be significantly reduced as the campaign will have to<br />
compete much more with the in-store and/or price activity <strong>of</strong> competitors.<br />
A product launch is not surprisingly where media performs strongly across the board. Once a solid<br />
base <strong>of</strong> reach has been built it then allows other media to be leveraged for impact and context <strong>of</strong><br />
messaging. <strong>The</strong> interaction <strong>of</strong> media with in-store activity then means that Out <strong>of</strong> Home with a<br />
strong presence around the distribution (in stores or branches) produces the highest results for<br />
Out <strong>of</strong> Home.<br />
CONFIDENTIAL & PROPRIETARY, © 2019 ANALYTIC PARTNERS, INC 32
<strong>ROI</strong> INDEXES: LOW INVOLVEMENT CATEGORIES<br />
BASELINE: IF $1 SPEND ON TV = $1 RETURN<br />
<strong>ROI</strong> INDEXES: HIGH INVOLVEMENT CATEGORIES<br />
BASELINE: IF $1 SPEND ON TV = $1 RETURN<br />
DIGITAL<br />
175%<br />
DIGITAL<br />
215%<br />
TV<br />
100%<br />
TV<br />
100%<br />
MAGAZINES<br />
89%<br />
MAGAZINES<br />
85%<br />
OOH<br />
74%<br />
OOH<br />
73%<br />
NEWSPAPERS<br />
72%<br />
NEWSPAPERS<br />
60%<br />
RADIO<br />
26%<br />
RADIO<br />
31%<br />
SPONSORSHIP<br />
18%<br />
SPONSORSHIP<br />
18%<br />
CINEMA<br />
17%<br />
CINEMA<br />
18%<br />
<strong>The</strong> biggest difference between media channels across high and low involvement categories is in the digital channels. Search has a very strong performance in high involvement categories, but it is<br />
reduced in low involvement categories – partly because there tends to be less e-fulfilment opportunities. Within lower involvement categories, we tend to see the importance <strong>of</strong> reach and emotional<br />
“nudging” <strong>of</strong> consumers, so the role <strong>of</strong> TV is heightened.<br />
33 CONFIDENTIAL & PROPRIETARY, © 2019 ANALYTIC PARTNERS, INC
SUMMARY by oOh!media<br />
We hope you have enjoyed the insights from this study and that<br />
they can be applied to your advertising to drive further <strong>Market</strong> <strong>Mix</strong><br />
<strong>Success</strong>. A big thank you to the team and Analytic Partners for<br />
their hard work in creating this study for the Australian advertising<br />
market.<br />
Our learnings from this study are that scale through synergy, great creative & access to<br />
meaningful audience data can help advertisers drive stronger returns.<br />
To ensure that advertisers can leverage these learnings and ensure positive <strong>ROI</strong>,<br />
oOh!media are making the following commitments to our customers:<br />
1. Making stronger cross Out <strong>of</strong> Home product optimisation available:<br />
• oOh! will provide the market with 500+ Audience Segments to optimize across all<br />
oOh!’s channels – whether its demographics, psychographics or buyergraphics – we<br />
intend to make buying audiences across multiple Out <strong>of</strong> Home channels accessible<br />
and simple.<br />
3. Education:<br />
• We will actively help young media agency pr<strong>of</strong>essionals become talented Out <strong>of</strong><br />
Home strategists.<br />
IN CONCLUSION<br />
Out <strong>of</strong> Home is a proven <strong>Market</strong> <strong>Mix</strong> performer for generating <strong>ROI</strong>. It does the heavy<br />
lifting for your campaign and makes other media perform better. Out <strong>of</strong> Home is no<br />
longer a support medium, it is a foundation channel <strong>of</strong> successful advertising campaigns.<br />
In fact, it is a priority medium for <strong>ROI</strong>.<br />
We look forward to partnering with you in the future and driving successful campaigns<br />
together.<br />
Bruce Mundell<br />
Group Director - Customer Strategy<br />
bruce.mundell@oohmedia.com.au<br />
Ph: +61 2 9927 5555<br />
• You will be able to buy with common metrics across all oOh! platforms and regions.<br />
• We will make it possible to buy category transacting audiences by giving you access<br />
to the best third party data available in the Australian market.<br />
2. Creative & content <strong>of</strong>fering:<br />
• We will be inspiring stronger creative through creative agency & marketer education.<br />
We will celebrate the brands that are brave and break new ground in our sector.<br />
CONFIDENTIAL & PROPRIETARY, © 2019 ANALYTIC PARTNERS, INC<br />
34
Paul Sinkinson<br />
Level 5, 110 Walker St, North Sydney, NSW, 2060<br />
+61 2 8381 6784