Marketing Food to Children and Adolescents - Federal Trade ...
Marketing Food to Children and Adolescents - Federal Trade ...
Marketing Food to Children and Adolescents - Federal Trade ...

Create successful ePaper yourself
Turn your PDF publications into a flip-book with our unique Google optimized e-Paper software.
<strong>Marketing</strong> <strong>Food</strong> <strong>to</strong> <strong>Children</strong> <strong>and</strong> <strong>Adolescents</strong><br />
The snack, c<strong>and</strong>y/frozen desserts, dairy products, baked goods, <strong>and</strong> carbonated beverage<br />
categories accounted for digital expenditures ranging from $100,000 <strong>to</strong> $434,000, most of which<br />
was teen directed. The companies reported spending just under $5 million on youth-directed<br />
viral <strong>and</strong> word-of-mouth marketing. 40 With the exception of $392,000 that the QSRs reported<br />
as child directed, word-of-mouth expenditures were primarily teen directed. 41 Teen-directed<br />
word-of-mouth expenditures included $2 million for carbonated beverages, $1.3 million for dairy<br />
products, <strong>and</strong> about $811,000 for juice <strong>and</strong> non-carbonated beverages.<br />
3. Packaging <strong>and</strong> In-S<strong>to</strong>re <strong>Marketing</strong><br />
The companies reported that they spent more than $195 million on packaging <strong>and</strong> in-s<strong>to</strong>re<br />
marketing <strong>to</strong> reach the youth audience. 42 In every food category, a <strong>to</strong>tal of more than $3 million<br />
was spent on packaging <strong>and</strong> in-s<strong>to</strong>re marketing <strong>to</strong> reach children. QSRs led spending in these<br />
two promotional categories with nearly $22 million directed <strong>to</strong> children, followed by companies<br />
producing snacks ($18.2 million), breakfast cereals ($14.3 million), carbonated beverages <strong>and</strong><br />
c<strong>and</strong>y/frozen desserts ($11.6 million each), <strong>and</strong> juice <strong>and</strong> non-carbonated beverages ($10.2<br />
million). Relative <strong>to</strong> overall in-s<strong>to</strong>re <strong>and</strong> packaging expenditures for the reported br<strong>and</strong>s, the<br />
child-directed expenditures for these two categories ranged from 5% for carbonated beverages <strong>to</strong><br />
70% for dairy products. 43<br />
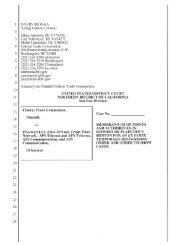
In the carbonated beverage category, nearly $90 million was spent on teen-directed<br />
packaging <strong>and</strong> in-s<strong>to</strong>re marketing for the reported br<strong>and</strong>s, while teen-directed restaurant food<br />
expenditures <strong>to</strong>taled $280,000. The<br />
carbonated beverages’ $90 million in teen-<br />
directed expenditures represented 67% of<br />
teen-directed expenditures, <strong>and</strong> 46% of all<br />
youth-directed expenditures, for packaging<br />
<strong>and</strong> in-s<strong>to</strong>re marketing for the reported<br />
br<strong>and</strong>s.<br />
Figure II.11 presents the <strong>to</strong>p three<br />
food categories in terms of <strong>to</strong>tal costs on<br />
packaging <strong>and</strong> in-s<strong>to</strong>re marketing directed<br />
<strong>to</strong> youth ages 2-17.<br />
Dollars (in millions)<br />
100<br />
90<br />
80<br />
70<br />
60<br />
50<br />
40<br />
30<br />
20<br />
10<br />
0<br />
Figure II.11: In-S<strong>to</strong>re <strong>and</strong> Packaging/Labeling<br />
Top 3 for Youth<br />
18<br />
91<br />
22 22<br />
Carbonated Beverages Restaurant <strong>Food</strong>s Snack <strong>Food</strong>s All Other<br />
61