Marketing Food to Children and Adolescents - Federal Trade ...
Marketing Food to Children and Adolescents - Federal Trade ...
Marketing Food to Children and Adolescents - Federal Trade ...

You also want an ePaper? Increase the reach of your titles
YUMPU automatically turns print PDFs into web optimized ePapers that Google loves.
<strong>Marketing</strong> <strong>Food</strong> <strong>to</strong> <strong>Children</strong> <strong>and</strong> <strong>Adolescents</strong><br />
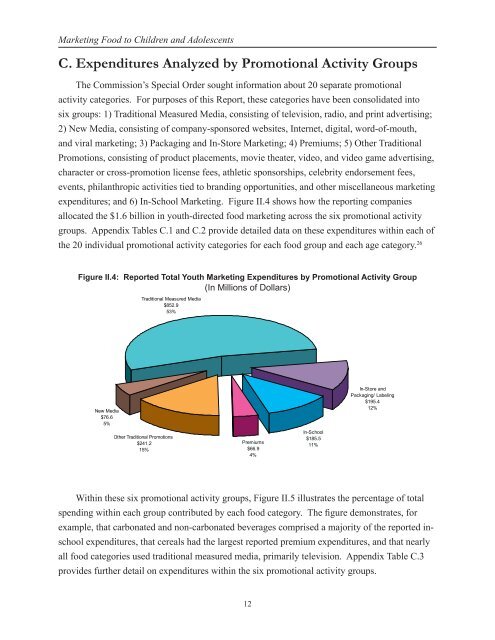
C. Expenditures Analyzed by Promotional Activity Groups<br />
The Commission’s Special Order sought information about 20 separate promotional<br />
activity categories. For purposes of this Report, these categories have been consolidated in<strong>to</strong><br />
six groups: 1) Traditional Measured Media, consisting of television, radio, <strong>and</strong> print advertising;<br />
2) New Media, consisting of company-sponsored websites, Internet, digital, word-of-mouth,<br />
<strong>and</strong> viral marketing; 3) Packaging <strong>and</strong> In-S<strong>to</strong>re <strong>Marketing</strong>; 4) Premiums; 5) Other Traditional<br />
Promotions, consisting of product placements, movie theater, video, <strong>and</strong> video game advertising,<br />
character or cross-promotion license fees, athletic sponsorships, celebrity endorsement fees,<br />
events, philanthropic activities tied <strong>to</strong> br<strong>and</strong>ing opportunities, <strong>and</strong> other miscellaneous marketing<br />
expenditures; <strong>and</strong> 6) In-School <strong>Marketing</strong>. Figure II.4 shows how the reporting companies<br />
allocated the $1.6 billion in youth-directed food marketing across the six promotional activity<br />
groups. Appendix Tables C.1 <strong>and</strong> C.2 provide detailed data on these expenditures within each of<br />
the 20 individual promotional activity categories for each food group <strong>and</strong> each age category. 26<br />
Figure II.4: Reported Total Youth <strong>Marketing</strong> Expenditures by Promotional Activity Group<br />
(In Millions of Dollars)<br />
New Media<br />
$76.6<br />
5%<br />
Traditional Measured Media<br />
$852.9<br />
53%<br />
Other Traditional Promotions<br />
$241.2<br />
15%<br />
Premiums<br />
$66.9<br />
4%<br />
Within these six promotional activity groups, Figure II.5 illustrates the percentage of <strong>to</strong>tal<br />
spending within each group contributed by each food category. The figure demonstrates, for<br />
example, that carbonated <strong>and</strong> non-carbonated beverages comprised a majority of the reported in-<br />
school expenditures, that cereals had the largest reported premium expenditures, <strong>and</strong> that nearly<br />
all food categories used traditional measured media, primarily television. Appendix Table C.3<br />
provides further detail on expenditures within the six promotional activity groups.<br />
12<br />
In-School<br />
$185.5<br />
11%<br />
In-S<strong>to</strong>re <strong>and</strong><br />
Packaging/ Labeling<br />
$195.4<br />
12%