Marketing Food to Children and Adolescents - Federal Trade ...
Marketing Food to Children and Adolescents - Federal Trade ...
Marketing Food to Children and Adolescents - Federal Trade ...

Create successful ePaper yourself
Turn your PDF publications into a flip-book with our unique Google optimized e-Paper software.
Table II.1: Total Youth <strong>Marketing</strong> for Reported Br<strong>and</strong>s <strong>and</strong><br />
Percent of Total <strong>Marketing</strong>, By <strong>Food</strong> Category,<br />
Ranked by Youth Spending<br />
<strong>Food</strong> Category<br />
<strong>Marketing</strong> That<br />
Meets Youth<br />
Criteria ($1000)<br />
Expenditures for <strong>Marketing</strong> <strong>Food</strong> <strong>to</strong> <strong>Children</strong> <strong>and</strong> <strong>Adolescents</strong><br />
Total <strong>Marketing</strong><br />
($1000)<br />
Percent of<br />
Total <strong>Marketing</strong><br />
Meeting Youth<br />
2-17 Criteria<br />
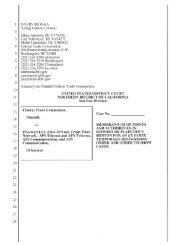
Carbonated Beverages 492,495 3,186,588 15.5<br />
Restaurant <strong>Food</strong>s 293,645 2,177,306 13.5<br />
Breakfast Cereal 236,553 792,042 29.9<br />
Juice & Non-carbonated Bevs. 146,731 1,252,022 11.7<br />
Snack <strong>Food</strong>s 138,713 852,342 16.3<br />
C<strong>and</strong>y/Froz. Desserts 117,694 456,677 25.8<br />
Prepared <strong>Food</strong>s & Meals 64,283 434,978 14.8<br />
Baked Goods 62,549 153,393 40.8<br />
Dairy Products 54,475 255,697 21.3<br />
Fruits & Vegetables 11,463 46,769 24.5<br />
TOTAL 1,618,600 9,607,815 16.8<br />
Note: Youth 2-17 marketing includes all marketing that meets either the Child 2-11 criteria or the Teen<br />
12-17 criteria, without duplication.<br />
Dollars (in millions)<br />
3500<br />
3000<br />
2500<br />
2000<br />
1500<br />
1000<br />
500<br />
0<br />
492<br />
3,187<br />
294<br />
2,177<br />
237<br />
792<br />
1,252<br />
852<br />
147 139 118<br />
9<br />
the largest overall marketing for<br />
the reported br<strong>and</strong>s. Table II.1<br />
presents <strong>to</strong>tal youth-directed<br />
expenditures (without duplication<br />
between child- <strong>and</strong> teen-directed<br />
expenditures) for each food<br />
category, ranked in descending<br />
order, <strong>and</strong> also expressed as a<br />
percentage of the <strong>to</strong>tal marketing<br />
expenditures for those br<strong>and</strong>s<br />
within that food category.<br />
Figure II.2 illustrates the<br />
youth-directed expenditures for<br />
each food category, as well as the<br />
<strong>to</strong>tal marketing for these reported<br />
br<strong>and</strong>s.<br />
Figure II.2: Reported Youth <strong>Marketing</strong> <strong>and</strong> Total <strong>Marketing</strong> for Reported Br<strong>and</strong>s,<br />
Ranked by Youth Expenditures<br />
Carbonated<br />
Beverages<br />
Restaurant<br />
<strong>Food</strong>s<br />
Breakfast<br />
Cereal<br />
Juice & Noncarbonated<br />
Bevs.<br />
Snack <strong>Food</strong>s C<strong>and</strong>y/Froz.<br />
Desserts<br />
457 435<br />
153<br />
64 63 54<br />
Prepared<br />
<strong>Food</strong>s & Meals<br />
Youth 2-17 <strong>Marketing</strong><br />
Total <strong>Marketing</strong><br />
256<br />
11<br />
47<br />
Baked Goods Dairy Products Fruits &<br />
Vegetables