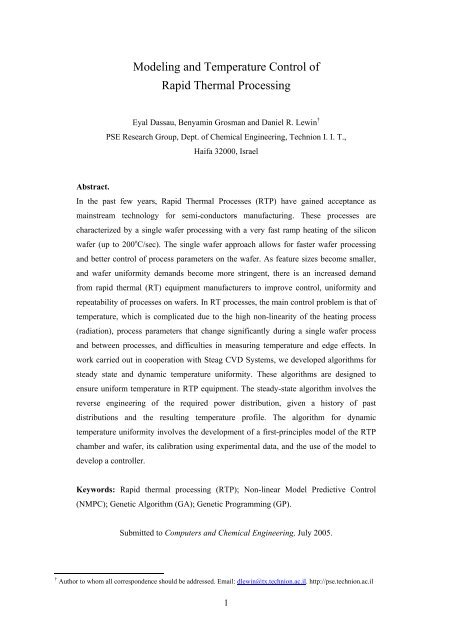
Modeling and Temperature Control of Rapid Thermal Processing
Modeling and Temperature Control of Rapid Thermal Processing
Modeling and Temperature Control of Rapid Thermal Processing

Create successful ePaper yourself
Turn your PDF publications into a flip-book with our unique Google optimized e-Paper software.
<strong>Modeling</strong> <strong>and</strong> <strong>Temperature</strong> <strong>Control</strong> <strong>of</strong><br />
<strong>Rapid</strong> <strong>Thermal</strong> <strong>Processing</strong><br />
Eyal Dassau, Benyamin Grosman <strong>and</strong> Daniel R. Lewin †<br />
PSE Research Group, Dept. <strong>of</strong> Chemical Engineering, Technion I. I. T.,<br />
Haifa 32000, Israel<br />
Abstract.<br />
In the past few years, <strong>Rapid</strong> <strong>Thermal</strong> Processes (RTP) have gained acceptance as<br />
mainstream technology for semi-conductors manufacturing. These processes are<br />
characterized by a single wafer processing with a very fast ramp heating <strong>of</strong> the silicon<br />
wafer (up to 200 o C/sec). The single wafer approach allows for faster wafer processing<br />
<strong>and</strong> better control <strong>of</strong> process parameters on the wafer. As feature sizes become smaller,<br />
<strong>and</strong> wafer uniformity dem<strong>and</strong>s become more stringent, there is an increased dem<strong>and</strong><br />
from rapid thermal (RT) equipment manufacturers to improve control, uniformity <strong>and</strong><br />
repeatability <strong>of</strong> processes on wafers. In RT processes, the main control problem is that <strong>of</strong><br />
temperature, which is complicated due to the high non-linearity <strong>of</strong> the heating process<br />
(radiation), process parameters that change significantly during a single wafer process<br />
<strong>and</strong> between processes, <strong>and</strong> difficulties in measuring temperature <strong>and</strong> edge effects. In<br />
work carried out in cooperation with Steag CVD Systems, we developed algorithms for<br />
steady state <strong>and</strong> dynamic temperature uniformity. These algorithms are designed to<br />
ensure uniform temperature in RTP equipment. The steady-state algorithm involves the<br />
reverse engineering <strong>of</strong> the required power distribution, given a history <strong>of</strong> past<br />
distributions <strong>and</strong> the resulting temperature pr<strong>of</strong>ile. The algorithm for dynamic<br />
temperature uniformity involves the development <strong>of</strong> a first-principles model <strong>of</strong> the RTP<br />
chamber <strong>and</strong> wafer, its calibration using experimental data, <strong>and</strong> the use <strong>of</strong> the model to<br />
develop a controller.<br />
Keywords: <strong>Rapid</strong> thermal processing (RTP); Non-linear Model Predictive <strong>Control</strong><br />
(NMPC); Genetic Algorithm (GA); Genetic Programming (GP).<br />
Submitted to Computers <strong>and</strong> Chemical Engineering, July 2005.<br />
† Author to whom all correspondence should be addressed. Email: dlewin@tx.technion.ac.il. http://pse.technion.ac.il<br />
1
1. INTRODUCTION<br />
Integrated circuits are at the heart <strong>of</strong> all electrical appliances. These are based mainly on<br />
semiconductor devices, which are fabricated in a sequence <strong>of</strong> batch chemical processes such<br />
as chemical vapor diffusion (CVD), oxidation, nitration, ion implantation, <strong>and</strong> annealing.<br />
Incremental improvements in integrated circuit technology, together with increased<br />
performance dem<strong>and</strong>s from semiconductor devices, have gradually led to requirements that<br />
the variation in the key quality variables be reduced <strong>and</strong> to the increased yields afforded by<br />
larger diameter silicon wafers. This in turn has increased the reliance <strong>of</strong> the microelectronics<br />
industry on advanced process control (APC) strategies, <strong>and</strong> to seek new fabrication methods.<br />
<strong>Thermal</strong> processes play an important role in the fabrication <strong>of</strong> semiconductor chips in<br />
the microelectronics industry. Shrinking device dimensions to the sub-micron range make<br />
stringent dem<strong>and</strong>s on the thermal processing <strong>of</strong> semiconductor wafers. The wafer should<br />
spend the minimal time close to the process temperature to reduce the solid-state diffusion <strong>of</strong><br />
dopants introduced in the previous fabrication steps. The drive to reduce this “thermal<br />
budget” <strong>and</strong> the tight quality dem<strong>and</strong>s gave birth to a new technology: single wafer<br />
processing (SWP). SWP systems must heat up <strong>and</strong> cool down quickly in order to compete<br />
economically with multi-wafer technology, <strong>and</strong> this has led to the development <strong>of</strong> rapid<br />
thermal processing (RTP).<br />
RTP involves the processing <strong>of</strong> single silicon wafers, <strong>and</strong> is used for various<br />
processes for the manufacture <strong>of</strong> semiconductor devices, such as rapid thermal annealing<br />
(RTA), rapid thermal oxidation (RTO), rapid thermal chemical vapor deposition (RTCVD)<br />
<strong>and</strong> rapid thermal nitration (RTN). A typical RTP operating cycle consists <strong>of</strong> three phases:<br />
(1) rapid heating to the desired operating temperature, (2) the processing phase, in which<br />
temperature is held constant, <strong>and</strong> (3) rapid cooling to ambient conditions. The drive to reduce<br />
the “thermal budget” makes RTP an attractive alternative to conventional methods <strong>of</strong> thermal<br />
processing. This goal forces a stiff constraint on the control <strong>of</strong> the process temperature <strong>and</strong><br />
thickness uniformity. As feature sizes become smaller, <strong>and</strong> wafer uniformity dem<strong>and</strong>s<br />
become more stringent, there is an increased dem<strong>and</strong> from rapid thermal (RT) equipment<br />
manufacturers to improve control, uniformity <strong>and</strong> repeatability <strong>of</strong> processes on wafers. In RT<br />
processes, the main control problem is that <strong>of</strong> temperature regulation, which is complicated<br />
due to the high non-linearity <strong>of</strong> the heating process (radiation), process parameters that<br />
change significantly during a single wafer process <strong>and</strong> between processes, <strong>and</strong> difficulties in<br />
2
measuring temperature <strong>and</strong> edge effects. The controller should be able to track ramped set<br />
point trajectories <strong>of</strong> between 50 <strong>and</strong> 200 o C/sec, <strong>and</strong> subsequently, to maintain a uniform<br />
temperature across the wafer. The rapid heating is made possible using clusters <strong>of</strong> high<br />
powered lamps, with the lamp configuration defining the structure <strong>of</strong> the RTP system, <strong>and</strong> the<br />
number <strong>of</strong> pyrometers or other temperature measuring techniques defining the character <strong>of</strong><br />
the control configuration that can be implemented on the RTP system.<br />
To meet the control objectives, a number <strong>of</strong> alterative approaches have been<br />
suggested. The proposed strategies involve decoupled decentralized control (Balakrishnan et<br />
al., 1999), learning control (Yangquan et al., 1997 <strong>and</strong> Jin Young <strong>and</strong> Hyun Min, 2001),<br />
adaptive control (Morales <strong>and</strong> Dahhou, 1998), Internal model control (IMC: Schaper et al.,<br />
1994), model predictive control (MPC: De Keyser <strong>and</strong> Donald, 1999), nonlinear MPC<br />
(NMPC: Breedijk at al., 1993), <strong>and</strong> quadratic dynamic matrix control (QDMC: Breedijk at<br />
al., 1994). A review on the state-<strong>of</strong>-the-art in RTP control is provided by Edgar et al. (2000).<br />
In this paper, two alternative control strategies are developed for temperature<br />
uniformity in RTP. The first strategy is applicable in cases where the RTP system has only a<br />
single temperature measurement positioned at the center <strong>of</strong> the wafer, <strong>and</strong> involves the<br />
optimal selection <strong>of</strong> two sets <strong>of</strong> heating lamp zone ratios, one <strong>of</strong> which is applied in the rapid<br />
heating stage, <strong>and</strong> the second in the constant-temperature processing stage. A robustly tuned<br />
PI controller ensures that the measured center-point temperature is maintained on its setpoint<br />
during the entire trajectory. The second strategy, applies nonlinear model predictive control<br />
to regulate the entire RTP temperature trajectory for uniformity. This option can only be<br />
implemented in RTP systems in which a number <strong>of</strong> temperature measurements are available,<br />
but gives superior performance.<br />
This paper is structured as follows. Section 2 provides a brief description <strong>of</strong> the<br />
commercial RTP system setup used in this work. Next, the mathematical model developed to<br />
describe the process <strong>and</strong> its calibration is detailed. Sections 4 <strong>and</strong> 5 describe the algorithm<br />
developed for temperature uniformity, <strong>and</strong> its application in a single-loop control strategy.<br />
Finally, in Section 6, we describe the application <strong>of</strong> a novel nonlinear model predictive<br />
controller for temperature uniformity, relying on empirical discrete models generated using<br />
genetic programming (Grosman <strong>and</strong> Lewin, 2002).<br />
3
2. PROCESS DESCRIPTION<br />
This work was carried out in cooperation with Steag CVD Systems, a vendor <strong>of</strong> RTP<br />
processing chambers. Steag’s Integra Pro RTP-CVD system, used in this study <strong>and</strong> shown<br />
schematically in Figure 1, involves a heating system consisting <strong>of</strong> 64 1.5 kW halogen lamps,<br />
arranged in five concentric banks, each <strong>of</strong> which can be adjusted independently to assist the<br />
uniform processing <strong>of</strong> 8″ wafers.<br />
Table 1 provides details <strong>of</strong> the arrangement <strong>of</strong> the lamps in these five banks,<br />
henceforth referred to as zones, <strong>and</strong> their locations. A single pyrometer is positioned at the<br />
center <strong>of</strong> the wafer, which sends temperature measurements to a PID controller that<br />
manipulates the total energy supply to the array <strong>of</strong> lamps. The total energy supplied in each<br />
zone therefore depends on the number <strong>of</strong> lamps in the zone, the fraction <strong>of</strong> the total power set<br />
for the zone, <strong>and</strong> the total power defined by the PID controller. Thus, for example, if zone<br />
two, consisting <strong>of</strong> six lamps, is set to have a power fraction <strong>of</strong> 30%, <strong>and</strong> the controller sets a<br />
total power <strong>of</strong> 50% <strong>of</strong> the full range, the actual power generated would be 1,500×6×0.3×0.5 =<br />
1,350 W.<br />
The reaction chamber is closed from above by a quartz window, which allows for<br />
radiative heating <strong>of</strong> the wafer by the heating lamp array, while at the same time permitting<br />
wafer processing under vacuum. The heating lamps <strong>and</strong> chamber are cooled to a temperature<br />
<strong>of</strong> 15 o C by channels conveying chilled water through the chamber matrix, <strong>and</strong> the quartz<br />
window is cooled by a stream <strong>of</strong> air. The wafer is placed by a robot arm on a support,<br />
positioned 99.5 mm under the heating array, which spins during processing to enhance<br />
uniformity. The system is computer-controlled, allowing for automation <strong>and</strong> data-acquisition.<br />
In the commercial system, an optical pyrometer provides the only temperature measurement,<br />
which is positioned underneath the center <strong>of</strong> the wafer. However, on the experiments carried<br />
out to enable the development <strong>of</strong> a mathematical model, the radial wafer temperature pr<strong>of</strong>ile<br />
is measured by running the equipment using TC wafers <strong>of</strong> various emissivities, on which five<br />
thermocouples are attached radially, at the center, <strong>and</strong> positioned 2.5, 5, 7.5 <strong>and</strong> 9.5 cm from<br />
the center.<br />
4
Concentric Lamp Array<br />
Quartz window<br />
Measuring system - TC Wafer<br />
Optical Pyrometer<br />
Figure 1 - Integra Pro RTP-CVD system.<br />
Table 1. Heating System Arrangement for Steag’s Integra Pro RTP-CVD System.<br />
Zone Number <strong>of</strong> Lamps Rin (mm) Rout (mm)<br />
1 1 0 13.5<br />
2 6 18.5 45.5<br />
3 12 50.5 77.5<br />
4 19 82.5 109.5<br />
5 26 114.5 141.5<br />
3. MODELING AND CALIBRATION OF THE RTP SYSTEM<br />
The first step in achieving a control scheme involves the development <strong>of</strong> a first-principles<br />
model <strong>of</strong> the RTP chamber <strong>and</strong> wafer. This is calibrated to match experimental data using<br />
non-linear regression. The dynamic model, expressed as a partial differential equation, has<br />
been approximated by finite differences. It is solved numerically using the implicit Crank<br />
Nicholson scheme with some modifications to h<strong>and</strong>le the non-linear temperature terms that<br />
were included explicitly for simplicity. The subsequent control work relies on this model as a<br />
surrogate for the real RTP process at Steag CVD Systems.<br />
<strong>Modeling</strong> the Wafer.<br />
An energy balance on the wafer in the RTP chamber gives:<br />
∂T<br />
ρC<br />
= qk<br />
+ qc<br />
+ q<br />
∂t<br />
where ρ, C <strong>and</strong> T are the wafer density, specific heat <strong>and</strong> temperature, t is the time, <strong>and</strong> qk, qc<br />
<strong>and</strong> qr are the heat transfer rates by conduction, convection <strong>and</strong> radiation, respectively. A<br />
5<br />
r<br />
(1)
number <strong>of</strong> simplifications can be made the model that describes the specific equipment under<br />
investigation. Since the system has rotational symmetry, the full three-dimensional model (in<br />
r, θ <strong>and</strong> z) can be reduced to a two-dimensional one (in r <strong>and</strong> z). Furthermore, since during<br />
processing, the wafer is positioned on a rotating plate, the entire wafer is represented by<br />
radial chord, leading to a two-dimensional model in Cartesian coordinates (x, z). Furthermore,<br />
it is assumed that the quartz window <strong>and</strong> cooling water temperatures are constant.<br />
Using these assumptions, the energy balance is expressed as:<br />
∂T<br />
∂ ⎛ ∂T<br />
⎞ ∂ ⎛ ∂T<br />
ρ C ( T)<br />
= ⎜k<br />
( T)<br />
⎟ + ⎜k<br />
( T)<br />
∂t<br />
∂x<br />
⎝ ∂x<br />
⎠ ∂z<br />
⎝ ∂z<br />
The following boundary conditions apply:<br />
T = T at t = 0<br />
init<br />
∂T<br />
k ( T ) = 0 at x = 0<br />
∂x<br />
∂T<br />
k( T ) = −he<br />
wall<br />
∂x<br />
( T − T ) at x = R<br />
4 4 ( T − T ) + h ( T − T ) at z = 0<br />
∂T<br />
k( T ) = F1<br />
ε 1(T)<br />
σ<br />
cool w cool<br />
∂z<br />
⎛ x ⎞<br />
hw = hi<br />
+ ( ho<br />
− hi<br />
) ⎜ ⎟<br />
⎝ R ⎠<br />
( x,t)<br />
( x)<br />
6<br />
4<br />
⎞<br />
⎟<br />
⎠<br />
4 4 ( T − T ) at z Z<br />
∂T<br />
q<br />
k( T ) = ε ( T ) − F ( T )<br />
(8)<br />
2ε<br />
σ<br />
a =<br />
∂z<br />
A<br />
where T is the wafer temperature, Tinit is the initial wafer temperature, he, hi, ho, <strong>and</strong> hw, are<br />
the convective heat transfer coefficients at the wall, at the center <strong>and</strong> edge <strong>of</strong> the wafer, <strong>and</strong><br />
the overall coefficient, respectively, Twall is the wall temperature, Tcool is the cooling water<br />
temperature, <strong>and</strong> Ta is the temperature <strong>of</strong> the quartz window, C(T) is the heat capacity, k(T) is<br />
the thermal conductivity, σ is the Stephan-Bolzman constant, ε1(T) <strong>and</strong> ε1(T) are the<br />
emissivities <strong>of</strong> the lower <strong>and</strong> upper wafer surface, respectively, F1 <strong>and</strong> F2 are reflective<br />
coefficients, x <strong>and</strong> z are the radial <strong>and</strong> depth coordinates, Z is the wafer thickness, R is the<br />
radial chord length, A(x) is the effective wafer area at the chord position x, <strong>and</strong> q(x, t) is the<br />
heat transfer rate to a given point at x.<br />
The initial condition in Eq. (3) defines the initial wafer temperature. The boundary<br />
condition in Eq. (4) expresses the symmetry at the center <strong>of</strong> the wafer (x = 0). At the edge <strong>of</strong><br />
the wafer, at x = R, the boundary condition in Eq. (5) relates the conduction in the wafer with<br />
heat losses to the reactor walls by convection. For the z direction, the boundary condition in<br />
(2)<br />
(3)<br />
(4)<br />
(5)<br />
(6)<br />
(7)
Eq. (6) at z = 0 (i.e., below the wafer), relates the conduction in the wafer to heat losses to the<br />
surroundings by radiation <strong>and</strong> convection. The overall convectional heat transfer coefficient<br />
in Eq. (7) is that proposed by Lord (1988), which accounts for spatial variations. Finally, the<br />
boundary condition in Eq. (8) at z = Z (i.e., facing the heating lamps), relates the heat transfer<br />
in the wafer to the heat supplies from the heating lamps <strong>and</strong> the heat losses to the quartz<br />
window.<br />
The wide range <strong>of</strong> operating temperatures (between 25 <strong>and</strong> 1200 o C) affects the<br />
thermal properties <strong>of</strong> the silicon wafer. Thus, the effect <strong>of</strong> temperature on the thermal<br />
conductivity <strong>and</strong> heat capacity are accounted using the correlations <strong>of</strong> Borisenko et al.<br />
(1997):<br />
-1.<br />
12<br />
k(<br />
T ) = 802.<br />
99 T<br />
⎡ W ⎤<br />
⎢cmK<br />
⎥<br />
⎣ ⎦<br />
300 −1683K<br />
C<br />
⎡ J ⎤<br />
⎢ ⎥<br />
⎣ gK ⎦<br />
300<br />
The correlation <strong>of</strong> Virzi (1991) is employed to describe emissivity:<br />
−4<br />
( T ) = 0.<br />
641+<br />
2.<br />
473×<br />
10 T<br />
> K<br />
ε(<br />
T ) = 0.<br />
2662 + 1.<br />
8591T<br />
7<br />
−0.<br />
1996<br />
e<br />
25<br />
1.<br />
0359×<br />
10<br />
-<br />
8.<br />
8328<br />
T<br />
Since the wafer density does not depend strongly on temperature, it was taken as constant (ρ<br />
= 2,330 kg/m 3 ). Furthermore, the weak temperature dependence <strong>of</strong> the thermal conductivity<br />
<strong>and</strong> the homogenous nature <strong>of</strong> the silicon wafer allow the energy balance in Eq. (2) to be<br />
further approximated:<br />
<strong>Modeling</strong> Heat Transfer to the Wafer.<br />
2 2<br />
∂T<br />
⎛ ∂ T ∂ T ⎞<br />
ρ C(<br />
T)<br />
= k(<br />
T ) ⎜ + ⎟<br />
2 2<br />
∂t<br />
⎝ ∂x<br />
∂z<br />
⎠<br />
The main mechanism that raises the wafer temperature to the desired processing level<br />
is radiation from the lamp array. The lamp array, which is located directly above the wafer, is<br />
arranged in five concentric rings <strong>of</strong> heating zones. Heat transfer by radiation depends on the<br />
radiation-transfer medium, its wavelength, <strong>and</strong> the system geometry. An ideal model for heat<br />
transfer by radiation in RTP needs to account for both diffusive <strong>and</strong> reflective radiation heat<br />
transfer. However, for control purposes, the heat transfer mechanism can be significantly<br />
simplified. Firstly, the radiating body is assumed to be a diffusive gray system, meaning that<br />
the surface emissivity, ε,<br />
<strong>and</strong> observativity, α, do not depend on the ray direction. A gray<br />
body is a body whose emissivity <strong>and</strong> observativity are independent <strong>of</strong> the wavelength, but<br />
may be functions <strong>of</strong> temperature. This means that each surface will radiate as a black body at<br />
(9)<br />
(10)<br />
(11)<br />
(12)
all wavelengths depending only on its temperature (Siegel, 1981). Secondly the lamp power<br />
must be related to the heat flux transmitted to the wafer, expressed in terms <strong>of</strong> view factors.<br />
The view factor defines the radiation fraction which is transferred from one surface to the<br />
other <strong>and</strong> is deriving from the system geometry using the following equation:<br />
F<br />
=<br />
1<br />
∫∫<br />
cosθ<br />
cosθ<br />
dA dA<br />
1 2<br />
1−<br />
2<br />
2 2 1<br />
(13)<br />
A1<br />
πS<br />
AA 1 2<br />
where F1-2 is the radiation fraction transmitted from surface 1 to surface 2, A1 <strong>and</strong> A2 are the<br />
surface areas respectively, θ1 <strong>and</strong> θ2 are the normal angles at the surfaces, <strong>and</strong> S is the<br />
distance between the surfaces. The literature abounds with equations <strong>of</strong> view factors for<br />
different bodies <strong>and</strong> systems. In this model, the view factors connect the lamp array to a<br />
differential piece <strong>of</strong> wafer, which is expressed in terms <strong>of</strong> a differential definition <strong>of</strong> the<br />
radiation view factor:<br />
cosθ1<br />
cosθ<br />
2<br />
dF1−<br />
2 =<br />
dA<br />
2<br />
2<br />
(14)<br />
πS<br />
The lamp array is divided in a natural way to five heating rings where each ring radiates to<br />
the wafer slice as shown in Figure 2:<br />
x 0<br />
z 0<br />
(x,y,z)<br />
S<br />
y 0<br />
(x 0 ,y 0 ,z 0 )<br />
8<br />
rout<br />
rin<br />
(b) (a)<br />
Figure 2 – The system geometric for view factor calculation. (a) Differential annular ring from rin to rout.<br />
(b) The plane (x,y,z) is the lamp array plan where (x 0 , y 0 ,z 0 ) is the wafer plane.<br />
By integrating Eq. (13) on a differential annular heating ring for each ring the following<br />
relation is found:<br />
F<br />
1−d<br />
2<br />
⎛<br />
⎜<br />
⎜<br />
1<br />
=<br />
⎜<br />
2 ⎜<br />
⎜<br />
⎜<br />
⎝<br />
x<br />
2<br />
2 2 2<br />
( x + z + r )<br />
in<br />
+ z<br />
2<br />
1−<br />
− r<br />
2<br />
in<br />
4x<br />
2 2<br />
rin<br />
2 2 2<br />
( x + z + r )<br />
in<br />
2<br />
−<br />
x<br />
2<br />
2 2 2<br />
( x + z + r )<br />
out<br />
+ z<br />
2<br />
1−<br />
x<br />
− r<br />
2<br />
out<br />
4x<br />
y<br />
2 2<br />
rout<br />
⎞<br />
( ) ⎟⎟⎟⎟⎟⎟<br />
2 2 2 2<br />
x + z + r<br />
Thus, the heating ring power is related to the heat flux to a differential wafer slice:<br />
out<br />
⎠<br />
(15)
q( x,<br />
t)<br />
= α ⋅<br />
5<br />
∑<br />
j=<br />
1<br />
F<br />
j−<br />
x<br />
( x,<br />
r , r<br />
9<br />
in<br />
out<br />
) ⋅ q(<br />
j)<br />
where j is the ring number, q(x,t) represent the heating ring powers multiplied by their view<br />
factor <strong>and</strong> α is a tunable parameter that is calibrated against the experimental system at Steag,<br />
which determines the radiation heat transfer that is not diffused.<br />
Model solution<br />
The model was discretized using finite difference approximations <strong>and</strong> solved<br />
numerically using the implicit Crank Nicholson method. However, nonlinear terms<br />
introduced by radiation in the boundary conditions <strong>and</strong> temperature dependence <strong>of</strong> the<br />
process parameters would significantly increase the computation time. To avoid these<br />
problems the nonlinear terms appear explicitly in the approximations used (Haimovich,<br />
2000).<br />
Model Calibration<br />
To enable the use <strong>of</strong> the developed model for improved design <strong>and</strong> control <strong>of</strong> the<br />
Steag RTP setup, several <strong>of</strong> the parameters in the model need to be calibrated to match<br />
existing process conditions. The parameters are the heat transfer coefficients, top <strong>and</strong> bottom<br />
emisivity, the F1 <strong>and</strong> F2 reflective coefficients <strong>and</strong> α, the tunable parameter that accounts for<br />
undiffused radiation heat transfer. Since our objective is to use the model to drive the<br />
controller for the lamp power during the heating <strong>and</strong> the process portions <strong>of</strong> a processing<br />
cycle, <strong>and</strong> not the cooling stage that involve gas flow to the process for cooling, the heat<br />
transfer by convection is neglected <strong>and</strong> these parameters are set to zero in the model. The<br />
parameters were calibrated by non-linear regression using a genetic algorithm (GA) as<br />
described by Lewin (1996). The GA allows a wider initial population in the optimization than<br />
a conventional optimization with single initial guess for each tunable parameter. Figure 3<br />
shows comparisons between the model <strong>and</strong> experimental data at the five wafer locations for a<br />
typical run, for a desired set point temperature <strong>of</strong> 750 o C. The GA was driven by a desire to<br />
reduce the summed squared prediction error, computed using:<br />
1<br />
( ) 2<br />
= ∑ , − mod,<br />
= 1<br />
n<br />
SSE T dat i T i<br />
n i<br />
where SSE is the summed squared error, T dat, i is the i'th temperature measurement, mod,i<br />
(16)<br />
(17)<br />
T is<br />
the i'th temperature as predicted by the model, <strong>and</strong> n is the number <strong>of</strong> measurements. The
model fit is acceptable, with the largest SSE being less then 1.6, equivalent to an average<br />
magnitude <strong>of</strong> one degree C.<br />
T [K]<br />
T [K]<br />
T [K]<br />
1200<br />
1000<br />
800<br />
TC. # 1<br />
600<br />
0 20 40 60<br />
t [sec]<br />
80 100 120<br />
1200<br />
TC. # 3<br />
1000<br />
800<br />
600<br />
0 20 40 60 80 100 120<br />
t [sec]<br />
1200<br />
TC. # 5<br />
1000<br />
800<br />
600<br />
0 20 40 60<br />
t [sec]<br />
80 100 120<br />
10<br />
T [K]<br />
T [K]<br />
1200<br />
1000<br />
800<br />
TC. # 2<br />
(1) (2)<br />
(3)<br />
(5)<br />
600<br />
0 20 40 60<br />
t [sec]<br />
80 100 120<br />
1200<br />
TC. # 4<br />
1000<br />
800<br />
600<br />
0 20 40 60<br />
t [sec]<br />
80 100 120<br />
Model<br />
Data<br />
Figure 3 – Model results against experimental data: (1) <strong>Temperature</strong> measurement at 9.5 cm from wafer<br />
center; (2) <strong>Temperature</strong> measurement at 7.5 cm from wafer center; (3) <strong>Temperature</strong> measurement at 5<br />
cm from the wafer center; (4) <strong>Temperature</strong> measurement at 2.5 cm from the wafer center: (5)<br />
<strong>Temperature</strong> measurement at the wafer center.<br />
Figure 4 presents the normalized temperature pr<strong>of</strong>ile against time at the five measurement<br />
points. These results show the same non-uniformity as was seen in the real RTP system both<br />
in the rapid temperature raise <strong>and</strong> the steady state.<br />
(4)
|∆ T| = | Tc(i)-Tc(1) | [ o C ]<br />
12<br />
10<br />
8<br />
6<br />
4<br />
2<br />
0<br />
0 10 20 30 40 50<br />
Time [sec]<br />
60 70 80 90 100<br />
Figure 4 – <strong>Temperature</strong> transients at the measurements points.<br />
Model Validation<br />
11<br />
Tc(1)<br />
Tc(2)<br />
Tc(3)<br />
Tc(4)<br />
Tc(5)<br />
The last step in approving a model <strong>of</strong> a physical system is to test whether this model<br />
shows the same dynamic behavior as expected from a study <strong>of</strong> the literature. This was<br />
accomplished by running several step test simulations to estimate the linearized process gain,<br />
with results presented in Figure 5. Schaper et al. (1994) <strong>and</strong> Kailath et al. (1996) observe that<br />
the process gain decreases with temperature rise <strong>and</strong> indeed the RTP model shows this<br />
relation. Furthermore, linearizing the RTP system dynamics leads to a first order model, in<br />
which the process gain is inversely proportional to the third power <strong>of</strong> temperature. Indeed, as<br />
seen in Figure 5, the step test results indicate the empirical relationship:<br />
K = -3.664⋅ log ( ) + 32.86<br />
(18)<br />
p<br />
T<br />
The small power difference between the empirical <strong>and</strong> the expected value <strong>of</strong> −3 is explained<br />
by system nonlinearities, other simplifications <strong>and</strong> measurement error.
log ( K p )<br />
8.2<br />
8<br />
7.8<br />
7.6<br />
7.4<br />
7.2<br />
7<br />
6.8<br />
6.6<br />
6.4<br />
6.2<br />
6.75 6.8 6.85 6.9 6.95 7 7.05 7.1 7.15 7.2 7.25<br />
log (T)<br />
Figure 5 – The effect <strong>of</strong> temperature on process static gain.<br />
.<br />
4. ALGORITHM FOR TEMPERATURE UNIFORMITY<br />
12<br />
R 2 = 0.9747<br />
log(T)<br />
linear<br />
In the following, a solution for the temperature uniformity problem is suggested, <strong>and</strong><br />
demonstrated in concert with a feedback control scheme on a simulation <strong>of</strong> the RTP<br />
equipment at Steag CVD Systems. This solution is designed to ensure uniform CVD <strong>of</strong><br />
substrates grown in RTP equipment. Our uniformity algorithm involves the reverse<br />
engineering <strong>of</strong> the required power distribution, given a history <strong>of</strong> past distributions <strong>and</strong> the<br />
resulting temperature pr<strong>of</strong>ile. The algorithm has been realized in MATLAB ® , <strong>and</strong> a userfriendly<br />
GUI has been developed to make it easy to use.<br />
The uniformity algorithm is based on a linear approximation formulated in terms <strong>of</strong><br />
deviation variables <strong>of</strong> the temperature, <strong>and</strong> the power from a base case pr<strong>of</strong>iles that are<br />
supplied by the user. Since we are using deviation variables <strong>and</strong> we must set five power<br />
distributions, the user must supply at least six (independent) sets <strong>of</strong> data. The target<br />
temperature pr<strong>of</strong>ile is set according to the following:<br />
=<br />
T − T<br />
(19)<br />
T sp<br />
0<br />
0
where T sp is the target pr<strong>of</strong>ile, T 0 base case temperature pr<strong>of</strong>ile <strong>and</strong> T 0 is the average <strong>of</strong><br />
T 0 . The target temperature pr<strong>of</strong>ile was defined in this way to account for temperature non-<br />
uniformity in the base case. We assume a linear model <strong>of</strong> the following structure:<br />
Y = C ⋅ P<br />
[ T 1 − T 0 � T 2 − T 0 �…<br />
T T 0 ]<br />
[ P − P � P − P �…<br />
P P ]<br />
Y = � n −<br />
P = � n −<br />
1<br />
0<br />
2<br />
where Y is matrix <strong>of</strong> temperature pr<strong>of</strong>iles in terms <strong>of</strong> deviation variables, P is the power<br />
distribution matrix in terms <strong>of</strong> deviation variables <strong>and</strong> C is the linear model coefficient<br />
matrix that is computed by multiple linear regression:<br />
T<br />
−1<br />
T T<br />
( ( ) )<br />
C = P P P Y<br />
where T is the matrix transpose. Having estimated a linear approximation relating power<br />
distribution to temperature pr<strong>of</strong>iles, the next step is the minimization <strong>of</strong> an objective function,<br />
selected according to how the wafer was measured. Thus, for data measured radially, the<br />
objective function needs to be suitably weighed:<br />
2 2<br />
∑ ( r i − r i−1<br />
)( C ⋅ P opt − T )<br />
min sp<br />
Popt<br />
Alternatively, if elipsometrically-measured data is used, no weighting is required:<br />
2<br />
min ( C ⋅ P opt − T sp )<br />
Popt<br />
∑<br />
In Eqs. (24) <strong>and</strong> (25), P opt is the optimal power distribution. Since Steag required that the first<br />
measurement point measured by the pyrometer should be equal to the base pr<strong>of</strong>ile, the<br />
optimization is carried out on four power values, with the fifth being fixed using the linear<br />
model.<br />
Algorithm validity<br />
The basic assumption behind the algorithm is that a linear model based on<br />
temperature <strong>and</strong> power deviation variables will fit the operating conditions. Since the process<br />
is in fact nonlinear, the optimized power distribution obtained in the first iteration is only an<br />
approximation, <strong>and</strong> will probably result in a temperature pr<strong>of</strong>ile that is not sufficiently<br />
uniform. However, running the algorithm iteratively, <strong>and</strong> adding new information as it<br />
becomes available, will lead to convergence. Figure 6 shows the convergence <strong>of</strong> the<br />
algorithm around set point temperature <strong>of</strong> 700 o C in six runs with a STD <strong>of</strong> 2 as a stopping<br />
condition.<br />
0<br />
13<br />
T<br />
2<br />
0<br />
(20)<br />
(21)<br />
(22)<br />
(23)<br />
(24)<br />
(25)
∆T = T set point -T mean [ o C]<br />
10<br />
5<br />
0<br />
1 2 3 4 5<br />
0<br />
6<br />
Number <strong>of</strong> Iterations<br />
Figure 6 – Algorithm convergence.<br />
The flow diagram for the proposed algorithm is shown in Figure 7, noting that the same<br />
algorithm can accept any other measurement which represents wafer uniformity as an input,<br />
(e.g., elipsometer readings).<br />
14<br />
8<br />
6<br />
4<br />
2<br />
STD
Display optimal<br />
power<br />
Figure 7 – Flow diagram <strong>of</strong> algorithm.<br />
5. SINGLE-LOOP CONTROL<br />
Process<br />
data <strong>and</strong><br />
power<br />
Number <strong>of</strong> data<br />
sets<br />
Radial or spiral<br />
Measurement<br />
Insert or load data<br />
files <strong>and</strong> power<br />
distribution<br />
Is the data<br />
singular ?<br />
No<br />
Calculate mean<br />
<strong>and</strong> STD<br />
Auto set base<br />
Is the base o.k.<br />
Yes<br />
Generate T sp<br />
vector<br />
Generate Y <strong>and</strong> P<br />
perturbation<br />
matrixes <strong>and</strong><br />
Calculate C matrix<br />
Start optimization<br />
15<br />
Yes<br />
No<br />
Replace the i th<br />
data row<br />
Set base<br />
A simulator <strong>of</strong> the Steag RTP system was developed using MATLAB ® <strong>and</strong> SIMULINK ® to<br />
assist in the controller design <strong>and</strong> testing. The Steag control system relies on a PID controller,<br />
which controls the total power to the lamp array (0-100%), with the power distribution <strong>of</strong> the
heating zones being prespecified. To improve on the performance <strong>of</strong> the linear controller, the<br />
system is actually run in open loop until the center point temperature attains a temperature<br />
referred to as "cut-back low," at which point the controller is activated to bring the wafer<br />
center point temperature to the set point. It is noted that with this strategy, the predefined<br />
zone ratio is the only means to attain temperature uniformity.<br />
<strong>Control</strong>ler Design<br />
The purpose <strong>of</strong> the controller is to assure temperature uniformity in the RTP system<br />
mainly in the fast heating the ramp <strong>and</strong> at temperature steady-state, with the main<br />
requirements being to minimize the overshoot <strong>and</strong> rise time <strong>of</strong> the trajectory. The controller<br />
was designed based on Internal Model <strong>Control</strong> principles (Rivera et al., 1986). A PI<br />
controller was selected since this system has a relatively small delay time relative to the<br />
characteristic time (a delay <strong>of</strong> 0.2 sec <strong>and</strong> a characteristic time <strong>of</strong> 16 sec are typical). In such<br />
cases, there are no advantages in employing PID control. The solution to the uniformity<br />
problem was addressed in two steps: (a) The PI controller was designed to bring the center<br />
temperature to its set point; (b) two distinct optimal heater power zone distributions were<br />
generated: one for the fast ramp <strong>and</strong> one for the operating temperature. These power<br />
distributions were optimized using the proposed uniformity algorithm.<br />
<strong>Control</strong> system tuning<br />
The algorithm for the tuning <strong>of</strong> the control system is shown in Figure 8. This provides<br />
uniform temperature pr<strong>of</strong>ile in the fast heating zone <strong>and</strong> in the process temperature, <strong>and</strong> is<br />
divided into three stages:<br />
(a) PI <strong>Control</strong>ler tuning is defined, including controller parameters such as open loop<br />
power, cut back low, temperature set point, initial zone ratio, process time, zone ratio<br />
temperature switch <strong>and</strong> controller parameters. After completing this step, the center<br />
point <strong>of</strong> the wafer will be at the set point.<br />
(b) The uniformity algorithm is invoked to ensure temperature uniformity in the process<br />
operating temperature (at the temperature steady-state).<br />
(c) The uniformity algorithm is again invoked, to derive the optimal power distribution in<br />
the fast ramp, to further improve the temperature uniformity in the fast ramp <strong>and</strong> the<br />
transient from the open loop to the close loop control by reactivating the uniformity<br />
16
algorithm to find optimal zone ratio for the open loop part <strong>of</strong> the process. The following<br />
case studies illustrate how the algorithm works at various desired temperature levels.<br />
Zone Ratio<br />
Switch<br />
Initial Zone Ratio<br />
Tune the<br />
controller<br />
Run simulation<br />
No<br />
Is the STD < defined<br />
Is the over<br />
shoot too large<br />
Yes<br />
Yes<br />
Yes<br />
No<br />
<strong>Temperature</strong> Set<br />
Point<br />
No<br />
Invoke the<br />
uniformity tool on<br />
the steady state<br />
temperature<br />
pr<strong>of</strong>ile<br />
New steady state<br />
zone ratio<br />
Set the s.s. <strong>and</strong><br />
ramp zone ratio<br />
Run simulation<br />
Is the STD < defined<br />
Raise the cut<br />
back low<br />
Open Loop<br />
Power<br />
Start simulation<br />
Is the<br />
controller<br />
tuned<br />
Is the target<br />
temperature pr<strong>of</strong>ile<br />
uniform<br />
Define Stopping<br />
condition on the STD<br />
Invoke the<br />
uniformity tool<br />
on the knee<br />
temperature<br />
pr<strong>of</strong>ile<br />
New ramp zone<br />
ratio<br />
Set the ramp<br />
zone ratio<br />
Run simulation<br />
Figure 8 – Flow diagram calibrating the control system.<br />
No<br />
No<br />
17<br />
Cut Back Low<br />
Yes<br />
Define Stopping<br />
condition on the STD<br />
No<br />
Yes<br />
Process time<br />
Is the over<br />
shoot too large<br />
Is the over<br />
shoot too large<br />
No<br />
Is the knee area<br />
temperature pr<strong>of</strong>ile<br />
uniform<br />
Yes<br />
(1)<br />
Yes<br />
(2)<br />
<strong>Control</strong>ler<br />
parameters<br />
Yes<br />
(3)<br />
No<br />
Raise the cut<br />
back low<br />
Raise the cut<br />
back low<br />
Done
Case study – Process temperature target <strong>of</strong> 700 o C<br />
T [ o C]<br />
T [ o C]<br />
T [ o C]<br />
800<br />
600<br />
400<br />
200<br />
0<br />
0 10 20 30 40 50 60 70 80 90 100<br />
800<br />
t [sec]<br />
600<br />
400<br />
200<br />
0<br />
0 10 20 30 40 50 60 70 80 90 100<br />
800<br />
t [sec]<br />
600<br />
400<br />
200<br />
0<br />
0 10 20 30 40 50<br />
t [sec]<br />
60 70 80 90 100<br />
Figure 9 – Base temperature pr<strong>of</strong>ile for set point <strong>of</strong> 700ºC: (1) Base pr<strong>of</strong>ile; (2) Pr<strong>of</strong>ile after setting the<br />
steady state zone ratio; (3) Pr<strong>of</strong>ile after setting the ramp zone ratio.<br />
In this case study, the temperature set point for the process is 700 o C , the transient<br />
temperature from open to close loop is 680 o C <strong>and</strong> arbitrary zone ratio powers <strong>of</strong><br />
(zr1=0.0446, zr2=0.827, zr3=0, zr4=0.387, zr5=0.95). The first plot in Figure 9 shows the<br />
initial pr<strong>of</strong>ile <strong>of</strong> the system which, as can be seen, exhibits uniformity problems in the target<br />
temperature as well as in the fast heating zone. An improved temperature distribution can be<br />
seen in the second plot <strong>of</strong> Figure 9, which shows the result <strong>of</strong> implementing a new zone ratio<br />
<strong>of</strong> (zr1=1, zr2=0.408, zr3=0, zr4=0.795, zr5=1) as calculated by the uniformity algorithm. This<br />
new trajectory achieves a uniformity with an STD <strong>of</strong> less than 2, as seen also in Figure 10.<br />
This solves the uniformity problem in the steady-state temperature region, but there is still a<br />
problem in the fast heating stage (the transient from open to closed loop), this problem is<br />
resolved by re-running the uniformity algorithm for the fast heating <strong>and</strong> setting the zone ratio<br />
powers to (zr1=0.17, zr2=0.483, zr3=0, zr4=0, zr5=1) <strong>and</strong> the transient temperature (from open<br />
to closed loop) to 650 o C. The proposed control presents an improved temperature pr<strong>of</strong>ile as<br />
can be seen in the third plot <strong>of</strong> Figure 9, which indicates that the uniformity <strong>of</strong> the<br />
18<br />
(1)<br />
(2)<br />
(3)
temperature trajectories are indeed significantly improved, but at a cost <strong>of</strong> a longer start-up<br />
time.<br />
∆T = T set point -T mean [ o C]<br />
10<br />
5<br />
0<br />
1 2 3 4 5<br />
0<br />
6<br />
Number <strong>of</strong> Iterations<br />
Figure 10 – Convergence <strong>of</strong> the algorithm for set point <strong>of</strong> 700ºC: <strong>Temperature</strong> STD (right) <strong>and</strong> mean<br />
temperature deviation from the set point (left).<br />
This control strategy, combining a PI controller that is tuned for a specific temperature set<br />
point <strong>and</strong> a uniformity algorithm, was tested over a wide range <strong>of</strong> temperature set points with<br />
good results. The main advantages are that the operator needs to perform only few iterations<br />
to tune the controller to a desire operating temperature, where the trade <strong>of</strong>f between<br />
uniformity <strong>and</strong> the time that is needed to reach the set point is a degree <strong>of</strong> freedom that<br />
depends on the process. Furthermore, this control scheme can be easily implemented on a<br />
system that has only one temperature measurement, which still providing acceptable<br />
performance.<br />
6. MULTIVARIABLE CONTROL<br />
To improve the control <strong>of</strong> RTP systems <strong>and</strong> to meet tighter uniformity specifications, to<br />
reduce the time needed to acquire the set point, <strong>and</strong> otherwise improve the flexibility <strong>of</strong> the<br />
process, there is a need for control systems more advanced than that that developed in the<br />
19<br />
8<br />
6<br />
4<br />
2<br />
STD
previous section. However, such a system will require more than one temperature<br />
measurement. To enable the control system to work at different process temperatures without<br />
any need for retuning, we implemented a non-linear model predictive control (NMPC)<br />
system based on non-linear models derived using Genetic Programming (GP), as described<br />
by Grosman <strong>and</strong> Lewin (2002). The inputs for the controller are three temperature<br />
measurements on the wafer radius. In a real system, these would have to be optical<br />
pyrometers, as the temperature measurement should not interfere with the wafer rotation.<br />
Model Formulation: The first step was to formulate GP models for MPC. In our study, these<br />
models were based on the mathematical model <strong>of</strong> the Steag RTP system which represents the<br />
real system. By investigating the mathematical model, a response time in the order <strong>of</strong> a few<br />
seconds were identified, leading to the sampling time selection <strong>of</strong> half a second. This<br />
sampling rate will provide the necessary information for constructing the GP models. The<br />
system was excited by 12 steps <strong>of</strong> five seconds in the inputs, in this case, the power ratio for<br />
the heating rings assuming full total power. However, since it is <strong>of</strong> interest to bring the<br />
system to a given temperature range, this calls for a specific heat loading. Thus, the<br />
perturbation steps are arranged in sets <strong>of</strong> threes where the first perturbation in each set is free<br />
to activate all the heating rings while limiting the fourth <strong>and</strong> fifth heating rings to 15% <strong>of</strong> full<br />
power. In the second <strong>and</strong> third perturbations, only one heating ring is activated r<strong>and</strong>omly.<br />
Figure 11 shows a typical perturbation sequence derived for the GP <strong>and</strong> Figure 12 presents<br />
the resulting temperature pr<strong>of</strong>iles obtained.<br />
20
% Power<br />
% Power<br />
% Power<br />
% Power<br />
% Power<br />
1<br />
0.5<br />
0<br />
1<br />
0 10 20 30 40 50 60<br />
0.5<br />
0<br />
1<br />
0 10 20 30 40 50 60<br />
0.5<br />
0<br />
1<br />
0 10 20 30 40 50 60<br />
0.5<br />
0<br />
1<br />
0 10 20 30 40 50 60<br />
0.5<br />
0<br />
0 10 20 30<br />
t [sec]<br />
40 50 60<br />
Figure 11 – Typical perturbation <strong>of</strong> the RTP for the GP. (1) – (5) different heating rings.<br />
T [ o C]<br />
1000<br />
800<br />
600<br />
400<br />
200<br />
0<br />
0 10 20 30<br />
t [sec]<br />
40 50 60<br />
Figure 12 – <strong>Temperature</strong> pr<strong>of</strong>ile resulting from the system perturbation.<br />
21<br />
(1)<br />
(2)<br />
(3)<br />
(4)<br />
(5)<br />
x = 0<br />
1<br />
x = 0.01<br />
2<br />
x = 0.02<br />
3<br />
x = 0.03<br />
4<br />
x = 0.04<br />
5<br />
x = 0.05<br />
6<br />
x = 0.06<br />
7<br />
x = 0.07<br />
8<br />
x = 0.08<br />
9<br />
x = 0.09<br />
10<br />
x = 0.1<br />
11
The GP models <strong>and</strong> their prediction against data are presented below:<br />
T [ o C]<br />
1. Model for the center <strong>of</strong> the wafer:<br />
1000<br />
900<br />
800<br />
700<br />
600<br />
500<br />
400<br />
300<br />
200<br />
100<br />
T<br />
1<br />
+ 1<br />
(<br />
() i = zr4<br />
( i −1)<br />
+ 1.<br />
72 ⋅ ( zr2<br />
( i −1)<br />
+ 1.<br />
00045 ⋅ zr3<br />
( i)<br />
) +<br />
. 0766 ⋅ zr ( i −1)<br />
) ⋅15.<br />
2924 + 0.<br />
97707 ⋅T<br />
( i −1)<br />
+ 12.<br />
9392<br />
5<br />
0<br />
0 20 40 60<br />
t [sec]<br />
80 100 120<br />
Figure 13 – The behavior <strong>of</strong> the model for the center point against the process data.<br />
22<br />
1<br />
Data<br />
Model<br />
(26)
T [ O C]<br />
2. Model for the second measurement point (five centimeters from the center):<br />
900<br />
800<br />
700<br />
600<br />
500<br />
400<br />
300<br />
200<br />
100<br />
T<br />
2<br />
() i = (<br />
zr ( i −1)<br />
+ 1.<br />
2417 ⋅ zr ( i −1)<br />
+ 1.<br />
0959 ⋅ zr ( i − 2)<br />
+<br />
+ 1.<br />
1334 ⋅ zr ( i −1)<br />
Data<br />
Model<br />
4<br />
5<br />
3<br />
) ⋅18.<br />
2151 + 0.<br />
97785 ⋅T<br />
( i −1)<br />
+ 11.<br />
8499<br />
0<br />
0 20 40 60<br />
t [sec]<br />
80 100 120<br />
Figure 14 – The behavior <strong>of</strong> the model for the second point against the process data.<br />
23<br />
2<br />
2<br />
(27)
T [ o C]<br />
3. Model for the third measurement point (9.5 centimeters from the center):<br />
T<br />
3<br />
() i = (<br />
zr ( i −1)<br />
+<br />
+ 1.<br />
7898 ⋅ zr ( i −1)<br />
800<br />
700<br />
600<br />
500<br />
400<br />
300<br />
200<br />
100<br />
3<br />
5<br />
Data<br />
Model<br />
0.<br />
532122<br />
⋅ zr ( i −<br />
2<br />
) ⋅16.<br />
9627 + 0.<br />
97737 ⋅T<br />
( i −1)<br />
+ 10.<br />
4339<br />
24<br />
2)<br />
+<br />
3<br />
2.<br />
0857<br />
⋅ zr ( i −1)<br />
+<br />
0<br />
0 20 40 60<br />
t [sec]<br />
80 100 120<br />
Figure 15 – The behavior <strong>of</strong> the model for the third point (wafer edge) against the process data.<br />
As can be seen, the GP models are in excellent agreement to the simulated data. It should be<br />
noted that, following Grosman <strong>and</strong> Lewin (2002), the model predicts ten data points ahead<br />
from one set <strong>of</strong> known inputs. Hence at every tenth data point, the model is reset to fit the<br />
simulated data <strong>and</strong> than used to predict the subsequent ten points. Furthermore, it is<br />
interesting to note that the GP eliminates the center heating ring from the model, probably<br />
because it has a negligible effect on the response <strong>of</strong> the system, since the center ring consists<br />
<strong>of</strong> a single lamp.<br />
NMPC for the Steag RTP System: The NMPC objective function for this application is:<br />
4<br />
(28)
J = S<br />
+ S<br />
1<br />
+ S<br />
+ S<br />
4<br />
⋅<br />
⋅<br />
⋅<br />
6<br />
n<br />
⋅<br />
∑<br />
i=<br />
1<br />
n<br />
∑<br />
i=<br />
1<br />
m<br />
∑<br />
m<br />
∑<br />
i=<br />
1<br />
m<br />
2<br />
( T () i −T<br />
() i ) + S ⋅ T () i −T<br />
() i<br />
1sp<br />
m<br />
2<br />
∑( 2 2sp<br />
) + S8<br />
⋅∑(<br />
T 3()<br />
i −T<br />
3sp<br />
() i )<br />
i=<br />
1 i=<br />
1<br />
2<br />
2<br />
( zr () i − zr ( i −1)<br />
) + S ⋅ ( zr () i − zr ( i −1)<br />
) + S ⋅ ( zr () i − zr ( i −1)<br />
)<br />
1<br />
∑<br />
i=<br />
1<br />
2<br />
( zr () i − zr ( i −1)<br />
) + S ⋅ ( zr () i − zr ( i −1)<br />
)<br />
4<br />
1<br />
1<br />
4<br />
7<br />
2<br />
5<br />
∑<br />
i=<br />
1<br />
2<br />
2<br />
2<br />
[ ( T 3()<br />
i −T<br />
1()<br />
i ) + ( T 3()<br />
i −T<br />
2()<br />
i ) + ( T 2()<br />
i −T<br />
1()<br />
i ) ]<br />
9<br />
i=<br />
1<br />
where S1-S9 are weighting functions, 1 , T 2,<br />
T 3<br />
n<br />
n<br />
2<br />
5<br />
25<br />
2<br />
5<br />
2<br />
+<br />
3<br />
n<br />
∑<br />
i=<br />
1<br />
3<br />
3<br />
2<br />
+<br />
2<br />
+<br />
(29)<br />
T are temperature vectors, T 1 sp , T 2sp<br />
, T 3sp<br />
are<br />
temperature set point vectors <strong>and</strong> the index i is the i’th sample point. It is noted that the<br />
objective function consists <strong>of</strong> three main parts: (a) the sum <strong>of</strong> squared errors (SSE) between<br />
the controlled variables <strong>and</strong> their set points, (b) the SSE <strong>of</strong> the controller movements, <strong>and</strong> (c)<br />
the SSE <strong>of</strong> the difference between the three measured temperatures.<br />
The prediction <strong>and</strong> control horizon are set to five <strong>and</strong> two, <strong>and</strong> the objective function<br />
weights are set empirically to the values listed in Table 2.<br />
Table 2– Weights values for the NMPC<br />
Weight<br />
Value<br />
S1<br />
0<br />
S2<br />
6<br />
7×<br />
10<br />
S3<br />
6<br />
6×<br />
10<br />
S4<br />
6<br />
9×<br />
10<br />
S5<br />
6<br />
5×<br />
10<br />
Case study – Process temperature target <strong>of</strong> 700 o C<br />
As in SISO control using PI control integrated with the uniformity algorithm, the<br />
NMPC is tested on three temperature operating points where the target was to arrive to this<br />
set point as fast as possible with a uniform temperature pr<strong>of</strong>ile. Figure 16 shows an example<br />
<strong>of</strong> the NMPC performance for a set point <strong>of</strong> 700 o C. The main benefit from NMPC is a faster<br />
convergence to the temperature target, which has a direct affect on the overall thermal budget<br />
<strong>of</strong> the wafer. Furthermore, the deviation <strong>of</strong> the radial temperature pr<strong>of</strong>ile is only <strong>of</strong> the order<br />
<strong>of</strong> one o C. The small overshot <strong>of</strong> approximately 30 o C can be overcome by changing the<br />
objective function weights. The fact that one can minimize overshot while keeping the radial<br />
temperature pr<strong>of</strong>ile uniform on different working temperatures without any need for retuning,<br />
is one <strong>of</strong> the advantages <strong>of</strong> NMPC.<br />
S6<br />
70<br />
S7<br />
70<br />
S8<br />
70<br />
S9<br />
400
T [ o C]<br />
∆u<br />
800<br />
600<br />
400<br />
200<br />
0<br />
0 10 20 30<br />
t [sec]<br />
40 50 60<br />
1<br />
0.8<br />
0.6<br />
0.4<br />
0.2<br />
0<br />
0 10 20 30<br />
t [sec]<br />
40 50 60<br />
26<br />
(1)<br />
(2)<br />
zr(1)=0<br />
zr(2)<br />
zr(3)<br />
zr(4)<br />
zr(5)<br />
Figure 16 – GP-NMPC control for set point tracking <strong>of</strong> 700 ºC: (1) <strong>Temperature</strong> pr<strong>of</strong>ile in the wafer;<br />
(2) <strong>Control</strong>ler moves.<br />
7. CONCLUSIONS<br />
Two distinct solutions are presented in this work:<br />
The first one, which could be implemented directly on the Steag CVD RTP system,<br />
involves the implementation <strong>of</strong> the uniformity algorithm <strong>and</strong> an IMC-tuned PI controller. The<br />
operating sequence calls first for a heating stage in open loop mode until a pre-defined<br />
temperature, at which point the feedback controller takes over. It has been observed that<br />
significant temperature uniformity occurs both at the processing temperature <strong>and</strong> during the<br />
fast ramp, or more precisely, in the knee region between the open loop <strong>and</strong> the close loop<br />
phases. Our solution utilizes the uniformity algorithm to set different zone ratios for the<br />
process region <strong>and</strong> for the ramp stage. The switch between the zone ratios is made at a predefined<br />
temperature that shifts to reduce the heating rate if the temperatures pr<strong>of</strong>ile shows<br />
unacceptable overshoot. The set point tracking is achieved by the PI controller that brings the<br />
wafer center point to the set point temperature. By using different zone ratios, the overall
temperature uniformity is kept at ± 2 ºC <strong>of</strong> the set point. This solution gave acceptable<br />
performance at three distinct operating temperatures.<br />
The second solution involves non-linear model predictive control (NMPC) based on<br />
genetic programming (GP). We have decided to control three points on the wafer: the first is<br />
at the center point as in the st<strong>and</strong>ard control scheme, the second is positioned five centimeters<br />
from the center point on a radial line, <strong>and</strong> the last one is at the wafer edge. These three points<br />
were picked relying on the observation that the highest non-uniformity is located near the<br />
wafer edge. On the real system, all <strong>of</strong> these temperature measurements would be executed<br />
using pyrometers, in such a way that the rotation <strong>of</strong> the wafer, common in many RTP<br />
systems, will not affect the measurement. The strength <strong>of</strong> this approach is that the same set <strong>of</strong><br />
tuning parameters can control the RTP system at a range <strong>of</strong> operating temperature set points<br />
with a very short rise time to the set point <strong>and</strong> a uniform temperature pr<strong>of</strong>ile. Although we<br />
have experienced overshoot, it has been observed only for a few seconds <strong>and</strong> the set point<br />
was maintained accurately.<br />
The two approaches have great potential for resolving real engineering problems<br />
associated with RTP. The simple SISO technique was developed taking into account the<br />
limitation associated with the existing RTP equipment at Steag CVD Systems, <strong>and</strong> relies on a<br />
single on-line temperature measurement <strong>and</strong> PID control. In contrast, has been demonstrated<br />
that a nonlinear multivariable approach can significantly improve performance, but relies on<br />
additional on-line temperature measurements. Together, they provide a RTP control package<br />
that represents the state-<strong>of</strong>-the-art.<br />
REFERENCES<br />
Balakrishnan, K. S., S. Shooshtarian, N. Acharya, P. J. Timans <strong>and</strong> R. P. S. Thakur<br />
(1999).“Dynamic uniformity control in a rapid thermal processing system,” Advances<br />
in <strong>Rapid</strong> <strong>Thermal</strong> <strong>Processing</strong>. Proceedings <strong>of</strong> the Symposium. (Electrochemical Society<br />
Proceeding Vol.99-10). Electrochem. Soc.,99-10, 399-406.<br />
Borisenko, V. E. <strong>and</strong> P. J. Hesketh (1997). <strong>Rapid</strong> thermal processing <strong>of</strong> semiconductors.<br />
Perseus Publishing, Cambridge.<br />
Breedijk, T., T. F. Edgar <strong>and</strong> I. Trachtenberg (1993).“A model predictive controller for<br />
multivariable temperature control in rapid thermal processing,” Proceedings <strong>of</strong> the<br />
1993 American <strong>Control</strong> Conference, AACC, 3, 2980-4, Evanston, IL, USA.<br />
Breedijk, T., T. F. Edgar <strong>and</strong> I. Trachtenberg (1994).“Model-based control <strong>of</strong> rapid thermal<br />
processes,” Proceedings <strong>of</strong> the 1994 American <strong>Control</strong> Conference . IEEE.,1, 887-91,<br />
New York, NY, USA.<br />
27
De Keyser, R. <strong>and</strong> J. Donald, III (1999).“Model based predictive control in RTP<br />
semiconductor manufacturing,” Proceedings <strong>of</strong> the 1999 IEEE International<br />
Conference on <strong>Control</strong> Applications.,2, 1636-41.<br />
Edgar, T. F., S. W. Butler, W. J. Campbell, C. Pfeiffer, C. Bode, S. B. Hwang, K. S.<br />
Balakrishnan <strong>and</strong> J. Hahn (2000). “Automatic control in microelectronics<br />
manufacturing: practices, challenges, <strong>and</strong> possibilities,” Automatica, 36(11), 1567-603.<br />
Grosman, B. <strong>and</strong> D. R. Lewin, “Automated Nonlinear Model Predictive <strong>Control</strong> using<br />
Genetic Programming,” Comput. Chem. Eng., 26(4-5), 631-640 (2002).<br />
Haimovich, N. (2000). "Oxidation-Oven Physical Model,” B.Sc. Final Year Project,<br />
Technion I.I.T, Haifa<br />
Jin Young, C. <strong>and</strong> D. Hyun Min (2001). “A learning approach <strong>of</strong> wafer temperature control<br />
in a rapid thermal processing system,” IEEE Transactions on Semiconductor<br />
Manufacturing, 14(1), 1-10.<br />
Kailath, T., C. Schaper, Y. Cho, P. Gyugyi, S. Norman, P. Park, S. Boyd, G. Franklin, K.<br />
Saraswat, M. Moslehi <strong>and</strong> C. Davis (1996). "<strong>Control</strong> for advanced semiconductor<br />
device manufacturing: A case history," The <strong>Control</strong> H<strong>and</strong>book. W. S. Levine.<br />
Lewin, D. R. (1996). “Multivariable feedforward control design using disturbance cost maps<br />
<strong>and</strong> a genetic algorithm,” Computers & Chemical Engineering, 20(12), 1477-89.<br />
Lord, H. A. (1988). “<strong>Thermal</strong> <strong>and</strong> stress analysis <strong>of</strong> semiconductor wafers in a rapid thermal<br />
processing oven,” IEEE Transactions on Semiconductor Manufacturing, 1(3), 105-14.<br />
Morales, S. <strong>and</strong> B. Dahhou (1998). “<strong>Temperature</strong> uniformity in RTP using MIMO adaptive<br />
control,” International Journal <strong>of</strong> Adaptive <strong>Control</strong> & Signal <strong>Processing</strong>, 12(3), 227-<br />
245.<br />
Rivera, D. E., S. Skogestad <strong>and</strong> M. Morari (1986). “Internal Model <strong>Control</strong> for PID<br />
<strong>Control</strong>ler Design,” I&EC Proc. Des. Dev., 25, 252-265.<br />
Schaper, C. D., M. M. Moslehi, K. C. Saraswat <strong>and</strong> T. Kailath (1994). “<strong>Modeling</strong>,<br />
identification, <strong>and</strong> control <strong>of</strong> rapid thermal processing systems,” Journal <strong>of</strong> the<br />
Electrochemical Society, 141(11), 3200-9.<br />
Siegel, R. (1981). <strong>Thermal</strong> radiation heat transfer. Hemisphere Pub. Corp. Edition: 2nd ed.,<br />
Washington.<br />
Virzi, A. (1991). “Computer modelling <strong>of</strong> heat transfer in Czochralski silicon crystal<br />
growth,” Journal <strong>of</strong> Crystal Growth, 112(4), 699-722.<br />
Yangquan, C., X. Jian-Xin <strong>and</strong> W. Changyun (1997). “A high-order terminal iterative<br />
learning control scheme RTP-CVD application,” Proceedings <strong>of</strong> the 36th IEEE<br />
Conference on Decision <strong>and</strong> <strong>Control</strong>, 4, 3771-2 vol.<br />
28