Summary - Law Seminars International
Summary - Law Seminars International
Summary - Law Seminars International

Create successful ePaper yourself
Turn your PDF publications into a flip-book with our unique Google optimized e-Paper software.
Anthony Gibbons of Re-Solve Speaker #: 6b-1<br />
Hey, that’s my parking spot!<br />
aka<br />
An analysis of the diminution in property<br />
value resulting from lost parking<br />
Anthony Gibbons, MAI, CRE<br />
RE !SOLVE<br />
V"#$% '( ) S+',,"-. ,, .<br />
/#-0#1<br />
<strong>Law</strong> <strong>Seminars</strong> <strong>International</strong> | Government Takings | 12/14/07 in Seattle, WA
Anthony Gibbons of Re-Solve Speaker #: 6b-2<br />
<strong>Law</strong> <strong>Seminars</strong> <strong>International</strong> | Government Takings | 12/14/07 in Seattle, WA<br />
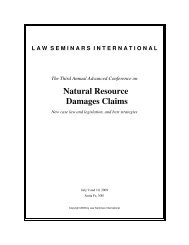
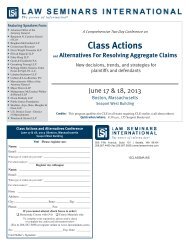
IN-LINE<br />
ANCHOR ANCHOR<br />
2#3#4',#1 V"#$<br />
Compact, hybrid cars only<br />
STORM WATER DETENTION BICYCLES COMMUNITY HALL<br />
with parking underground<br />
/"05 V"#$<br />
RETAIL<br />
water feature Open Space<br />
Trails<br />
Architecture
Anthony Gibbons of Re-Solve Speaker #: 6b-3<br />
R#0)"4#1 V"#$<br />
RETAILER<br />
The Components of a Property<br />
" The Land<br />
# Valued as though vacant and unimproved<br />
# Typically valued as though free and clear to be<br />
developed to its highest and best use.<br />
" The Building<br />
# Valued under its present use or highest and best use,<br />
based typically on its contribution to the land value as<br />
developed above.<br />
<strong>Law</strong> <strong>Seminars</strong> <strong>International</strong> | Government Takings | 12/14/07 in Seattle, WA
Anthony Gibbons of Re-Solve Speaker #: 6b-4<br />
Before & After Analysis<br />
" The Combination of land and building<br />
# Valued under the use to which it is put, put or could be put put, at the<br />
time of the condemnation.<br />
# This may change due to the condemnation, and thus the “Before”<br />
use and the “After” use may differ.<br />
" Parking may be just one cause of this.<br />
" The appraiser measures the difference between the value of the<br />
property Before and the value of the property After<br />
" The appraiser should also consider, as a deduction from the After<br />
value, the cost to “transition” from one use to the other (rarely done).<br />
# The unit rule allows for a valuation of merged interests<br />
# Leases are ignored unless they happen to be above market<br />
Just Compensation Breakdown<br />
" The take (in the case of parking, this would be):<br />
# LLand d & site it improvements i t (asphalt, ( h lt landscaping, l d i signs) i )<br />
" Damages (in the case of parking, this has to be):<br />
# Loss in building and other improvement value due to take,<br />
that is OVER & ABOVE the value of the land taken.<br />
# The distribution of the Just Compensation may appear to be of<br />
no interest to the property owner, but it is significant as capital<br />
gains would apply to the compensation for the take value but<br />
not for damages (consult your tax attorney or accountant).<br />
<strong>Law</strong> <strong>Seminars</strong> <strong>International</strong> | Government Takings | 12/14/07 in Seattle, WA
Anthony Gibbons of Re-Solve Speaker #: 6b-5<br />
7)18"-. V)49# :001";90#%<br />
" The need for parking is driven by periods of peak demand<br />
" (e.g. weekends, xmas shopping for retail, workday for office)<br />
" A parking lot is fully subscribed at under 100%<br />
occupancy, even at times of peak demand.<br />
" The value of parking equals:<br />
# The value of land on which the parking is located;<br />
# Asphalt, curbs, striping<br />
# And allowing the building to reach its maximally productive<br />
value.<br />
" A property may have more parking than it needs in which<br />
case it could afford to lose some without damages.<br />
How the diminution in value due to<br />
reduced parking can be measured<br />
" By comparison with an identical property that has sold<br />
with less parking:<br />
# Fantasy comparable analysis:<br />
# Doesn’t deal with transitional issue<br />
" Based on demand/supply ratios for type of use:<br />
# Maintenance of actual conditions<br />
# Industry standards for certain types of use<br />
" By retail sales performance analysis<br />
" By a retail sales analysis based on shopping days<br />
" By acquisitions or sales of parking rights<br />
<strong>Law</strong> <strong>Seminars</strong> <strong>International</strong> | Government Takings | 12/14/07 in Seattle, WA
Anthony Gibbons of Re-Solve Speaker #: 6b-6<br />
Before<br />
15,000sf<br />
<strong>Law</strong> <strong>Seminars</strong> <strong>International</strong> | Government Takings | 12/14/07 in Seattle, WA<br />
7<br />
13<br />
retail<br />
59 stalls<br />
3.9 stalls per 1,000<br />
Street<br />
After 7<br />
7<br />
4<br />
7<br />
12,712sf retail<br />
22,288sf 288sf storage<br />
50 stalls<br />
3.9 stalls per 1,000<br />
Street<br />
12<br />
12<br />
20<br />
20
Anthony Gibbons of Re-Solve Speaker #: 6b-7<br />
Before Property (total) 15,000sf $225/sf $3,375,000<br />
After Property (total) 12,712sf $225/sf $2,860,169<br />
2,288sf $100/sf $228,814<br />
Subtotal 15,000sf $206/sf $3,088,983<br />
Transition -$20,000 $20 000<br />
Total After Property $3,068,983<br />
Difference $306,017<br />
Land Only 5,000sf $30/sf $150,000<br />
Asphalt 5,000sf $3/sf $15,000<br />
Total Take $165,000<br />
Damages $141,017<br />
Before<br />
$/stall 9 stalls $15,669/stall<br />
Building 15,000sf $135/sf $2,025,000<br />
Land 45,000sf $30/sf $1,350,000<br />
After<br />
$3,375,000<br />
Building 15,000sf $125/sf $1,868,983<br />
Land 40,000sf $30/sf $1,200,000<br />
$3,068,983<br />
Difference $306,017<br />
-8% loss in building value<br />
-15% loss in parking supply<br />
<strong>Law</strong> <strong>Seminars</strong> <strong>International</strong> | Government Takings | 12/14/07 in Seattle, WA
Anthony Gibbons of Re-Solve Speaker #: 6b-8<br />
Before<br />
After<br />
10,000sf<br />
<strong>Law</strong> <strong>Seminars</strong> <strong>International</strong> | Government Takings | 12/14/07 in Seattle, WA<br />
7<br />
13<br />
7<br />
4<br />
retail<br />
59 stalls<br />
5.9 stalls per 1,000<br />
Street<br />
7<br />
7<br />
10,000sf retail<br />
0sf storage g<br />
50 stalls<br />
5 stalls per 1,000<br />
Street<br />
12<br />
12<br />
20<br />
20
Anthony Gibbons of Re-Solve Speaker #: 6b-9<br />
Before Property (total) 10,000sf $225/sf $2,250,000<br />
(before consideration of excess land)<br />
After Property (total) 10,000sf $225/sf $2,250,000<br />
0sf $100/sf $0<br />
Subtotal 10,000sf $225/sf $2,250,000<br />
Transition $0<br />
Total After Property $2,250,000<br />
Difference $0<br />
Land Only 5,000sf $30/sf $150,000<br />
Asphalt 55,000sf 000sf $3/sf $15 $15,000 000<br />
Total Take $165,000<br />
Damages $0<br />
Before<br />
$/stall 9 stalls $0/stall<br />
Building 10,000sf $152/sf $1,515,000<br />
Land 30,000sf $30/sf $900,000<br />
After<br />
<strong>Law</strong> <strong>Seminars</strong> <strong>International</strong> | Government Takings | 12/14/07 in Seattle, WA<br />
$2,415,000<br />
Building 10,000sf $150/sf $1,500,000<br />
Land 25,000sf $30/sf $750,000<br />
$2,250,000 , ,<br />
Difference $165,000<br />
-1% loss in building value<br />
-15% loss in parking supply
Anthony Gibbons of Re-Solve Speaker #: 6b-10<br />
<strong>Law</strong> <strong>Seminars</strong> <strong>International</strong> | Government Takings | 12/14/07 in Seattle, WA<br />
Parking lot<br />
adjacent j<br />
to<br />
shopping<br />
center
Anthony Gibbons of Re-Solve Speaker #: 6b-11<br />
Parking Demand Analysis by type of use<br />
Parking Impact Analysis<br />
Parking Specifications Property Value Specifications (Before)<br />
Location Type Before After Loss<br />
Space sf $/sf Exp NOI Cap Value<br />
West Lot Permanent 88 100% 62 70% 26 30% Retail 58,204 sf $12.85/sf $7.18/sf $5.67/sf $79.24/sf<br />
Street (est) Temporary 40 40 0 Office 5,807 sf $11.94/sf $7.18/sf $4.76/sf 7.16% $66.51/sf<br />
Garage Temporary 82 82 0 Storage 15,000 sf $2.11/sf $0.00/sf $2.11/sf $29.46/sf<br />
Total 210 100% 184 88% 26 12% 79,011 sf $4.93/sf $68.85/sf<br />
Parking Demand/Supply Analysis<br />
Scenario A - Maintenance of Short Stay Parking Ratio for Retail<br />
Before Allocation per space type After Allocation per space type Re-allocation of spaces<br />
Gain and (Loss) in sf<br />
Retail Office Storage Total Retail Office Storage Total Retail Office Storage Total Retail Office Storage Total<br />
58,204 sf 5,807 sf 15,000 sf 79,011 sf 58,204 sf 5,807 sf 15,000 sf 79,011 sf 41,333 sf 5,807 sf 31,871 sf 79,011 sf -16,871 sf 0 sf 16,871 sf 0 sf<br />
88 0 0 88 62 0 0 62 62 0 0 62 -26 0 0 -26<br />
1.5/1000 0.0/1000 0.0/1000 1.1/1000 1.1/1000 0.0/1000 0.0/1000 0.8/1000 1.5/1000 1.2/1000 0.0/1000 0.8/1000 0.4/1000 1.2/1000 0.0/1000<br />
40 0 0 40 40 0 0 40 40 0 0 40 0 0 0 0<br />
0.7/1000 0.0/1000 0.0/1000 0.5/1000 0.7/1000 0.0/1000 0.0/1000 0.5/1000 1.0/1000 0.0/1000 0.0/1000 0.5/1000 0.3/1000 0.0/1000 0.0/1000<br />
67 5 10 82 67 5 10 82 67 5 10 82 0 0 0 0<br />
1.2/1000 0.9/1000 0.7/1000 1.0/1000 1.2/1000 0.9/1000 0.7/1000 1.0/1000 1.6/1000 0.9/1000 0.3/1000 1.0/1000 0.5/1000 0.0/1000 -0.4/1000<br />
195 5 10 210 169 5 10 184 169 5 10 184 0 0 0 0<br />
3.4/1000 0.9/1000 0.7/1000 2.7/1000 2.9/1000 0.9/1000 0.7/1000 2.3/1000 4.1/1000 0.9/1000 0.3/1000 2.3/1000 0.7/1000 0.0/1000 -0.4/1000<br />
Before Value per sf per Space Type After Value per sf Space Type Difference<br />
$4,611,949 $386,209 $441,842 $5,440,000 $3,275,157 $386,209 $938,787 $4,600,153 $1,336,792 $0 ($496,945) $839,847<br />
$79.24/sf $66.51/sf $29.46/sf $68.85/sf $79.24/sf $66.51/sf $29.46/sf $58.22/sf $79.24/sf $66.51/sf $29.46/sf $58.22/sf<br />
Scenario B - Maintenance of Overall Parking Ratio for Retail<br />
Before Allocation per space type After Allocation per space type Re-allocation of spaces Gain and (Loss) in sf<br />
Retail Office Storage Total Retail Office Storage Total Retail Office Storage Total Retail Office Storage Total<br />
58,204 sf 5,807 sf 15,000 sf 79,011 sf 58,204 sf 5,807 sf 15,000 sf 79,011 sf 49,600 sf 5,807 sf 23,604 sf 79,011 sf -8,604 sf 0 sf 8,604 sf 0 sf<br />
88 0 0 88 62 0 0 62 62 0 0 62 -26 0 0 -26<br />
1.5/1000 0.0/1000 0.0/1000 1.1/1000 1.1/1000 0.0/1000 0.0/1000 0.8/1000 1.3/1000 1.2/1000 0.0/1000 0.8/1000 0.2/1000 1.2/1000 0.0/1000<br />
40 0 0 40 40 0 0 40 40 0 0 40 0 0 0 0<br />
0.7/1000 0.0/1000 0.0/1000 0.5/1000 0.7/1000 0.0/1000 0.0/1000 0.5/1000 0.8/1000 0.0/1000 0.0/1000 0.5/1000 0.1/1000 0.0/1000 0.0/1000<br />
67 5 10 82 67 5 10 82 67 5 10 82 0 0 0 0<br />
1.2/1000 0.9/1000 0.7/1000 1.0/1000 1.2/1000 0.9/1000 0.7/1000 1.0/1000 1.4/1000 0.9/1000 0.4/1000 1.0/1000 0.2/1000 0.0/1000 -0.2/1000<br />
195 5 10 210 169 5 10 184 169 5 10 184 0 0 0 0<br />
3.4/1000 0.9/1000 0.7/1000 2.7/1000 2.9/1000 0.9/1000 0.7/1000 2.3/1000 3.4/1000 0.9/1000 0.4/1000 2.3/1000 0.1/1000 0.0/1000 -0.2/1000<br />
Before Value per sf per Space Type After Value per sf Space Type Difference<br />
$4,611,949 $386,209 $441,842 $5,440,000 $3,930,188 $386,209 $695,283 $5,011,680 $681,761 $0 ($253,441) $428,320<br />
$79.24/sf $66.51/sf $29.46/sf $68.85/sf $79.24/sf $66.51/sf $29.46/sf $63.43/sf $79.24/sf $66.51/sf $29.46/sf $63.43/sf<br />
<strong>Law</strong> <strong>Seminars</strong> <strong>International</strong> | Government Takings | 12/14/07 in Seattle, WA
Anthony Gibbons of Re-Solve Speaker #: 6b-12<br />
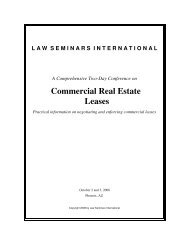
Fast Food Study<br />
" Major fast food company<br />
" Chose locations that were similar<br />
" Product type essentially identical<br />
" Differences in performance therefore can<br />
potentially be attributed to differences in parking<br />
supply<br />
" Sales performance can directly be tied to property<br />
value (i.e. we are not measuring business losses).<br />
0.0%<br />
-1.0%<br />
-2.0%<br />
-3.0%<br />
-4.0%<br />
-5.0%<br />
-6.0%<br />
Parking v. # of transactions (4yr avg)<br />
y = 0.0263x - 0.066<br />
0.50 1.00 1.50 2.00 2.50<br />
Parking/100sf<br />
<strong>Law</strong> <strong>Seminars</strong> <strong>International</strong> | Government Takings | 12/14/07 in Seattle, WA
Anthony Gibbons of Re-Solve Speaker #: 6b-13<br />
$1,000<br />
$800<br />
$600<br />
$400<br />
$200<br />
$-<br />
Parking v. Sales (4 yr average)<br />
y = 223.25x + 154.25<br />
00.50 50 11.00 00 11.50 50 22.00 00 22.50 50<br />
Parking/100sf<br />
Parking Impact - Street and Lot Parking Only - Food Tenants only<br />
Area Before After Difference<br />
West Lot 88 62 26<br />
Street 40 40 0<br />
Total 128 102 26<br />
RRetail il sff 58 58,204sf 204 f 58 58,204sf 204 f 00sf f<br />
Total Overall Retail Ratio 2.20 1.75<br />
Predicted Decline in Rent - food court -15.5% 15.5%<br />
Rent $32.68/sf $27.63/sf $5.05/sf<br />
sf 5,938sf 5,938sf 5,938sf<br />
$194,064 $164,065 $29,999<br />
Vacancy 7.5% -$14,555 $14,555 -$12,305 $12,305<br />
Extra Expense Cost 5.0% -$8,975 -$7,588<br />
NOI Loss $170,534 $144,172<br />
Predicted Decline in growth 1.17% 1.17%<br />
Predicted Rise in Cap Rate 7.0% 8.17% 1.17%<br />
Total Food Court Value $2,436,196 $1,763,610 $672,586<br />
<strong>Law</strong> <strong>Seminars</strong> <strong>International</strong> | Government Takings | 12/14/07 in Seattle, WA
Anthony Gibbons of Re-Solve Speaker #: 6b-14<br />
Additional Value Loss for remaining Retail NOI - cap rate change only<br />
Balance of Retail Component 52,266sf 52,266sf<br />
Balance of Retail NOI $135,944 $135,944<br />
Cap Rate Change 7.0% 8.17% 1.17%<br />
NOI per sf $2.60/sf $2.60/sf<br />
Retail Value Balance $1,942,052 $1,662,953 $279,099<br />
Total Value Loss $951,685<br />
Retail Sales Analysis by shopping days<br />
" This is an attempt to measure lost dollars through<br />
iinsufficient ffi i t parking ki supply l<br />
" Requires assumptions to be made regarding<br />
standard shopping patterns and behaviors<br />
" Significant components include:<br />
# Shopping pp g days y pper yyear when pparking g is maximized<br />
# Lost sales opportunity per transaction lost<br />
# Translation of lost sales into lost value<br />
<strong>Law</strong> <strong>Seminars</strong> <strong>International</strong> | Government Takings | 12/14/07 in Seattle, WA
Anthony Gibbons of Re-Solve Speaker #: 6b-15<br />
Retail Sales Analysis<br />
Property Statistics<br />
Shopping Center<br />
A: Before B: After Take Difference<br />
100% Shopping Days Per Year 16% 60 days 16% 60 days 16% 60 days<br />
Other Days Per Year 84% 305 days 84% 305 days 84% 305 days<br />
Total 100% 365 days 100% 365 days 100% 365 days<br />
West Lot Parking 88 stalls 62 stalls 26 stalls<br />
Street Parking 40 stalls 40 stalls<br />
Garage Parking 82 stalls 82 stalls 0 stalls<br />
Total Parking 210 stalls 184 stalls 26 stalls<br />
Garage Street West lot Total West lot Total West lot Total<br />
Shopping Day Turnover 2.0 3.0 3.0 2.6 3.0 2.6 3.0 3.0<br />
Cars Per Shopping Day 164 120 264 548 186 470 78 78<br />
Persons Per Car 3.0 3.0 3.0<br />
Visitors Per Day 1,644 1,410 234<br />
Shopping Day Sales Per Visitor $25 $25 $25<br />
Shopping pp g Day y Sales Per Day y $41,100 , $35,250 , $5,850 ,<br />
Shopping Day Sales Per Year $2,466,000 $2,115,000 $351,000<br />
Annual Rent as a % of Sales 12% 12% 12%<br />
Annual NNN Rent (% of total retail) 38% $295,920 35% $253,800 5% $42,120<br />
Vacancy Allowance 7.5% -$22,194 -$19,035 -$3,159<br />
Marginal Expense Increase 5.0% -$13,686 -$11,738 -$1,948<br />
NOI Loss $260,040 $223,027 $37,013<br />
Capitalization Rate 7.0% 7.5% 5.0%<br />
Indicated Value $3,714,853 $2,973,690 $741,163<br />
Recap of Approaches<br />
Method 1: Parking Ratio Analysis<br />
Range Take(1) Damage Damage/stall Total Rounded<br />
Low $310,000 $118,320 $4,551 $428,320 $430,000<br />
High $310,000 $529,847 $20,379 $839,847 $840,000<br />
Method 2: Parking Occupancy and Sales Analysis<br />
Range Take(1) Damage Damage/stall Total Total JC<br />
Overall $310,000 $431,163 $16,583 $741,163 $740,000<br />
Method 3: Food & Beverage Analysis<br />
Range Take(1) Damage Damage/stall Total Total JC<br />
Low $310,000 $362,586 $13,946 $672,586 $670,000<br />
High $310,000 $641,685 $24,680 $951,685 $950,000<br />
Method 4: Comparison<br />
a). 2003 Sale of parking rights, Seattle $14,834 /stall $700,000<br />
b). Confidential Negotiation 2003, Seattle Land cost<br />
Low additional $13,684 /stall $670,000<br />
High $20,000 /stall $830,000<br />
<strong>Law</strong> <strong>Seminars</strong> <strong>International</strong> | Government Takings | 12/14/07 in Seattle, WA
Anthony Gibbons of Re-Solve Speaker #: 6b-16<br />
<strong>Summary</strong><br />
" For the loss of parking to represent a “damage”, its value has to exceed<br />
the value of the land and asphalt upon which it is located.<br />
" Lost parking can reduce the utility of a property to the point where a<br />
change in user may be necessary – this will create transitional costs.<br />
" The easiest way to measure the loss is to consider the required industry<br />
standard for the supply & demand of the type of space presently in the<br />
property – or most suitable for the property.<br />
" More sophisticated techniques provide for a more site specific analysis,<br />
and should be done when conditions permit.<br />
A t h ki ith th lt th t th l f<br />
" A property may have excess parking, with the result that the loss of<br />
land may not result in damages to the improvements.<br />
<strong>Law</strong> <strong>Seminars</strong> <strong>International</strong> | Government Takings | 12/14/07 in Seattle, WA