Water Quality in Slovenia - Agencija RS za okolje
Water Quality in Slovenia - Agencija RS za okolje
Water Quality in Slovenia - Agencija RS za okolje

You also want an ePaper? Increase the reach of your titles
YUMPU automatically turns print PDFs into web optimized ePapers that Google loves.
S U R F A C E W A T E R S<br />
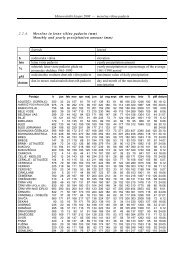
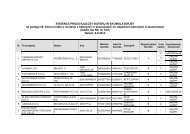
Table 12: Parameters not compliant with mandatory values <strong>in</strong> cypr<strong>in</strong>id and salmonid water <strong>in</strong> the years 2003 to 2006<br />
SALMONID WATE<strong>RS</strong> YEAR<br />
Oxygen Oxygen Ammonia Ammonium<br />
% < 6 mg/L % < 9 mg/L 0% > 0.025 mg/L % > 1mg/L<br />
SAVINJA MALE BRASLOVČE 2003 0 0 25 0<br />
LJUBLJANICA LIVADA 2005 0 67 17 17<br />
SAVINJA MALE BRASLOVČE 2005 0 33 0 17<br />
KRKA SREBRNIČE 2005 0 67 0 0<br />
VIPAVA VELIKE ŽABLJE 2005 0 58 0 0<br />
CRITERIA FOR SALMONID WATE<strong>RS</strong><br />
CYPRINID WATE<strong>RS</strong> YEAR<br />
MV MV MV MV<br />
0% < 6 mg/L 50% < 9 mg/L 0% > 0.025 mg/L 0% > 1mg/L<br />
Oxygen Oxygen Ammonia Ammonium<br />
% < 4mg/L % < 7 mg/L % > 0.025 mg/L % > 1 mg/L<br />
DRAVA BORL 2003 0 0 25 0<br />
DRAGONJA PODKAŠTEL 2004 0 8 8 0<br />
DRAVA BORL 2005 0 8 0 8<br />
DRAGONJA PODKAŠTEL 2006 8 8 0 0<br />
CRITERIA FOR CYPRINID WATE<strong>RS</strong><br />
MV MV MV MV<br />
0% < 4 mg/L 50% < 7 mg/L 0% > 0.025 mg/L 0% > 1 mg/L<br />
Not compliant with the criteria Compliant with the criteria<br />
Mandatory value for salmonid waters Mandatory value for cypr<strong>in</strong>id waters<br />
More frequently than mandatory values, guide values for parameters are exceeded. These values<br />
do not classify the salmonid and cypr<strong>in</strong>id waters <strong>in</strong>to the category of not compliant. However, they<br />
show, which parameters are for fish the most problematic <strong>in</strong> <strong>Slovenia</strong>n rivers. One of the first such<br />
parameter is the concentration of nitrite, followed by the concentration of total ammonium and nonionized<br />
ammonia (Charts 8 and 9). Increased concentrations of these parameters are <strong>in</strong> most cases<br />
caused by discharges of untreated municipal wastewater, discharges from municipal water treatment<br />
plants and from animal farms.<br />
Chart 9: The share of exceeded guide values <strong>in</strong> cypr<strong>in</strong>id waters <strong>in</strong> 2006<br />
������������������������<br />
�������������������<br />
�����������������������<br />
������������������<br />
Chart 10: The share of exceeded guide values <strong>in</strong> salmonid waters <strong>in</strong> 2006<br />
�������������������������<br />
�������������������<br />
�����������������������<br />
������������������<br />
�����������������������<br />
�������������� �<br />
����������������������<br />
������������������<br />
������������������������<br />
������������������<br />
47