Water Quality in Slovenia - Agencija RS za okolje
Water Quality in Slovenia - Agencija RS za okolje
Water Quality in Slovenia - Agencija RS za okolje

You also want an ePaper? Increase the reach of your titles
YUMPU automatically turns print PDFs into web optimized ePapers that Google loves.
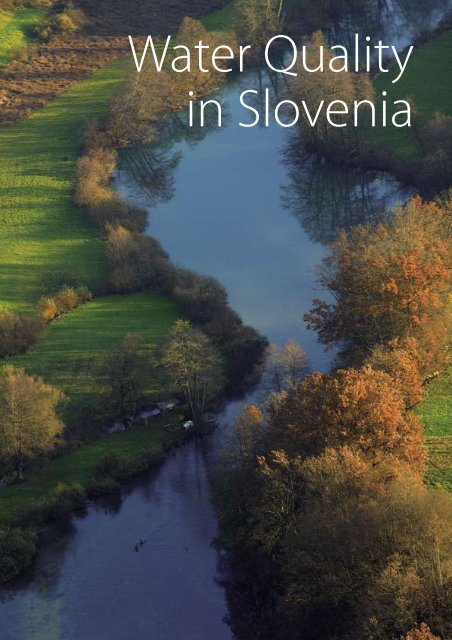
<strong>Water</strong> <strong>Quality</strong><br />
<strong>in</strong> <strong>Slovenia</strong>
<strong>Water</strong> <strong>Quality</strong> <strong>in</strong> <strong>Slovenia</strong>
ENVIRONMENTAL AGENCY OF THE REPUBLIC OF SLOVENIA<br />
Published by :<br />
Environmental Agency of the Republic of <strong>Slovenia</strong>, Vojkova 1b, Ljubljana<br />
Website: www.arso.gov.si<br />
E-mail: gp.arso@gov.si<br />
Editor:<br />
Mojca Dobnikar Tehovnik, M.Sc.<br />
Authors of tex ts:<br />
Špela Ambrožič, Prof. of Chem. and Biol.<br />
Irena Cvitanič, M.Sc.<br />
Mojca Dobnikar Tehovnik, M.Sc.<br />
Mar<strong>in</strong>a Gac<strong>in</strong>, B.Sc.<br />
Jasna Grbović, Ph.D.<br />
Brigita Jesenovec, B.Sc.<br />
Špela Ko<strong>za</strong>k Legiša, M.Sc.<br />
Marjeta Krajnc, M.Sc.<br />
Polonca Mihorko, M.Sc.<br />
Mateja Poje, M.Sc.<br />
Špela Remec Rekar, M.Sc.<br />
Bernarda Rotar, B.Sc.<br />
Edita Sodja, B.Sc.<br />
Front cover photo:<br />
Krka, Matevž Lenarčič<br />
Photo by :<br />
Bernarda Rotar, Špela Ambrožič, Irena Cvitanič,<br />
Mojca Dobnikar Tehovnik, Mar<strong>in</strong>a Gac<strong>in</strong>, Jasna Grbović,<br />
Brigita Jesenovec, Albert Kolar, Špela Ko<strong>za</strong>k Legiša,<br />
Matevž Lenarčič, Marjeta Krajnc, Polonca Mihorko, Mateja Poje,<br />
Špela Remec Rekar, Edita Sodja, Niko Trišić<br />
Car tography :<br />
Petra Krsnik, B.Sc.<br />
Produc tion:<br />
Argos<br />
Design:<br />
Ivana Kadivec<br />
Translated by :<br />
Asterix d.o.o.<br />
Pr<strong>in</strong>ted by :<br />
Bograf<br />
Ljubljana, March 2008<br />
CIP - Catalogu<strong>in</strong>g-In-Publication<br />
National and University Library, Ljubljana<br />
502.51(497.4)<br />
WATER <strong>Quality</strong> <strong>in</strong> <strong>Slovenia</strong>/[Authors of texts Špela Ambrožič...<br />
[et al.] ; editor Mojca Dobnikar Tehovnik ; photo by Bernarda Rotar<br />
... [et al.] ; cartography Petra Krsnik]. - Ljubljana :<br />
Environmental Agency of the Republic of <strong>Slovenia</strong>, 2008<br />
ISBN 978-961-6024-42-6<br />
1. Ambrožič, Špela 2. Dobnikar-Tehovnik, Mojca<br />
238484480
<strong>Water</strong> <strong>Quality</strong><br />
<strong>in</strong> <strong>Slovenia</strong>
Preface<br />
In recent years, people often ask about water quality. In most cases, they th<strong>in</strong>k of the taste, scent<br />
and look of water we dr<strong>in</strong>k every day. But the answer to the question “What is the quality of water?”<br />
is much more complex, s<strong>in</strong>ce water quality is not just the quality of dr<strong>in</strong>k<strong>in</strong>g water, and, moreover,<br />
water quality cannot be described merely by the words ‘good’ or ‘bad’.<br />
<strong>Water</strong> quality is a term used to describe the physical, chemical and biological characteristics of water,<br />
usually <strong>in</strong> respect to its suitability for a particular purpose. Different water characteristics are essential<br />
for different purposes. Industrial water, for example, must not be corrosive and must not conta<strong>in</strong><br />
substances that result <strong>in</strong> the formation of residue on the appliance surface. Dr<strong>in</strong>k<strong>in</strong>g water must not<br />
conta<strong>in</strong> any toxic substances and ha<strong>za</strong>rdous microorganisms. Furthermore, bath<strong>in</strong>g water must not<br />
conta<strong>in</strong> microorganisms either, s<strong>in</strong>ce they can cause numerous diseases. With the objective of water<br />
protection, various regulations prescrib<strong>in</strong>g the limit values of concentrations of various substances <strong>in</strong><br />
water have been issued <strong>in</strong> the last thirty years <strong>in</strong> Europe, as well at a national level.<br />
With the <strong>in</strong>tent of susta<strong>in</strong>able use, prevention of deterioration, protection and the improvement<br />
of the exist<strong>in</strong>g water status, reduction of ha<strong>za</strong>rdous substance pollution and provision of sufficient<br />
quality surface and groundwater supplies, <strong>in</strong> 2000 the European Union adopted the <strong>Water</strong> Framework<br />
Directive, which gives the Member States a legal and professional basis for an <strong>in</strong>tegrated approach to<br />
water protection and management. The ma<strong>in</strong> objective of the <strong>Water</strong> Framework Directive is to achieve<br />
a good chemical and ecological status of all waters by 2015. The <strong>Water</strong> Framework Directive does not<br />
prescribe limit values for <strong>in</strong>dividual water parameters; it provides a new approach to an <strong>in</strong>tegrated<br />
evaluation of both the chemical and ecological status of water. The new approach is based on the<br />
conditions of the aquatic environment where the impact of human activity is either not present or<br />
is <strong>in</strong>significant. This means that, accord<strong>in</strong>g to the requirements of the <strong>Water</strong> Framework Directive,<br />
water quality is evaluated comprehensively and the natural status is def<strong>in</strong>ed as a state without<br />
ha<strong>za</strong>rdous substances or other major loads, a state that supports the life of all aquatic organisms as it<br />
would be <strong>in</strong> the case of <strong>in</strong>significant human impact. At the same time, it provides a comparability of<br />
methodologies and standards and thus, for the first time, comparability of the assessments of water<br />
quality status among <strong>in</strong>dividual Member States.<br />
For the evaluation of water quality, the <strong>Water</strong> Framework Directive <strong>in</strong> Article 8 requests the<br />
<strong>in</strong>troduction of surface and groundwater monitor<strong>in</strong>g programmes. Monitor<strong>in</strong>g and water quality<br />
status evaluation is one of the key tasks of the Environmental Agency of the Republic of <strong>Slovenia</strong>. The<br />
monitor<strong>in</strong>g of water quality <strong>in</strong> <strong>Slovenia</strong> has a long tradition, but <strong>in</strong> 2007, it was carried out accord<strong>in</strong>g<br />
to the requirements of the <strong>Water</strong> Framework Directive for the first time. The first assessments of the<br />
chemical and ecological status <strong>in</strong> accordance with the requirements of the <strong>Water</strong> Framework Directive<br />
will, for the purpose of river bas<strong>in</strong> management plans, be carried out by 2009.<br />
The present publication is a brief overview of the water quality status <strong>in</strong> <strong>Slovenia</strong> and a trend evaluation<br />
<strong>in</strong> relation to the situation <strong>in</strong> previous years. The assessments have been made <strong>in</strong> accordance with the<br />
currently applicable regulations that have already been partially adapted to the requirements of the<br />
<strong>Water</strong> Framework Directive. With this publication, we wish to contribute to the understand<strong>in</strong>g of the<br />
water quality issue and to the conservation of our precious water resources for future generations.<br />
Silvo Žlebir, Ph.D.<br />
Director General of the Environmental Agency of the Republic of <strong>Slovenia</strong><br />
5
6<br />
Lake Boh<strong>in</strong>j, Ribčev Laz
Contents<br />
PREFACE ............................................................................................................... 5<br />
1. INTRODUCTION .................................................................................................... 9<br />
2. SURFACE WATE<strong>RS</strong> ................................................................................................ 13<br />
2.1 <strong>Quality</strong> of Rivers ............................................................................................ 13<br />
2.1.1 Evaluation of Chemical Status of Rivers .................................................. 13<br />
2.1.2 River <strong>Quality</strong> Assessment Us<strong>in</strong>g Saprobic Index and Beg<strong>in</strong>n<strong>in</strong>gs<br />
of Ecological Status Evaluation .............................................................. 22<br />
2.2 <strong>Quality</strong> of Lakes ............................................................................................ 26<br />
2.3 <strong>Quality</strong> of Mar<strong>in</strong>e <strong>Water</strong> ............................................................................... 34<br />
2.3.1 Evaluation of Chemical Status of Mar<strong>in</strong>e <strong>Water</strong> ...................................... 36<br />
2.3.2 Evaluation of Trophic Status of Mar<strong>in</strong>e <strong>Water</strong> ......................................... 36<br />
2.4 <strong>Water</strong> <strong>Quality</strong> <strong>in</strong> Protected Areas .................................................................. 37<br />
2.4.1 <strong>Quality</strong> of Surface <strong>Water</strong> Intended for Human Consumption .................. 37<br />
2.4.2 <strong>Quality</strong> of Bath<strong>in</strong>g <strong>Water</strong> ....................................................................... 40<br />
2.4.3 <strong>Quality</strong> of Freshwater need<strong>in</strong>g Protection or Improvement <strong>in</strong> order<br />
to support Fish Life ................................................................................ 44<br />
2.4.4. <strong>Quality</strong> of Shellfish <strong>Water</strong> ..................................................................... 49<br />
3. GROUNDWATER .................................................................................................. 53<br />
3.1 Aquifers and Groundwater Bodies ............................................................... 53<br />
3.2 Groundwater <strong>Quality</strong> ................................................................................... 62<br />
3.3 Trend Evaluation .......................................................................................... 65<br />
4. GUIDELINES FOR FUTURE WORK - WATER QUALITY EVALUATION<br />
IN ACCORDANCE WITH THE WATER FRAMEWORK DIRECTIVE ............................. 65<br />
5. REFERENCES ....................................................................................................... 67<br />
6. GLOSSARY OF TERMS .......................................................................................... 70<br />
7
1<br />
Introduction<br />
<strong>Slovenia</strong> is one of the smallest countries <strong>in</strong> Europe, but with regard to water resources, it is one of<br />
the richest European countries. The average annual precipitation that supplies surface waters and<br />
groundwater amounts approximately 1500 mm. The greatest annual amount of precipitation is<br />
received by the mounta<strong>in</strong>ous western region, and the smallest amount occurs <strong>in</strong> the eastern part of<br />
<strong>Slovenia</strong>. Runn<strong>in</strong>g waters <strong>in</strong> <strong>Slovenia</strong> form a dense river network. Due to a highly varied relief and rock<br />
structure, the rivers are mostly short, with only 22% of rivers be<strong>in</strong>g longer than 25 km. Additionally,<br />
geological strata that transmit and store groundwater conta<strong>in</strong> large quantities of dynamic supplies,<br />
which represent the ma<strong>in</strong> source of dr<strong>in</strong>k<strong>in</strong>g water <strong>in</strong> <strong>Slovenia</strong>.<br />
Pure water has neither scent nor taste. A water molecule conta<strong>in</strong>s only two elements, hydrogen and<br />
oxygen. But <strong>in</strong> the natural environment, nowhere can water be found <strong>in</strong> its pure form; it conta<strong>in</strong>s<br />
various substances like dissolved gases, both <strong>in</strong>organic and organic substances, and microorganisms,<br />
which can be of natural orig<strong>in</strong> or as a result of human activity. The composition of water changes<br />
dur<strong>in</strong>g its circulation <strong>in</strong> nature.<br />
In the modern world, we hear way too often that water is over-polluted. Dr<strong>in</strong>k<strong>in</strong>g water conta<strong>in</strong>s<br />
toxic substances and undesirable microorganisms, which can cause various diseases. Animals and<br />
plants <strong>in</strong> rivers are endangered by chemical pollutants. The agricultural activity uses large quantities<br />
of fertilizers, pesticides and herbicides that are washed <strong>in</strong>to groundwater, and ha<strong>za</strong>rdous chemicals<br />
are washed from roads and urban areas as well. The rapid growth of population, urbanisation and<br />
development are endanger<strong>in</strong>g water quality. Unfortunately, the existence of man is also endangered<br />
by these processes.<br />
But nature has its own defensive mechanism - water <strong>in</strong> nature has a self-purification capacity.<br />
Energy from sunlight drives the process of photosynthesis <strong>in</strong> aquatic plants, which produce oxygen<br />
as one of the end-products; oxygen is necessary for the decomposition of organic substances<br />
<strong>in</strong> water. The decomposition results <strong>in</strong> the formation of carbon dioxide, nutrients (nitrogen and<br />
phosphorus compounds) and other substances necessary for the development of aquatic plants<br />
and animals. The purification cycle cont<strong>in</strong>ues when these plants and animals die and the bacteria<br />
decompose them, provid<strong>in</strong>g new generations of organisms with nourishment. Unfortunately there<br />
are many toxic substances which are decomposed only slowly, or not at all. They present a great<br />
environmental concern.<br />
And what is the water quality like <strong>in</strong> <strong>Slovenia</strong>? In comparison with developed countries, water quality<br />
<strong>in</strong> <strong>Slovenia</strong> is among the highest <strong>in</strong> Europe. One of the reasons is undoubtedly that most of the<br />
rivers rise on the territory of <strong>Slovenia</strong>. But this does not mean that <strong>Slovenia</strong> has no problems with<br />
surface water and groundwater quality. Some river sections are still loaded with excessive amounts of<br />
<strong>in</strong>dustrial and municipal waste waters and are therefore substantially polluted or even over-polluted.<br />
Problems are also present <strong>in</strong> groundwater, which represents the ma<strong>in</strong> source of dr<strong>in</strong>k<strong>in</strong>g water <strong>in</strong><br />
<strong>Slovenia</strong>. Groundwater is polluted with nitrates and pesticides, and, on a local level, additionally with<br />
chlor<strong>in</strong>ated organic solvents. The highest level of pollution is registered <strong>in</strong> the north-eastern part of<br />
<strong>Slovenia</strong> and <strong>in</strong> the vic<strong>in</strong>ity of Celje.<br />
In 2000, with the <strong>in</strong>tention of effective water management, the European Union adopted the<br />
<strong>Water</strong> Framework Directive (1), which has already been entirely transposed <strong>in</strong>to the <strong>Slovenia</strong>n<br />
legislation. In 2003, two basic adm<strong>in</strong>istrative units were designated for the purpose of the <strong>Water</strong><br />
Framework Directive and river bas<strong>in</strong> management: the Danube river bas<strong>in</strong> district and the Adriatic<br />
river bas<strong>in</strong> district. Accord<strong>in</strong>g to ecological characteristics, the territory of <strong>Slovenia</strong> was classified<br />
<strong>in</strong>to four hydroecoregions, and additionally divided more precisely <strong>in</strong>to bioregions and types. The<br />
implementation of the <strong>Water</strong> Framework Directive was cont<strong>in</strong>ued by the analysis of data on the<br />
natural characteristic of water and on the impacts of human activity. These data represented the<br />
basis for the def<strong>in</strong>ition of surface and groundwater bodies def<strong>in</strong>ed <strong>in</strong> 2005. <strong>Water</strong> bodies are base<br />
units for the assessment of water status accord<strong>in</strong>g to environmental objectives. In the case of surface<br />
water streams, for example, the water body is a cont<strong>in</strong>uous section of the river, measur<strong>in</strong>g from a few<br />
9
10<br />
W A T E R Q U A L I T Y I N S L O V E N I A<br />
to tens of kilometres, with similar natural characteristics as well as similar impacts of human activity<br />
(agriculture, <strong>in</strong>dustry, urbanisation). The groundwater body is a dist<strong>in</strong>ctive volume of groundwater <strong>in</strong><br />
one or more aquifers. In surface waters, 155 water bodies were determ<strong>in</strong>ed <strong>in</strong> <strong>Slovenia</strong>, and 21 water<br />
bodies <strong>in</strong> groundwater. In 2007, monitor<strong>in</strong>g was established <strong>in</strong> all the above mentioned water bodies,<br />
as required by the <strong>Water</strong> Framework Directive. A new monitor<strong>in</strong>g approach, <strong>in</strong>troduced by the <strong>Water</strong><br />
Framework Directive, should above all be emphasised. Programmes are based on the analyses of<br />
pressures. These are data on the emission of substances <strong>in</strong>to waters from po<strong>in</strong>t sources, data on land<br />
use, surpluses of nitrogen, the use of phytopharmaceutical products etc. Accord<strong>in</strong>g to the analysis of<br />
these data, the monitor<strong>in</strong>g programme is problem oriented and <strong>in</strong>volves predom<strong>in</strong>antly problematic<br />
water bodies. Other water bodies are less frequently <strong>in</strong>volved <strong>in</strong> the programme. An essential novelty<br />
of the monitor<strong>in</strong>g is evaluation of the ecological status. The assessment of the ecological status is<br />
based on biological quality elements (phytoplankton, phytobenthos and macrophytes, fish and<br />
benthic <strong>in</strong>vertebrate fauna) and on hydromorphological, chemical and physico-chemical elements<br />
support<strong>in</strong>g the biological elements. The ecological status is divided <strong>in</strong>to five quality classes. The<br />
start<strong>in</strong>g po<strong>in</strong>t of the assessment of the ecological status is measur<strong>in</strong>g the alteration of the ecosystem’s<br />
structure and function<strong>in</strong>g of the natural state, i.e. the state where there is no human activity impact<br />
or it is <strong>in</strong>significant.<br />
Piran
Lake Bled<br />
I N T R O D U C T I O N<br />
Accord<strong>in</strong>g to the Environment Protection Act (2), the Environmental Agency of the Republic of<br />
<strong>Slovenia</strong> is responsible for the water quality monitor<strong>in</strong>g and evaluation of water quality status <strong>in</strong><br />
<strong>Slovenia</strong>. Monitor<strong>in</strong>g programmes (3) are drawn up <strong>in</strong> accordance with regulations that summarise the<br />
provisions of European directives, and <strong>in</strong> accordance with the status assessment and pressure analysis<br />
of each <strong>in</strong>dividual water body. They <strong>in</strong>clude quality monitor<strong>in</strong>g of rivers, lakes, sea, groundwater, and<br />
water <strong>in</strong> protected areas.<br />
The publication presents a brief overview of the water quality assessment <strong>in</strong> <strong>Slovenia</strong>, based on the<br />
national monitor<strong>in</strong>g results. The assessments of water quality have been made <strong>in</strong> accordance with<br />
the currently applicable regulations that have already been partially adapted to the requirements<br />
of the <strong>Water</strong> Framework Directive. On surface waters, the assessment of the chemical status has<br />
been made; the methodology for the evaluation of the ecological status for all surface waters is still<br />
<strong>in</strong> the course of preparation. Methods for the evaluation of status on the basis of some biological<br />
quality elements and for certa<strong>in</strong> pressures have already been elaborated. It should be emphasised<br />
that the situation is similar <strong>in</strong> other European countries where methodologies for the evaluation of<br />
ecological status are still be<strong>in</strong>g developed as well. Parallel to the development of methodologies,<br />
Member States are conduct<strong>in</strong>g a process of <strong>in</strong>tercalibration to ensure a comparable evaluation of<br />
ecological status. For groundwater, the publication provides the evaluation of chemical status for 14<br />
water bodies. The evaluations of the rema<strong>in</strong><strong>in</strong>g seven water bodies will be based on data from 2007<br />
when the monitor<strong>in</strong>g network was expanded to <strong>in</strong>clude those water bodies for which monitor<strong>in</strong>g<br />
had not yet been established.<br />
The full range of data and evaluations of the quality of rivers, lakes, sea and groundwater, as well as<br />
water <strong>in</strong> protected areas, is published <strong>in</strong> annual reports available <strong>in</strong> the library and on the website of<br />
the Environmental Agency of the Republic of <strong>Slovenia</strong> (4).<br />
11
2 Surface <strong>Water</strong>s<br />
2.1<br />
2.1.1<br />
<strong>Quality</strong> of Rivers<br />
The monitor<strong>in</strong>g of river water quality (5, 6) is carried out on the basis of laws and regulations (2, 7,<br />
8) <strong>in</strong> accordance with the requirements of the <strong>Water</strong> Framework Directive (1) and other guidel<strong>in</strong>es<br />
and professional <strong>in</strong>structions for the establishment and implementation of the monitor<strong>in</strong>g (9, 10,<br />
11, 12, 13, 14). In rivers, a total of 135 water bodies were determ<strong>in</strong>ed <strong>in</strong> 2005, 110 of them <strong>in</strong> the<br />
Danube river bas<strong>in</strong> district and 25 <strong>in</strong> the Adriatic river bas<strong>in</strong> district (15). In some of these water<br />
bodies, monitor<strong>in</strong>g had already been carried out <strong>in</strong> the past, and <strong>in</strong> the others, the monitor<strong>in</strong>g and<br />
status evaluation for the purpose of the first river bas<strong>in</strong> management plan will be carried out for the<br />
first time <strong>in</strong> the period 2007-2009. The chemical and ecological status will have to be evaluated <strong>in</strong><br />
accordance with the <strong>Water</strong> Framework Directive.<br />
In <strong>Slovenia</strong>, the chemical status of rivers has been evaluated <strong>in</strong> accordance with the Regulation on<br />
the chemical status of surface waters (7) s<strong>in</strong>ce 2002. The Regulation determ<strong>in</strong>es the limit values<br />
of parameters and criteria for the assessment of the chemical status. In the future, this regulation<br />
will have to be changed as a directive (16), which will <strong>in</strong> the course of preparation, determ<strong>in</strong>e<br />
environmental quality standards for the substances that have, at a European level, been classified as<br />
ha<strong>za</strong>rdous (priority list of ha<strong>za</strong>rdous substances).<br />
In past years the assessment of river water quality was based on biological analyses of phytobenthos<br />
and benthic <strong>in</strong>vertebrate fauna, and carried out accord<strong>in</strong>g to the saprobic system which, above<br />
all, <strong>in</strong>dicates the <strong>in</strong>fluences of organic pollution <strong>in</strong> waters. For the period from 1996 to 2005, the<br />
status of <strong>Slovenia</strong>n rivers <strong>in</strong> relation to biological analyses is presented accord<strong>in</strong>g to this system. The<br />
ecological status assessment methods are still under development. Sampl<strong>in</strong>g and analyses for some<br />
biological quality elements are carried out <strong>in</strong> compliance with ready-prepared expert groundwork<br />
(17, 18, 19, 20, 21, 22). For the year 2006, the first results of organic pollution evaluation on the basis<br />
of benthic <strong>in</strong>vertebrate fauna and phytobenthos have already been presented.<br />
All evaluations are stated for a monitor<strong>in</strong>g site and not for the water body, as required by the <strong>Water</strong><br />
Framework Directive, s<strong>in</strong>ce not all evaluations of the chemical status for all water bodies are available<br />
at the moment, and neither is the methodology for the evaluation of the ecological status for all<br />
biological elements and pressures.<br />
Evaluation of Chemical Status of Rivers<br />
The chemical status must be determ<strong>in</strong>ed:<br />
• for any river or its part where the catchment area reaches 2500 km2 ,<br />
• for any water body that is substantially polluted by one or more parameters from the priority or<br />
<strong>in</strong>dicative list of parameters,<br />
• for any water body <strong>in</strong>to which waste waters conta<strong>in</strong><strong>in</strong>g priority substances are discharged,<br />
• for water bodies crossed by the state border.<br />
Accord<strong>in</strong>g to the Regulation on the chemical status of surface waters (7), physico-chemical parameters<br />
must be measured at all monitor<strong>in</strong>g sites. In addition, priority substances are regularly measured<br />
at all basic monitor<strong>in</strong>g sites; and at all basic and additional monitor<strong>in</strong>g sites, those parameters are<br />
measured for which <strong>in</strong>creased pollution has been established on the basis of results obta<strong>in</strong>ed <strong>in</strong> the<br />
monitor<strong>in</strong>g of river water quality or on the basis of the data published <strong>in</strong> annual reports on emission<br />
monitor<strong>in</strong>g of sources of pollution.<br />
The chemical status of a surface water body is determ<strong>in</strong>ed on the basis of the calculation of the<br />
average annual value of parameters for which the limit values listed <strong>in</strong> Table 1 are def<strong>in</strong>ed <strong>in</strong> the<br />
Regulation (7).<br />
13
14<br />
W A T E R Q U A L I T Y I N S L O V E N I A<br />
A surface water body has a good chemical status if:<br />
• any annual average value of parameters at a monitor<strong>in</strong>g site does not exceed the prescribed limit<br />
value,<br />
• the time series of annual average values of any of the parameters whose concentration <strong>in</strong> the<br />
sediments has not had an upward trend <strong>in</strong> the last five-year period.<br />
Table 1: Limit values of parameters for the evaluation of the chemical status as listed <strong>in</strong> the Regulation on the chemical<br />
status of surface waters (7)<br />
GENERAL PHYSICO-CHEMICAL PARAMETE<strong>RS</strong><br />
PARAMETER UNIT<br />
water<br />
LIMIT VALUE<br />
sediment analysis<br />
Nitrate mg NO /L 3 25<br />
Sulphate mg SO /L 4 150<br />
PRIORITY LIST OF CHEMICAL STATUS PARAMETE<strong>RS</strong><br />
PARAMETER UNIT<br />
water<br />
LIMIT VALUE<br />
sediment analysis<br />
Cadmium µg Cd/L 1 yes<br />
1,2 dichloroethane µg/L 10<br />
Hexachlorobenzene µg/L 0.03 yes<br />
Hexachlorobutadiene µg/L 0.1 yes<br />
Hexachlorocyclohexane µg/L 0.05 yes<br />
Pentachlorophenol µg/L 1 yes<br />
Mercury µg Hg/L 1 yes<br />
Tetrachloroethene µg/L 10<br />
Trichlorobenzene µg/L 0.4 yes<br />
Trichloroethene µg/L 10<br />
Trichloromethane µg/L 12<br />
INDICATIVE LIST OF PARAMETE<strong>RS</strong><br />
PARAMETER UNIT<br />
water<br />
LIMIT VALUE<br />
sediment analysis<br />
Copper µg Cu/L 5<br />
Boron µg B/L 100<br />
Z<strong>in</strong>c µg Zn/L 100<br />
Chromium µg Cr/L 10<br />
Nickel µg Ni/L 10<br />
Lead µg Pb/L 10<br />
Dichloromethane µg/L 10<br />
Alachlor µg/L 0.1<br />
Metolachlor µg/L 0.1<br />
Atraz<strong>in</strong>e µg/L 0.1<br />
Simaz<strong>in</strong>e µg/L 0.1<br />
Total pesticides µg/L 0.5<br />
Anthracene µg/L 0.05<br />
Naphthalene µg/L 1<br />
PAH µg/L 0.1<br />
Fluoranthene µg/L 0.025<br />
Benzene µg/L 3.0<br />
PCB µg/L 0.01<br />
AOX µg Cl/L 20<br />
EOX mg Cl/kg - yes<br />
Phenol substances (phenol <strong>in</strong>dex) µg/L 10<br />
M<strong>in</strong>eral oils mg /L 0.05<br />
Anion active detergents mg MBAS/L 0.10<br />
PAH: Polycyclic aromatic hydrocarbons AOX: Adsorbable organic halogen compounds<br />
PCB: Polychlor<strong>in</strong>ated biphenyls EOX: Extractable organic halogen compounds
Ledava, Čentiba Mura, Mota<br />
S U R F A C E W A T E R S<br />
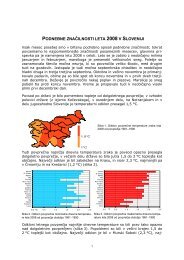
Based on the results of the monitor<strong>in</strong>g of river water quality <strong>in</strong> 2006, the chemical status of rivers was<br />
evaluated at 76 monitor<strong>in</strong>g sites. A good chemical status was determ<strong>in</strong>ed for 64 monitor<strong>in</strong>g sites,<br />
and a bad chemical status was determ<strong>in</strong>ed for 12 monitor<strong>in</strong>g sites. The chemical status of rivers at<br />
<strong>in</strong>dividual monitor<strong>in</strong>g sites <strong>in</strong> 2006 is shown <strong>in</strong> Map 1.<br />
A bad chemical status was determ<strong>in</strong>ed on account of exceed<strong>in</strong>g the limit values for adsorbable<br />
organic halogen compounds (AOX), metolachlor, atraz<strong>in</strong>e, total pesticides, anion active detergents,<br />
m<strong>in</strong>eral oils, boron and z<strong>in</strong>c. Monitor<strong>in</strong>g sites for which a bad chemical status was determ<strong>in</strong>ed <strong>in</strong><br />
2006 and the parameters exceed<strong>in</strong>g the limit values are shown <strong>in</strong> Table 2. No characteristic trend was<br />
determ<strong>in</strong>ed for concentrations of priority substances <strong>in</strong> sediments.<br />
Table 2: Monitor<strong>in</strong>g sites for which a bad chemical status was determ<strong>in</strong>ed <strong>in</strong> 2006, with an <strong>in</strong>dication of the parameters<br />
that exceeded limit values<br />
RIVER Monitor<strong>in</strong>g Site Parameter<br />
Annual Average<br />
Value<br />
Limit Value<br />
MURA<br />
Ceršak<br />
Mota<br />
AOX (μg Cl/L)<br />
AOX (μg Cl/L)<br />
24<br />
24<br />
20<br />
20<br />
LEDAVA Čentiba AOX (μg Cl/L) 24 20<br />
DRAVINJA Videm pri Ptuju Metolachlor (μg/L) 0.24 0.1<br />
PESNICA Zamušani<br />
Metolachlor (μg/L)<br />
Total pesticides (μg/L)<br />
0.43<br />
1<br />
0.1<br />
0.5<br />
SAVA Jesenice na Dolenjskem AOX (μg Cl/L) 57 20<br />
SOTLA Rogaška Slat<strong>in</strong>a Boron (μg/L) 177 100<br />
CERKNIŠČICA Cerknica (Dolenja vas) Detergents (mg MBAS/L) 0.13 0.10<br />
LOGAŠČICA Jačka AOX (μg Cl/L) 21 20<br />
VOGLAJNA Celje Z<strong>in</strong>k (μg Zn/L) 493 100<br />
KRKA Krška vas Atraz<strong>in</strong>e (μg/L) 0.11 0.1<br />
KOREN Nova Gorica<br />
Detergents (mg MBAS/L)<br />
M<strong>in</strong>eral oils (mg/L)<br />
3.05<br />
0.75<br />
0.10<br />
0.05<br />
AOX: Adsorbable organic halogen compounds<br />
Detergents (mg MBAS/L): Anion active detergents (mg MBAS/L)<br />
15
16<br />
W A T E R Q U A L I T Y I N S L O V E N I A<br />
Map 1: The chemical status of rivers <strong>in</strong> 2006
S U R F A C E W A T E R S<br />
Exceeded values of adsorbable organic halogen compounds (AOX) were measured <strong>in</strong> the water<br />
bodies <strong>in</strong>to which wastewaters with a large annual amount of AOX are discharged (23), or high<br />
concentrations are brought <strong>in</strong> by their tributaries (24). Despite the data on the reduction of AOX<br />
emissions <strong>in</strong>to waters <strong>in</strong> 2006 <strong>in</strong> relation to 2005 (24), an exceedance of the limit values was determ<strong>in</strong>ed<br />
<strong>in</strong> the Mura (Chart 1), the Ledava and the Logaščica.<br />
Chart 1: AOX concentrations <strong>in</strong> the Mura river <strong>in</strong> the years 2003 to 2006<br />
�������������<br />
��<br />
��<br />
��<br />
��<br />
��<br />
��<br />
��<br />
�<br />
����������<br />
�����������<br />
����������<br />
������������<br />
����������<br />
��������� �����������<br />
�����������<br />
�����������<br />
������������<br />
�����������<br />
�����������<br />
������������<br />
������������<br />
���������<br />
The water bodies with the highest amount of AOX content were determ<strong>in</strong>ed on the lower Sava, where<br />
the ma<strong>in</strong> source was the direct <strong>in</strong>dustrial outflow from the VIPAP Videm Krško factory. In the last four<br />
months of 2006, the measured AOX concentrations at the monitor<strong>in</strong>g site Jesenice na Dolenjskem were<br />
below the limit value of 20 μg/L, which was the result of the clos<strong>in</strong>g down of the pulp production<br />
plant <strong>in</strong> the mentioned factory <strong>in</strong> September 2006 (Chart 2). It is a case which clearly demonstrates the<br />
reduction of AOX concentration to a permissible level immediately after a cessation of direct discharges.<br />
It is also evident from the Chart that there are no excessive AOX loads <strong>in</strong> the upper and middle Sava.<br />
Chart 2: AOX concentrations <strong>in</strong> the Sava river <strong>in</strong> the years 2000 to 2007<br />
�������������<br />
���<br />
���<br />
���<br />
���<br />
���<br />
��<br />
��<br />
��<br />
��<br />
�<br />
�����������<br />
�����������<br />
����������<br />
�����������<br />
�����������<br />
�����������<br />
�����������<br />
����������<br />
�����������<br />
������������<br />
����������<br />
�����������<br />
�����������<br />
������������<br />
�����������<br />
�����������<br />
�����������<br />
������������<br />
���������� ������������� ���������������������������<br />
����������<br />
����������<br />
�����������<br />
�����������<br />
�����������<br />
�����������<br />
�����������<br />
�����������<br />
�����������<br />
����������<br />
�����������<br />
�����������<br />
�����������<br />
�����������<br />
�����������<br />
����������<br />
�����������<br />
������������<br />
������������<br />
������������<br />
�����������<br />
�����������<br />
������������<br />
�����������<br />
�����������<br />
17
18<br />
W A T E R Q U A L I T Y I N S L O V E N I A<br />
Sava, Medno Ljubljanica, Ljubljana<br />
In the Drav<strong>in</strong>ja and the Pesnica, a bad chemical status was determ<strong>in</strong>ed because of an exceed<strong>in</strong>g<br />
amount of metolachlor. Metolachlor is a herbicide used for weed control <strong>in</strong> agriculture, at the roadside<br />
and <strong>in</strong> ornamental plant grow<strong>in</strong>g. It is frequently used after the sow<strong>in</strong>g or germ<strong>in</strong>ation of corn. The<br />
share of agricultural areas <strong>in</strong> the h<strong>in</strong>terlands of the Drav<strong>in</strong>ja and the Pesnica is substantial (more<br />
than 50%), so it can be concluded that their bad chemical status is caused by the use of herbicides <strong>in</strong><br />
agricultural areas. There are also herbicide problems present <strong>in</strong> the Krka, where a bad chemical status<br />
was determ<strong>in</strong>ed on account of exceed<strong>in</strong>g amounts of atraz<strong>in</strong>e. Atraz<strong>in</strong>e is a triaz<strong>in</strong>e non-selective<br />
organic herbicide used <strong>in</strong> the past for the control of most broadleaf weeds and grasses <strong>in</strong> agriculture,<br />
afforestation and other non-agricultural activities. The presence of atraz<strong>in</strong>e <strong>in</strong> water shows an illegal<br />
use of the mentioned herbicide as there have not been any registered herbicides conta<strong>in</strong><strong>in</strong>g atraz<strong>in</strong>e<br />
<strong>in</strong> <strong>Slovenia</strong> s<strong>in</strong>ce 2003.<br />
The Koren is a short river flow<strong>in</strong>g to Italy and is therefore a border river. It is classified as one of the<br />
most polluted rivers <strong>in</strong>cluded <strong>in</strong> the national water quality monitor<strong>in</strong>g. It is heavily polluted by the<br />
municipal wastewaters of Nova Gorica. In the Koren, the measured values of chemical and biochemical<br />
oxygen demand, orthophosphates, ammonium and nitrites are the highest <strong>in</strong> <strong>Slovenia</strong>. In 2006, a<br />
bad chemical status was determ<strong>in</strong>ed on account of exceed<strong>in</strong>g the limit values for detergents and<br />
m<strong>in</strong>eral oils.<br />
The bad chemical status of the Voglajna <strong>in</strong> Celje was determ<strong>in</strong>ed on account of exceed<strong>in</strong>g amounts of<br />
z<strong>in</strong>c, although, accord<strong>in</strong>g to the data from 2006, the emissions of z<strong>in</strong>c have been reduced. An excessive<br />
z<strong>in</strong>c pollution is the result of the discharge of the <strong>in</strong>dustrial wastewaters from C<strong>in</strong>karna Celje.<br />
The chemical status of rivers was improv<strong>in</strong>g <strong>in</strong> the years 2002 to 2006. In 2002, 23.2% of monitor<strong>in</strong>g<br />
sites were classified to have a bad chemical status, and <strong>in</strong> 2006, 15.8% of monitor<strong>in</strong>g sites had bad<br />
chemical status (Chart 3).<br />
Chart 3: Percentage of monitor<strong>in</strong>g sites <strong>in</strong> good and bad chemical status <strong>in</strong> the years 2002 to 2006<br />
����<br />
����<br />
����<br />
����<br />
����<br />
���� ����<br />
����<br />
����<br />
����<br />
����<br />
��� ���� ���� ���� ���� �����<br />
����<br />
����<br />
����<br />
����<br />
��������������������<br />
�������������������
S U R F A C E W A T E R S<br />
In Table 3, the chemical status at <strong>in</strong>dividual monitor<strong>in</strong>g sites <strong>in</strong> the years 2002 to 2006 is shown.<br />
A good status is coloured blue and a bad status is coloured red. In the case of a bad status, the<br />
parameters that caused the status to be evaluated as bad are also stated. White fields <strong>in</strong>dicate that<br />
monitor<strong>in</strong>g was not carried out at the particular monitor<strong>in</strong>g site.<br />
Table 3: The chemical status of rivers <strong>in</strong> the years 2002 to 2006<br />
RIVER Monitor<strong>in</strong>g Site 2002 2003 2004 2005 2006<br />
MURA Ceršak AOX Cd <strong>in</strong> sed. good AOX AOX<br />
MURA Petanjci good good good good good<br />
MURA Mota good good AOX AOX, FS AOX<br />
ŠČAVNICA Pristava det. det., FS FS metol., pest. good<br />
LEDAVA Čentiba good good AOX AOX AOX<br />
KOBILJSKI POTOK Mostje good good good good<br />
DRAVA Dravograd good good good good good<br />
DRAVA Brezno good good good good<br />
DRAVA Mariborski otok good good good good good<br />
DRAVA Duplek good good good good<br />
DRAVA Ptuj good good<br />
DRAVA Borl good good good good<br />
DRAVA Ormoż Hg, Cd <strong>in</strong> sed. Hg <strong>in</strong> sed. good good good<br />
MEŽA Podklanc good good good good<br />
MEŽA Otiški vrh good good good good good<br />
MISLINJA Otiški vrh good good good good good<br />
DRAVINJA Videm pri Ptuju Hg, Cd <strong>in</strong> sed. good metol. metol., pest. metol.<br />
PESNICA Zamušani good good good good metol., pest.<br />
SAVA DOLINKA Podkoren good good good good<br />
SAVA BOHINJKA Sv. Janez good<br />
SAVA BOHINJKA<br />
above the outfall<br />
of the Jezernica<br />
good good good<br />
JEZERNICA Ml<strong>in</strong>o good<br />
SAVA Otoče good good good good good<br />
SAVA Prebačevo good good good good good<br />
SAVA Medno Hg <strong>in</strong> sed. good good good good<br />
SAVA Šentjakob good good good good<br />
SAVA Dolsko good AOX good good<br />
SAVA Litija good good good good<br />
SAVA Kresnice good<br />
SAVA Suhadol (Hrastnik) Hg <strong>in</strong> sed. good good good good<br />
SAVA<br />
Radeče nad<br />
Sopoto<br />
good good<br />
SAVA Boštanj good good good good good<br />
SAVA Brežice<br />
AOX, atraz<strong>in</strong>e,<br />
metol., FS<br />
FS, AOX FS, AOX AOX, FS<br />
SAVA<br />
Jesenice na<br />
Dolenjskem<br />
AOX, atraz<strong>in</strong>e,<br />
metol.<br />
AOX, Cd <strong>in</strong><br />
sed.<br />
AOX AOX AOX<br />
TRŽIŠKA BISTRICA Podbrezje Cu good good FS good<br />
KOKRA Kranj good good good good good<br />
SORA Medvode good good good good good<br />
KAMNIŠKA BISTRICA source good good good good good<br />
KAMNIŠKA BISTRICA Beričevo<br />
AOX, FS, Cd, Hg<br />
<strong>in</strong> sed.<br />
Cu, FS, AOX FS, AOX metol. good<br />
MIRNA Boštanj good good good good good<br />
SOTLA Rogaška Slat<strong>in</strong>a Pb<br />
Pb, AOX, Cd<br />
<strong>in</strong> sed.<br />
Pb metol., FS B<br />
SOTLA Rakovec good AOX good FS good<br />
KOLPA Osilnica good good good good good<br />
KOLPA Petr<strong>in</strong>a good good<br />
KOLPA Fara good good good good<br />
19
20<br />
W A T E R Q U A L I T Y I N S L O V E N I A<br />
RIVER Monitor<strong>in</strong>g Site 2002 2003 2004 2005 2006<br />
KOLPA Radenci good good good good good<br />
KOLPA Radoviči (Metlika) good good good good good<br />
KOLPA Kamanje good<br />
RINŽA Kočevje good det. good good good<br />
BILPA Spodnja Bilpa good good<br />
LAHINJA Primostek good good good good good<br />
KRUPA source PCB good PCB PCB good<br />
LJUBLJANICA Livada good good good good good<br />
LJUBLJANICA Zalog<br />
AOX, det., MO,<br />
Hg <strong>in</strong> sed.<br />
Hg <strong>in</strong> sed. good good good<br />
VELIKA LJUBLJANICA Mirke Cu good good good<br />
VELIKI MOČILNIK Vrhnika good good good good<br />
GRAJSKI IZVIRI Bistra good good good good<br />
CERKNIŠKO JEZERO<br />
(STRŽEN)<br />
Dolenje jezero good good good<br />
CERKNIŠČICA<br />
Cerknica (Dolenja<br />
vas)<br />
good good good good det.<br />
PIVKA Postojna FS good good good good<br />
UNICA Hasberk good good good good good<br />
LOGAŠČICA Jačka AOX, Cu, MO FS, AOX<br />
FS, AOX,<br />
det.<br />
good AOX<br />
SAVINJA Luče good good good good<br />
SAVINJA Letuš good<br />
SAVINJA Braslovče good good good good<br />
SAVINJA Grušovlje good<br />
SAVINJA Medlog good good good good good<br />
SAVINJA Tremerje good good good good<br />
SAVINJA Rimske Toplice good good<br />
SAVINJA Veliko Širje good AOX good good good<br />
PAKA Rečica det. good det. det. good<br />
PAKA Ločan good<br />
PAKA Slat<strong>in</strong>a good<br />
BOLSKA Dolenja vas good good good good good<br />
VOGLAJNA Celje Zn, Cd<br />
Cd, Cu, Zn,<br />
Ni, sulphate<br />
Cu, Zn good Zn<br />
KRKA Podbukovje good good good good good<br />
KRKA Srebrniče good good good good good<br />
KRKA Gornja Gomila good good good good<br />
KRKA Krška vas good good good good atraz<strong>in</strong>e<br />
IZVIR KRKE<br />
POLTARICA<br />
Gradiček good good good good<br />
SOČA Trenta good good good good good<br />
SOČA Kršovec good<br />
SOČA Kamno good<br />
SOČA pod Tolm<strong>in</strong>om good good good good<br />
SOČA Plave good Hg <strong>in</strong> sed. good good<br />
SOČA Solkan Hg <strong>in</strong> sed. good Cd <strong>in</strong> sed. Cd <strong>in</strong> sed. good<br />
KORITNICA Kal good good good good good<br />
TOLMINKA outfall good good good good<br />
PODROTEJA<br />
Karst source<br />
Podroteja<br />
good good good<br />
IDRIJCA Podroteja good good good good<br />
IDRIJCA<br />
above the Divje<br />
jezero<br />
good<br />
IDRIJCA Hotešk good good good good good<br />
KOREN Nova Gorica Cu, det., FS<br />
Cd, Cu, Zn,<br />
Pb, FS, MO,<br />
det.<br />
Cu, FS, MO,<br />
det.<br />
VIPAVA source good good good<br />
FS, MO, det. MO, det.
S U R F A C E W A T E R S<br />
RIVER Monitor<strong>in</strong>g Site 2002 2003 2004 2005 2006<br />
VIPAVA Velike Žablje good<br />
VIPAVA Miren good Cd <strong>in</strong> sed. good good good<br />
HUBELJ source good good good<br />
HUBELJ Ajdovšč<strong>in</strong>a good good good good good<br />
NADIŽA Potoki good good<br />
NADIŽA Robič good good good<br />
REKA Podgraje good<br />
REKA Topolc FS FS good good good<br />
REKA<br />
Cerkvenikov ml<strong>in</strong><br />
(the mill)<br />
good good good good good<br />
REKA Matavun good good good good<br />
MOLJA Zarečica good<br />
RIŽANA source good good good<br />
RIŽANA Dekani Cu, Ni, MO good good good good<br />
DRAGONJA Podkaštel good good good good good<br />
MALENŠČICA Malni good good good<br />
RAK<br />
Veliki naravni most<br />
(the Great Natural<br />
Bridge)<br />
good<br />
JEZE<strong>RS</strong>KI OBRH Gorenje jezero good<br />
TREBUŠČICA most pri Sovi good<br />
BAČA Grapa good<br />
IDRIJA Golo Brdo good<br />
RIŽANA Bertoki good<br />
Bad chemical status metol.: Metolachlor<br />
Good chemical status pest.: Pesticides<br />
The monitor<strong>in</strong>g site was not <strong>in</strong>cluded <strong>in</strong> the Cu: Copper<br />
monitor<strong>in</strong>g programme Ni: Nickel<br />
Zn: Z<strong>in</strong>c<br />
AOX: Adsorbable organic halogen compounds Pb: Lead<br />
FS: Phenol substances Cd: Cadmium<br />
MO: M<strong>in</strong>eral oils Hg: Mercury<br />
PCB: Polychlor<strong>in</strong>ated biphenyls B: Boron<br />
det.: Anion active detergents <strong>in</strong> sed.: Upward trend <strong>in</strong> sediment<br />
In 2006, the monitor<strong>in</strong>g of priority and nationally relevant substances was also carried out at 23<br />
monitor<strong>in</strong>g sites. The entire list of priority substances was monitored at a frequency of once a<br />
month, and nationally relevant substances were monitored four times a year. The analysis of the<br />
results for priority substances shows that, <strong>in</strong> relation to the European Commission’s last proposal<br />
of environmental quality standards (16), the annual average values do not exceed the proposed<br />
environmental quality standards and therefore do not <strong>in</strong>dicate a bad chemical status.<br />
Soča, Kanal Dragonja, border cross<strong>in</strong>g po<strong>in</strong>t Dragonja<br />
21
22<br />
2.1.2<br />
W A T E R Q U A L I T Y I N S L O V E N I A<br />
River <strong>Quality</strong> Assessment Us<strong>in</strong>g Saprobic Index and Beg<strong>in</strong>n<strong>in</strong>gs of Ecological<br />
Status Evaluation<br />
In <strong>Slovenia</strong>, as well as <strong>in</strong> other European countries, the methodology for the assessment of the<br />
ecological status of the rivers accord<strong>in</strong>g to the <strong>Water</strong> Framework Directive is currently <strong>in</strong> preparation.<br />
Until 2005, the biological quality of rivers was evaluated us<strong>in</strong>g the saprobic <strong>in</strong>dex, which primarily<br />
shows the organic pollution. The Pantle and Buck method was used, with a modification accord<strong>in</strong>g<br />
to the Zel<strong>in</strong>ka and Marvan method (25, 26) us<strong>in</strong>g calculation of the saprobic <strong>in</strong>dex (SI) value of the<br />
biocenoses of benthic <strong>in</strong>vertebrates and phytobenthos. The saprobic <strong>in</strong>dex (SI) value <strong>in</strong>creases from<br />
one to four with the deterioration of liv<strong>in</strong>g conditions. For every analysed sample, the saprobic <strong>in</strong>dex<br />
(SI) is calculated us<strong>in</strong>g the saprobic value, frequency and <strong>in</strong>dicative weight of taxon.<br />
Accord<strong>in</strong>g to the <strong>in</strong>dex value, each monitor<strong>in</strong>g site is classified <strong>in</strong>to an appropriate quality class (Table 4).<br />
Table 4: <strong>Quality</strong> classes accord<strong>in</strong>g to the saprobic <strong>in</strong>dex value<br />
<strong>Quality</strong> class SI value Saprobic level River quality description<br />
1 1.0 - 1.5 oligosaprobic uncharged to very little charged<br />
1-2 1.51- 1.8<br />
oligosaprobic to<br />
betamesosaprobic<br />
little charged<br />
2 1.81- 2.3 betamesosaprobic moderately charged<br />
2-3 2.31- 2.7<br />
betamesosaprobic to<br />
alfamesosaprobic<br />
critically charged<br />
3 2.71- 3.2 alfamesosaprobic heavily polluted<br />
3-4 3.21- 3.5<br />
alfamesosaprobic to<br />
polysaprobic<br />
very heavily polluted<br />
4 3.51- 4.0 polysaprobic excessively polluted<br />
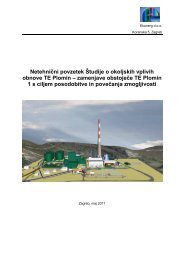
The saprobic quality evaluation at selected monitor<strong>in</strong>g sites <strong>in</strong> 2005 is shown <strong>in</strong> Map 2.<br />
In comparison with 2004, the saprobic quality of rivers was improved <strong>in</strong> 2005. Based on the results of<br />
saprobic analyses conducted <strong>in</strong> 42 rivers and at 69 different monitor<strong>in</strong>g sites, most of the monitor<strong>in</strong>g<br />
sites are classified as uncharged to very little charged, and only one monitor<strong>in</strong>g site is classified as<br />
heavily polluted (the R<strong>in</strong>ža <strong>in</strong> Kočevje). There were neither very heavily polluted nor excessively<br />
polluted rivers <strong>in</strong> 2005.<br />
Sampl<strong>in</strong>g<br />
A dragonfly
Map 2: Saprobic quality evaluation of rivers <strong>in</strong> 2005<br />
S U R F A C E W A T E R S<br />
23
24<br />
W A T E R Q U A L I T Y I N S L O V E N I A<br />
The improvement of the saprobic quality of rivers is <strong>in</strong>dicated throughout the entire period from<br />
1996 to 2005. The number of monitor<strong>in</strong>g sites <strong>in</strong> quality classes 1 and 2 is <strong>in</strong>creas<strong>in</strong>g, and the number<br />
of monitor<strong>in</strong>g sites <strong>in</strong> lower quality classes is decreas<strong>in</strong>g (Chart 4).<br />
Chart 4: The saprobic status of rivers – the proportion of monitor<strong>in</strong>g sites <strong>in</strong> a specific quality class <strong>in</strong> the years<br />
1996 to 2005<br />
����������������������������������<br />
���<br />
��<br />
��<br />
��<br />
��<br />
��<br />
��<br />
��<br />
��<br />
��<br />
�<br />
���� ���� ���� ���� ���� ���� ���� ���� ���� ����<br />
������� ���������� �������� ������������ ��������� ������������� ��������<br />
An improvement <strong>in</strong> the Ljubljanica at the monitor<strong>in</strong>g site Zalog, follow<strong>in</strong>g the activation of the<br />
central wastewater treatment plant <strong>in</strong> Ljubljana <strong>in</strong> July 2005, should be noted. The improvement is<br />
<strong>in</strong>dicated by the results of saprobic analyses of benthic <strong>in</strong>vertebrates that primarily show the impacts<br />
of organic pollution (Chart 5). The f<strong>in</strong>d<strong>in</strong>gs are supported by the results <strong>in</strong>dicat<strong>in</strong>g the biochemical<br />
and chemical oxygen demand, which also reflect the organic pollution (Chart 6).<br />
Chart 5: <strong>Water</strong> quality of the Ljubljanica <strong>in</strong> Zalog <strong>in</strong> the years 1991 to 2006 accord<strong>in</strong>g to the saprobic <strong>in</strong>dex based on<br />
benthic <strong>in</strong>vertebrates<br />
��������������<br />
����<br />
����<br />
����<br />
����<br />
����<br />
����<br />
����<br />
����<br />
����<br />
����<br />
����<br />
����<br />
����<br />
����<br />
����<br />
����<br />
���� ���� ���� ���� ���� ���� ���� ���� ���� ���� ���� ���� ���� ���� ���� ����
S U R F A C E W A T E R S<br />
Chart 6: <strong>Water</strong> quality of the Ljubljanica <strong>in</strong> Zalog <strong>in</strong> the years 2000 to 2006 accord<strong>in</strong>g to the biochemical and chemical<br />
oxygen demand<br />
����������� �� ����� � ���<br />
��<br />
��<br />
��<br />
��<br />
��<br />
��<br />
�<br />
�����������<br />
��� � ����� � ��<br />
�����������<br />
����������<br />
�����������<br />
���������� � �� � � � ����� � ��<br />
����������<br />
������������<br />
�����������<br />
Caddisflies - larvae A dragonfly larva<br />
Various algae Shellfish-Bivalve<br />
�����������<br />
�����������<br />
�����������<br />
�����������<br />
����������<br />
�����������<br />
�����������<br />
�����������<br />
������������<br />
�����������<br />
�����������<br />
�����������<br />
����������<br />
������������<br />
�����������<br />
25
26<br />
2.2<br />
W A T E R Q U A L I T Y I N S L O V E N I A<br />
In 2006, the quantitative sampl<strong>in</strong>g of benthic <strong>in</strong>vertebrates and phytobenthos, carried out by<br />
sampl<strong>in</strong>g multimicrohabitat types <strong>in</strong> selected water bodies, was carried out <strong>in</strong> <strong>Slovenia</strong> for the first<br />
time. The samples were laboratory proceeded (sub-sample sort<strong>in</strong>g and determ<strong>in</strong>ation to required<br />
level) us<strong>in</strong>g new national methodology (18, 19, 20). They were evaluated accord<strong>in</strong>g to the expert<br />
groundwork for the assessment of the organic pollution of rivers by us<strong>in</strong>g an adapted saprobic <strong>in</strong>dex<br />
based on of benthic <strong>in</strong>vertebrates and phytobenthos (21, 22). Only 22 selected rivers were analysed.<br />
Sampl<strong>in</strong>g and further laboratory proceed<strong>in</strong>gs of 37 monitor<strong>in</strong>g sites showed that, accord<strong>in</strong>g to<br />
quality assessment based on phytobenthos, 43% of monitor<strong>in</strong>g sites had a high status, 32% a good<br />
status, 22% a moderate status and 3% had a poor quality status. The results of benthic <strong>in</strong>vertebrates<br />
sampl<strong>in</strong>g and analysis, however, showed that 57% of monitor<strong>in</strong>g sites had a high status, 27% a<br />
good status, 11% a moderate status, 3% a poor status and 3% had a bad quality status. It should be<br />
emphasized that this assessment has been made based on only two biological quality elements, for<br />
only one pressure (organic pollution) and at selected monitor<strong>in</strong>g sites.<br />
In the follow<strong>in</strong>g years, a classification of the ecological status will be presented, represent<strong>in</strong>g the<br />
measurement of the alteration of the ecosystem’s structure and function<strong>in</strong>g from the natural state,<br />
i.e. the state where there are no, or only very m<strong>in</strong>or human impact. The assessment of the ecological<br />
status is based on biological quality elements (phytoplankton, phytobenthos and macrophytes, fish<br />
and benthic <strong>in</strong>vertebrates) and on hydromorphological, chemical and physico-chemical elements<br />
support<strong>in</strong>g the biological elements. The assessment system will enable a dist<strong>in</strong>ction between five<br />
classes of ecological status: “high”, “good”, “moderate”, “poor” and “bad”. S<strong>in</strong>ce the start<strong>in</strong>g po<strong>in</strong>ts or<br />
reference conditions of water bodies are different, a type-specific approach will be used whereby<br />
the waters are classified <strong>in</strong>to types accord<strong>in</strong>g to their natural characteristics and then reference<br />
conditions are def<strong>in</strong>ed for each type (27, 28, 29, 30). The evaluation of the ecological status of rivers<br />
<strong>in</strong> <strong>Slovenia</strong> will be possible only when assessment methods for all biological quality elements and<br />
different pressures are prepared.<br />
<strong>Quality</strong> of Lakes<br />
With <strong>Slovenia</strong>’s association with the European Union, the <strong>Water</strong> Framework Directive (1) has become<br />
the b<strong>in</strong>d<strong>in</strong>g and key document <strong>in</strong> the field of water management and has also <strong>in</strong>fluenced changes<br />
<strong>in</strong> the monitor<strong>in</strong>g of lake quality. The period from 2003 to 2006 was actually a transitional period for<br />
the implementation of the <strong>Water</strong> Framework Directive, which has brought important changes <strong>in</strong> lake<br />
sampl<strong>in</strong>g and, most of all, a new, <strong>in</strong>tegrated approach for the assessment of ecological status, which<br />
could not be used <strong>in</strong> that period due to the assessment methods still <strong>in</strong> the course of preparation.<br />
Until 2002, national monitor<strong>in</strong>g of lake quality was carried out only on Lake Bled, Lake Boh<strong>in</strong>j and<br />
Cerknica Lake. S<strong>in</strong>ce 2003, due to the requirements of the <strong>Water</strong> Framework Directive, the monitor<strong>in</strong>g<br />
has also <strong>in</strong>cluded artificial lake, reservoirs and river accumulations of an area larger than 0.5 km2 (31,<br />
32), which are accord<strong>in</strong>g to the Rules of identification and classification of surface water bodies (15)<br />
def<strong>in</strong>ed as water bodies (Map 3, Table 5). These are the follow<strong>in</strong>g: Lake Bled, Lake Boh<strong>in</strong>j, Velenje Lake,<br />
Šmart<strong>in</strong>sko Lake, Slivniško Lake, Perniško Lake, Gajševsko Lake and Ledavsko Lake, the reservoirs<br />
of Klivnik, Molja and Vogršček, as well as the river accumulations of Moste, Mavčiče, Vrhovo and<br />
Ptuj Lake. Monitor<strong>in</strong>g was due to a high rate of flow not carried out only <strong>in</strong> Ormož Lake, but it was<br />
nevertheless performed as part of the monitor<strong>in</strong>g programme of rivers. In the river accumulations<br />
of Mavčiče, Vrhovo and Ptuj Lake, monitor<strong>in</strong>g was carried out only <strong>in</strong> the event of the ‘bloom<strong>in</strong>g’ of<br />
phytoplankton, which is characteristic of the dry season when the rate of flow <strong>in</strong> river accumulation<br />
is at its lowest and the accumulations are given the status of stand<strong>in</strong>g water bodies.<br />
The <strong>in</strong>termittent Cerknica Lake, which does not have any common characteristics with permanent<br />
lakes, was <strong>in</strong>cluded <strong>in</strong> monitor<strong>in</strong>g of lakes <strong>in</strong> the years 1993 to 2005. S<strong>in</strong>ce there are Karst Rivers,<br />
which dur<strong>in</strong>g high waters tend to flood the Cerknica field, the sampl<strong>in</strong>g and assess<strong>in</strong>g the lake were<br />
carried out <strong>in</strong> accordance with the criteria for rivers, and the status of Cerknica Lake is also presented<br />
<strong>in</strong> the data for rivers.
Lake Boh<strong>in</strong>j<br />
Table 5: List of water bodies <strong>in</strong> <strong>Slovenia</strong> where monitor<strong>in</strong>g of lakes is carried out<br />
Name<br />
<strong>Water</strong> body<br />
type<br />
Sub - bas<strong>in</strong><br />
Surface area<br />
(km 2 )<br />
Volume<br />
(m 3 10 6 )<br />
S U R F A C E W A T E R S<br />
Depth<br />
(m)<br />
Lake Bled J Sava 1.43 25.7 31 max.<br />
Lake Boh<strong>in</strong>j J Sava 3.28 92.5 45 max.<br />
Cerknica Lake V Sava > 24 do 76 >3 mean.<br />
Šmart<strong>in</strong>sko Lake kMPVT Sav<strong>in</strong>ja 1.07 6.5 6 mean.<br />
Slivniško Lake kMPVT Voglajna 0.84 4.0 5 mean.<br />
Ledavsko Lake kMPVT Mura 2.18 5.7 >3 mean.<br />
Perniško Lake kMPVT Pesnica 1.23 3.4
28<br />
W A T E R Q U A L I T Y I N S L O V E N I A<br />
Map 3: Lakes <strong>in</strong>cluded <strong>in</strong> the monitor<strong>in</strong>g programme <strong>in</strong> the years 2003 to 2006
S U R F A C E W A T E R S<br />
In the years 2003 to 2006, the monitor<strong>in</strong>g network consisted of monitor<strong>in</strong>g sites <strong>in</strong> lakes and monitor<strong>in</strong>g<br />
sites at the lakes’ <strong>in</strong>flows and outflows. The sampl<strong>in</strong>g of lakes was carried out at selected depths along<br />
the water column. The monitor<strong>in</strong>g programme was primarily adjusted to monitor eutrophication,<br />
which is the ma<strong>in</strong> problem <strong>in</strong> most natural and artificial lakes of the Temperate Zone on a carbonate<br />
geological layer, to which all lakes and reservoirs <strong>in</strong> <strong>Slovenia</strong> also belong. In the lakes and their <strong>in</strong>flows,<br />
the status of nutrients and general physico-chemical parameters were primarily monitored. Analyses<br />
of pollutants, heavy metals and pesticides were only carried out <strong>in</strong> some <strong>in</strong>flows and outflows where,<br />
tak<strong>in</strong>g <strong>in</strong>to account the pressures <strong>in</strong> the catchment area, an <strong>in</strong>creased concentration of <strong>in</strong>dividual<br />
pollutants <strong>in</strong> water was to be expected. The lakes were evaluated accord<strong>in</strong>g to OECD criteria (33),<br />
which classify the lakes <strong>in</strong>to five trophic categories, based on the average annual concentration of<br />
total phosphorus and nitrogen, the average annual and m<strong>in</strong>imum transparency, and the average<br />
annual and maximum concentration of chlorophyll-a. Other pressures that have to be taken <strong>in</strong>to<br />
consideration <strong>in</strong> the ecological status classification of lakes or the ecological potential of artificial<br />
reservoirs as required by the <strong>Water</strong> Framework Directive, were not evaluated while an appropriate<br />
methodology is still <strong>in</strong> the course of preparation. Among biological quality elements, the status of<br />
phytoplankton, macrophytes, phytobenthos and benthic <strong>in</strong>vertebrates was monitored. In the years<br />
2003 to 2006 the f<strong>in</strong>al assessment of lake status was made accord<strong>in</strong>g to the status of phytoplankton<br />
(one of the OECD criteria), which is expressed by the average and maximum annual concentration<br />
of chlorophyll-a. The sampl<strong>in</strong>g of macrophytes, phytobenthos and benthic <strong>in</strong>vertebrates was carried<br />
out at selected sites <strong>in</strong> the shore zone accord<strong>in</strong>g to new methodology, adapted for the assessment<br />
of the ecological status of lakes. A detailed programme outl<strong>in</strong><strong>in</strong>g the monitor<strong>in</strong>g of water quality for<br />
each <strong>in</strong>dividual lake is presented <strong>in</strong> the annual Programme for monitor<strong>in</strong>g the quality of lakes (32).<br />
Lake Bled<br />
29
30<br />
W A T E R Q U A L I T Y I N S L O V E N I A<br />
The trophic status of lakes and reservoirs evaluated on the basis of OECD criteria (Organisation for<br />
Economic Co-operation and Development) (33) is presented <strong>in</strong> Table 6. The same criteria were used<br />
<strong>in</strong> the evaluation of the status of river <strong>in</strong> the bloom<strong>in</strong>g period, and the presented values are the<br />
average measured values at <strong>in</strong>dividual depths. The exception is the Moste reservoir where sampl<strong>in</strong>g<br />
was carried out four times a year.<br />
Table 6: OECD criteria for the evaluation of the trophic status (33) and the evaluation of lakes/reservoirs <strong>in</strong> the years 2003<br />
to 2006<br />
Trophic level<br />
Total<br />
phosphorus<br />
(average)<br />
OECD CRITERIA<br />
Nitrogen<br />
<strong>in</strong>organic<br />
(average)<br />
Transparency<br />
(average)<br />
Transparency<br />
(m<strong>in</strong>imum)<br />
Chlorophyll-a<br />
(average)<br />
Chlorophyll-a<br />
(maksimum)<br />
STATUS of the lake (µg P/L) (µg N/L) (m) (m) (µg/L) (µg/L)<br />
Ultraoligotrophic < 4 < 200 > 12 > 6 < 1 < 2.5<br />
Oligotrophic < 10 200 - 400 > 6 > 3 < 2.5 < 8<br />
Mesotrophic 10 - 35 300 - 650 6 - 3 3 - 1.5 2.5 - 8 8 - 25<br />
Eutrophic 35 - 100 500 - 1500 3 - 1.5 1.5 - 0.7 8 - 25 25 -75<br />
Hypereutrophic > 100 > 1500 < 1.5 < 0.7 > 25 > 75<br />
Lake and period of status<br />
evaluation<br />
Total<br />
phosporous<br />
Nitrogen<br />
<strong>in</strong>organic<br />
Transparency Transparency Chlorophyll-a Chlorophyll-a<br />
(µg P/L) (µg N/L) (m) (m) (µg/L) (µg/L)<br />
NATURAL LAKES<br />
Lake Bled 1979 - 1981 72 650 1.9 1.2 17 > 75<br />
Lake Bled 2003 - 2006 13 287 6.7 3.6 5.0 18.2<br />
Lake Boh<strong>in</strong>j 2003 - 2006 4 456 9.5 6.2 1.1 3.4<br />
ARTIFICIAL LAKE<br />
Velenje Lake 2006 120 1500 7.4 6.5 1.4 7.6<br />
RESERVOI<strong>RS</strong><br />
Šmart<strong>in</strong>sko Lake 2003 - 2006 63 758 1.2 0.8 17.3 46.4<br />
Slivniško Lake 2004 - 2005 140 1340 1.1 1.0 21.9 62.9<br />
Perniško Lake 2004 - 2006 133 1707 0.3 0.2 98.2 206.1<br />
Ledavsko Lake 2003 - 2006 136 2194 0.6 0.4 70.2 176.2<br />
Gajševsko Lake 2006 101 1329 0.8 0.5 37.6 61.8<br />
Klivnik 2003-2005 12 870 3.3 2.6 3.7 6.5<br />
Molja 2003-2005 17 595 2.2 1.6 7.5 17.9<br />
Vogršček 2006 8 890 3.2 2.7 4.4 12.3<br />
RIVER ACCUMULATION<br />
Moste 2006 32 802 5.4 2.6 2.0 3.7<br />
Mavčiče 2003 * 152 827 - 0.2 238.7 1306.1<br />
Vrhovo 2003 * 239 1258 - 0.7 71.0 180<br />
Ptujsko j. 2003 * 183 1182 - 1 4.8 6.6<br />
* Results of one sampl<strong>in</strong>g dur<strong>in</strong>g the bloom<strong>in</strong>g period
Lake Bled<br />
S U R F A C E W A T E R S<br />
The establishment of monitor<strong>in</strong>g at Lake Bled and its <strong>in</strong>flows was related to remedial action for<br />
the improvement of the lake status that was <strong>in</strong> the ‘70s already eutrophic, occasionally even<br />
hypereutrophic. The status of Lake Bled has therefore been regularly monitored s<strong>in</strong>ce 1975. The<br />
results of monitor<strong>in</strong>g show that the artificial <strong>in</strong>flow the Radovna (1964), the siphon that functions<br />
as a depth outflow from the lake (1980/81) and the partial restoration of the sewage system <strong>in</strong><br />
Bled (1982–1985) contributed to the improvement of the status of Lake Bled. S<strong>in</strong>ce 1983, Lake Bled<br />
has been classified as a mesotrophic lake accord<strong>in</strong>g to OECD criteria. A reduction of the nutrients<br />
concentration and a general improvement of the Lake Bled status are apparent <strong>in</strong> the years 2003<br />
to 2006 <strong>in</strong> comparison with the years 1979 to 1981. But nevertheless, an occasionally <strong>in</strong>creased<br />
production of phytoplankton, expressed by a relatively high average concentration of chlorophyll-a,<br />
represents a warn<strong>in</strong>g about pressures from the lake bas<strong>in</strong>’s which cannot be entirely amended by<br />
the beneficial effects of restoration measures, the Radovna and by the siphon. In addition, the results<br />
of the monitor<strong>in</strong>g of <strong>in</strong>flows show that the concentration of phosphorus, which is the essential<br />
biogenic element, has been recently <strong>in</strong>creas<strong>in</strong>g <strong>in</strong> Mišca. On the basis of phosphorus, Table 7 shows<br />
the effectiveness of the siphon <strong>in</strong> remov<strong>in</strong>g the load from the lake and pollution load of Mišca <strong>in</strong> the<br />
years 2003 to 2006.<br />
Table 7: The annual <strong>in</strong>put and output of phosphorus by Mišca and the siphon <strong>in</strong> the years 2003 to 2006<br />
Year<br />
2003<br />
(kg P)<br />
2004<br />
(kg P)<br />
2005<br />
(kg P)<br />
2006<br />
(kg P)<br />
Siphon 308 266 217 260<br />
Mišca 231 372 335 402<br />
Lake Boh<strong>in</strong>j<br />
Accord<strong>in</strong>g to criteria set by the Group for Alp<strong>in</strong>e Lakes (34) <strong>in</strong> the process of <strong>in</strong>tercalibration of biological<br />
elements, Lake Boh<strong>in</strong>j belongs to the category of alp<strong>in</strong>e lakes where the impacts of human activity<br />
on the aquatic environment are either not present or are <strong>in</strong>significant. Additionally, accord<strong>in</strong>g to<br />
OECD criteria, Lake Boh<strong>in</strong>j was classified as a clear oligotrophic lake with low productivity <strong>in</strong> the years<br />
2003 to 2006, although the average concentration of nitrogen compounds exceeded the limit value<br />
for oligotrophic lakes. A high concentration of nitrogen compounds has been present <strong>in</strong> Lake Boh<strong>in</strong>j<br />
s<strong>in</strong>ce the beg<strong>in</strong>n<strong>in</strong>g of monitor<strong>in</strong>g of the lake’s status (1993) and is not <strong>in</strong>creas<strong>in</strong>g, which <strong>in</strong>dicates<br />
that it is the natural state. With regards to phytoplankton, some species occasionally appear that<br />
were not present <strong>in</strong> previous years and are characteristic of more productive lakes. An assessment of<br />
the ecological status of Lake Boh<strong>in</strong>j will be made when the assessment methods for other biological<br />
elements are ready and will also <strong>in</strong>clude other pressures and not just the eutrophication.<br />
Coccal green algae Nephrocytiun agardhianum, characteristic of more productive lakes, which also appeared <strong>in</strong> Lake<br />
Boh<strong>in</strong>j <strong>in</strong> the years 2003 to 2006.<br />
31
32<br />
W A T E R Q U A L I T Y I N S L O V E N I A<br />
Cerknica Lake<br />
The <strong>in</strong>termittent Cerknica Lake is a very unique aquatic ecosystem that does not share any common<br />
characteristics with permanent lakes. Due to its great water level fluctuation and the large metabolic<br />
role of marsh plants, there is almost no eutrophication. The results of monitor<strong>in</strong>g show that the<br />
pollutants, especially heavy metals from <strong>in</strong>dustrial plants <strong>in</strong> the catchment area of the Cerknica Lake,<br />
do not exceed the limit values prescribed <strong>in</strong> the Decree of chemical status of surface waters (Table<br />
1). At the monitor<strong>in</strong>g site Stržen - Dolenje jezero, the chemical status was good <strong>in</strong> 2005, but <strong>in</strong> 2006,<br />
it was bad due to the exceeded concentration of detergents, which <strong>in</strong>dicates a problem with the<br />
unregulated discharge of municipal wastewaters.<br />
Velenje Lake<br />
Velenje Lake was formed <strong>in</strong> the vic<strong>in</strong>ity of the Thermal Power Plant Šoštanj, as the terra<strong>in</strong> above the<br />
abandoned part of the lignite m<strong>in</strong>e sank and was flooded. In 2006 it was <strong>in</strong>cluded <strong>in</strong> the national lake<br />
quality monitor<strong>in</strong>g for the first time. Velenje Lake could be classified as a hypereutrophic lake, on the<br />
basis of the average concentration of total phosphorus (120 μg/L) and the average concentration of<br />
nitrogen (1500 μg/L), but the analysis of phytoplankton and the average concentration of chlorophylla<br />
(2.7 μg/L) <strong>in</strong>dicated a productivity characteristic of little to moderately charged lakes with nutrients.<br />
The primary production <strong>in</strong> Velenje Lake is probably limited by the presence of other substances, which<br />
are <strong>in</strong> <strong>in</strong>creased amounts present <strong>in</strong> the lake. In comparison with other lakes, a high average annual<br />
concentration of sulphates (594 mg/L), chlorides (41.2 mg/L) and potassium (51.6 mg/L) especially<br />
stand out <strong>in</strong> Velenje Lake. The average concentration of sulphate is 3.9 times higher than the limit<br />
value for the chemical status accord<strong>in</strong>g to the Decree of chemical status of surface waters (7), which<br />
classifies Velenje Lake as one with a bad chemical status.<br />
Šmart<strong>in</strong>sko Lake, Slivniško Lake, Perniško Lake, Ledavsko Lake and<br />
Gajševsko Lake<br />
All reservoirs <strong>in</strong> north-eastern <strong>Slovenia</strong>, i.e. Šmart<strong>in</strong>sko Lake, Slivniško Lake, Perniško Lake, Ledavsko<br />
Lake and Gajševsko Lake are, under all OECD criteria, eutrophic to hypereutrophic lakes with a high<br />
concentration of total phosphorus and nitrogen. All these reservoirs are shallow, silty and overloaded<br />
with fish. Chemical analyses of <strong>in</strong>flows show that, besides high trophic status, the chemical status could<br />
also be problematic <strong>in</strong> some of these reservoirs. Namely, <strong>in</strong> the <strong>in</strong>flows of Šmart<strong>in</strong>sko Lake, Perniško<br />
Lake and Ledavsko Lake, <strong>in</strong>creased concentrations of pesticides and heavy metals were occasionally<br />
measured, exceed<strong>in</strong>g the limit values specified <strong>in</strong> the Decree of chemical status of surface waters (7).<br />
Due to low sampl<strong>in</strong>g frequency, the calculation and evaluation of chemical status of <strong>in</strong>flows are not<br />
possible. The contents of pollutants exceed<strong>in</strong>g the limit values are presented <strong>in</strong> Table 8.<br />
Šmart<strong>in</strong>sko Lake Ledavsko Lake
S U R F A C E W A T E R S<br />
Table 8: Exceeded limit values (7) of <strong>in</strong>dividual pollutants <strong>in</strong> the reservoirs’ <strong>in</strong>flows <strong>in</strong> the years 2003 to 2006<br />
RESERVOIR<br />
Ledavsko Lake<br />
Šmart<strong>in</strong>sko Lake<br />
Perniško Lake<br />
Monitor<strong>in</strong>g site<br />
Date of<br />
sampl<strong>in</strong>g<br />
Dissolved<br />
cadmium<br />
(µg/L)<br />
Metholachlor<br />
(µg/L)<br />
Atraz<strong>in</strong>e<br />
(µg/L)<br />
Total<br />
pesticides<br />
(µg/L)<br />
Outflow 30. 7. 2003 35<br />
Outflow 22. 4. 2004 31<br />
Outflow 21. 7. 2004 0.86 1.23<br />
Outflow 13. 4. 2005 1.2<br />
Outflow 25. 8. 2005 1.2 0.33 0.1 0.59<br />
Outflow 10. 5. 2006 0.75 0.79<br />
Outflow 9. 8. 2006 0.16<br />
Ledava 22. 4. 2004<br />
Ledava 21. 7. 2004 0.4<br />
Ledava 13. 4. 2005<br />
Ledava 25. 8. 2005 1.2<br />
Ledava 10. 5. 2006 0.23<br />
Lahajski potok 21. 7. 2004 1.9 2.43<br />
Lahajski potok 10. 5. 2006 0.63 0.73<br />
Outflow 16. 4. 2003 0.13<br />
Outflow 24. 8. 2005 1.2 25<br />
Outflow 8. 8. 2006 0.28<br />
Outflow 7. 11. 2006 0.12<br />
Koprivnica 13. 4. 2005<br />
AOX: Adsorbable organic halogen compounds<br />
Klivnik, Molja and Vogršček<br />
Koprivnica 24. 8. 2005 1.2 30<br />
Jaren<strong>in</strong>ski potok 19. 8. 2004 1.2<br />
Pesnica 19. 8. 2004 1.2<br />
In comparison with reservoirs <strong>in</strong> north-eastern <strong>Slovenia</strong>, Klivnik and Molja <strong>in</strong> Brk<strong>in</strong>i and Vogršček <strong>in</strong> the<br />
Vipavska dol<strong>in</strong>a are less loaded with nutrients. All three can be classified as mesotrophic reservoirs.<br />
Klivnik and Molja are larger reservoirs built <strong>in</strong> the Reka sub-bas<strong>in</strong> <strong>in</strong> the years 1979/80, with the<br />
purpose of eas<strong>in</strong>g the effects of high waters. Their catchment area is sparsely populated; the water<br />
quality is therefore relatively good, especially <strong>in</strong> the upper reservoir Klivnik. Klivnik is a possible<br />
source of water supply for the population on the marg<strong>in</strong> of the Karst region. The ma<strong>in</strong> pressure of the<br />
reservoir is an erosive crumbl<strong>in</strong>g of the banks, which especially after ra<strong>in</strong>fall, contributes to an <strong>in</strong>put<br />
of suspended substances and consequently to lower transparency of the reservoir.<br />
River Accumulations<br />
In the period from 2003 to 2006, there were draught conditions over the summer months of 2003;<br />
such conditions contribute to the reduction of the rate of flow <strong>in</strong> large river accumulations and<br />
<strong>in</strong>itiate <strong>in</strong>tensive development of phytoplankton - ‘bloom<strong>in</strong>g’. The most <strong>in</strong>tensive ‘bloom<strong>in</strong>g’ was<br />
present <strong>in</strong> the Mavčiče accumulation that already appeared <strong>in</strong> June. Due to the decomposition of a<br />
large biomass of planktonic algae that was generated <strong>in</strong> the bloom<strong>in</strong>g and high temperatures, there<br />
was critical oxygen deficiency <strong>in</strong> water and even cases of fish deaths. Vertical sampl<strong>in</strong>g along the<br />
water column was carried out <strong>in</strong> Trbojsko Lake. At the sampl<strong>in</strong>g site Prebačevo, only a surface sample<br />
was taken and the highest concentration of chlorophyll-a (1306.1 μg/L) was measured there (Table 5).<br />
The concentration of oxygen was higher than 25 mg O 2 /L and the oxygen saturation exceeded 200%.<br />
All other parameters, like the chemical oxygen demand with K 2 Cr 2 O 7 (69.0 mg O 2 /L) etc., were also<br />
AOX<br />
(mg<br />
Cl/L)<br />
33
34<br />
2.3<br />
W A T E R Q U A L I T Y I N S L O V E N I A<br />
Klivnik Vogršček<br />
excessive, which is characteristic of mass ‘bloom<strong>in</strong>g’. In June 2003, the samples taken from the surface<br />
at the Vrhovo accumulation showed an extremely high concentration of chlorophyll-a (180 μg/L),<br />
which reflects long-last<strong>in</strong>g draught conditions and a lower rate of flow <strong>in</strong> the accumulation, which<br />
otherwise prevents the mass development of phytoplankton. In the phytoplankton sample, generally<br />
the same phytoplanktonic species were present as <strong>in</strong> the Mavčiče accumulation, and also some other<br />
species that were not found <strong>in</strong> Mavčiče. The prevail<strong>in</strong>g species was green algae, Pandor<strong>in</strong>a morum.<br />
In 2003, a shorter period of ‘bloom<strong>in</strong>g’ also occurred <strong>in</strong> Ptuj Lake. On the day prior to sampl<strong>in</strong>g, the<br />
rate of flow at the Markovci dam was <strong>in</strong>creased after a long period of time, and this contributed to<br />
the fast outflow of the <strong>in</strong>creased biomass of planktonic algae. At the time of sampl<strong>in</strong>g, the measured<br />
concentrations of chlorophyll-a were extremely low, despite the high nutrients concentration<br />
(nitrogen and phosphorus compounds) (Table 5). Analyses of species composition of phytoplankton<br />
showed that the frequency of genu<strong>in</strong>e plankton species is low.<br />
For the first time, the Moste accumulation was <strong>in</strong>cluded <strong>in</strong> the national monitor<strong>in</strong>g programme<br />
<strong>in</strong> 2006. Measurements have shown that the accumulation has the status of a lake only when the<br />
power plant is not operat<strong>in</strong>g and the water stagnates. Accord<strong>in</strong>g to the concentration of nitrogen<br />
and phosphorus, the Moste accumulation is on the boundary of mesotrophic and eutrophic status<br />
under OECD criteria, and the productivity of phytoplankton is h<strong>in</strong>dered by an occasional higher rate<br />
of flow <strong>in</strong> the accumulation.<br />
<strong>Quality</strong> of Mar<strong>in</strong>e <strong>Water</strong><br />
Seas and oceans cover more than two-thirds of the Earth’s surface. A very small portion of it belongs<br />
to <strong>Slovenia</strong>. The <strong>Slovenia</strong>n sea stretches 46 kilometres along the coast of the Trieste Bay. The Trieste<br />
Bay is the northern most part of the Mediterranean Sea, and lies at the <strong>in</strong>tersection of the Alps, the<br />
D<strong>in</strong>aric Alps and the Mediterranean. The sea <strong>in</strong> the Trieste Bay is shallow with the <strong>in</strong>flow of rivers<br />
conta<strong>in</strong><strong>in</strong>g untreated municipal and <strong>in</strong>dustrial wastewaters. The <strong>Slovenia</strong>n rivers that deposit the<br />
largest amounts of suspended particles and nutrients to the coastal sea are the Dragonja, Badaševica,<br />
Drnica, Rižana and Soča, which <strong>in</strong> its lower stream also receives wastewaters from Italy. But the Po River<br />
represents the largest burden for the Trieste Bay, s<strong>in</strong>ce more than a half of all municipal and <strong>in</strong>dustrial<br />
wastewaters <strong>in</strong> Italy flow <strong>in</strong>to it. For the entire coastal area of the <strong>Slovenia</strong>n sea and its h<strong>in</strong>terland,<br />
dense settlement, <strong>in</strong>tensive agriculture <strong>in</strong> some places, <strong>in</strong>dustry and tourism are characteristic.<br />
All these factors have an important <strong>in</strong>fluence on ecological processes and, as a consequence, on the<br />
status of the sea. In spite of large pressures from the rear area, a large variety of plant and animal
S U R F A C E W A T E R S<br />
species are characteristic for the <strong>Slovenia</strong>n sea. Between Koper and Isola there is an underwater<br />
Posidonia bed, which is an endangered Mediterranean endemite and is a part of the Natura 2000<br />
network.<br />
In compliance with the Rules of identification and classification of surface water bodies (15), six<br />
water bodies were determ<strong>in</strong>ed <strong>in</strong> the sea. The pressures and impacts analyses has shown that <strong>in</strong> the<br />
coastal area prevail <strong>in</strong>fluences from the land (agriculture, tourism, urban areas and <strong>in</strong>dustry) while <strong>in</strong><br />
the open sea area prevail transboundary impacts (the outfalls of the Po and Soča) and the impacts<br />
of mar<strong>in</strong>e traffic, atmospheric deposition and fisheries. Impacts com<strong>in</strong>g from land sources are less<br />
explicit <strong>in</strong> the open-sea area.<br />
In the previous years (35), the quality of mar<strong>in</strong>e water was evaluated as a chemical (7, 8) and trophic<br />
(36) status. The results are presented below. Ecological status assessment methods for the mar<strong>in</strong>e<br />
water <strong>in</strong> accordance with the <strong>Water</strong> Framework Directive is still <strong>in</strong> the course of preparation, as is the<br />
case with rivers and lakes. Sampl<strong>in</strong>g and analyses of biological quality elements are carried out <strong>in</strong><br />
compliance with ready-prepared expert documents (37, 38, 39). The system for assess<strong>in</strong>g the status<br />
of the mar<strong>in</strong>e waters us<strong>in</strong>g the chlorophyll-a has been def<strong>in</strong>ed, and it will be upgraded with analyses<br />
of other biological elements for the assessment of the ecological status.<br />
In the mar<strong>in</strong>e monitor<strong>in</strong>g network are <strong>in</strong>cluded four monitor<strong>in</strong>g sites. The basic monitor<strong>in</strong>g site (CZ)<br />
is situated <strong>in</strong> territorial waters, a reference monitor<strong>in</strong>g site (F) <strong>in</strong> the southern part of the Trieste Bay<br />
and two additional monitor<strong>in</strong>g sites <strong>in</strong> the coastal sea, <strong>in</strong> the Piran Bay (MA) and Koper Bay (K). The<br />
additional monitor<strong>in</strong>g sites <strong>in</strong> the vic<strong>in</strong>ity of the coastal sea are <strong>in</strong>fluenced by different sources of<br />
pollution. Monitor<strong>in</strong>g site K is <strong>in</strong> the vic<strong>in</strong>ity of the Port of Koper and the outflow of the Rižana, which<br />
conta<strong>in</strong>s municipal and some <strong>in</strong>dustry wastewaters, and monitor<strong>in</strong>g site MA is <strong>in</strong>fluenced by the<br />
Portorož Mar<strong>in</strong>a area.<br />
Strunjan<br />
35
36<br />
2.3.1<br />
2.3.2<br />
W A T E R Q U A L I T Y I N S L O V E N I A<br />
Evaluation of Chemical Status of Mar<strong>in</strong>e <strong>Water</strong><br />
The monitor<strong>in</strong>g of the chemical status is carried out <strong>in</strong> accordance with the Decree of chemical status<br />
of surface waters (7). It is determ<strong>in</strong>ed on the basis of annual average values of analysed parameters <strong>in</strong><br />
the water, for which limit values are specified <strong>in</strong> the above-mentioned Decree and by the monitor<strong>in</strong>g<br />
of the concentrations of some priority substances <strong>in</strong> the sediment. A good chemical status means<br />
that any average annual value of the parameters analysed <strong>in</strong> a selected monitor<strong>in</strong>g site does not<br />
exceed the limit value prescribed <strong>in</strong> the Decree, and that any parameter <strong>in</strong> the sediment does not<br />
show a tendency to <strong>in</strong>crease.<br />
In the years 2003 to 2006, analyses of metals <strong>in</strong> water and <strong>in</strong> the sediment, as well as analyses of<br />
priority and <strong>in</strong>dicative parameters (Table1), were carried out at selected monitor<strong>in</strong>g sites <strong>in</strong> the sea.<br />
The analyses showed that the concentrations of priority substances and <strong>in</strong>dicative parameters <strong>in</strong> water<br />
were under the limit values specified by the Decree of chemical status. The chemical status, based on<br />
analyses, <strong>in</strong> the years 2003 to 2006 was good at all monitor<strong>in</strong>g sites <strong>in</strong> the mar<strong>in</strong>e water (Map 4).<br />
Map 4: The chemical status of the mar<strong>in</strong>e water <strong>in</strong> the years 2003 to 2006<br />
Evaluation of Trophic Status of Mar<strong>in</strong>e <strong>Water</strong><br />
The trophic status of the mar<strong>in</strong>e water is evaluated on the basis of the trophic <strong>in</strong>dex – TRIX. The<br />
<strong>in</strong>dex is used for the assessment of a certa<strong>in</strong> mar<strong>in</strong>e environment. It is primarily <strong>in</strong>tended for coastal<br />
waters, such as the Trieste Bay. It is based upon the concentration of chlorophyll-a as an <strong>in</strong>dicator of<br />
phytoplanktonic biomass, the oxygen saturation, the transparency of the sea and nutrients (salts of<br />
nitrogen and phosphorus) concentration (36). High values <strong>in</strong> the TRIX <strong>in</strong>dex co<strong>in</strong>cide with <strong>in</strong>creased<br />
values of phytoplanktonic chlorophyll. The numeric scale of the TRIX <strong>in</strong>dex comprises values between 0<br />
and 10; lower values mean better mar<strong>in</strong>e water quality or an <strong>in</strong>significant eutrophication. Values of up<br />
to 4 mean a high trophic status, values from 4 to 5 mean a good trophic status, values from 5 to 6 mean<br />
a moderate trophic status and values above 6 mean a bad trophic status of the mar<strong>in</strong>e water.<br />
S<strong>in</strong>ce the year 2000, the trophic status of the mar<strong>in</strong>e water has been gradually improv<strong>in</strong>g. A<br />
presentation of the TRIX <strong>in</strong>dex for the period from 1997 to 2005 is given. The best trophic status of<br />
the sea was at the reference monitor<strong>in</strong>g site F. A similar status was at the basic monitor<strong>in</strong>g site CZ <strong>in</strong><br />
the middle of the Trieste Bay. The status at the monitor<strong>in</strong>g site MA was a little worse, and the worst<br />
status was at the monitor<strong>in</strong>g site K <strong>in</strong> Koper Bay (Chart 7).
��������������������������������������������<br />
2.4<br />
2.4.1<br />
���<br />
��<br />
��<br />
��<br />
��<br />
��<br />
��<br />
��<br />
��<br />
��<br />
�<br />
Chart 7: The trophic status of the mar<strong>in</strong>e water at <strong>in</strong>dividual monitor<strong>in</strong>g sites <strong>in</strong> the years 1997 to 2005<br />
����<br />
����<br />
����<br />
����<br />
����<br />
����<br />
����<br />
�������������������<br />
����<br />
����<br />
����<br />
����<br />
����<br />
����<br />
����<br />
����<br />
����<br />
����<br />
����<br />
����<br />
����<br />
����<br />
����<br />
����<br />
<strong>Water</strong> <strong>Quality</strong> <strong>in</strong> Protected Areas<br />
S U R F A C E W A T E R S<br />
����<br />
����<br />
����<br />
����<br />
����<br />
�� � � ��<br />
������������������� ��������������������� ������������������<br />
<strong>Quality</strong> of Surface <strong>Water</strong> Intended for the Abstraction of Dr<strong>in</strong>k<strong>in</strong>g <strong>Water</strong><br />
In many European countries, surface water represents a very important source of dr<strong>in</strong>k<strong>in</strong>g water,<br />
while <strong>in</strong> <strong>Slovenia</strong> only approximately 3% of the population is supplied with dr<strong>in</strong>k<strong>in</strong>g water from<br />
surface sources (40). Thirty years ago, the European Union has adopted two directives (41, 42) <strong>in</strong> order<br />
to protect these waters. They were transposed <strong>in</strong>to <strong>Slovenia</strong>n legislation <strong>in</strong> 2000 and 2001 (43, 44).<br />
National regulations summarize the mentioned guidel<strong>in</strong>es and requirements that surface sources<br />
of dr<strong>in</strong>k<strong>in</strong>g water should be classified <strong>in</strong>to three quality classes (A1, A2 <strong>in</strong> A3) based upon a fiveyear<br />
data set regard<strong>in</strong>g prescribed limit and guide values of physical, chemical and microbiological<br />
characteristics of surface water. Accord<strong>in</strong>g to the classification <strong>in</strong>to a certa<strong>in</strong> quality class, A1, A2 or<br />
A3, appropriate standard methods of water treatment are def<strong>in</strong>ed. They have to be carried out by<br />
Public Dr<strong>in</strong>k<strong>in</strong>g <strong>Water</strong> Supply Contractor, and provide wholesome sources of dr<strong>in</strong>k<strong>in</strong>g water.<br />
The monitor<strong>in</strong>g programme for the quality of surface water <strong>in</strong>tended for the abstraction of dr<strong>in</strong>k<strong>in</strong>g water<br />
(45) was accord<strong>in</strong>g to the legislation for the first time set down for a five-year period from 2002 to 2006.<br />
It <strong>in</strong>cluded the 11 surface sources of dr<strong>in</strong>k<strong>in</strong>g water: Rižana, Mrzlek, Podroteja, Ljubija, Hud<strong>in</strong>ja, Bistrica<br />
(near Slovenska Bistrica), Kolpa, Soča, Vipava, Veliki Obrh and Malenščica. These sources were selected on<br />
the basis of available data from the Institute of Public Health of the Republic of <strong>Slovenia</strong> at that time, and<br />
only those sources were <strong>in</strong>cluded which supply more than 800 <strong>in</strong>habitants. The list also <strong>in</strong>cluded waters<br />
with a direct outfall <strong>in</strong>to Karst aquifers that have a proven underground water flow with a short residence<br />
time. The number of <strong>in</strong>habitants supplied by a source at that time determ<strong>in</strong>ed the m<strong>in</strong>imum frequency of<br />
sampl<strong>in</strong>g of the surface water (once to four times a year) and the required analyses.<br />
The first classification of surface water <strong>in</strong>tended for the abstraction of dr<strong>in</strong>k<strong>in</strong>g water was made <strong>in</strong> 2002<br />
and published <strong>in</strong> the Official Gazette of the Republic of <strong>Slovenia</strong> (46). The surface sources of dr<strong>in</strong>k<strong>in</strong>g water,<br />
Ljubija, Hud<strong>in</strong>ja, Bistrica, Kolpa, Soča, Vipava, Veliki Obrh and Malenščica were classified <strong>in</strong>to quality classes<br />
accord<strong>in</strong>g to data perta<strong>in</strong><strong>in</strong>g to water treatment procedures provided by the Public Dr<strong>in</strong>k<strong>in</strong>g <strong>Water</strong> Supply<br />
Contractor. The Rižana, Mrzlek and Podroteja were classified accord<strong>in</strong>g to the monitor<strong>in</strong>g data <strong>in</strong> the<br />
years 1998 to 2002. The required five-year data set regard<strong>in</strong>g the quality of all surface sources of dr<strong>in</strong>k<strong>in</strong>g<br />
water was therefore gathered solely by the monitor<strong>in</strong>g of the quality of surface water <strong>in</strong>tended for the<br />
abstraction of dr<strong>in</strong>k<strong>in</strong>g water <strong>in</strong> the years 2002 to 2006. Based upon these data, the classification of surface<br />
water <strong>in</strong>tended for the abstraction of dr<strong>in</strong>k<strong>in</strong>g water <strong>in</strong>to quality classes was made; the classifications are<br />
shown <strong>in</strong> Table 9 and <strong>in</strong> Map 5.<br />
����<br />
����<br />
����<br />
����<br />
����<br />
����<br />
����<br />
����<br />
37
38<br />
W A T E R Q U A L I T Y I N S L O V E N I A<br />
Table 9: The Classification of surface water <strong>in</strong>tended for the abstraction of dr<strong>in</strong>k<strong>in</strong>g water <strong>in</strong>to quality classes based upon<br />
monitor<strong>in</strong>g data <strong>in</strong> the years 1998 to 2006<br />
Surface water <strong>in</strong>tended<br />
for the abstraction of<br />
dr<strong>in</strong>k<strong>in</strong>g water<br />
The first<br />
classification<br />
<strong>in</strong> 2002<br />
Classification <strong>in</strong> quality classes on the basis of a five-year data set<br />
1998–2002 1999–2003 2000–2004 2001–2005 2002–2006<br />
Rižana A3 A2 A3 A3 A3 A3<br />
Mrzlek A2 A2 A2 A2 A2 A2<br />
Ljubija A2 - - - - A2<br />
Malenščica A3 - - - - A2<br />
Hud<strong>in</strong>ja A1 - - - - A3<br />
Bistrica A1 - - - - A2<br />
Podroteja A2 A2 A2 A2 A2 A2<br />
Soča A2 - - - - A3<br />
Vipava A2 - - - - A2<br />
Kolpa A2 - - - - A2<br />
Veliki Obrh A1 - - - - A2<br />
A1, A2, A3: quality classes from the best to the worse<br />
- Five-year data set is not available<br />
The results of the monitor<strong>in</strong>g of the quality of surface water <strong>in</strong>tended for the abstraction of dr<strong>in</strong>k<strong>in</strong>g<br />
water show that surface sources of dr<strong>in</strong>k<strong>in</strong>g water reach the quality of A1 class accord<strong>in</strong>g to most<br />
physical and chemical parameters. Occasionally exceeded microbiological parameters were the reason<br />
for the classification of the surface sources Mrzlek, Podroteja, Ljubija, Bistrica, Kolpa, Vipava, Veliki<br />
Obrh and Malenščica <strong>in</strong>to class A2. The Rižana has been classified <strong>in</strong>to class A3 due to the occasional<br />
presence of Salmonella <strong>in</strong> water. Salmonella was also identified <strong>in</strong> one out of seven samples from the<br />
Soča, which consequently also caused the classification of the Soča <strong>in</strong>to class A3. In the June 2006<br />
sample from the Hud<strong>in</strong>ja, the limit values of class A2 regard<strong>in</strong>g total coliforms and faecal coliforms<br />
were exceeded, which classified the Hud<strong>in</strong>ja <strong>in</strong>to class A3. Regard<strong>in</strong>g the first classification <strong>in</strong> 2002,<br />
the quality of the surface sources Rižana, Mrzlek, Podroteja, Ljubija, Kolpa and Vipava rema<strong>in</strong>ed the<br />
same; the quality deteriorated <strong>in</strong> the soureces Hud<strong>in</strong>ja (from A1 to A3), Bistrica (from A1 to A2), Soča<br />
(from A2 to A3) and Veliki Obrh (from A1 to A2), and it improved <strong>in</strong> the Malenščica (from A3 to A2). It<br />
has to be noted that the Hud<strong>in</strong>ja is not a constant source of dr<strong>in</strong>k<strong>in</strong>g water, because of its turbidity<br />
<strong>in</strong> the event of ra<strong>in</strong>fall and is therefore used only <strong>in</strong> the dry season. The Veliki Obrh is also an auxiliary<br />
source of dr<strong>in</strong>k<strong>in</strong>g water, as the majority of water is supplied from the well <strong>in</strong> Ko<strong>za</strong>rišče while the<br />
Kolpa as a water source is gradually be<strong>in</strong>g phased out and a l<strong>in</strong>kage of the water supply network<br />
to the Dobličica source is planned. Public Dr<strong>in</strong>k<strong>in</strong>g <strong>Water</strong> Supply Contractors carry out an <strong>in</strong>ternal<br />
monitor<strong>in</strong>g of the quality of the source of dr<strong>in</strong>k<strong>in</strong>g water and are aware of microbiological pollutions.<br />
In the Ljubija and Bistrica, the use of ultrafiltration is therefore planned, to remove the suspended<br />
substances and particles of more than 0.01 μm <strong>in</strong> size and microorganisms, <strong>in</strong>clud<strong>in</strong>g bacteria and<br />
viruses from the water.<br />
Rižana spr<strong>in</strong>g Ljubija spr<strong>in</strong>g
S U R F A C E W A T E R S<br />
Map 5: Classification of the surface water <strong>in</strong>tended for the abstraction of dr<strong>in</strong>k<strong>in</strong>g water based upon the monitor<strong>in</strong>g data <strong>in</strong> the years<br />
2002 to 2006<br />
39
40<br />
2.4.2<br />
W A T E R Q U A L I T Y I N S L O V E N I A<br />
<strong>Quality</strong> of Bath<strong>in</strong>g <strong>Water</strong><br />
In our modern way of life, it is almost impossible for us to dedicate some time to sports and recreation,<br />
even though <strong>Slovenia</strong>n rivers, lakes and a part of the Adriatic Sea offer various water-related sports -<br />
from traditional bath<strong>in</strong>g and boat<strong>in</strong>g for relaxation to adrenal<strong>in</strong>e-<strong>in</strong>duc<strong>in</strong>g white-water descents over<br />
waterfalls and rapids. With the <strong>in</strong>tention of protect<strong>in</strong>g bathers’ health, <strong>in</strong> 1976 with<strong>in</strong> the European<br />
Union region the Bath<strong>in</strong>g <strong>Water</strong> Directive (48) was adopted. The requirements of the directive were<br />
fully transposed also <strong>in</strong>to <strong>Slovenia</strong>n legislation <strong>in</strong> 2003 (49, 50). Its implementation is shared by<br />
M<strong>in</strong>istry of the Environment and Spatial Plann<strong>in</strong>g and M<strong>in</strong>istry of Health. The quality of bath<strong>in</strong>g water<br />
is monitored <strong>in</strong> 37 natural bath<strong>in</strong>g waters dur<strong>in</strong>g the bath<strong>in</strong>g season, which lasts from 15th June to<br />
31st August <strong>in</strong> fresh waters and from 15th June to 30th September <strong>in</strong> coastal waters. Dur<strong>in</strong>g this<br />
period, bath<strong>in</strong>g water is sampled at least every 14 days. In bath<strong>in</strong>g waters where bath<strong>in</strong>g is explicitly<br />
authorized, the bath<strong>in</strong>g water quality monitor<strong>in</strong>g is organised by the bath<strong>in</strong>g water operator who<br />
provides the data to the bath<strong>in</strong>g water register at the Institute of Public Health of the Republic of<br />
<strong>Slovenia</strong>; <strong>in</strong> the other bath<strong>in</strong>g waters, monitor<strong>in</strong>g is carried out by the Environmental Agency of the<br />
Republic of <strong>Slovenia</strong> (51). Dur<strong>in</strong>g the sampl<strong>in</strong>g, the presence of visible impurities, phenols, m<strong>in</strong>eral oils<br />
and surface-active substances are assessed, and <strong>in</strong> the laboratory, further physico-chemical analyses<br />
(phenols, m<strong>in</strong>eral oils, surface-active substances) and analyses for the presence of microbiological<br />
pollutants (total coliforms, feacal coliforms and feacal streptococci) are carried out. The quality results<br />
are presented <strong>in</strong> annual report on the quality of natural bath<strong>in</strong>g waters (47) and also <strong>in</strong> report to the<br />
European Commission on the implementation of the Bath<strong>in</strong>g <strong>Water</strong> Directive (52), which must be<br />
sent to the competent <strong>in</strong>stitutions <strong>in</strong> Brussels by the end of each year. Based on the Member States’<br />
annual reports, the Commission draws up a summary report and publishes it on the <strong>in</strong>ternet (53),<br />
with the aim to <strong>in</strong>form the public on the quality of bath<strong>in</strong>g water quality <strong>in</strong> the European Union and<br />
<strong>in</strong> each <strong>in</strong>dividual Member State. The <strong>in</strong>formation about the bath<strong>in</strong>g water quality is also available<br />
on the <strong>in</strong>formation boards set up <strong>in</strong> the bath<strong>in</strong>g water areas; <strong>in</strong> addition, all reports are available on<br />
the websites of the Environmental Agency of the Republic of <strong>Slovenia</strong> and of the Institute of Public<br />
Health of the Republic of <strong>Slovenia</strong>.<br />
Already at the end of 2004, <strong>Slovenia</strong> has for the first time reported to the Commission the results of<br />
the bath<strong>in</strong>g water quality, even it had been a member of the European Union for only six months. Our<br />
report<strong>in</strong>g obligation is carried out with diligence and the monitor<strong>in</strong>g data from 2004 to 2006 (Chart<br />
8) show that occasionally exceeded microbiological parameters were the only reason for the noncompliance<br />
of the freshwater and coastal bath<strong>in</strong>g waters. Consider<strong>in</strong>g the strict statistical evaluation
Soča, Čezsoča Nadiža, Robič<br />
Bath<strong>in</strong>g area, Izola Kolpa, Adlešiči<br />
S U R F A C E W A T E R S<br />
of the results, the quality of natural bath<strong>in</strong>g waters <strong>in</strong> <strong>Slovenia</strong> improved substantially <strong>in</strong> 2006. Namely,<br />
<strong>in</strong> 2005, 50% of <strong>Slovenia</strong>n freshwater bath<strong>in</strong>g waters were not <strong>in</strong> compliance with mandatory values<br />
of the Bath<strong>in</strong>g <strong>Water</strong> Directive (38.9% <strong>in</strong> 2004), and <strong>in</strong> 2006, only 16.7% rema<strong>in</strong>ed non-compliant.<br />
In the non-compliant bath<strong>in</strong>g waters (the Krka – bath<strong>in</strong>g waters Straža and Žužemberk, the Kolpa<br />
– bath<strong>in</strong>g water Učakovci – V<strong>in</strong>ica), the mandatory values of some microbiological parameters were<br />
slightly exceeded only once <strong>in</strong> 2006, due to unstable weather and surface r<strong>in</strong>s<strong>in</strong>g dur<strong>in</strong>g storms and<br />
ra<strong>in</strong> showers (Maps 6 and 7). There certa<strong>in</strong>ly are some opportunities for the improvement of the<br />
<strong>Slovenia</strong>n freshwater bath<strong>in</strong>g water quality, but with the total compliance of coastal bath<strong>in</strong>g waters<br />
<strong>in</strong> 2006 (94.7% compliance <strong>in</strong> 2005), <strong>Slovenia</strong> is at the top of water quality. Moreover: <strong>in</strong> 2006, 16 out<br />
of 18 coastal bath<strong>in</strong>g waters also fulfilled striker-recommended requirements of the Bath<strong>in</strong>g <strong>Water</strong><br />
Directive (Map 8). Not even all of the old Member States of the European Union reach such high<br />
compliance with the requirements of the Directive, although the Directive has been implemented<br />
s<strong>in</strong>ce 1976 and numerous measures have already been taken to improve the bath<strong>in</strong>g water quality.<br />
The Commission has even established that, <strong>in</strong> the years of report<strong>in</strong>g, some countries were remov<strong>in</strong>g<br />
numerous bath<strong>in</strong>g waters from their national lists, <strong>in</strong> order to conceal the pollution and falsely<br />
improve the statistics of the bath<strong>in</strong>g water quality. Due to such practice, the Commission <strong>in</strong>itiated<br />
legal procedures aga<strong>in</strong>st 11 Member States <strong>in</strong> 2006; <strong>Slovenia</strong> is not among them.<br />
In the first phase, <strong>Slovenia</strong> is endeavour<strong>in</strong>g to collect reliable sets of data on bath<strong>in</strong>g water quality,<br />
which will be used for the plann<strong>in</strong>g of measures to be taken to achieve a required bath<strong>in</strong>g water<br />
quality. Construction of numerous water treatment plants <strong>in</strong> the bath<strong>in</strong>g water catchment areas,<br />
which are planned <strong>in</strong> the Operative Programme for the Urban Wastewater Collect<strong>in</strong>g and Treatment,<br />
will certa<strong>in</strong>ly contribute to the quality of <strong>Slovenia</strong>n waters.<br />
41
42<br />
�������������<br />
W A T E R Q U A L I T Y I N S L O V E N I A<br />
Chart 8: Freshwater and coastal bath<strong>in</strong>g water quality <strong>in</strong> the years 2004 to 2006<br />
���<br />
��<br />
��<br />
��<br />
��<br />
�<br />
�������������������������<br />
���<br />
����<br />
����<br />
����<br />
��<br />
����<br />
����<br />
���� ���� ����<br />
�������������������<br />
���������������������������������������<br />
�����������������������������������<br />
�������������������������������<br />
������������<br />
���<br />
��<br />
��<br />
��<br />
��<br />
�<br />
����<br />
����<br />
����<br />
����������������������<br />
����<br />
����<br />
���<br />
����<br />
���� ���� ����<br />
���� ���� ����<br />
Map 6: <strong>Quality</strong> of bath<strong>in</strong>g waters <strong>in</strong> the Gorenjska and Goriška region <strong>in</strong> 2006<br />
����
Map 7: <strong>Quality</strong> of bath<strong>in</strong>g waters <strong>in</strong> the Dolenjska and Notranjska region <strong>in</strong> 2006<br />
Map 8: <strong>Quality</strong> of coastal bath<strong>in</strong>g waters <strong>in</strong> 2006<br />
S U R F A C E W A T E R S<br />
43
44<br />
2.4.3<br />
W A T E R Q U A L I T Y I N S L O V E N I A<br />
<strong>Quality</strong> of Freshwater need<strong>in</strong>g Protection or Improvement <strong>in</strong> order to support<br />
Fish Life<br />
The consequence of great natural diversity and relatively clean waters <strong>in</strong> <strong>Slovenia</strong> is a great variety of<br />
aquatic life. In the <strong>Slovenia</strong>n rivers, around 40 species of fish live <strong>in</strong> the Adriatic and over 70 fish species<br />
<strong>in</strong> the Danube river bas<strong>in</strong>. Specific conditions <strong>in</strong> rivers, like temperature, flow rate, hydromorphological<br />
characteristics, as well as physico-chemical elements change significantly <strong>in</strong> the river bed from its<br />
spr<strong>in</strong>g to its outfall <strong>in</strong>to the sea. The conditions <strong>in</strong>fluence on the composition of the fish population<br />
as well. <strong>Slovenia</strong> is one of the rare countries <strong>in</strong> the world where the rivers are clean enough to provide<br />
liv<strong>in</strong>g conditions for numerous salmonid fish species, such as marble (Soča trout), brown and brook<br />
trout, the Danube salmon and grayl<strong>in</strong>g.<br />
In <strong>Slovenia</strong>, all together 22 freshwater sections, important for the life of fish species were determ<strong>in</strong>ed<br />
<strong>in</strong> 2005. Among them, 13 were designated as salmonid and 9 as cypr<strong>in</strong>id waters (55). Salmonid waters<br />
should provide liv<strong>in</strong>g conditions for the salmonid fish species, like trouts, grayl<strong>in</strong>gs and Danube<br />
salmons and cypr<strong>in</strong>id waters for the cypr<strong>in</strong>id fish species like carps, pikes, perches, etc. The purpose<br />
of the fish water designations is the protection or improvement of the water quality, which provides<br />
liv<strong>in</strong>g conditions for freshwater fish species.<br />
S<strong>in</strong>ce 2003, the Environmental Agency of the Republic of <strong>Slovenia</strong> has been monitor<strong>in</strong>g water<br />
quality <strong>in</strong> the above-mentioned sections <strong>in</strong> compliance with national regulations (54, 56, 57). These<br />
regulations transpose Directive 78/658/EEC on the quality of fresh waters need<strong>in</strong>g protection or<br />
improvement <strong>in</strong> order to support fish life, which was codified with the Directive 2006/44/ES (58). The<br />
aim of this Directive is to protect or improve the quality of those runn<strong>in</strong>g or stand<strong>in</strong>g fresh waters<br />
that support, or which, if pollution were reduced or elim<strong>in</strong>ated, would become capable of support<strong>in</strong>g<br />
fish belong<strong>in</strong>g to <strong>in</strong>digenous species and species the presence of which is judged desirable for water<br />
management purposes.<br />
For their life and growth, fish require good liv<strong>in</strong>g conditions, <strong>in</strong>clud<strong>in</strong>g good water quality. Too low or<br />
too high temperatures, too high concentrations of ammonia, chlor<strong>in</strong>e, nitrite, oxygen deficiency and<br />
toxic substances <strong>in</strong> water primarily endanger the life of fish.<br />
In the monitor<strong>in</strong>g of water quality need<strong>in</strong>g protection or improvement <strong>in</strong> order to support fish life,<br />
the parameters that provide optimal liv<strong>in</strong>g conditions for the fishes, are <strong>in</strong>cluded. In compliance with<br />
the Decree on the quality of fresh waters support<strong>in</strong>g fish life (56), temperature, dissolved oxygen,<br />
pH, suspended solids, biochemical oxygen demand <strong>in</strong> 5 days (BOD ), concentration of phosphorus,<br />
5<br />
nitrite, ammonia, ammonium, total residual chlor<strong>in</strong>e, total z<strong>in</strong>c and dissolved copper are evaluated <strong>in</strong><br />
the water samples, collected at all monitor<strong>in</strong>g sites of the salmonid and cypr<strong>in</strong>id waters. The samples<br />
are collected and analysed monthly.<br />
Sava, Otoče<br />
Vipava, Miren
S U R F A C E W A T E R S<br />
Compliant to the regulations, the quality of fresh water needed for the life of fish species is evaluated for each<br />
year <strong>in</strong>dividually, accord<strong>in</strong>g to the mandatory and guide values for salmonid and cypr<strong>in</strong>id waters, specified<br />
<strong>in</strong> Table 10. Only the results of the samples collected <strong>in</strong> exceptional natural conditions are excluded. The<br />
mandatory or guide values of salmonid and cypr<strong>in</strong>id waters are not exceeded, if the measurements of the<br />
samples collected with<strong>in</strong> the m<strong>in</strong>imum frequency of a one-year period shows that:<br />
• 95% of samples do not exceed the mandatory or guide values for the parameters pH, BOD , non-<br />
5<br />
ionized ammonia, total ammonium, nitrite, total residual chlor<strong>in</strong>e, total z<strong>in</strong>c and dissolved copper;<br />
when the sampl<strong>in</strong>g frequency is lower than one sample per month, both the abovementioned<br />
values and comments shall be respected for all the samples,<br />
• the percentage of samples perta<strong>in</strong><strong>in</strong>g to the ‘dissolved oxygen’ parameter, as listed <strong>in</strong> Table 10, is<br />
not lower than the mandatory or guide values,<br />
• the average concentration def<strong>in</strong>ed for the ‘suspended solids’, does not exceed the mandatory or<br />
guide values.<br />
Salmonid or cypr<strong>in</strong>id water is of not compliant quality and is considered over polluted if the<br />
results, accord<strong>in</strong>g to the above-mentioned evaluation show that the mandatory values have been<br />
exceeded.<br />
Table 10: Mandatory and guide values for salmonid and cypr<strong>in</strong>id waters<br />
Parameter Expressed<br />
as<br />
Unit<br />
Dissolved oxygen (1) O 2 mg/L<br />
pH<br />
Salmonid waters Cypr<strong>in</strong>id waters<br />
Guide value<br />
50% ≥ 9<br />
100% ≥ 7<br />
Mandatory<br />
value<br />
50% ≥ 9<br />
100% ≥ 6<br />
6 - 9<br />
∆± 0.5 (2)<br />
Guide value<br />
50% ≥ 8<br />
100% ≥ 5<br />
Mandatory<br />
value<br />
50% ≥ 7<br />
100% ≥ 4<br />
6 - 9<br />
∆± 0.5 (2)<br />
Suspended solids mg/L ≤ 25 ≤ 25<br />
BOD5 O2 mg/L ≤ 3 ≤ 6<br />
Total phosphorus PO4 mg/L ≤ 0.2 ≤ 0.4<br />
Nitrite NO2 mg/L ≤ 0.01 ≤ 0.03<br />
Ammonia NH3 mg/L ≤ 0.005 ≤ 0.025 ≤ 0.005 ≤ 0.025<br />
Ammonium NH4 mg/L ≤ 0.04 ≤ 1 ≤ 0.2 ≤ 1<br />
Total residual chlor<strong>in</strong>e HOCl mg/L ≤ 0.005 ≤ 0.005<br />
Total z<strong>in</strong>c (3) , Zn mg/L 0.3 1.0<br />
Dissolved copper (3) , Cu mg/L 0.04 0.04<br />
(1) The percentage represents the number of samples collected <strong>in</strong> a one-year period<br />
(2) Artificially <strong>in</strong>duced pH changes must not exceed ± 0.5<br />
(3) The values coresponded to water hardness of 100 mg/L CaCO3<br />
The quality of salmonid and cypr<strong>in</strong>id waters <strong>in</strong> 2006 is shown <strong>in</strong> Map 9. In salmonid water sections,<br />
the mandatory values were not exceeded at any monitor<strong>in</strong>g sites; <strong>in</strong> cypr<strong>in</strong>id water sections, a not<br />
compliant quality of the Dragonja at Podkaštel was determ<strong>in</strong>ed due to too low oxygen concentration<br />
<strong>in</strong> one sample.<br />
The assessment of the salmonid and cypr<strong>in</strong>id water sections quality <strong>in</strong> the years 2003 to 2006 is<br />
presented <strong>in</strong> Table 11; not compliant parameters are shown <strong>in</strong> Table 12.<br />
45
46<br />
W A T E R Q U A L I T Y I N S L O V E N I A<br />
Table 11: Evaluation of the quality of salmonid and cypr<strong>in</strong>id water sections <strong>in</strong> the years 2003 to 2006<br />
RIVER Section Monitor<strong>in</strong>g site 2003 2004 2005 2006<br />
MURA from the road bridge Petanjci to the outfall of the Ščavnica Mota compliant compliant compliant compliant<br />
DRAVA from the dam Melje to Borl Borl not compliant compliant not compliant compliant<br />
compliant compliant compliant compliant<br />
Sava Boh<strong>in</strong>jka above the<br />
outfall of the Jezernica<br />
from the outfall of the Mostnica to the confluence of the Sava<br />
Boh<strong>in</strong>jka and Sava Dol<strong>in</strong>ka<br />
SAVA<br />
BOHINJKA<br />
SAVA from the Sava Boh<strong>in</strong>jka and Sava Dol<strong>in</strong>ka to the outfall of the Kokra Otoče compliant compliant compliant compliant<br />
SAVA from the road bridge Medvode to Šentjakob Šentjakob compliant compliant compliant compliant<br />
SORA from the outfall of the Žirovniščica to the outfall <strong>in</strong>to the Sava Medvode compliant compliant compliant compliant<br />
MIRNA from the spr<strong>in</strong>g to Boštanj Boštanj compliant compliant compliant compliant<br />
KOLPA from the outfall of the Čabranka to the outfall of the Lah<strong>in</strong>ja Adlešiči compliant compliant compliant compliant<br />
KOLPA from the outfall of the Lah<strong>in</strong>ja to the state border at Božakovo Radoviči (Metlika) compliant compliant compliant compliant<br />
LJUBLJANICA from the spr<strong>in</strong>g to Livada Livada compliant compliant not compliant compliant<br />
SAVINJA from the outfall of the Dreta to the outfall of the Bolska Male Braslovče not compliant compliant not compliant compliant<br />
SAVINJA from the outfall of the Bolska to Veliko Širje Veliko Širje compliant compliant compliant compliant<br />
KRKA from the spr<strong>in</strong>g of Krka - Gradiček to the outfall of the Bršl<strong>in</strong>ski potok Srebrniče compliant compliant not compliant compliant<br />
KRKA from the outfall of the Bršl<strong>in</strong>ski potok to the outfall <strong>in</strong>to the Sava Krška vas compliant compliant compliant compliant<br />
SOČA from the spr<strong>in</strong>g to the outfall of the Tolm<strong>in</strong>ka Trnovo compliant compliant compliant compliant<br />
IDRIJCA from the spr<strong>in</strong>g to the outfall <strong>in</strong>to the Soča Hotešk compliant compliant compliant compliant<br />
VIPAVA from the spr<strong>in</strong>g to the outfall of the Vrtov<strong>in</strong>šček Velike Žablje compliant compliant not compliant compliant<br />
VIPAVA from the outfall of the Vrtov<strong>in</strong>šček to the outfall of the Vrtojbica Miren compliant compliant compliant compliant<br />
NADIŽA From the state border to the state Robič compliant compliant compliant compliant<br />
REKA from Zabiče to Cerkvenikov ml<strong>in</strong> Cerkvenikov ml<strong>in</strong> (the mill) compliant compliant compliant compliant<br />
REKA from Cerkvenikov ml<strong>in</strong> to Matavun Matavun compliant compliant compliant compliant<br />
DRAGONJA from Škrl<strong>in</strong>e to the border cross<strong>in</strong>g po<strong>in</strong>t Dragonja Podkaštel compliant not compliant compliant not compliant
S U R F A C E W A T E R S<br />
Table 12: Parameters not compliant with mandatory values <strong>in</strong> cypr<strong>in</strong>id and salmonid water <strong>in</strong> the years 2003 to 2006<br />
SALMONID WATE<strong>RS</strong> YEAR<br />
Oxygen Oxygen Ammonia Ammonium<br />
% < 6 mg/L % < 9 mg/L 0% > 0.025 mg/L % > 1mg/L<br />
SAVINJA MALE BRASLOVČE 2003 0 0 25 0<br />
LJUBLJANICA LIVADA 2005 0 67 17 17<br />
SAVINJA MALE BRASLOVČE 2005 0 33 0 17<br />
KRKA SREBRNIČE 2005 0 67 0 0<br />
VIPAVA VELIKE ŽABLJE 2005 0 58 0 0<br />
CRITERIA FOR SALMONID WATE<strong>RS</strong><br />
CYPRINID WATE<strong>RS</strong> YEAR<br />
MV MV MV MV<br />
0% < 6 mg/L 50% < 9 mg/L 0% > 0.025 mg/L 0% > 1mg/L<br />
Oxygen Oxygen Ammonia Ammonium<br />
% < 4mg/L % < 7 mg/L % > 0.025 mg/L % > 1 mg/L<br />
DRAVA BORL 2003 0 0 25 0<br />
DRAGONJA PODKAŠTEL 2004 0 8 8 0<br />
DRAVA BORL 2005 0 8 0 8<br />
DRAGONJA PODKAŠTEL 2006 8 8 0 0<br />
CRITERIA FOR CYPRINID WATE<strong>RS</strong><br />
MV MV MV MV<br />
0% < 4 mg/L 50% < 7 mg/L 0% > 0.025 mg/L 0% > 1 mg/L<br />
Not compliant with the criteria Compliant with the criteria<br />
Mandatory value for salmonid waters Mandatory value for cypr<strong>in</strong>id waters<br />
More frequently than mandatory values, guide values for parameters are exceeded. These values<br />
do not classify the salmonid and cypr<strong>in</strong>id waters <strong>in</strong>to the category of not compliant. However, they<br />
show, which parameters are for fish the most problematic <strong>in</strong> <strong>Slovenia</strong>n rivers. One of the first such<br />
parameter is the concentration of nitrite, followed by the concentration of total ammonium and nonionized<br />
ammonia (Charts 8 and 9). Increased concentrations of these parameters are <strong>in</strong> most cases<br />
caused by discharges of untreated municipal wastewater, discharges from municipal water treatment<br />
plants and from animal farms.<br />
Chart 9: The share of exceeded guide values <strong>in</strong> cypr<strong>in</strong>id waters <strong>in</strong> 2006<br />
������������������������<br />
�������������������<br />
�����������������������<br />
������������������<br />
Chart 10: The share of exceeded guide values <strong>in</strong> salmonid waters <strong>in</strong> 2006<br />
�������������������������<br />
�������������������<br />
�����������������������<br />
������������������<br />
�����������������������<br />
�������������� �<br />
����������������������<br />
������������������<br />
������������������������<br />
������������������<br />
47
48<br />
W A T E R Q U A L I T Y I N S L O V E N I A<br />
Map 9: <strong>Water</strong> quality evaluation of salmonid and cipr<strong>in</strong>id waters <strong>in</strong> 2006
2.4.4<br />
<strong>Quality</strong> of Shellfish <strong>Water</strong>s<br />
S U R F A C E W A T E R S<br />
Shellfish are molluscs liv<strong>in</strong>g <strong>in</strong> hard shells. Their shells can be of various shapes and they protect their<br />
soft bodies from threaten<strong>in</strong>g dangers. Many shellfish live <strong>in</strong> the sand or mud at the sea bottom, some<br />
can be found attached to a hard surface (rock), and some move around by swimm<strong>in</strong>g. They feed on t<strong>in</strong>y<br />
particles of food float<strong>in</strong>g <strong>in</strong> the water - they open their shells and filter the water through their gills.<br />
Shellfish are popular as food as well. If they are grown for the market, special floats are made <strong>in</strong><br />
shellfish farms, thus provid<strong>in</strong>g them with conditions similar to those of their natural environment.<br />
Because of filter<strong>in</strong>g the water, they improve water quality, but at the same time ha<strong>za</strong>rdous substances<br />
accumulate <strong>in</strong> their bodies. It is therefore essential that the shellfish <strong>in</strong>tended for human consumption<br />
live <strong>in</strong> a clean environment. In the 1980’s the European Union adopted the Directive on the quality<br />
required for shellfish waters (59). Directive requires that the Member States protect and/or improve<br />
the quality of coastal and brackish water bodies <strong>in</strong> which shellfish live, <strong>in</strong> order to contribute to the<br />
quality of edible shellfish products.<br />
The above-mentioned Directive was entirely translated <strong>in</strong>to the <strong>Slovenia</strong>n legislation with the<br />
Decree on the quality required of water support<strong>in</strong>g mar<strong>in</strong>e bivalves and gastropods (60), Rules for<br />
the monitor<strong>in</strong>g of the quality of waters support<strong>in</strong>g mar<strong>in</strong>e bivalves and gastropods (61) and Rules on<br />
the determ<strong>in</strong><strong>in</strong>g mar<strong>in</strong>e areas where the quality of water is suitable to support mar<strong>in</strong>e bivalves and<br />
gastropods (62).<br />
Monitor<strong>in</strong>g accord<strong>in</strong>g to these regulations has been carried out s<strong>in</strong>ce 2003 (63). Three monitor<strong>in</strong>g<br />
sites have been chosen <strong>in</strong> the shellfish grow<strong>in</strong>g areas, i.e. <strong>in</strong> the Piran Bay, Strunjan Bay (monitor<strong>in</strong>g<br />
sites 0035 and 0024) and at Debeli rtič (monitor<strong>in</strong>g site 00DB).<br />
The basic physico-chemical parameters, organic halogens, metals <strong>in</strong> water, and cadmium and mercury<br />
<strong>in</strong> both sediment and molluscs flesh are monitored, as part of the programme, with the frequency of<br />
twice to 12 times a year. In the period from June to October, analyses of toxic phytoplankton are also<br />
<strong>in</strong>cluded <strong>in</strong> the programme.<br />
Map 10: Shellfish grow<strong>in</strong>g areas, and monitor<strong>in</strong>g sites<br />
49
50<br />
W A T E R Q U A L I T Y I N S L O V E N I A<br />
The quality of required of shellfish waters is evaluated annually. <strong>Water</strong> needed for the life and growth<br />
of mar<strong>in</strong>e bivalves and gastropods is of suitable quality if:<br />
• 100% of samples do not exceed the mandatory or guide values for organic halogens and metals,<br />
• 95% of samples are not lower than the mandatory or guide values for dissolved oxygen,<br />
• 75% of samples do not exceed the mandatory or guide values for all other parameters.<br />
The mandatory and guide values required for the quality of shellfish waters are shown <strong>in</strong> Table 13.<br />
Table 13: The mandatory and guide values for the quality of shellfish waters<br />
Parameter Expressed as Unit Guide value Mandatory value<br />
pH 7.5-8.5 7-9<br />
Oxygen saturation O 2 % > 80<br />
M<strong>in</strong>eral oils (4) (3)<br />
Organic halogen compounds:<br />
Metals:<br />
1,2 dichloroethane µg/L 10<br />
> 70 (1)<br />
> 60 (2)<br />
Hexachlorobenzene (4) µg/L 0.03<br />
Hexachlorobutadiene (4) µg/L 0.1<br />
Hexachlorocyclohexane (4) µg/L 0.05<br />
Tetrachloroethene µg/L 10<br />
Trichloroethene µg/L 10<br />
Trichloromethane µg/L 12<br />
Cadmium (4), (5) Cd µg/L 0.5<br />
Chromium Cr µg/L 10<br />
Copper Cu µg/L 5<br />
Mercury (4), (5) Hg µg/L 0.3<br />
Nickel Ni µg/L 10<br />
Lead Pb µg/L 10<br />
Z<strong>in</strong>c Zn µg/L 100<br />
Fecal coliforms Number of bacteria FC/100 mL < 300 (6)<br />
(1)<br />
Average value,<br />
(2)<br />
Individual measur<strong>in</strong>g,<br />
(3)<br />
The parameter must not be present <strong>in</strong> the water <strong>in</strong> an amount to:<br />
– produce a visible film on the surface of the water and/or on mar<strong>in</strong>e molluscs and<br />
mar<strong>in</strong>e gastropods, or<br />
– have harmful effects on mar<strong>in</strong>e molluscs and mar<strong>in</strong>e gastropods,<br />
(4)<br />
The content is also assessed <strong>in</strong> the sediments,<br />
(5)<br />
The content of organohalogented supstances or metals <strong>in</strong> the molluscs and gastropods flesh is low enough to enable their<br />
direct consumption.<br />
(6)<br />
The content can also be assessed <strong>in</strong> the molluscs and gastropods flesh.<br />
(4)
Strunjan<br />
S U R F A C E W A T E R S<br />
The assessment of the quality of waters support<strong>in</strong>g mar<strong>in</strong>e bivalves and gastropods <strong>in</strong> the years 2003<br />
to 2006 shows that, dur<strong>in</strong>g the entire period, water at all three monitor<strong>in</strong>g sites was compliant with<br />
the criteria def<strong>in</strong>ed <strong>in</strong> the Decree (Chart 14, Map 10). The physico-chemical parameters did not deviate<br />
from the prescribed mandatory values, and neither did fecal coliforms or the concentrations of organic<br />
halogens. Heavy metals were <strong>in</strong> low concentrations present <strong>in</strong> the water, but the concentrations were<br />
below the mandatory values <strong>in</strong> all monitor<strong>in</strong>g sites.<br />
Table 14: The shellfish water quality <strong>in</strong> the years 2003 to 2006<br />
Mar<strong>in</strong>e areas determ<strong>in</strong>ed as<br />
shellfish grow<strong>in</strong>g areas<br />
Monitor<strong>in</strong>g site 2003 2004 2005 2006<br />
Debeli rtič 00DB compliant compliant compliant compliant<br />
Strunjan 0024 compliant compliant compliant compliant<br />
Sečovlje 0035 compliant compliant compliant compliant<br />
51
3 Groundwater<br />
3.1<br />
Aquifers and Groundwater Bodies<br />
Surface waters and groundwater differ from one another <strong>in</strong> many aspects. We are often fasc<strong>in</strong>ated by<br />
the unique beauty of <strong>Slovenia</strong>n rivers and lakes. But it is not so easy to appreciate the richness and<br />
beauty of the waters beneath the Earth’s surface. Groundwater is a valuable source mostly hidden<br />
from our eyes, often we do not even know where it is to be found. It occurs with<strong>in</strong> ground and rock<br />
pores and fissures, and we can admire it at its spr<strong>in</strong>gs or <strong>in</strong> our karst caves.<br />
The importance of groundwater becomes apparent at the fact that groundwater is the source of<br />
dr<strong>in</strong>k<strong>in</strong>g water for approximately 97% of the <strong>in</strong>habitants of <strong>Slovenia</strong>. Groundwater quality of many<br />
aquifers complies with all the requirements for dr<strong>in</strong>k<strong>in</strong>g water. We can therefore consume it <strong>in</strong> its<br />
natural state. This is a very important advantage of <strong>Slovenia</strong>, be<strong>in</strong>g rare <strong>in</strong> both the European region<br />
and elsewhere <strong>in</strong> the world. In addition, groundwater is an important source of <strong>in</strong>dustrial water, and<br />
is also used for the irrigation of agricultural land.<br />
The pollution transferred from the pollution source <strong>in</strong>to the aquifer is reta<strong>in</strong>ed there for a longer<br />
period due to slower current, as well as chemical and physical processes between pollutant and<br />
humic substances or m<strong>in</strong>eral particles. The natural purification of groundwater <strong>in</strong> aquifers is a longlast<strong>in</strong>g<br />
process. The artificial purification of groundwater is an expensive technological procedure<br />
of very limited effectiveness. The most important task of each <strong>in</strong>dividual and every <strong>in</strong>stitution is to<br />
prevent any pollution of groundwater sources.<br />
In sediments and rocks, voids of different sizes appear. The sediments’ and rocks’ characteristic of<br />
conta<strong>in</strong><strong>in</strong>g voids is called porosity. Permeability is aquifer’s ability to conduct water. Rocks of good<br />
permeability are highly abundant.<br />
Groundwater is thus stored <strong>in</strong> moderately to highly permeable sediments and rocks called aquifers.<br />
They can be situated near the surface or hundreds of meters beneath it.<br />
The term aquifer is derived from the Lat<strong>in</strong> words aqua (water) and ferre (to carry). An aquifer can be,<br />
for example, a layer of gravel, sand, conglomerate, sandstone or a layer of fractured limestone and<br />
dolomite.<br />
The largest part of the <strong>Slovenia</strong>n territory is composed by sedimentary rocks of relatively high porosity<br />
- i.e., <strong>in</strong>tergranular (19%), fissure (14.2%) and karst-fissure porosity (33.2%). The rest of <strong>Slovenia</strong> (32.8%)<br />
is built by rocks of lower porosity and <strong>in</strong> this way of smaller abundance (64), (Map 11).<br />
In <strong>Slovenia</strong>, we thus make a dist<strong>in</strong>ction between aquifers with <strong>in</strong>tergranular, karst and fissure<br />
porosity.<br />
Aquifers with <strong>in</strong>tergranular porosity, also called alluvial aquifers, are from the Tertiary and Quaternary<br />
age. Our larger rivers have deposited layers of flatland gravel and sand <strong>in</strong>to tectonic depressions.<br />
They are found <strong>in</strong> the central, eastern and north-eastern parts of <strong>Slovenia</strong>. Such flatland regions are,<br />
for example, <strong>in</strong> the valleys of the rivers Sava, Sav<strong>in</strong>ja, Krka, Mura and Drava.<br />
Aquifers with karst and fissure porosity are are built by carbonate rocks, mostly limestone and<br />
dolomite from the Mesozoic and Palaeozoic ages. They can mostly be found <strong>in</strong> the northern, northwestern,<br />
western and southern parts of <strong>Slovenia</strong>. These are the mounta<strong>in</strong>ous karst regions of the<br />
53
54<br />
W A T E R Q U A L I T Y I N S L O V E N I A<br />
Julian Alps, the Karavanke, the Kamnik and the Sav<strong>in</strong>ja Alps, as well as the Karst regions of Notranjska,<br />
Dolenjska and Primorska.<br />
A groundwater body is groundwater with<strong>in</strong> one or several neighbour<strong>in</strong>g aquifers. In <strong>Slovenia</strong>, 21<br />
groundwater bodies have been delimited (65).<br />
Sava Dol<strong>in</strong>ka - Zelenci<br />
The Križna jama Cave
Map 11: Hydrogeological map of <strong>Slovenia</strong><br />
G R O U N D W A T E R<br />
55
56<br />
3.2<br />
W A T E R Q U A L I T Y I N S L O V E N I A<br />
Groundwater <strong>Quality</strong><br />
Groundwater quality is <strong>in</strong>fluenced by the activities on the Earth’s surface and by the vulnerability<br />
of aquifers. In flatland river valleys with predom<strong>in</strong>ant alluvial aquifers the conditions are ideal<br />
for <strong>in</strong>tensive agricultural production, <strong>in</strong> addition <strong>in</strong>dustrial and various craftsmen’s activities are<br />
also well developed. Settlements and traffic <strong>in</strong>frastructure are denser <strong>in</strong> these valleys compared<br />
to forested and mounta<strong>in</strong>ous regions of <strong>Slovenia</strong>. All the above-mentioned activities, together<br />
with a very high vulnerability, represent a high risk of groundwater pollution. In these aquifers the<br />
monitor<strong>in</strong>g results evidence that the groundwater is polluted by nitrates and pesticides orig<strong>in</strong>at<strong>in</strong>g<br />
mostly from the agricultural activity. Groundwater <strong>in</strong> some aquifers additionally conta<strong>in</strong>s chlor<strong>in</strong>ated<br />
organic solvents and heavy metals <strong>in</strong> concentrations above the quality standards. In aquifers with<br />
karst na fissure porosity, the pressures are less <strong>in</strong>tense compared to alluvial aquifers. Large parts of<br />
the surface above these aquifers are covered by forest, which provides natural protection for the<br />
groundwater. At the same time the land use is less <strong>in</strong>tensive, so groundwater pollution is lower <strong>in</strong><br />
these aquifers.<br />
The transport of pollution <strong>in</strong>to the groundwater and its spread<strong>in</strong>g around the aquifer depends<br />
on several factors, like the chemical and physical characteristics of the pollutant, the precipitation<br />
amount, the land use, the type of ground layers and the aquifer’s characteristics. Due to complex<br />
processes <strong>in</strong>fluenc<strong>in</strong>g the level of groundwater pollution, statistical methods and modell<strong>in</strong>g are<br />
<strong>in</strong>cluded <strong>in</strong> the <strong>in</strong>terpretation of the monitor<strong>in</strong>g results.<br />
National groundwater quality monitor<strong>in</strong>g, which has been carried out s<strong>in</strong>ce 1987 (66), is the<br />
systematic monitor<strong>in</strong>g of various physical and chemical parameters <strong>in</strong> groundwater bodies.<br />
Every year, the Environmental Agency of the Republic of <strong>Slovenia</strong> prepares <strong>in</strong> compliance with<br />
Slovene legislative acts for groundwater (67, 68, 69) the national groundwater quality monitor<strong>in</strong>g<br />
programme (70), and carries out all monitor<strong>in</strong>g phases. In accordance with the programme,<br />
authorised laboratories analyse about 150 different parameters <strong>in</strong> groundwater sampled at all the<br />
monitor<strong>in</strong>g sites twice to four times a year.<br />
A representative monitor<strong>in</strong>g network is the basis for a reliable chemical status assessment. National<br />
monitor<strong>in</strong>g network consists of monitor<strong>in</strong>g sites where groundwater is sampled. The monitor<strong>in</strong>g<br />
sites <strong>in</strong> alluvial aquifers are wells and boreholes, while <strong>in</strong> aquifers with karst and fissure porosity,<br />
the monitor<strong>in</strong>g sites are spr<strong>in</strong>gs and wells. In 2006, the national monitor<strong>in</strong>g network <strong>in</strong>cluded 129<br />
monitor<strong>in</strong>g sites, which were more concentrated <strong>in</strong> alluvial aquifers. A significant part of these wells<br />
and spr<strong>in</strong>gs is <strong>in</strong>tended for the dr<strong>in</strong>k<strong>in</strong>g water supply.<br />
Glijun spr<strong>in</strong>g Hubelj spr<strong>in</strong>g
G R O U N D W A T E R<br />
In groundwater samples, all parameters specified <strong>in</strong> the Decree (67) as well as potential pollutants<br />
of groundwater are determ<strong>in</strong>ed (Table 15). The groundwater quality standards are summarized <strong>in</strong><br />
Table 16.<br />
Table 15: Parameter groups analysed <strong>in</strong> groundwater<br />
Parameter group Parameters/Groups<br />
Parameters measured at the sampl<strong>in</strong>g T, pH, conductivity, redox potential, oxygen<br />
Basic parameters<br />
colour, turbidity, COD Mn , TOC, ammonium, nitrite, nitrate,<br />
sulphate, chloride, fluoride, o-phosphate, sodium, potassium,<br />
magnesium, calcium, hydrogen carbonates<br />
Group pollution parameters m<strong>in</strong>eral oils, PCB, AOX, detergents<br />
Metals and metalloids<br />
Pesticides and their metabolites<br />
Volatile aliphatic halogenic hydrocarbons and<br />
aromates<br />
Methylated and chlor<strong>in</strong>ated benzene<br />
derivatives<br />
Fe, Mn, Al, Sb, As, Cu, Ba, Be, B, Zn, Cd, Co, Sn, Cr<br />
(both total and Cr-VI), Mo, Ni, Se, Ag, Sr, Pb, Ti, V and Hg<br />
organochlor<strong>in</strong>e, organophosphorus, triaz<strong>in</strong>es, triaz<strong>in</strong>ones,<br />
triazoles, anil<strong>in</strong>es, amides, imides, benzonitriles,<br />
chloroacetanilides, phenylurea derivatives, phenoxyacetic acid<br />
derivatives<br />
COD: Chemical oxygen demand PCB: Polychlor<strong>in</strong>ated biphenyls<br />
TOC: Total oganic carbon AOX: Adsorbable organic halogen compounds<br />
Tabela 16: Standardi kakovosti podzemne vode<br />
Pollutants - groundwater parameters<br />
BASIC GROUNDWATER PARAMETE<strong>RS</strong><br />
Expressed<br />
as<br />
Unit<br />
<strong>Quality</strong><br />
standard<br />
Nitrates NO3 mg/L 50<br />
Individual pesticide and its relevant* metabolites µg/L 0.1<br />
The sum of all measured pesticides µg/L 0.5<br />
INDICATIVE GROUNDWATER PARAMETE<strong>RS</strong><br />
Ammonium NH4 mg/L 0.2<br />
Potassium K mg/L 10<br />
Orthophosphates<br />
Volatile aliphatic halogenated hydrocarbons<br />
PO4 mg/L 0.2<br />
Dichloromethane µg/L 2.0<br />
Tetrachloromethane µg/L 2.0<br />
1,2-dichloroethane µg/L 3.0<br />
1,1-dichloroethene µg/L 2.0<br />
Trichloroethene µg/L 2.0<br />
Tetrachloroethene µg/L 2.0<br />
The sum of volatile halogenated hydrocarbons µg/L 10<br />
M<strong>in</strong>eral oils µg/L 10<br />
Chromium Cr µg/L 30<br />
* The relevant metabolites accord<strong>in</strong>g to pesticide registration regulative acts;<br />
57
58<br />
W A T E R Q U A L I T Y I N S L O V E N I A<br />
Divje jezero Krupa spr<strong>in</strong>g<br />
Based on statistically treated results, the chemical status of a groundwater body is assessed every<br />
year. For each parameter, annual arithmetic mean values (AM) are calculated at <strong>in</strong>dividual monitor<strong>in</strong>g<br />
sites. From the annual arithmetic mean values of <strong>in</strong>dividual monitor<strong>in</strong>g sites, the representative<br />
average value for a groundwater body is calculated (AM ), where each monitor<strong>in</strong>g site is weighted<br />
SK<br />
proportionally to the catchment area.<br />
A good groundwater body chemical status is assessed if the follow<strong>in</strong>g requirements are fulfilled:<br />
• for all parameters at all monitor<strong>in</strong>g sites with<strong>in</strong> the groundwater body borders, the follow<strong>in</strong>g<br />
applies: AM ≤ QS (quality standard)<br />
or<br />
• for all parameters for a groundwater body, the follow<strong>in</strong>g applies: AM ≤ QS,<br />
SK<br />
• dr<strong>in</strong>k<strong>in</strong>g water pumped from the groundwater body is compliant with the requirements set out <strong>in</strong><br />
the Rules on Dr<strong>in</strong>k<strong>in</strong>g <strong>Water</strong>,<br />
• there is no <strong>in</strong>dication of salt water <strong>in</strong>trusion <strong>in</strong>to the groundwater body,<br />
• groundwater pollution does not deteriorate the status of surface waters and does not have<br />
damag<strong>in</strong>g effects on neither terrestrial nor aquatic ecosystems.<br />
Out of 15 groundwater bodies where national monitor<strong>in</strong>g network and monitor<strong>in</strong>g sites are<br />
situated, chemical statuses of 9 groundwater bodies were determ<strong>in</strong>ed <strong>in</strong> 2006. In four groundwater<br />
bodies, the chemical status was only estimated, while for two groundwater bodies the network was<br />
not representative enough for evaluation. The chemical status of groundwater bodies <strong>in</strong> 2006 is<br />
presented <strong>in</strong> Map 12 and <strong>in</strong> Table 17, together with an <strong>in</strong>dication of the parameters caus<strong>in</strong>g a bad<br />
chemical status, and the polluted parts of a groundwater body. A bad chemical status assessed on<br />
the results for groundwater as well as on the monitor<strong>in</strong>g results of dr<strong>in</strong>k<strong>in</strong>g water was determ<strong>in</strong>ed<br />
for three groundwater bodies: the Dravska kotl<strong>in</strong>a, the Murska kotl<strong>in</strong>a and the Krška kotl<strong>in</strong>a. In the<br />
Drava and the Krška kotl<strong>in</strong>a, a bad chemical status was assessed due to nitrates and pesticides that<br />
are characteristic of agricultural activity, while <strong>in</strong> the Murska kotl<strong>in</strong>a, additionally due to chlor<strong>in</strong>ated<br />
derivatives of ethene that are still used <strong>in</strong> <strong>in</strong>dustrial and trade activities. In 2006, a bad chemical status<br />
of the Krška kotl<strong>in</strong>a was determ<strong>in</strong>ed for the first time.
Map 12: Monitor<strong>in</strong>g network and chemical status of groundwater bodies <strong>in</strong> 2006<br />
G R O U N D W A T E R<br />
59
60<br />
W A T E R Q U A L I T Y I N S L O V E N I A<br />
Table 17: Chemical status of groundwater bodies (GWB) <strong>in</strong> 2006<br />
GWB<br />
code<br />
1001<br />
GWB name Aquifer types<br />
Savska kotl<strong>in</strong>a <strong>in</strong><br />
Ljubljansko barje<br />
1002 Sav<strong>in</strong>jska kotl<strong>in</strong>a<br />
alluvial<br />
alluvial<br />
Chemical status 2006<br />
Groundwater<br />
Dr<strong>in</strong>k<strong>in</strong>g<br />
water<br />
1003 Krška kotl<strong>in</strong>a alluvial bad bad<br />
1004<br />
Julijske Alpe v<br />
porečju Save<br />
karst-fissure<br />
1005 Karavanke karst-fissure<br />
1006<br />
1008<br />
1009<br />
Kamniško-<br />
Sav<strong>in</strong>jske Alpe<br />
Posavsko hribovje<br />
do osrednje Sotle<br />
Spodnji del<br />
Sav<strong>in</strong>je do Sotle<br />
karst-fissure<br />
Parameters<br />
(cause of bad<br />
chemical<br />
status)<br />
Polluted parts<br />
of GWB<br />
good good / /<br />
good good / /<br />
good<br />
(estimated)<br />
good<br />
(estimated)<br />
good<br />
(estimated)<br />
nitrates, DAT,<br />
BENT<br />
Krško polje,<br />
Škocjan - Krško<br />
gričevje<br />
good / /<br />
good / /<br />
good / /<br />
karst-fissure 0 bad DAT Območje Mirne<br />
karst-fissure 0 good / /<br />
1010 Kraška Ljubljanica karst-fissure good good / /<br />
1011 Dolenjski kras karst-fissure good good / /<br />
3012 Dravska kotl<strong>in</strong>a<br />
4016 Murska kotl<strong>in</strong>a<br />
5019<br />
6020<br />
6021<br />
Obala <strong>in</strong> Kras z<br />
Brk<strong>in</strong>i<br />
Julijske Alpe v<br />
porečju Soče<br />
Goriška Brda <strong>in</strong><br />
Trnov.-Banjška<br />
planota<br />
alluvial<br />
alluvial<br />
bad bad nitrates, AT Dravsko polje<br />
bad bad<br />
nitrates, AT,<br />
DAT, BENT,<br />
manganese,<br />
DCE, TCE, PCE<br />
Apaško polje,<br />
Dol<strong>in</strong>sko-<br />
Ravensko polje<br />
karst-fissure good good / /<br />
karst-fissure<br />
karst-fissure<br />
and alluvial<br />
AT: Atraz<strong>in</strong>e DCE: 1,2-dichloroethene<br />
DAT: Desethyl-atraz<strong>in</strong>e TCE: Trichloroethene<br />
BENT: Bentazone PCE: Tetrachloroethene<br />
good<br />
(estimated)<br />
good / /<br />
good good / /
G R O U N D W A T E R<br />
In the chart 11 different concentration levels of nitrates and desethyl-atraz<strong>in</strong>e <strong>in</strong> alluvial aquifers as well<br />
as <strong>in</strong> aquifers with karst and fissure porosity are depicted. It is very obvious that groundwater bodies<br />
<strong>in</strong> alluvial aquifers are more polluted by nitrates and desethyl-atraz<strong>in</strong>e compared to groundwater<br />
bodies <strong>in</strong> aquifers with karst and fissure porosity.<br />
Chart 11: Difference <strong>in</strong> concentration levels of nitrates and desethyl-atraz<strong>in</strong>e <strong>in</strong> alluvial and aquifers with karst and<br />
fissure porosity <strong>in</strong> 2006<br />
�����������������������������������������<br />
���<br />
��<br />
��<br />
��<br />
��<br />
��<br />
��<br />
��<br />
��<br />
��<br />
��������<br />
�����������������<br />
�<br />
����<br />
����������������� ���������������������������������������<br />
����<br />
����<br />
����<br />
����<br />
����<br />
����<br />
����<br />
����<br />
����������������<br />
Statistical treatment often conceals the problem of pollution; the groundwater quality must<br />
therefore be verified at <strong>in</strong>dividual monitor<strong>in</strong>g sites. In the Table 18, the monitor<strong>in</strong>g sites with the<br />
highest concentrations of pollutants determ<strong>in</strong>ed <strong>in</strong> 2006 are listed. In groundwater of the Sav<strong>in</strong>jska<br />
kotl<strong>in</strong>a, high concentrations of nitrates, pesticides and tetrachloroethene were analysed at Levec. The<br />
pesticide bentazone exceeded ten times the quality standards <strong>in</strong> groundwater at Cerklje airport <strong>in</strong><br />
Krško polje. S<strong>in</strong>ce the beg<strong>in</strong>n<strong>in</strong>g of the groundwater quality monitor<strong>in</strong>g it has been started the most<br />
polluted part of the groundwater body Dravska kotl<strong>in</strong>a is the central part <strong>in</strong> Brunšvik, Kidričevo and<br />
Šikole. The ma<strong>in</strong> pollutants <strong>in</strong> all three sites are atraz<strong>in</strong>e and nitrates. High concentrations of atraz<strong>in</strong>e<br />
and the high ratio between atraz<strong>in</strong>e and its metabolite desethyl-atraz<strong>in</strong>e <strong>in</strong>dicate that, despite the<br />
ban, atraz<strong>in</strong>e is still be<strong>in</strong>g used <strong>in</strong> this area.<br />
In a part of the Murska kotl<strong>in</strong>a, groundwater is heavily polluted with chlor<strong>in</strong>ated organic solvents,<br />
primarily with dichloroethene, trichloroethene and tetrachloroethene, and additionally with nitrates,<br />
atraz<strong>in</strong>e and its metabolite desethyl-atraz<strong>in</strong>e.<br />
Automatic monitor<strong>in</strong>g station <strong>in</strong> Ljubljansko polje A well Črnci <strong>in</strong> Apaško polje<br />
����<br />
����<br />
����<br />
����<br />
����<br />
����<br />
61
62<br />
3.3<br />
W A T E R Q U A L I T Y I N S L O V E N I A<br />
Table 18: Monitor<strong>in</strong>g sites with the most polluted groundwater<br />
Groundwater<br />
body<br />
Sav<strong>in</strong>jska<br />
kotl<strong>in</strong>a<br />
Krška kotl<strong>in</strong>a<br />
Dravska<br />
kotl<strong>in</strong>a<br />
Murska<br />
kotl<strong>in</strong>a<br />
Monitor<strong>in</strong>g site Parameter Concentration (AM) AM/QS<br />
LEVEC VC-1772 nitrates 58.8 mg NO 3 /L 1.2<br />
metolachlor 0.32 µg/L 3.2<br />
terbuthylaz<strong>in</strong>e 0.10 µg/L 1.0<br />
desethyl-terbuthylaz<strong>in</strong>e 0.15 µg/L 1.5<br />
total pesticides 0.68 µg/L 1.4<br />
tetrachloroethene 3.08 µg/L 1.5<br />
CERKLJE C-01 nitrates 50.2 mg NO 3 /L 1.0<br />
bentazone 1.05 µg/L 10.5<br />
total pesticides 1.17 µg/L 2.3<br />
BRUNŠVIK 1750 nitrates 109.5 mg NO 3 /L 2.2<br />
atraz<strong>in</strong>e 0.25 µg/L 2.5<br />
desethyl-atraz<strong>in</strong>e 0.17 µg/L 1.7<br />
prometryn 0.39 µg/L 3.9<br />
total pesticides 1.02 µg/L 2.0<br />
ŠIKOLE 1581 nitrates 85.3 mg NO 3 /L 1.7<br />
atraz<strong>in</strong>e 0.24 µg/L 2.4<br />
desethyl-atraz<strong>in</strong>e 0.15 µg/L 1.5<br />
bentazone 0.13 µg/L 1.3<br />
total pesticides 0.51 µg/L 1.0<br />
KIDRIČEVO 2571 nitrates 55.5 mg NO 3 /L 1.1<br />
atraz<strong>in</strong>e 0.88 µg/L 8.8<br />
desethyl-atraz<strong>in</strong>e 0.34 µg/L 3.4<br />
total pesticides 1.23 µg/L 2.5<br />
RAKIČAN 2500 nitrates 60.9 mg NO 3 /L 1.2<br />
potassium 12.0 mg/L 1.2<br />
atraz<strong>in</strong>e 0.13 µg/L 1.3<br />
1.2-dichloroethene 146.5 µg/L 73.3<br />
tetrachloroethene 155.0 µg/L 77.5<br />
trichloroethene 68.8 µg/L 34.4<br />
LHCH 370.5 µg/L 37.1<br />
LIPOVCI 2271 nitrates 110.3 mg NO 3 /L 2.2<br />
LHCH: The sum of volatile halogenated aliphatic hydrocarbons<br />
AM: Yearly arithmetic mean of parameter <strong>in</strong> the monitor<strong>in</strong>g site<br />
QS: <strong>Quality</strong> standard<br />
Trend Evaluation<br />
desethyl-atraz<strong>in</strong>e 0.19 µg/L 1.9<br />
The behaviour of an <strong>in</strong>dividual parameter over a longer period of time is represented by upward/<br />
downward concentration trends. Long-term trends of pollutants’ concentration <strong>in</strong> a groundwater<br />
body are determ<strong>in</strong>ed with a l<strong>in</strong>ear regression analysis of at least six-year sets of representative average<br />
values for a water body (AM ). On most occasions, pollution does not affect the entire water body,<br />
SK<br />
so more complete <strong>in</strong>formation on endangered groundwater is obta<strong>in</strong>ed if trends are determ<strong>in</strong>ed<br />
with a l<strong>in</strong>ear regression of the annual arithmetic mean values at <strong>in</strong>dividual monitor<strong>in</strong>g sites (AM).<br />
Remediation measures have to be carried out when the parameter’s upward trend reaches 75% of<br />
the quality standard.<br />
Due to a ban on the use of atraz<strong>in</strong>e, a downward trend of this pesticide and its metabolite desethylatraz<strong>in</strong>e<br />
has been established <strong>in</strong> the majority of groundwater bodies. Chart 12 shows a downward<br />
trend of the desethyl-atraz<strong>in</strong>e concentration <strong>in</strong> the period from 1998 to 2006 <strong>in</strong> the Murska kotl<strong>in</strong>a<br />
where, <strong>in</strong> 2005, representative average values (AM ) for the water body decreased below the quality<br />
SK<br />
standard of 0,1 μg/L. Dur<strong>in</strong>g the same period, the concentrations of desethyl-atraz<strong>in</strong>e <strong>in</strong> the Krška<br />
kotl<strong>in</strong>a water body have been <strong>in</strong>creas<strong>in</strong>g and almost reached the quality standard <strong>in</strong> 2006 (Chart 13)
G R O U N D W A T E R<br />
Chart 12: Trend of decreas<strong>in</strong>g desethyl-atraz<strong>in</strong>e concentration <strong>in</strong> the Murska kotl<strong>in</strong>a <strong>in</strong> the years 1998 to 2006<br />
�� �� �����������������������������<br />
����<br />
����<br />
����<br />
����<br />
����<br />
����<br />
����<br />
�������������������������������������������<br />
� � �������<br />
���� ���� ���� ���� ���� ���� ���� ���� ���� ���� ����<br />
Chart 13: Trend of <strong>in</strong>creas<strong>in</strong>g desethyl-atraz<strong>in</strong>e concentration <strong>in</strong> the Krška kotl<strong>in</strong>a <strong>in</strong> the years 1998 to 2006<br />
��� �� �����������������������������<br />
����<br />
����<br />
����<br />
����<br />
����<br />
����<br />
����<br />
����<br />
����<br />
����<br />
������������������������������������������<br />
� � �������<br />
����<br />
���� ���� ���� ���� ���� ���� ���� ���� ���� ���� ����<br />
With regards to nitrates, no explicit trend could be observed <strong>in</strong> the period from 1998 to 2006. In<br />
Chart 14, the average annual nitrate concentrations for all water bodies <strong>in</strong> alluvial aquifers are shown.<br />
Dur<strong>in</strong>g this period, the nitrate concentrations have been <strong>in</strong>creas<strong>in</strong>g <strong>in</strong> the Dravska and Krška kotl<strong>in</strong>a,<br />
slowly decreas<strong>in</strong>g <strong>in</strong> the Murska kotl<strong>in</strong>a, while they rema<strong>in</strong>ed at the same level <strong>in</strong> the Sav<strong>in</strong>ja and<br />
Savska kotl<strong>in</strong>a.<br />
Chart 14: Chang<strong>in</strong>g of nitrate concentrations <strong>in</strong> alluvial groundwater bodies <strong>in</strong> the years 1998 to 2006<br />
�����������������������������<br />
������ ��� �<br />
��<br />
��<br />
��<br />
��<br />
��<br />
��<br />
�<br />
����<br />
����<br />
����<br />
����<br />
����<br />
��������������<br />
�������������<br />
��������������<br />
�����������������<br />
���������������<br />
63
4<br />
Guidel<strong>in</strong>es for Future Work -<br />
<strong>Water</strong> <strong>Quality</strong> Assessment <strong>in</strong> Accordance to the<br />
<strong>Water</strong> Framework Directive<br />
<strong>Water</strong> quality monitor<strong>in</strong>g <strong>in</strong> <strong>Slovenia</strong> has a long tradition, but <strong>in</strong> 2007, it was for the first time carried<br />
out entirely <strong>in</strong> accordance with the requirements of the <strong>Water</strong> Framework Directive. The recent<br />
monitor<strong>in</strong>g programmes for water quality are prepared accord<strong>in</strong>g to a new monitor<strong>in</strong>g approach<br />
which is be<strong>in</strong>g <strong>in</strong>troduced by the <strong>Water</strong> Framework Directive. They are based on pressure analyses<br />
- i.e., data on emissions, land use, surpluses of nitrogen and the amounts of pesticides used etc.<br />
Accord<strong>in</strong>g to the analysis of these data, the monitor<strong>in</strong>g programme is problem oriented and <strong>in</strong>volves<br />
predom<strong>in</strong>antly problematic water bodies. Other water bodies are less frequently <strong>in</strong>cluded <strong>in</strong> the<br />
programme.<br />
An essential novelty of the monitor<strong>in</strong>g of the surface water quality is the assessment of the<br />
ecological status. The ecological status is evaluated based on four biological and the support<strong>in</strong>g<br />
physico-chemical and hydromorphological quality elements. The biological quality elements are<br />
phytoplankton, phytobenthos and macrophytes, benthic <strong>in</strong>vertebrate fauna and fish. The evaluation<br />
of the ecological status is determ<strong>in</strong>ed by measur<strong>in</strong>g the alteration of the ecosystem’s structure and<br />
deviation from the natural conditions. The natural or reference condition is a status whereby the<br />
impact of human activity is either not noticeable or is <strong>in</strong>significant. S<strong>in</strong>ce the reference status of water<br />
bodies are different, a type-specific approach is used whereby the waters are classified <strong>in</strong>to different<br />
types accord<strong>in</strong>g to their natural characteristics and then reference conditions are def<strong>in</strong>ed for each<br />
type. For each type, five classes of ecological quality are def<strong>in</strong>ed. As <strong>in</strong> most European countries, the<br />
system of assessment of ecological status is still be<strong>in</strong>g developed <strong>in</strong> <strong>Slovenia</strong>.<br />
Also, one of the requirements of the <strong>Water</strong> Framework Directive is the evaluation of the chemical<br />
status. For the time be<strong>in</strong>g, the chemical status of surface waters is evaluated accord<strong>in</strong>g to the<br />
exist<strong>in</strong>g legislation from 2002. In the European Community, the environmental quality standards<br />
for the determ<strong>in</strong>ation of chemical status are <strong>in</strong> the adoption procedure, but the concentration of<br />
ha<strong>za</strong>rdous substances will have to be monitored, which must gradually disappear from the aquatic<br />
environment. Some of these substances (mercury, cadmium, lead, nickel, atraz<strong>in</strong>e, polycyclic aromatic<br />
hydrocarbons...) were already <strong>in</strong>cluded <strong>in</strong> previous years, and some will have to be added to the<br />
monitor<strong>in</strong>g programme.<br />
In the field of groundwater, the chemical status of those water bodies from which more than 100 m3 of water is pumped daily for the dr<strong>in</strong>k<strong>in</strong>g water supply, should be evaluated. In the case of <strong>Slovenia</strong>,<br />
it means that all of the water bodies will be <strong>in</strong>cluded <strong>in</strong> the monitor<strong>in</strong>g programme. Until 2006,<br />
monitor<strong>in</strong>g was predom<strong>in</strong>antly oriented towards the aquifers with <strong>in</strong>tergranular porosity, where<br />
the problems are the worst, and for the rema<strong>in</strong><strong>in</strong>g types of aquifers, analyses were carried out only<br />
occasionally. Tak<strong>in</strong>g this <strong>in</strong>to account the number of monitor<strong>in</strong>g sites for groundwater <strong>in</strong>creased<br />
substantially <strong>in</strong> 2007. The <strong>Water</strong> Framework Directive allows for water bodies with a good chemical<br />
status not to be monitored every year however the frequency will only be changed after the first<br />
assessment of the chemical status.<br />
For the last eight years, all European countries have been promot<strong>in</strong>g the <strong>Water</strong> Framework Directive,<br />
which was adopted <strong>in</strong> order to preserve and improve the quality of water resources. The aim of the<br />
<strong>Water</strong> Framework Directive is to achieve a good chemical and ecological status of surface waters, as<br />
well as a good chemical status of groundwater by 2015. With the <strong>in</strong>tention of obta<strong>in</strong><strong>in</strong>g a reliable<br />
assessment of water status, the <strong>Water</strong> Framework Directive prescribes monitor<strong>in</strong>g which should be<br />
established by the end of 2006 at the latest. The first comprehensive assessments of the status of<br />
surface waters and groundwater will be laid out for the purpose of the first river bas<strong>in</strong> management<br />
plans by the end of 2009. If countries have water bodies with a bad chemical or ecological status, they<br />
65
66<br />
W A T E R Q U A L I T Y I N S L O V E N I A<br />
will have to start tak<strong>in</strong>g measures for the improvement and for the achievement of a good status by<br />
2012 at the latest.<br />
The measures are, <strong>in</strong> most cases, associated with high f<strong>in</strong>ancial costs; the construction of water<br />
treatment plants and <strong>in</strong>stallations with advanced technologies, for example, demand large<br />
<strong>in</strong>vestments. On the other hand, the clos<strong>in</strong>g down of <strong>in</strong>stallations, bann<strong>in</strong>g the use of <strong>in</strong>dividual<br />
ha<strong>za</strong>rdous substances or other restrict<strong>in</strong>g measures can also contribute to the improvement of the<br />
status of the aquatic environment and have impacts on the economy and on the liv<strong>in</strong>g standard<br />
of the entire population. Therefore, it is very important that the data from national monitor<strong>in</strong>g are<br />
acquired <strong>in</strong> compliance with the pr<strong>in</strong>ciples of quality assurance, which are also the fundamental<br />
pr<strong>in</strong>ciples of the Environmental Agency of the Republic of <strong>Slovenia</strong>. Only quality data can provide the<br />
reliable assessment of chemical and ecological status, which are <strong>in</strong> turn used as expert groundwork<br />
for restoration programmes and serve as a support for <strong>in</strong>tegral water management.<br />
A chart of water quality evaluation <strong>in</strong> accordance with<br />
the <strong>Water</strong> Framework Directive<br />
Surface waters<br />
chemical status ecological status<br />
GOOD<br />
BAD<br />
GOOD<br />
BAD<br />
Groundwaters<br />
HIGH<br />
GOOD<br />
MODERATE<br />
POOR<br />
BAD<br />
chemical status quantitative status<br />
GOOD<br />
BAD
5 References<br />
1. Directive 2000/60/EC of the European Parliament and of the Council establish<strong>in</strong>g a framework for<br />
the Community action <strong>in</strong> the field of water policy<br />
2. Zakon o varstvu okolja (ZVO-1), Uradni list <strong>RS</strong> št. 41/04<br />
3. <strong>Agencija</strong> <strong>RS</strong> <strong>za</strong> <strong>okolje</strong>, Programi monitor<strong>in</strong>ga kakovosti površ<strong>in</strong>skih <strong>in</strong> podzemnih voda v Sloveniji<br />
(www.arso.gov.si/vode/)<br />
4. <strong>Agencija</strong> <strong>RS</strong> <strong>za</strong> <strong>okolje</strong>, Poročila o kakovosti površ<strong>in</strong>skih <strong>in</strong> podzemnih voda v Sloveniji<br />
(www.arso.gov.si/vode/)<br />
5. <strong>Agencija</strong> <strong>RS</strong> <strong>za</strong> <strong>okolje</strong>, Poročila o kakovosti površ<strong>in</strong>skih vodotokov v Sloveniji <strong>za</strong> leta 2006, 2005,<br />
2004, 2003 <strong>in</strong> 2002<br />
6. <strong>Agencija</strong> <strong>RS</strong> <strong>za</strong> <strong>okolje</strong>, Program monitor<strong>in</strong>ga kakovosti površ<strong>in</strong>skih vodotokov<br />
7. Uredba o kemijskem stanju površ<strong>in</strong>skih voda (Uradni list <strong>RS</strong>, št. 11/2002)<br />
8. Pravilnik o monitor<strong>in</strong>gu kemijskega stanja površ<strong>in</strong>skih voda (Uradni list <strong>RS</strong>, št. 42/02)<br />
9. Directive 2455/2001/ES of the European Parliament and of the Council present<strong>in</strong>g the list of priority<br />
substances <strong>in</strong> the field of water policy; the Directive is Annex X of the <strong>Water</strong> Framework Directive<br />
10. Guidance on Monitor<strong>in</strong>g for the <strong>Water</strong> Framework Directive, January 2003<br />
11. Guidance document on Report<strong>in</strong>g, Report<strong>in</strong>g Sheets for Report<strong>in</strong>g Monitor<strong>in</strong>g Requirements, <strong>in</strong><br />
course of preparation<br />
12. Strokovna navodila, ve<strong>za</strong>na na ekološko stanje (REFCOND, COAST, INTERKALIBRACIJA, Classification<br />
system ...)<br />
13. Guidance for the analysis of pressures and impacts, <strong>in</strong> accordance with the <strong>Water</strong> Framework<br />
Directive, December 2002<br />
14. EU Report: Contribution of the EG on analysis and monitor<strong>in</strong>g of priority substances<br />
15. Pravilnik o določitvi <strong>in</strong> razvrstitvi vodnih teles površ<strong>in</strong>skih voda (Uradni list <strong>RS</strong>, št. 63/2005, 26/06)<br />
16. Proposal for a Directive of the European Parliament and of the Council on environment quality<br />
standards <strong>in</strong> the field of water policy and amend<strong>in</strong>g Directive 2000/60/EC<br />
17. Urbanc - Berčič O., Germ M. (2005). Priprava metodologije vzorčenja makrofitov v vodotokih <strong>za</strong><br />
določanje ekološkega stanja vodotokov v Sloveniji<br />
18. Urbanič G., Tavzes B., Toman M. J. (2005a). I. Vzorčenje bentoških nevretenčarjev v prebrodljivih<br />
(plitvih) vodotokih. V: Urbanič G. Tavzes B., Toman M. J., Ambrožič Š., Hodnik V., Zdešar K., Sever M.<br />
(2005). Priprava metodologij vzorčenja ter laboratorijske obdelave vzorcev bentoških nevretenčarjev<br />
(zoobentosa), nabranih v vodotokih, <strong>in</strong> obdelava 70 vzorcev bentoških nevretenčarjev. Univer<strong>za</strong> v<br />
Ljubljani, Biotehniška fakulteta, Oddelek <strong>za</strong> biologijo, str. 38<br />
19. Urbanič G., Tavzes B., Ambrožič Š., Toman M. J. (2005b). II. Laboratorijska obdelava vzorcev bentoških<br />
nevretenčarjev <strong>in</strong> potrebna stopnja determ<strong>in</strong>acije. V: Urbanič G. Tavzes B., Toman M. J., Ambrožič<br />
Š., Hodnik V., Zdešar K., Sever M. (2005). Priprava metodologij vzorčenja ter laboratorijske obdelave<br />
vzorcev bentoških nevretenčarjev (zoobentosa), nabranih v vodotokih, <strong>in</strong> obdelava 70 vzorcev<br />
bentoških nevretenčarjev. Univer<strong>za</strong> v Ljubljani, Biotehniška fakulteta, Oddelek <strong>za</strong> biologijo, str. 38<br />
20. Kosi <strong>in</strong> sod. (2005). Priprava metodologije vzorčenja ter laboratorijske obdelave vzorcev alg<br />
(fitobentosa) <strong>za</strong> določanje ekološkega stanja vodotokov v Sloveniji <strong>in</strong> obdelava 45 vzorcev alg<br />
21. Urbanič G., Ambrožič Š., Rotar B., Toman M.J., Grbović J. (2006). Prilagoditev saprobnega <strong>in</strong>deksa<br />
<strong>za</strong>htevam Vodne direktive (Direktiva 2000/60/ES) <strong>za</strong> vrednotenje ekološkega stanja rek v Sloveniji na<br />
podlagi bentoških nevretenčarjev. Univer<strong>za</strong> v Ljubljani, Biotehniška fakulteta, Oddelek <strong>za</strong> biologijo,<br />
str.130<br />
22. Kosi G. s sodelavci, Prilagoditev saprobnega <strong>in</strong>deksa <strong>za</strong>htevam Vodne direktive (Direktiva 2000/60/<br />
ES) <strong>za</strong> vrednotenje ekološkega stanja rek v Sloveniji na podlagi fitobentosa. NIB, oktober 2006<br />
23. Atlas vodnih teles površ<strong>in</strong>skih voda, Inštitut <strong>za</strong> vode <strong>RS</strong>, 2006<br />
24. <strong>Agencija</strong> <strong>RS</strong> <strong>za</strong> <strong>okolje</strong>, Podatki o emisijah iz točkovnih virov <strong>za</strong> leti 2005 <strong>in</strong> 2006<br />
67
68<br />
W A T E R Q U A L I T Y I N S L O V E N I A<br />
25. Pantle R., Buck H., Die biologische Überwachung der Gewässer und die Darstellung der Ergebnisse,<br />
GWF 96 (1955) 604<br />
26. Zel<strong>in</strong>ka M., Marvan P., Zur Präzisierung der biologischen Klassifikation der Re<strong>in</strong>heit fließender<br />
Gewässer, Arch. Hydrobiol., 57 (1961), S. 389–407<br />
27. Urbanič G. (2005a). Hidroekoregije Slovenije. V: Urbanič G. (ur.) Ekološko stanje <strong>za</strong> reke <strong>in</strong> jezera,<br />
Poročilo o delu v letu 2005. Inštitut <strong>za</strong> vode Republike Slovenije, Ljubljana, str. 6–10<br />
28. Urbanič G. (2005b). Abiotska tipi<strong>za</strong>cija vodotokov. V: Urbanič G. (ur.) Ekološko stanje <strong>za</strong> reke <strong>in</strong> jezera.<br />
Poročilo o delu v letu 2005. Inštitut <strong>za</strong> vode Republike Slovenije, Ljubljana, str. 15–18.<br />
29. Urbanič G., (2006). Dopolnitve v razmejitvi hidroekoregij <strong>in</strong> bioregije cel<strong>in</strong>skih voda Slovenije. V:<br />
Urbanič, G. (2006). Dodelava tipi<strong>za</strong>cije <strong>za</strong> reke <strong>in</strong> jezera. Poročilo o delu v letu 2006. Inštitut <strong>za</strong> vode<br />
<strong>RS</strong>, Ljubljana, str. 12–19.<br />
30. Urbanič G. (2006b). Opis tipov rek v Sloveniji. V: Urbanič, G. (2006). Dodelava tipi<strong>za</strong>cije <strong>za</strong> reke <strong>in</strong><br />
jezera. Poročilo o delu v letu 2006. Inštitut <strong>za</strong> vode <strong>RS</strong>, Ljubljana, str. 20–25.<br />
31. <strong>Agencija</strong> <strong>RS</strong> <strong>za</strong> <strong>okolje</strong>, Poročilo o kakovosti jezer v Sloveniji<br />
32. <strong>Agencija</strong> <strong>RS</strong> <strong>za</strong> <strong>okolje</strong>, Program ekološkega <strong>in</strong> kemijskega stanja jezer<br />
33. Eutrophication of waters, Monitor<strong>in</strong>g, Assessment and Control Anon., OECD Paris, (1982)<br />
34. Selection of reference sites – Reference Conditions, Alp<strong>in</strong>e GIG, Wolfgang G., 2006<br />
35. Morska biološka postaja Piran, Poročilo o kakovosti morja <strong>in</strong> voda <strong>za</strong> življenje <strong>in</strong> rast morskih školjk <strong>in</strong><br />
morskih polžev<br />
36. Vollenwieder R.A., F. Giovanardi, G. Montanari & A. R<strong>in</strong>aldi. 1998 Characteri<strong>za</strong>tion of the trophic<br />
conditions of mar<strong>in</strong>e coastal waters, with special reference to the NW Adriatic Sea: Proposal for a<br />
trophic scale, turbidity and generalised water quality <strong>in</strong>dex. Envirometrics, 9: 329–357<br />
37. Priprava <strong>in</strong> izbor vzorčevalnih protokolov <strong>za</strong> vzorčenja bioloških, fizikalno-kemijskih <strong>in</strong> hidromorfoloških<br />
elementov vode na območju morja Republike Slovenije ter dokumentiranje, <strong>za</strong>ščita <strong>in</strong> hranjenje<br />
vzorcev <strong>za</strong> analizo, NIB-MBP, avgust 2005<br />
38. Poročilo o izvedenem delu: Uskladitev monitor<strong>in</strong>ga ekološkega stanja <strong>za</strong>htevam vodne direktive, NIB-<br />
MBP, november 2005<br />
39. Lipej L., Mozetič P., Orlando Bonaca B., Mavrič B., Šiško M. & Bettoso N. (October 2006). Opredelitev<br />
ekološkega stanja morja v skladu z Vodno direktivo, NIB MBP, oktober 2006<br />
40. <strong>Agencija</strong> <strong>RS</strong> <strong>za</strong> <strong>okolje</strong>, Poročilo o izvajanju kakovosti površ<strong>in</strong>skih voda, ki se jih odvzema <strong>za</strong> oskrbo s<br />
pitno vodo v letih 2002–2006 ter razvrstitev v kakovostne razrede, Ljubljana, november 2007<br />
41. Council Directive 75/440/EEC concern<strong>in</strong>g the quality required of surface water <strong>in</strong>tended for<br />
abstraction of dr<strong>in</strong>k<strong>in</strong>g water <strong>in</strong> the Member States<br />
42. Council Directive 79/869/EEC concern<strong>in</strong>g the methods of measurement and frequencies of sampl<strong>in</strong>g<br />
and analyses of surface water <strong>in</strong>tended for the abstraction of dr<strong>in</strong>k<strong>in</strong>g water <strong>in</strong> the Member States<br />
43. Uredba o kakovosti površ<strong>in</strong>skih voda, ki se jih odvzema <strong>za</strong> oskrbo s pitno vodo, Uradni list <strong>RS</strong> št.<br />
125/00 <strong>in</strong> 4/01<br />
44. Pravilnik o imisijskem monitor<strong>in</strong>gu kakovosti površ<strong>in</strong>skih voda, ki se jih odvzema <strong>za</strong> oskrbo s pitno<br />
vodo, Uradni list <strong>RS</strong> št. 40/01<br />
45. <strong>Agencija</strong> <strong>RS</strong> <strong>za</strong> <strong>okolje</strong>, Program monitor<strong>in</strong>ga kakovosti površ<strong>in</strong>skih voda, ki se jih odvzema <strong>za</strong> oskrbo<br />
s pitno vodo, Petletno obdobje 2002–2006, Ljubljana, oktober 2001<br />
46. Odredba o prvi razvrstitvi površ<strong>in</strong>skih voda, ki se jih odvzema <strong>za</strong> oskrbo s pitno vodo, Uradni list <strong>RS</strong><br />
št. 65/02<br />
47. <strong>Agencija</strong> <strong>RS</strong> <strong>za</strong> <strong>okolje</strong>, Inštitut <strong>za</strong> varovanje zdravja, Poročilo o kakovosti kopalnih voda v Sloveniji<br />
48. Council Directive 76/160/EEC on the quality of bath<strong>in</strong>g water<br />
49. Pravilnik o m<strong>in</strong>imalnih higienskih <strong>in</strong> drugih <strong>za</strong>htevah <strong>za</strong> kopalne vode, Ur. list <strong>RS</strong> št. 79/03 <strong>in</strong> 96/06<br />
50. Uredba o območjih kopalnih voda ter o monitor<strong>in</strong>gu kakovosti kopalnih voda s<br />
<strong>in</strong> dopolnitvami, Uradni list <strong>RS</strong> št. 70/03 <strong>in</strong> 72/04<br />
spremembami<br />
51. <strong>Agencija</strong> <strong>RS</strong> <strong>za</strong> <strong>okolje</strong>, Program monitor<strong>in</strong>ga kopalnih voda na kopalnih območjih<br />
52. <strong>Agencija</strong> <strong>RS</strong> <strong>za</strong> <strong>okolje</strong>, M<strong>in</strong>istrstvo <strong>za</strong> <strong>okolje</strong> <strong>in</strong> prostor, Poročilo Evropski komisiji o izvajanju kopalne<br />
direktive<br />
53. EC, Bath<strong>in</strong>g water quality - annual report, ec.europa.eu/water/water-bath<strong>in</strong>g/report_2007.html<br />
54. <strong>Agencija</strong> <strong>RS</strong> <strong>za</strong> <strong>okolje</strong>, Poročilo o kakovosti vode <strong>za</strong> življenje sladkovodnih vrst rib
R E F E R E N C E S<br />
55. Pravilnik o določitvi odsekov površ<strong>in</strong>skih voda, pomembnih <strong>za</strong> življenje sladkovodnih vrst rib, Uradni<br />
list <strong>RS</strong> št. 28/05<br />
56. Uredba o kakovosti površ<strong>in</strong>skih voda <strong>za</strong> življenje sladkovodnih vrst rib, Uradni list <strong>RS</strong> št. 46/02<br />
57. Pravilnik o imisijskem monitor<strong>in</strong>gu kakovosti površ<strong>in</strong>ske vode <strong>za</strong> življenje sladkovodnih vrst rib,<br />
Uradni list <strong>RS</strong> št. 71/02<br />
58. Direktiva 2006/44/ES o kakovosti sladkih voda, ki jih je treba <strong>za</strong>varovati ali izboljšati, da se omogoči<br />
življenje rib (Directive of the European Parliament and the Council of 6 September 2006 on the<br />
quality of fresh waters need<strong>in</strong>g<br />
59. Council Directive 79/923/EEC on the quality required of shellfish waters<br />
60. Uredba kakovosti vode <strong>za</strong> življenje <strong>in</strong> rast morskih školjk <strong>in</strong> morskih polžev, Uradni list <strong>RS</strong> št. 46/02<br />
61. Pravilnik o monitor<strong>in</strong>gu kakovosti površ<strong>in</strong>ske vode <strong>za</strong> življenje <strong>in</strong> rast morskih školjk <strong>in</strong> morskih<br />
polžev, Uradni list <strong>RS</strong> št. 71/02<br />
62. Pravilnik o določitvi delov morja, kjer je kakovost vode primerna <strong>za</strong> življenje <strong>in</strong> rast morskih školjk <strong>in</strong><br />
morskih polžev, Uradni list <strong>RS</strong> št. 84/07<br />
63. <strong>Agencija</strong> <strong>RS</strong> <strong>za</strong> <strong>okolje</strong>, Program monitor<strong>in</strong>ga kakovosti vode <strong>za</strong> življenje morskih školjk <strong>in</strong> morskih<br />
polžev<br />
64. Nacionalna ba<strong>za</strong> hidrogeoloških podatkov <strong>za</strong> opredelitev teles podzemnih voda, Geološki Zavod<br />
Slovenije, 2005, 2006<br />
65. Pravilnik o določitvi vodnih teles podzemnih voda, Uradni list <strong>RS</strong> št. 63/05 vode <strong>RS</strong><br />
66. <strong>Agencija</strong> <strong>RS</strong> <strong>za</strong> <strong>okolje</strong>, 2007: Poročilo o kakovosti podzemne vode v Sloveniji, str. 1–272<br />
67. Uredba o standardih kakovosti podzemne vode (Uradni list <strong>RS</strong>, 100/2005<br />
68. Pravilnik o imisijskem monitor<strong>in</strong>gu podzemne vode (Uradni list <strong>RS</strong>, 64/2004)<br />
69. Directive 2006/7/EC of the European Parliament and of the Council of 12 December 2006 on the<br />
protection of groundwater aga<strong>in</strong>st pollution and deterioration<br />
70. <strong>Agencija</strong> <strong>RS</strong> <strong>za</strong> <strong>okolje</strong>, Program spremljanja kemijskega stanja podzemne vode<br />
69
70<br />
6<br />
W A T E R Q U A L I T Y I N S L O V E N I A<br />
Glossary of terms<br />
AOX Adsorbable organic halogen compounds; summary<br />
parameter <strong>in</strong>dicative for the content of organically bound<br />
halogens (chlor<strong>in</strong>e, brom<strong>in</strong>e, iod<strong>in</strong>e), calculated as chloride.<br />
Anthropogenic pressure Impact of human activity.<br />
Aquifer A subsurface layer or layers of rock or other geological<br />
strata of sufficient porosity and permeability to allow<br />
either a significant flow of groundwater or the abstraction<br />
of significant quantities of groundwater.<br />
Atraz<strong>in</strong>e An organic compound, the herbicide used for the control<br />
of broadleaf weeds.<br />
Benthic diatom Unicellular algae with the cell wall made of silicon dioxide,<br />
liv<strong>in</strong>g at the bottom of a river bed, lake or sea.<br />
Benthic <strong>in</strong>vertebrate fauna Animals liv<strong>in</strong>g at the bottom of a riverbed, lake or sea<br />
and are of different sizes; organisms larger than 1 mm are<br />
called macro benthic <strong>in</strong>vertebrates, organisms smaller<br />
than 1 mm belong to mesobenthic <strong>in</strong>vertebrates and<br />
organisms smaller than 0.5 mm belong to microbenthic<br />
<strong>in</strong>vertebrates.<br />
Biodiversity Species diversity or diversity of liv<strong>in</strong>g organisms, which<br />
comprises various levels of life: species , genetic and<br />
ecosystem diversity.<br />
Biogenious element A chemical element which is <strong>in</strong> extremely low<br />
concentrations necessary for normal metabolism.<br />
Catchment area The area from which water naturally dra<strong>in</strong>s <strong>in</strong>to a river or<br />
<strong>in</strong>to a specific po<strong>in</strong>t.<br />
Determ<strong>in</strong>ation level A classification level of organisms <strong>in</strong>to systematic<br />
categories.<br />
Ecological potential Ecological potential is a status of a heavily modified or an<br />
artificial body of water.<br />
EOX Extractable organic halogen compounds.<br />
Eutrophication Enrichment of water with nutrients, especially nitrogen<br />
and phosphorus compounds, which results <strong>in</strong> an<br />
excessive growth of planktonic algae and higher aquatic<br />
plants; the consequence is a disturbance <strong>in</strong> the balance<br />
and deterioration of water quality.<br />
Groundwater body A dist<strong>in</strong>ct volume of groundwater with<strong>in</strong> an aquifer or<br />
aquifers.<br />
Heavily modified water body A surface water body, which is substantially changed as a<br />
result of physical alterations by human activity.
G L O S S A R Y O F T E R M S<br />
Hydromorphological conditions The hydrological regime and morphological conditions<br />
of water. The hydrological regime: the quantity<br />
and dynamics of the water current and l<strong>in</strong>kage to<br />
groundwater bodies. The morphological conditions: the<br />
depth and width of the river, the structure and substrate<br />
of the river bed and the structure of the riverbank zone.<br />
Indicative list of parameters or list of<br />
nationally relevant substances<br />
Ha<strong>za</strong>rdous substances for which it has been determ<strong>in</strong>ed<br />
on a national level that, due to their presence and<br />
widespread use, they present risks to the environment<br />
and man.<br />
Indicative weight Taxon <strong>in</strong> one or several quality classes, expressed as<br />
number rang<strong>in</strong>g from 1 to 5.<br />
Littoral Shore or coastal zone of a water body where the sunlight<br />
reaches the bottom.<br />
Macrophytes Larger aquatic plants (some algae - Characeae, mosses,<br />
ferns, higher plants).<br />
MBAS Methylene blue active substances, produced by the<br />
reaction of anionic surface-active substances and<br />
methylene blue.<br />
Metolachlor An organic compound, the herbicide used for weed<br />
control <strong>in</strong> agriculture, at the roadside and <strong>in</strong> ornamental<br />
plant grow<strong>in</strong>g.<br />
Multimicrohabitat sampl<strong>in</strong>g method A method of sampl<strong>in</strong>g benthic <strong>in</strong>vertebrate fauna,<br />
adapted to the requirements of the <strong>Water</strong> Framework<br />
Directive.<br />
OECD Organisation for Economic Cooperation and<br />
Development.<br />
Organic pollution Pollution of water with organic substances.<br />
PAHs Polycyclic aromatic hydrocarbons<br />
PCBs Polychlor<strong>in</strong>ated biphenyls; a common term for chlor<strong>in</strong>e<br />
substituted biphenyls; many PCBs are persistent, they<br />
accumulate <strong>in</strong> the food cha<strong>in</strong> and have long-last<strong>in</strong>g<br />
damag<strong>in</strong>g effects on organisms.<br />
Periphyton A biotic community of organisms permanently or<br />
occasionally attached to a solid underwater surface.<br />
Phytobenthos Plants liv<strong>in</strong>g at the bottom of a river bed, lake or sea.<br />
Phytoplankton Plant organisms carried by water or float<strong>in</strong>g <strong>in</strong> it.<br />
Photosynthesis Synthesis of organic substances from carbon dioxide<br />
and water occurr<strong>in</strong>g <strong>in</strong> green plants <strong>in</strong> the presence of<br />
sunlight.<br />
Priority list of ha<strong>za</strong>rdous substances The list of substances that present a significant risk to<br />
the environment and man, and are classified for priority<br />
action; they are listed <strong>in</strong> Appendix X of the <strong>Water</strong><br />
Framework Directive.<br />
71
72<br />
W A T E R Q U A L I T Y I N S L O V E N I A<br />
Protected areas <strong>Water</strong> sections important for the life of freshwater fish<br />
species ; parts of the sea with an appropriate water quality<br />
for the life of mar<strong>in</strong>e molluscs and gastropods; surface<br />
waters <strong>in</strong>tended for human consumption; bath<strong>in</strong>g waters<br />
<strong>in</strong> bath<strong>in</strong>g areas.<br />
Reservoir An object <strong>in</strong>tended for the storage of water and/or its<br />
regulation and control.<br />
River Accumulation An artificial reservoir made by build<strong>in</strong>g a barrier (a dam)<br />
across a water course beh<strong>in</strong>d which water starts to<br />
accumulate. Such reservoir is primarily used to drive a<br />
hydroelectric power plant.<br />
Saprobic value Taxon efficiency <strong>in</strong> relation to organic pollution – saprobic<br />
quality of the aquatic environment.<br />
Saprobic <strong>in</strong>dex Numeric expression represent<strong>in</strong>g the level of organic<br />
pollution.<br />
Siphon <strong>in</strong> Lake Bled An artificial outflow of deep - hypolymnetic water from a<br />
lake.<br />
Surface water body A discrete and significant element of surface water<br />
Taxon An organism with<strong>in</strong> a specific systematic category.<br />
Trophic status Status accord<strong>in</strong>g to the amount of nutrients present for<br />
plants.<br />
<strong>Water</strong> emission monitor<strong>in</strong>g The monitor<strong>in</strong>g of wastewater discharges from sources of<br />
pollution <strong>in</strong>to the environment.<br />
<strong>Water</strong> imission monitor<strong>in</strong>g Monitor<strong>in</strong>g of effects of pollution on water quality.