5 Hirsch-Fye quantum Monte Carlo method for ... - komet 337
5 Hirsch-Fye quantum Monte Carlo method for ... - komet 337
5 Hirsch-Fye quantum Monte Carlo method for ... - komet 337

You also want an ePaper? Increase the reach of your titles
YUMPU automatically turns print PDFs into web optimized ePapers that Google loves.
5.10 Nils Blümer<br />
(a) (b) (c) (d)<br />
8<br />
7<br />
6<br />
5<br />
4<br />
3<br />
2<br />
1<br />
8<br />
7<br />
6<br />
5<br />
4<br />
3<br />
2<br />
1<br />
8<br />
7<br />
6<br />
5<br />
4<br />
3<br />
2<br />
1<br />
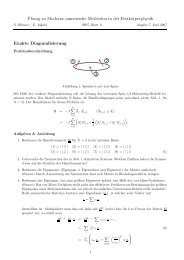
Fig. 4: Illustration of importance sampling <strong>Monte</strong> <strong>Carlo</strong>, here <strong>for</strong> 8 states: (a) the simulation<br />
is initialized by randomly choosing a starting configuration, here state 4. (b) Transitions to the<br />
neighborhood of the old state are proposed, here <strong>for</strong> states snew = sold ± 1. (c) A move (here<br />
+1) is accepted. (d) The history of the simulation (here with 5 attempted updates) consists<br />
both of accepted and declined updates. The normalized histogram of the visited configurations<br />
(red lines) approaches the target probability distribution (only) in the limit of infinite simulation<br />
length. For finite runs, states in the vicinity of the starting configuration may be overrepresented;<br />
this “warm-up” part should be discarded.<br />
ities might be vanishingly small. They would otherwise be overrepresented in any run of finite<br />
length. Consequently, we will later distinguish “warmup sweeps” from “measurement sweeps”.<br />
For the computation of errors, one has to take into account the finite autocorrelation induced by<br />
the Markov process, i.e., correlation between subsequent measurements. This correlaton may<br />
be characterized by the autocorrelation time 11 κo ≥ 1 which effectively reduces the number of<br />
independent samples, so that∆X = c � voκo/N. The numerical ef<strong>for</strong>t necessary to reach some<br />
target statistical accuracy ∆X nevertheless increases only as (1/∆X) 2 .<br />
2.3 Single-spin flip implementation of the HF-QMC <strong>method</strong><br />
Returning to the evaluation of the Green function using (16) and (17), the obvious choice is to<br />
sample configurations{s} according to the (unnormalized) probability<br />
�<br />
�<br />
P({s}) = �detM {s}<br />
↑ detM{s}<br />
�<br />
�<br />
↓ �. (28)<br />
The Green function can then be calculated as an average〈...〉s over these configurations:<br />
1<br />
Gσll ′ =<br />
˜Z =<br />
˜Z<br />
��M � {s} −1<br />
σ<br />
�<br />
sign<br />
ll ′ sign<br />
�<br />
detM {s}<br />
↑ detM{s} ↓<br />
8<br />
7<br />
6<br />
5<br />
4<br />
3<br />
2<br />
1<br />
�<br />
detM {s}<br />
↑ detM{s}<br />
��<br />
↓<br />
��<br />
s<br />
s<br />
, (29)<br />
. (30)<br />
Here, ˜ Z deviates from the full partition function by an unknown prefactor which cancels in<br />
(29). The same is true <strong>for</strong> other expectation values of the <strong>for</strong>m (5). The inability to compute<br />
11For a set{o1,o2,...,oN} of measurements, the autocorrelation function (<strong>for</strong> the observableo) isco l<br />
〈o〉)(ok+l −〈o〉)〉k. An associated autocorrelation time may then be defined as κo = co 0 +2 �N0 l=1col cutoffN0 is determined byco l > 0 <strong>for</strong>l ≤ N0 andcN0+1 < 0.<br />
= 〈(ok−<br />
, where the