

A Monte Carlo pencil beam scanning model for proton ... - Creatis
A Monte Carlo pencil beam scanning model for proton ... - Creatis
A Monte Carlo pencil beam scanning model for proton ... - Creatis

Create successful ePaper yourself
Turn your PDF publications into a flip-book with our unique Google optimized e-Paper software.
5216 L Grevillot et al<br />
(a) (b)<br />
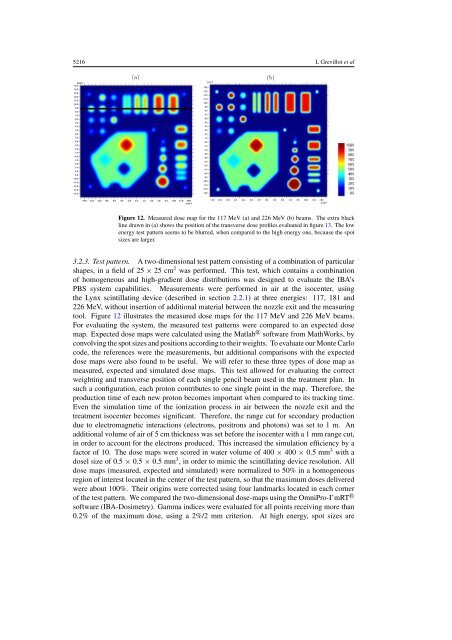
Figure 12. Measured dose map <strong>for</strong> the 117 MeV (a) and 226 MeV (b) <strong>beam</strong>s. The extra black<br />
line drawn in (a) shows the position of the transverse dose profiles evaluated in figure 13. Thelow<br />
energy test pattern seems to be blurred, when compared to the high energy one, because the spot<br />
sizes are larger.<br />
3.2.3. Test pattern. A two-dimensional test pattern consisting of a combination of particular<br />
shapes, in a field of 25 × 25 cm 2 was per<strong>for</strong>med. This test, which contains a combination<br />
of homogeneous and high-gradient dose distributions was designed to evaluate the IBA’s<br />
PBS system capabilities. Measurements were per<strong>for</strong>med in air at the isocenter, using<br />
the Lynx scintillating device (described in section 2.2.1) at three energies: 117, 181 and<br />
226 MeV, without insertion of additional material between the nozzle exit and the measuring<br />
tool. Figure 12 illustrates the measured dose maps <strong>for</strong> the 117 MeV and 226 MeV <strong>beam</strong>s.<br />
For evaluating the system, the measured test patterns were compared to an expected dose<br />
map. Expected dose maps were calculated using the Matlab R○ software from MathWorks, by<br />
convolving the spot sizes and positions according to their weights. To evaluate our <strong>Monte</strong> <strong>Carlo</strong><br />
code, the references were the measurements, but additional comparisons with the expected<br />
dose maps were also found to be useful. We will refer to these three types of dose map as<br />
measured, expected and simulated dose maps. This test allowed <strong>for</strong> evaluating the correct<br />
weighting and transverse position of each single <strong>pencil</strong> <strong>beam</strong> used in the treatment plan. In<br />
such a configuration, each <strong>proton</strong> contributes to one single point in the map. There<strong>for</strong>e, the<br />
production time of each new <strong>proton</strong> becomes important when compared to its tracking time.<br />
Even the simulation time of the ionization process in air between the nozzle exit and the<br />
treatment isocenter becomes significant. There<strong>for</strong>e, the range cut <strong>for</strong> secondary production<br />
due to electromagnetic interactions (electrons, positrons and photons) was set to 1 m. An<br />
additional volume of air of 5 cm thickness was set be<strong>for</strong>e the isocenter witha1mmrange cut,<br />
in order to account <strong>for</strong> the electrons produced. This increased the simulation efficiency by a<br />
factor of 10. The dose maps were scored in water volume of 400 × 400 × 0.5 mm 3 with a<br />
dosel size of 0.5 × 0.5 × 0.5 mm 3 , in order to mimic the scintillating device resolution. All<br />
dose maps (measured, expected and simulated) were normalized to 50% in a homogeneous<br />
region of interest located in the center of the test pattern, so that the maximum doses delivered<br />
were about 100%. Their origins were corrected using four landmarks located in each corner<br />
of the test pattern. We compared the two-dimensional dose-maps using the OmniPro-I’mRT R○<br />
software (IBA-Dosimetry). Gamma indices were evaluated <strong>for</strong> all points receiving more than<br />
0.2% of the maximum dose, using a 2%/2 mm criterion. At high energy, spot sizes are


