Create successful ePaper yourself
Turn your PDF publications into a flip-book with our unique Google optimized e-Paper software.
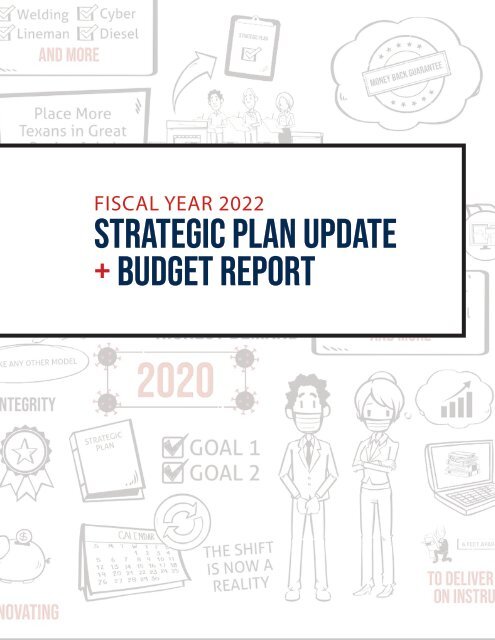
FISCAL YEAR 2022<br />
STRATEGIC PLAN UPDATE<br />
+ BUDGET REPORT
CORE VALUES<br />
EXCELLENCE<br />
ACCOUNTABILITY<br />
SERVICE<br />
INTEGRITY<br />
The Leadership Team<br />
Ray<br />
Rushing<br />
Jonathan<br />
Hoekstra<br />
Gail<br />
Lawrence<br />
Mike<br />
Reeser<br />
Jeff<br />
Kilgore<br />
Rick<br />
Herrera<br />
Michael<br />
Bettersworth<br />
2<br />
STRATEGIC PLAN & BUDGET REPORT
APPROVED BY BOARD OF REGENTS 8/19/2021<br />
a letter from the cfo<br />
To our Regents,<br />
Ten years ago, the Board did not receive a single budget<br />
proposal from TSTC. They heard 5 different budget<br />
presentations in support of different plans. At that time,<br />
the $165 million combined budget supported 7 campuses<br />
and 2,500 employees, which graduated about 2,000<br />
students per year. That’s when the Board appointed Mike<br />
Reeser Chancellor.<br />
Immediately, Chancellor Reeser challenged the College<br />
to no longer pursue perfection of the irrelevant. To take a<br />
focused look at our mission, he rallied the firm under the<br />
mantra “Place More Texans in Great Paying Jobs.”<br />
Today, as a single TSTC community, it is clear that our<br />
transformation has been substantial. We are highly<br />
focused, boldly challenging conventional ideas, and<br />
bringing the team together and forward on the journey.<br />
Last year, it would have been understandable to allow the<br />
extraordinary circumstances of COVID to slow our progress. Instead, we recognized the change-accelerating<br />
nature of the moment and charged ahead.<br />
This year, we’ve taken the opportunity during our natural rhythm of planning and budgeting to retrace some<br />
of our steps. We’re proud of the story and especially the results. This year, we expect to produce over 2,800<br />
graduates from across 10 different campuses. These students’ employment prospects far exceed the cohorts<br />
of students before them.<br />
We now have an enviable culture. It is truly a great place to work for the 1,617 people committed to our cause.<br />
For a decade, TSTC prepared for disruptive change and found itself ready to respond to the challenges of<br />
COVID-19. Tomorrow’s market leaders must imagine and continue preparing for a different kind of future. We<br />
invite you to participate in that process during the next year.<br />
I trust that our story, our plan update and our budget overview provide clear context surrounding the $240<br />
million budget proposed for the Board’s consideration.<br />
With deep appreciation,<br />
Jonathan Hoekstra, CPA, MBA, Vice Chancellor & Chief Financial Officer<br />
STRATEGIC PLAN & BUDGET REPORT<br />
3
CONTENTS<br />
3<br />
5<br />
A LETTER FROM THE CFO<br />
CONTEXT FOR PLANNING<br />
PRE-PANDEMIC<br />
COVID: A ONE-OFF YEAR<br />
7<br />
PREPARING FOR WHAT’S NEXT<br />
STRATEGIC PLAN UPDATE<br />
WILDLY IMPORTANT GOAL 1<br />
10<br />
11<br />
12<br />
16<br />
17<br />
18<br />
19<br />
WILDLY IMPORTANT GOAL 3<br />
FISCAL YEAR 2022 BUDGET PRESENTATION<br />
FISCAL YEAR 2022 ANNUAL OPERATING BUDGET<br />
OPERATING REVENUES<br />
OPERATING EXPENSES<br />
COVID-19 RELIEF<br />
CAPITAL BUDGET<br />
EXHIBITS<br />
4<br />
STRATEGIC PLAN & BUDGET REPORT
APPROVED BY BOARD OF REGENTS 8/19/2021<br />
CONTEXT FOR PLANNING<br />
<strong>Plan</strong>ning and budgeting cycles at TSTC begin<br />
with an assessment of the environmental<br />
situation as context for planning. For fiscal<br />
year 2022, this is dominated by the impact of<br />
COVID-19. Indeed, as the world emerges from<br />
the pandemic and the related shutdown, the<br />
context for TSTC’s planning and budgeting is<br />
best organized from the perspective of TSTC<br />
before, during and after the pandemic.<br />
Pre-Pandemic<br />
In the years leading up to the pandemic, TSTC<br />
clarified its purpose with a simple message<br />
that summed up its mission: Place More<br />
Texans in Great Paying Jobs. However, before<br />
setting its course, leadership took note of<br />
the disruptive environment facing the higher<br />
education industry. The College recognized<br />
the Texas Legislature’s increasing appetite<br />
for accountability from public colleges and<br />
universities, the broader culture’s growing<br />
skepticism about the value proposition of<br />
higher education, and employers’ angst about<br />
an expanding skills gap (increasing demand<br />
for skills that is historically flat in supply). In<br />
addition, the contrast of higher education’s<br />
old operating model with the exponentially<br />
changing environment heavily influenced TSTC’s<br />
messaging and plans.<br />
Leveraging its differentiation, the College<br />
reached many historical milestones in the years<br />
that approached the pandemic including the<br />
following:<br />
1.<br />
2.<br />
Pioneering the nation’s only placement<br />
and wage-based funding formula, linking<br />
the interests of the College to needs of<br />
employers and students.<br />
Expanding the College’s footprint into<br />
fast-growing regions of East Austin, South<br />
Dallas, and West Houston.<br />
3.<br />
4.<br />
5.<br />
Streamlining and focusing the functions<br />
of the College through a merger of college<br />
accreditations, operations, and curriculum.<br />
Shaping and sustaining a new, valuescentered<br />
culture under the recognition that<br />
healthy organizations are more effective<br />
organizations.<br />
Establishing a program vitality framework<br />
for measurement and assessment<br />
of program outcomes towards the<br />
achievement of student and employer<br />
success.<br />
These milestones were achieved as the College<br />
pursued the goals of its first statewide strategic<br />
plan. In February 2020, after assessing the<br />
College’s progress to date, leadership and the<br />
Board established new targets under the same<br />
strategic plan goal areas.<br />
A month later, the COVID-19 virus arrived in the<br />
United States.<br />
COVID: A One-Off Year<br />
Years of implementing organizational change in<br />
preparation for a vastly different future enabled<br />
TSTC to react with confidence during the global<br />
pandemic. Much like the rest of the world, TSTC<br />
operations shifted to a remote format while the<br />
College prepared for the next version of TSTC<br />
and higher education.<br />
TSTC leadership activated the College’s<br />
Emergency Response Team at the first sign of<br />
concern in 2020. This foresight and discernment<br />
was not shared across the industry, but the<br />
College provided a path for its peers and<br />
the state by adopting the following guiding<br />
principles and persevering through the unknown:<br />
Protect the health and safety of students<br />
and employees.<br />
Protect the health and safety of our<br />
communities.<br />
Do our job of teaching and placing students.<br />
Keep TSTC and our employees as fiscally<br />
sound as we possibly can.<br />
STRATEGIC PLAN & BUDGET REPORT<br />
5
These pillars provided clarity and comfort<br />
to TSTC’s team as they resumed classes and<br />
continued innovating. Accelerating new teaching<br />
modalities and modifying facilities to deliver<br />
hands-on instruction in a new and sociallydistant<br />
format kept the College open. These<br />
procedures would ensure the teammates and<br />
students were safe and productive.<br />
TSTC will emerge from the pandemic, one-off<br />
season as the college that first brought its<br />
students back to campus. This occurred without<br />
incident. Though operations were slightly<br />
disrupted, they resumed in either a remote or<br />
socially-distant manner.<br />
Legions of TSTC personnel adapted swiftly to<br />
the new requirements, resuming service to our<br />
students and transitioning to new methods of<br />
working and teaching.<br />
Preparing for What’s Next<br />
The competitive advantages in higher education<br />
have been leveled and new imperatives have<br />
emerged. No one could have predicted the<br />
pandemic, but TSTC did anticipate rapid and<br />
dramatic change to higher education. This<br />
anticipation and readiness was a true advantage<br />
through this season. TSTC continues to keep its<br />
focus on the horizon to maintain its leadership<br />
position in the changing times ahead.<br />
TSTC will become the market-relevant and<br />
laser-focused skills provider in Texas, but<br />
planning for this next phase includes deepening<br />
relationships with industry and student-centric<br />
operations while continuing to build upon<br />
the values and principles that make TSTC an<br />
employer of choice.<br />
TSTC leadership and the Board will explore this<br />
changing landscape during fiscal year 2022<br />
as insights from the last decade and this most<br />
recent one-off pandemic season inform the next<br />
iteration of the strategic plan.<br />
6<br />
STRATEGIC PLAN & BUDGET REPORT
APPROVED BY BOARD OF REGENTS 8/19/2021<br />
STRATEGIC PLAN UPDATE<br />
Changing Up The Mix<br />
In reviewing WIG 1, consider this scenario:<br />
Operational <strong>Plan</strong>ning & Assessment<br />
<strong>Plan</strong>, budget, execute, then measure. Sustaining<br />
the College’s operational planning and<br />
assessment cycle is an ongoing process. The<br />
outcomes of this process allow leaders to<br />
make evidence-based decisions for continuous<br />
improvement.<br />
All divisions of the College set goals and<br />
evaluate performance under the overarching<br />
Wildly Important Goals (WIGs) set by the Board.<br />
TSTC’s first strategic plan was adopted 4 years<br />
ago. Since then the Board and College narrowed<br />
their plans to two WIGs focusing on Student<br />
Success and Organizational Health.<br />
Wildly Important Goal 1:<br />
Student Success<br />
In contrast to traditional academic institutions,<br />
TSTC was established to be an economic<br />
generator for the State of Texas. Wildly<br />
Important Goal 1 prioritizes the optimization<br />
and innovation of the student pipeline that<br />
produces graduates to go into the Texas<br />
workforce. From recruiting to job placement,<br />
the TSTC student experience must meet student<br />
needs and industry demand.<br />
TSTC’s pipeline involves a curated mix of<br />
programs and a modern day learning platform<br />
with curriculum calibrated specifically to the<br />
needs of Texas industry. Instructional leadership<br />
continually tracks program performance using<br />
core indicators such as enrollment, persistence,<br />
graduates and first year wage growth. As is true<br />
of any pipeline, events occurring upstream have<br />
downstream effects. For the College’s pipeline,<br />
this means that circumstances defining a single<br />
cohort of students impacts the entire pipeline<br />
until that cohort exits the pipeline into the<br />
workforce.<br />
Prior to 2019, TSTC offered a program in<br />
agricultural technology. Through the College’s<br />
ongoing program assessment process,<br />
leadership concluded several programs no<br />
longer delivered student outcomes worthy of<br />
inclusion in its mix of programs. The College<br />
would replace the low performing program with<br />
the higher performing electrical lineworker<br />
program.<br />
In this scenario, you can easily assess the impact<br />
on two hypothetical students.<br />
One is an agricultural technology graduate. She<br />
can expect a wage of $39,000 a few years after<br />
transferring and completing her studies at a<br />
four-year institution. By that time the electrical<br />
lineworker student will graduate and earn<br />
$119,000, a salary that started at $67,000 and<br />
grew over the next five years.<br />
It’s obvious which program and which outcome<br />
is better for the student, and therefore better for<br />
TSTC and Texas Industry. However, these choices<br />
create short term challenges for the College.<br />
Closing programs and replacing that capacity<br />
stalls TSTC’s production of graduates, which is<br />
reflected in the goals.<br />
01<br />
Time At TSTC<br />
Time At TSTC<br />
Time At University<br />
Time At University<br />
Starting Salary<br />
Salary After 3 Years<br />
Starting Salary<br />
WIG 1: Student Success<br />
High-Tech & High-Demand<br />
WIG 1: Student Success<br />
High-Tech & High-Demand<br />
2 years<br />
2 years<br />
2 years<br />
2 $26,000 years<br />
$39,000<br />
$26,000<br />
20 months<br />
20 months<br />
none<br />
$67,000<br />
$119,000<br />
none<br />
$67,000<br />
Salary After 3 Years<br />
$39,000<br />
STRATEGIC PLAN & BUDGET REPORT<br />
$119,000<br />
7
02<br />
3750<br />
WIG 1: Student Success<br />
Performance Trend & Forecast<br />
Actuals<br />
2021 Original Forecast<br />
2022 Revised Forecast<br />
WIG Goal<br />
3500<br />
3,549<br />
3,382<br />
3,334<br />
3250<br />
3,065<br />
3,257<br />
3,145<br />
3,164<br />
3,238<br />
3,035<br />
3,106<br />
3000<br />
3,046<br />
2,949<br />
2750<br />
2,838 2,844<br />
2016 2017 2018 2019 2020 2021 2022 2023 2024<br />
In February 2020, when establishing the WIG<br />
1 goals, leadership and the Board accounted<br />
for some of these cohort-impacting events.<br />
Specifically, in 2019, leadership closed 14<br />
instructional programs which no longer<br />
delivered student placement and wage<br />
outcomes worthy of inclusion in TSTC’s program<br />
mix. The College factored in the phase-out<br />
of the students historically enrolled in these<br />
programs in establishing a new trajectory of<br />
graduate production. The long-term goal would<br />
return production of graduates to the 2019 high<br />
water-mark by fiscal year 2022. Ultimately, the<br />
graduates lost will be replaced with those in<br />
programs with higher employability outcomes<br />
under this new, curated program mix.<br />
The renewed strategic plan anticipated<br />
6% growth in annual enrollment and a 6%<br />
increase in our graduate rate production for the<br />
programs that remained after the 2019 closures.<br />
Leadership and management accepted a 3 year<br />
goal of returning the graduate count from 3,257<br />
in fiscal year 2019 to 3,238 in fiscal year 2022.<br />
Returning to 2019 levels will be delayed based<br />
on our latest forecast. The impact of COVID<br />
reduced the student cohorts of fiscal year<br />
2020 and 2021, impacting TSTC’s 3 and 5 year<br />
plans. TSTC produced 10% fewer graduates in<br />
2020 than hoped for in the original goal, with<br />
the impact persisting in the following years.<br />
The downstream effect of COVID’s impact on<br />
the 2020 and 2021 cohorts is illustrated in<br />
the revised trajectory (the line graph). Based<br />
on the most recent count of students, TSTC is<br />
anticipating 3,035 students will graduate in<br />
fiscal year 2022 and 3,334 will graduate in<br />
fiscal year 2024.<br />
3-YEAR GOAL<br />
Return the graduate count from 3,257<br />
in fiscal year 2019 to 3,238 by fiscal<br />
year 2022.<br />
5-YEAR GOAL<br />
Increase the graduate count from 3,257<br />
in fiscal year 2019 to 3,549 by fiscal<br />
year 2024.<br />
8<br />
STRATEGIC PLAN & BUDGET REPORT
APPROVED BY BOARD OF REGENTS 8/19/2021<br />
Wildly Important Goal 3:<br />
Organizational Health<br />
3-YEAR GOAL<br />
Increase the overall score on the Survey<br />
of Employee Engagement to 400 by<br />
fiscal year 2022.<br />
5-YEAR GOAL<br />
Increase and maintain the overall<br />
score on the Survey of Employee<br />
Engagement to 400 through<br />
fiscal year 2024.<br />
TSTC’s focus on organizational health provided<br />
a clear advantage during fiscal year 2020<br />
and 2021. Like the rest of the world, TSTC’s<br />
workplace dynamics changed abruptly with<br />
virtually no warning. The College immediately<br />
activated the Emergency Response Team at the<br />
first signs of the disruption before the nation<br />
had really braced for impact. TSTC assembled<br />
and deployed a team of contact tracers to<br />
monitor all cases through resolution and<br />
throttled up communication protocols ensuring<br />
the TSTC community received constant and clear<br />
updates.<br />
The College continued developing its ranks<br />
of leaders and managers and launched a<br />
new Pay for Performance compensation<br />
strategy. The result is a renewed focus on<br />
recognizing and rewarding employees for<br />
performance excellence and outcomes.<br />
Phase 1 of this initiative saw over 320<br />
employees receive a “Pay for Performance”<br />
compensation increases in recognition of<br />
their sustained work excellence.<br />
TSTC exceeded its goal with an overall score<br />
of 404 on the 2021 Survey of Employee<br />
Engagement. The College exceeded its<br />
sustainability goal of 400 despite the abrupt<br />
changes affecting the workforce last year.<br />
Through TSTC’s dedication to the creation of<br />
a healthy, productive culture, insights have<br />
emerged and TSTC is assembling these into a<br />
declaration of our principles and beliefs.<br />
03<br />
WIG 3: Organizational Health<br />
Performance Trend & Forecast<br />
410<br />
400<br />
407<br />
404<br />
400<br />
400<br />
400<br />
Survey of Employee Engagement<br />
390<br />
380<br />
370<br />
360<br />
372<br />
378<br />
388<br />
350<br />
2017 2018 2019 2020 2021 2022 2023 2024<br />
STRATEGIC PLAN & BUDGET REPORT<br />
9
FISCAL YEAR 2022<br />
BUDGET PRESENTATION<br />
Organizational Structure &<br />
<strong>Budget</strong> Framework<br />
TSTC’s organizational and leadership structures<br />
continuously evolve and this year was no<br />
exception. Leadership restructured with the<br />
creation of a new division, External Relations,<br />
combining all departments that interact with<br />
external constituents, including potential<br />
students, graduates, donors, industry, or<br />
legislative stakeholders. External Relations<br />
will strengthen and deepen relationships<br />
with industry and external constituents by<br />
strategically aligning the outward facing<br />
departments of the College to unify TSTC’s voice<br />
and brand.<br />
The new organizational structure and resulting<br />
allocation of resources across the College is<br />
illustrated below.<br />
04<br />
Presentation, Assumptions & Estimates<br />
Various line items in prior year budget and<br />
actual amounts are reclassified to align<br />
with the current organizational structure<br />
and budget framework for consistency in<br />
comparative analysis.<br />
Fiscal year 2021 forecast amounts and<br />
certain fiscal year 2022 budget amounts<br />
use available data and related estimates<br />
as of May 31, 2021.<br />
The College will realize appropriation<br />
revenues in accordance with bill patterns<br />
established by the 87th Legislature.<br />
TSTC prepares budgets using a cash basis<br />
of accounting, including budgeting debt<br />
service payments (principal and interest),<br />
and excluding depreciation expense from<br />
the budget.<br />
The annual budget report is a starting<br />
point. TSTC anticipates many refinements<br />
to this budget throughout the year as<br />
the needs and circumstances of all<br />
TSTC departments continually change,<br />
especially given the many financial<br />
uncertainties related to the COVID-19<br />
pandemic.<br />
4%<br />
Finance<br />
6%<br />
External<br />
Relations<br />
13%<br />
Shared<br />
Resources<br />
13%<br />
Statewide<br />
Benefits<br />
16%<br />
Student<br />
Services<br />
2%<br />
Statewide<br />
Administration<br />
2022 <strong>Budget</strong><br />
$240,490,937<br />
25%<br />
Instruction<br />
21%<br />
Student<br />
Financial Aid<br />
10<br />
STRATEGIC PLAN & BUDGET REPORT
APPROVED BY BOARD OF REGENTS 8/19/2021<br />
FISCAL YEAR 2022<br />
ANNUAL OPERATING BUDGET<br />
FY 2020 FY 2021 FY 2021 FY 2022<br />
REVENUE Actual <strong>Budget</strong> Forecast <strong>Budget</strong><br />
Appropriations - Returned Value Formula 66,124,351 66,124,351 66,124,351 69,944,409<br />
Special Items & Other Appropriations 23,000,122 23,169,199 23,169,199 24,328,988<br />
Appropriations - HEAF 8,662,500 8,662,500 8,662,500 8,662,500<br />
Appropriations - TRB Retirement 3,758,881 3,757,232 3,757,232 3,752,809<br />
Appropriations - Group Insurance 14,335,594 14,163,822 14,163,822 13,930,449<br />
Appropriations - Benefits Match 10,454,389 10,721,329 9,838,467 10,789,000<br />
Tuition 43,833,112 44,192,647 43,100,000 43,966,000<br />
Student Financial Aid 31,142,956 33,369,711 31,869,206 31,595,000<br />
Auxiliary Services 10,448,791 10,118,700 8,160,000 9,003,284<br />
Fees & Educational Sales 3,745,122 3,738,936 3,708,000 3,127,500<br />
Industry Relations 1,520,662 3,314,000 1,550,000 2,575,400<br />
Grants 9,739,178 9,006,112 19,984,515 15,431,075<br />
Contracts & Other 3,882,858 3,717,700 2,940,030 2,408,366<br />
230,648,516 234,056,239 237,027,322 239,514,780<br />
Carryforward / Reserves 1,914,868 976,157<br />
EXPENSE<br />
Instruction 62,283,651 66,809,201 61,598,005 61,223,499<br />
Financial Aid 37,876,030 38,529,711 38,924,120 36,860,968<br />
Benefits 31,592,691 31,492,672 29,747,393 30,937,761<br />
Finance 9,506,441 10,756,887 9,243,118 10,027,838<br />
External Relations 15,110,315 16,429,279 15,324,261 14,038,386<br />
Auxiliary Services 10,221,668 10,966,612 8,771,586 9,333,756<br />
Student Services 8,968,579 11,064,571 9,344,799 10,319,289<br />
Facilities 9,355,980 9,961,314 8,894,104 9,179,100<br />
Facilities - Transfer to Capital <strong>Budget</strong> 3,690,836 1,808,924 1,832,924 1,114,958<br />
Information Technology 8,464,657 9,649,790 9,656,314 9,070,488<br />
Statewide Administration 4,171,313 4,608,063 4,351,175 4,534,902<br />
Debt Service 11,927,567 11,964,640 13,115,652 16,078,645<br />
Utilities and Other 6,706,931 7,808,277 9,570,002 6,842,785<br />
Grants 5,703,318 4,121,166 15,433,144 12,928,562<br />
<strong>Strategic</strong> Pool 0 0 0 8,000,000<br />
225,579,977 235,971,107 235,806,597 240,490,937<br />
Operating <strong>Budget</strong> Margin 5,068,539 0 1,220,725 0<br />
STRATEGIC PLAN & BUDGET REPORT<br />
11
OPERATING REVENUES<br />
Revenue Mix<br />
TSTC derives its budget from several sources<br />
of funds. State appropriations are the most<br />
significant revenue source, contributing 55<br />
percent of the College’s total revenues. Student<br />
tuition is the second largest category of<br />
revenues, contributing 18 percent of the total<br />
in fiscal year 2022. Student Financial Assistance<br />
passes through the College as revenue and<br />
is eventually applied to students’ accounts<br />
through an offsetting/equal expense. Other<br />
supplemental revenues including grants, pilot<br />
training fees, housing rents, retail sales and<br />
contract-related income combine to account<br />
for a smaller but still significant amount of<br />
revenues. The illustration below demonstrates<br />
the relative contributions from the different<br />
sources of funds.<br />
State Appropriations<br />
Total General Revenue appropriations for fiscal<br />
year 2022 increased approximately $5 million<br />
over amounts received in fiscal year 2021. By<br />
the conclusion of the 87th Legislative Session<br />
in May 2021, the Texas Legislature once again<br />
affirmed TSTC’s Returned-Value Formula by<br />
funding TSTC for the full amount earned in the<br />
formula, which was the primary factor for the<br />
increase in total appropriations. TSTC also saw<br />
a slight increase in the E&G Space Support<br />
appropriation, as the Texas Legislature generally<br />
increased these amounts for all institutions<br />
across the state.<br />
Other components of appropriation funding<br />
are considered “non-formula support”, which<br />
include the Small Institution Supplement,<br />
Institutional Enhancement, System Office<br />
Operations, and Startup Funding strategies.<br />
Capital improvement funding from the Higher<br />
Education Assistance Funds (HEAF) appropriation<br />
and specific appropriations that pay for Tuition<br />
Revenue Bond retirement (debt service) also<br />
contribute to total TSTC appropriations.<br />
05 06<br />
18%<br />
Tuition<br />
55%<br />
State<br />
Appropriations<br />
2022 Revenues<br />
$239,514,780<br />
14%<br />
Other*<br />
18%<br />
Tuition<br />
13%<br />
Student<br />
Financial<br />
Assistance 2022 Revenues<br />
55%<br />
State<br />
Appropriations<br />
$239,514,780<br />
14%<br />
Other*<br />
19%<br />
Benefits<br />
13%<br />
Student<br />
Financial<br />
Assistance<br />
53%<br />
Returned-Value<br />
Formula<br />
2022 Revenues:<br />
Appropriations<br />
$131,408,1553%<br />
Returned-Value<br />
Formula<br />
19%<br />
Special<br />
Items 19% and<br />
Benefits<br />
Other*<br />
6%<br />
2022 HEAF Revenues:<br />
Appropriations<br />
$131,408,155 3%<br />
Debt<br />
Service<br />
19%<br />
Specia<br />
Items an<br />
Other*<br />
H<br />
D<br />
Se<br />
Other*<br />
Grants<br />
7%<br />
Auxiliary Services<br />
4%<br />
Industry Relations Other* 1%<br />
7% Fees & Educational SalesE&G Space 1% Support<br />
4% Contracts & Other 1%<br />
1%<br />
1%<br />
1%<br />
12<br />
Start Up Funding<br />
4%<br />
Small Institution Supplement<br />
3%<br />
Institutional Enhancement<br />
3%<br />
System Office Operations & Other 2%<br />
Dual Credit 1%<br />
STRATEGIC PLAN & BUDGET REPORT<br />
Other*<br />
E&G Space Support<br />
6%<br />
Start Up Funding<br />
4%<br />
Small Institution Supplement<br />
3%<br />
Institutional 6% Enhancement<br />
3%<br />
System Office Operations & Other 2%<br />
Dual Credit 1%
APPROVED BY BOARD OF REGENTS 8/19/2021<br />
Returned-Value Formula Performance<br />
TSTC’s unique Returned-Value funding formula<br />
continues to pioneer a new way of higher<br />
education funding in Texas with positive results.<br />
In the most recent formula calculation used<br />
for the 87th Legislative Session, the number<br />
of graduates included in the formula remained<br />
consistent with prior years, while the average<br />
wages of those graduates over the five-year<br />
calculation period climbed to higher levels.<br />
These higher wages resulted in the increase in<br />
formula funding TSTC is realizing for fiscal year<br />
2022.<br />
TSTC increased its capability for estimating<br />
future returned formula forecasts. With an<br />
increasing but less than full confidence, TSTC<br />
anticipates this trend of higher wages to<br />
continue for at least two more biennia. The<br />
number of graduates at that time may trail<br />
off associated with the program closures that<br />
occurred in fiscal year 2019.<br />
By solely focusing on training in programs with<br />
high performance pay outcomes for students,<br />
TSTC has benefited from the funding drivers<br />
embedded in the formula, and the State of Texas<br />
continues to see the related economic growth,<br />
just as the original formula design intended.<br />
07<br />
TSTC's Returned-Value Formula<br />
Actual<br />
Forecast<br />
TSTC Student<br />
Wages<br />
2014-2015<br />
83rd<br />
275.47M<br />
2016-2017<br />
84th<br />
264.96M ▼4%<br />
2018-2019<br />
85th<br />
340.22M ▲28%<br />
2020-2021<br />
86th<br />
2022-2023<br />
87th<br />
371.87M ▲9% 389.51M ▲5%<br />
2024-2025<br />
88th<br />
458.74M ▲18%<br />
2026-2027<br />
89th<br />
650.78M ▲42%<br />
Commission Rate 36%<br />
36%<br />
36%<br />
36%<br />
36%<br />
36%<br />
36%<br />
Funded Rate 33% 36%<br />
28%<br />
36%<br />
36%<br />
TBD TBD<br />
234M<br />
Returned-Value<br />
Funding<br />
98M<br />
94M<br />
Earned<br />
Funded<br />
121M<br />
132M<br />
140M<br />
165M<br />
TBD<br />
TBD<br />
90M<br />
94M<br />
94M<br />
132M<br />
140M<br />
STRATEGIC PLAN & BUDGET REPORT<br />
13
Tuition<br />
Significant demand inconsistencies related to<br />
the pandemic created substantial uncertainty<br />
for long-range estimates of tuition revenue.<br />
Considering this environment, TSTC budgeted<br />
tuition at a conservative amount for fiscal year<br />
2022. Fiscal year 2021 actual tuition revenues<br />
are forecasted to finish at approximately $43<br />
million, and the fiscal year 2022 budget only<br />
slightly increases that amount to $44 million.<br />
Very early enrollment projections for the Fall<br />
2021 semester appear promising, but unusually<br />
high levels of uncertainty still dominate all<br />
aspects of society and business as the pandemic<br />
lingers into its second year. Accordingly, the<br />
tuition revenue budget for fiscal year 2022 is<br />
being held close to prior year (pandemic era)<br />
levels until more certainty comes into focus.<br />
08<br />
Tuition Trends<br />
2018 2019 2020 2021 - Forecast 2022 - <strong>Budget</strong><br />
44.96M<br />
45.43M<br />
47.28M<br />
44.19M<br />
43.97M<br />
42.43M 43.66M 43.83M 43.10M 43.97M<br />
* Bar Chart Figures represent the <strong>Budget</strong>ed Tuition Revenue for the specific Fiscal Year.<br />
* The line chart figures represent the Actual & Forecasted Tuition revenue for the specific Fiscal Year.<br />
<strong>Budget</strong>ed Tuition Revenue<br />
Actuals & Forecasted Tuition Revenue<br />
14<br />
STRATEGIC PLAN & BUDGET REPORT
APPROVED BY BOARD OF REGENTS 8/19/2021<br />
Other Revenues<br />
In addition to the primary revenue sources of<br />
state appropriations and tuition, TSTC generates<br />
other revenues from a variety of services,<br />
initiatives and contracts. Many of these services<br />
are referred to as Auxiliary Enterprises, which<br />
provide needed services for students, faculty,<br />
and staff and charge a fee related to that<br />
service. In fiscal year 2022, similar to tuition<br />
revenue, an extremely high level of uncertainty<br />
exists around future demand and the ability to<br />
accurately predict these revenue sources.<br />
TSTC has seen material declines in these<br />
supplemental revenue producing activities with<br />
the onset and continuation of the pandemic,<br />
much like many other institutions of higher<br />
education across the nation. Although TSTC<br />
is not nearly as reliant on these activities to<br />
produce significant revenue compared to<br />
traditional four-year universities, the decline<br />
still has an impact on TSTC’s overall budget.<br />
Retail Operations were affected the most due<br />
to the transition to online learning, which has<br />
greatly reduced foot traffic on campus. Training<br />
programs like Industry Relations and Flight<br />
Training also experienced material declines.<br />
Employers engaged in less on-site workforce<br />
training, and continuing education saw a drop<br />
in demand as well. Additionally, a phase-out<br />
of TSTC’s helicopter pilot training program was<br />
initiated in fiscal year 2020, which added to the<br />
overall revenue decline compared to prior years.<br />
As a result of the revenue declines, managers of<br />
these business units reduced expense budgets<br />
in fiscal year 2022 to minimize overall losses<br />
where possible.<br />
The potential for the volume of these services<br />
to ever return to pre-pandemic levels is still very<br />
uncertain, and a “new normal” will likely affect<br />
these functions for years to come.<br />
09<br />
FY 2020 FY 2021<br />
FY 2022<br />
Actual <strong>Budget</strong> Forecast <strong>Budget</strong><br />
Other Revenues<br />
Retail Operations 4,166,506 5,386,500 3,965,000 4,570,000<br />
Housing 4,219,032 3,420,000 2,904,000 3,321,284<br />
Industry Relations 1,520,662 3,314,000 1,550,000 2,575,400<br />
Flight Training 1,497,859 2,050,000 1,643,000 1,600,000<br />
SkillsEngine 890,509 1,280,000 949,000 950,000<br />
Airport 1,991,535 1,112,000 1,291,000 1,112,000<br />
Total Other Revenues 14,286,103 16,562,500 12,302,000 14,128,684<br />
STRATEGIC PLAN & BUDGET REPORT<br />
15
OPERATING EXPENSES<br />
10<br />
FY 2020 FY 2021 FY 2022<br />
<strong>Budget</strong> <strong>Budget</strong> <strong>Budget</strong><br />
Operating Expenditures<br />
Operating Costs 111,709,898 104,031,984 109,389,827<br />
Statewide Benefits 29,742,672 31,201,472 30,937,761<br />
Personnel Costs 93,567,521 100,737,651 92,163,349<br />
<strong>Strategic</strong> Pool 5,000,000 - 8,000,000<br />
Total Operating Expenditures 240,020,091 235,971,107 240,490,937<br />
Total operating expenditures budgeted for<br />
fiscal year 2022 are $240 million, compared<br />
to $236 million budgeted for fiscal year 2021.<br />
Of note, however, is that budgeted CARES grant<br />
expenditures are included in the fiscal year<br />
2022 total. Excluding CARES expenses, the<br />
total operating expense budget has decreased<br />
by approximately $4 million from fiscal year<br />
2021. The decrease in budgeted expenditures<br />
is the result of a conservative, “base budget”<br />
approach by management for fiscal year 2022,<br />
with material room for contingencies. TSTC is<br />
utilizing a <strong>Strategic</strong> Pool in the upcoming year<br />
as a mechanism to allow management to nimbly<br />
react and allocate resources as needed to<br />
quickly changing demands and circumstances.<br />
In addition to utilizing a <strong>Strategic</strong> Pool for<br />
managing contingencies, the fiscal year 2022<br />
budget has been prepared by removing all<br />
vacant positions that were previously budgeted<br />
but unfilled. As a result, the personnel budget<br />
appears significantly decreased, when in<br />
actuality it has simply been reduced to real-time<br />
staffing levels. The <strong>Strategic</strong> Pool will serve as a<br />
way for the College to more proactively manage<br />
hiring growth in this uncertain time, while still<br />
allowing for quickly accelerated growth if and<br />
when necessary.<br />
One other noteworthy item in the fiscal year<br />
2022 budget is an increase in debt service<br />
expenditures of approximately $3 million. This<br />
increase reflects the new debt service payments<br />
due on $30 million of Revenue Financing<br />
System bonds issued in August 2020. These<br />
bonds are payable over a ten year period, and<br />
the proceeds have been allocated to fund<br />
expansion projects in Instruction and Student<br />
Recruiting.<br />
In summary, uncertainty once again dominates<br />
the budgeting and planning approach at TSTC<br />
for a second consecutive year. A myriad of<br />
external factors such as unpredictable revenues,<br />
supply chain delays, rising construction costs,<br />
inflation, near zero interest rates and a very tight<br />
job market all play a role in defining the fiscal<br />
year 2022 budget. TSTC was fortunate to dodge<br />
many of the hurdles that have set back other<br />
colleges. Strong pandemic protocols along<br />
with tremendous resilience exhibited by TSTC<br />
faculty, staff and students placed the College<br />
in a sound, flexible financial position despite<br />
of all the unusual challenges the pandemic has<br />
presented.<br />
16<br />
STRATEGIC PLAN & BUDGET REPORT
APPROVED BY BOARD OF REGENTS 8/19/2021<br />
COVID-19 RELIEF<br />
Coronavirus Aid, Relief and Economic<br />
Security Act<br />
In response to the economic disruption caused<br />
by COVID-19, the federal government passed<br />
the CARES Act in March 2020 to provide<br />
funding for students and institutions of higher<br />
education. Multiple awards have been made<br />
from the Department of Education in the sixteen<br />
months since the original Act was authorized. In<br />
total, TSTC was awarded just over $40 million<br />
for institutional purposes, and approximately<br />
$28 million for direct aid to students. These<br />
funds carry time and purpose restrictions, and<br />
TSTC is currently deploying a Capital Allocation<br />
<strong>Plan</strong> to successfully and strategically invest<br />
these funds to their highest and best use.<br />
In TSTC’s annual operating budget, CARES funds<br />
are accounted for in the “Grants” line item, in<br />
both revenue and expense. TSTC expects to<br />
expend much of the remaining student portion<br />
in fiscal year 2021, as relief funds have been<br />
disbursed quickly to students. A large portion<br />
of the institutional funds are budgeted in fiscal<br />
year 2022, with more to be added to the budget<br />
in the very near future as plans are finalized and<br />
executed.<br />
Restrictions regarding the purpose and timing of<br />
these funds increase the complexity for efficient<br />
deployment of these funds. TSTC leadership<br />
is closely monitoring execution velocity of the<br />
related projects and will redeploy the related<br />
capital as necessary. The College will report<br />
to the Board of Regents on the deployment of<br />
these funds throughout the life of the COVID-19<br />
relief grants.<br />
BUDGET<br />
PLAN<br />
11<br />
MEASURE<br />
COVID-19 Relief<br />
EXECUTE<br />
CARES Grant (March 2020) Institutional Student<br />
Higher Education Emergency Relief Funds (HEERF) 4,982,000 4,982,000<br />
HEERF - Minority Serving Institution Funds 1,139,000<br />
CARES Grant - Amendment / Addition (December 2020)<br />
Higher Education Emergency Relief Funds (HEERF) 16,309,000 4,982,000<br />
HEERF - Minority Serving Institution Funds 627,000<br />
American Rescue <strong>Plan</strong> (April 2021) 18,500,000 18,500,000<br />
TOTAL Federal Pandemic Relief Funding 41,557,000 28,464,000<br />
STRATEGIC PLAN & BUDGET REPORT<br />
17
CAPITAL BUDGET<br />
TSTC’s capital budget consists of inflows and<br />
outflows of funds specifically identified for the<br />
acquisition, construction, and renovation of<br />
facilities and other long-term improvements.<br />
The most common source of funding for capital<br />
projects is debt and TSTC issued $30 million of<br />
new debt (Series 2020 RFS bonds) in August<br />
2020 to fund much needed expansion and<br />
renovation projects. The expenditure of the<br />
proceeds of this bond spans multiple fiscal<br />
years and $15.9 million is planned to be spent<br />
in fiscal year 2022 on the projects outlined in<br />
the table below.<br />
Similar to the operating budget of the College,<br />
the capital budget has changed significantly in<br />
the last year as the pandemic upended almost<br />
every aspect of how TSTC functions. Initial, prepandemic<br />
capital plans included a $15 million<br />
renovation of the Industrial Technology Center<br />
in Waco for administrative offices to be utilized<br />
by those departments that were displaced by<br />
the abatement and demolition project. But, as all<br />
TSTC employees transitioned to remote work in<br />
March 2020, this project was put on hold and is<br />
postponed indefinitely as remote work at TSTC<br />
has proven to be efficient and effective. In place<br />
of the administrative office project are new<br />
projects that more directly impact Instruction,<br />
External Relations, and Student Life.<br />
In 2019, TSTC received a one-time,<br />
supplemental appropriation of $29.6 million<br />
from the Texas Legislature to fund a large-scale<br />
abatement and demolition project at the Waco<br />
campus. Although many individual projects<br />
related to this appropriation are still ongoing or<br />
have yet to begin, all funds were obligated in<br />
fiscal year 2021, and as a result, the expenditure<br />
of the supplemental appropriation is complete,<br />
and does not appear in the fiscal year 2022<br />
capital budget.<br />
12<br />
Capital Project Uses<br />
Capital<br />
Reserves<br />
EDA Grant<br />
Capital Funding Sources<br />
2020 RFS<br />
Bond<br />
Operating<br />
Transfers In<br />
Deferred Maintenance - - - 1,114,958 1,114,958<br />
Harlingen Multi-Function Center - - 2,100,000 - 2,100,000<br />
Waco EEC/TSC Renovation 2,583,594 3,400,000 - - 5,983,594<br />
Waco JBC 1st and 2nd Floor Renovation - - 5,200,000 - 5,200,000<br />
Waco Kultgen Automotive Renovation - - 1,900,000 - 1,900,000<br />
Plumbing Licensure Testing Sites - - 2,400,000 - 2,400,000<br />
Waco North Interceptor (Sewer) - - 1,500,000 - 1,500,000<br />
Other Projects - - 1,399,512 - 1,399,512<br />
Reserves for Future Use 2,416,406 - 1,378,780 - 3,795,186<br />
Total <strong>FY22</strong> Expenses 5,000,000 3,400,000 15,878,292 1,114,958 25,393,250<br />
Total<br />
18<br />
STRATEGIC PLAN & BUDGET REPORT
APPROVED BY BOARD OF REGENTS 8/19/2021<br />
EXHIBITS<br />
STRATEGIC PLAN & BUDGET REPORT<br />
19
EXHIBIT I: Detailed Operating Expense <strong>Budget</strong><br />
2020 2021 2022<br />
Expense Type Original <strong>Budget</strong> Original <strong>Budget</strong> Original <strong>Budget</strong><br />
Instruction<br />
Academics Personnel Costs 9,991,875 9,149,308 7,873,583<br />
Operating Costs 926,177 755,084 685,718<br />
Total Academics 10,918,052 9,904,392 8,559,301<br />
Aerospace Personnel Costs 3,360,963 3,746,679 2,739,787<br />
Operating Costs 2,213,547 1,479,990 1,242,707<br />
Total Aerospace 5,574,510 5,226,669 3,982,494<br />
Allied Health Personnel Costs 4,275,915 4,129,305 3,886,986<br />
Operating Costs 522,993 617,534 539,930<br />
Total Allied Health 4,798,908 4,746,839 4,426,916<br />
C4EO Personnel Costs 1,396,641 1,530,140 1,667,388<br />
Operating Costs 418,464 343,774 343,774<br />
Total C4EO 1,815,105 1,873,914 2,011,162<br />
Construction & Safety Personnel Costs 1,394,117 1,433,741 1,455,865<br />
Operating Costs 215,149 212,166 212,166<br />
Total Construction & Safety 1,609,266 1,645,907 1,668,031<br />
Digital Transformation Personnel Costs 5,539,987 5,213,300 4,686,006<br />
Operating Costs 408,255 316,351 316,351<br />
Total Digital Transformation 5,948,242 5,529,651 5,002,357<br />
Electrical Instrumentation Personnel Costs 5,278,988 6,062,626 5,984,687<br />
Operating Costs 551,508 492,738 552,832<br />
Total Electrical Instrumentation 5,830,496 6,555,364 6,537,519<br />
Industrial Manufacturing Personnel Costs 5,684,414 7,334,024 6,587,549<br />
Operating Costs 1,744,896 1,267,210 1,297,210<br />
Total Industrial Manufacturing 7,429,310 8,601,234 7,884,759<br />
Instructional Pool Personnel Costs 2,623,000 3,307,044 3,554,000<br />
Operating Costs 6,663,897 6,519,830 4,257,298<br />
Total Instructional Pool 9,286,897 9,826,874 7,811,298<br />
Instructional Sales Personnel Costs 730,373 701,812 476,328<br />
Operating Costs 75,713 60,762 60,762<br />
Total Instructional Sales 806,086 762,574 537,090<br />
Provosts & Admin Personnel Costs 4,005,080 5,216,464 6,097,403<br />
Operating Costs 1,161,613 702,076 871,086<br />
Total Provosts & Admin 5,166,693 5,918,540 6,968,489<br />
<strong>Strategic</strong> Partnerships Personnel Costs 459,232 125,744 84,324<br />
Operating Costs 1,686,846 56,200 56,200<br />
Total <strong>Strategic</strong> Partnerships 2,146,078 181,944 140,524<br />
Transportation Personnel Costs 3,516,725 3,772,873 3,665,374<br />
Operating Costs 491,858 414,933 414,933<br />
Total Transportation 4,008,583 4,187,806 4,080,307<br />
Vision & Alignment Personnel Costs 1,268,675 1,398,534 1,164,293<br />
Operating Costs 475,839 448,959 448,959<br />
Total Vision & Alignment 1,744,514 1,847,493 1,613,252<br />
Total Instruction 67,082,740 66,809,201 61,223,499<br />
Financial Aid<br />
College Work Study Personnel Costs 0 637,308 441,468<br />
Operating Costs 500,000 682,403 480,000<br />
Total College Work Study 500,000 1,319,711 921,468<br />
Equal Opportunity Grants Operating Costs 3,295,256 2,800,000 2,520,000<br />
Total Equal Opportunity Grants 3,295,256 2,800,000 2,520,000<br />
Institutional Scholarship Operating Costs 500,000 1,092,000 1,102,500<br />
Total Institutional Scholarship 500,000 1,092,000 1,102,500<br />
Loans Operating Costs 650,000 650,000 650,000<br />
Total Loans 650,000 650,000 650,000<br />
Pell Grants Operating Costs 28,650,000 28,000,000 27,000,000<br />
Total Pell Grants 28,650,000 28,000,000 27,000,000<br />
Tuition Set Asides Operating Costs 6,092,234 4,668,000 4,667,000<br />
Total Tuition Set Asides 6,092,234 4,668,000 4,667,000<br />
Total Financial Aid 39,687,490 38,529,711 36,860,968<br />
Statewide Benefits 29,742,672 31,492,672 30,937,761<br />
20<br />
Finance<br />
STRATEGIC PLAN & BUDGET REPORT<br />
<strong>Budget</strong>, Accounting & <strong>Report</strong>ing Personnel Costs 2,311,793 2,289,092 2,016,340<br />
Operating Costs 232,414 245,356 184,756
College Work Study Personnel Costs 0 637,308 441,468<br />
Operating Costs 500,000 682,403 480,000<br />
Total College Work Study 500,000 1,319,711 921,468<br />
Equal Opportunity Grants Operating Costs 3,295,256 2,800,000 2,520,000<br />
Total Equal Opportunity Grants 3,295,256 2,800,000 2,520,000<br />
Institutional Scholarship Operating Costs 500,000 1,092,000 1,102,500<br />
Total Institutional Scholarship 500,000 1,092,000 1,102,500<br />
Loans Operating Costs 650,000 650,000 650,000<br />
Total Loans 650,000 650,000 650,000<br />
Pell Grants Operating Costs 28,650,000 28,000,000 27,000,000<br />
Total Pell Grants 28,650,000 28,000,000 27,000,000<br />
Tuition Set Asides Operating Costs 6,092,234 4,668,000 4,667,000<br />
Total Tuition Set Asides 6,092,234 4,668,000 4,667,000<br />
Total Financial Aid 2020 39,687,490 2021 38,529,711 2022 36,860,968<br />
EXHIBIT I: Detailed Operating Expense <strong>Budget</strong><br />
APPROVED BY BOARD OF REGENTS 8/19/2021<br />
Expense Type Original <strong>Budget</strong> Original <strong>Budget</strong> Original <strong>Budget</strong><br />
Instruction<br />
Statewide Benefits<br />
Academics Personnel Costs<br />
29,742,672<br />
9,991,875<br />
31,492,672<br />
9,149,308<br />
30,937,761<br />
7,873,583<br />
Operating Costs 926,177 755,084 685,718<br />
Total Academics 10,918,052 9,904,392 8,559,301<br />
Finance Aerospace Personnel Costs 3,360,963 3,746,679 2,739,787<br />
<strong>Budget</strong>, Accounting & <strong>Report</strong>ing Operating Personnel Costs 2,213,547 2,311,793 1,479,990 2,289,092 1,242,707 2,016,340<br />
Total Operating Aerospace Costs 5,574,510 232,414 5,226,669 245,356 3,982,494 184,756<br />
Allied Health Personnel Total <strong>Budget</strong>, Costs Accounting & <strong>Report</strong>ing 2,544,207 4,275,915 2,534,448 4,129,305 2,201,096 3,886,986<br />
Business Intelligence Operating Personnel Costs 1,075,772 522,993 1,091,732 617,534 1,336,772 539,930<br />
Total Operating Allied Costs Health 4,798,908 245,347 4,746,839 175,812 4,426,916 175,812<br />
C4EO Personnel Total Business CostsIntelligence 1,321,119 1,396,641 1,267,544 1,530,140 1,512,584 1,667,388<br />
Finance - Admin Operating Personnel Costs 418,464 425,820 343,774 468,044 343,774 402,540<br />
Total Operating C4EOCosts 1,815,105 210,770 1,873,914 189,693 2,011,162 264,693<br />
Construction & Safety Personnel Total Finance Costs- Admin 1,394,117 636,590 1,433,741 657,737 1,455,865 667,233<br />
Human Resources Operating Personnel Costs 2,281,755 215,149 2,535,800 212,166 2,306,703 212,166<br />
Total Operating Construction Human Costs Resources & Safety 1,609,266 2,956,415 674,660 1,645,907 3,097,500 561,700 1,668,031<br />
2,890,187 583,484<br />
Digital Institutional Transformation Effectiveness Personnel Costs 5,539,987 628,719 5,213,300 743,795 4,686,006 619,767<br />
Operating Costs 408,255 187,866 316,351 180,805 316,351 119,305<br />
Total Digital Institutional Transformation Effectiveness 5,948,242 816,585 5,529,651 924,600 5,002,357 739,072<br />
Electrical Procurement Instrumentation Personnel Costs 5,278,988 1,951,744 6,062,626 2,035,920 5,984,687 1,770,272<br />
Operating Costs 551,508 312,209 492,738 239,138 552,832 247,394<br />
Total Procurement Electrical Instrumentation 5,830,496 2,263,953 6,555,364 2,275,058 6,537,519<br />
2,017,666<br />
Total Industrial Finance Manufacturing Personnel Costs 10,538,869 5,684,414 10,756,887 7,334,024 10,027,838 6,587,549<br />
Operating Costs 1,744,896 1,267,210 1,297,210<br />
Total Industrial Manufacturing 7,429,310 8,601,234 7,884,759<br />
External Instructional Relations Pool Personnel Costs 2,623,000 3,307,044 3,554,000<br />
External Relations Admin Operating Personnel Costs 6,663,897 394,588 6,519,830 264,164 4,257,298 344,748<br />
Total Operating Instructional Costs Pool 9,286,897 17,050 9,826,874 14,865 7,811,298 230,000<br />
Instructional Sales Personnel Total External Costs Relations Admin 411,638 730,373 279,029 701,812 574,748 476,328<br />
Advancement & Communications Operating Personnel Costs 3,607,568 75,713 3,923,938 60,762 3,891,026 60,762<br />
Total Operating Instructional Costs Sales 3,478,313 806,086 2,398,155 762,574 2,409,816 537,090<br />
Provosts & Admin Personnel Total Advancement Costs & Communications 7,085,881 4,005,080 6,322,093 5,216,464 6,300,842 6,097,403<br />
College Readiness Operating Personnel Costs 1,161,613 1,069,092 1,129,688 702,076 871,086 595,861<br />
Total Operating Provosts Costs & Admin 5,166,693 456,361 5,918,540 370,137 6,968,489 583,092<br />
<strong>Strategic</strong> Partnerships Personnel Total College Costs Readiness 1,525,453 459,232 1,499,825 125,744 1,178,953 84,324<br />
Government Affairs Operating Personnel Costs 1,686,846 856,781 773,125 56,200 597,856 56,200<br />
Total Operating <strong>Strategic</strong> CostsPartnerships 2,146,078 208,429 181,944 187,586 140,524 187,586<br />
Transportation Personnel Total Government Costs Affairs 1,065,210 3,516,725 3,772,873 960,711 3,665,374 785,442<br />
Industry Relations Personnel Costs 2,291,138 2,791,346 1,690,773<br />
Operating Costs 1,508,932 1,336,527 852,437<br />
Total Industry Relations 3,800,070 4,127,873 2,543,210<br />
Recruitment Personnel Costs 1,709,692 1,935,776 1,454,972<br />
Operating Costs 382,500 285,127 289,127<br />
Total Recruitment 2,092,192 2,220,903 1,744,099<br />
Talent Management Personnel Costs 747,056 824,442 716,689<br />
Operating Costs 226,446 194,403 194,403<br />
Total Talent Management 973,502 1,018,845 911,092<br />
Total External Relations 16,953,946 16,429,279 14,038,386<br />
Auxiliary Services<br />
Airport & Farm Personnel Costs 337,559 322,411 148,728<br />
Operating Costs 428,342 428,342 429,842<br />
Total Airport & Farm 765,901 750,753 578,570<br />
Bookstore Personnel Costs 836,238 832,587 587,228<br />
STRATEGIC PLAN & BUDGET REPORT<br />
21
Government Affairs Personnel Costs 856,781 773,125 597,856<br />
Operating Costs 208,429 187,586 187,586<br />
Total Government Affairs 1,065,210 960,711 785,442<br />
Industry Relations Personnel Costs 2,291,138 2,791,346 1,690,773<br />
Operating Costs 1,508,932 1,336,527 852,437<br />
Total Industry Relations 3,800,070 4,127,873 2,543,210<br />
Recruitment Personnel Costs 1,709,692 1,935,776 1,454,972<br />
Operating Costs 382,500 285,127 289,127<br />
Total Recruitment 2,092,192 2,220,903 1,744,099<br />
EXHIBIT I: Detailed Operating Expense <strong>Budget</strong><br />
Talent Management Personnel Costs 747,056 824,442 716,689<br />
Operating Costs 226,446 194,403 194,403<br />
Total Talent Management 973,502 1,018,845 911,092<br />
Total External Relations 16,953,946 16,429,279 14,038,386<br />
2020 2021 2022<br />
Expense Type Original <strong>Budget</strong> Original <strong>Budget</strong> Original <strong>Budget</strong><br />
Auxiliary Services<br />
Instruction<br />
Operating Costs 428,342 428,342 429,842<br />
Operating Costs 926,177 755,084 685,718<br />
Total Airport & Farm 765,901 750,753 578,570<br />
Total Academics 10,918,052 9,904,392 8,559,301<br />
Bookstore Personnel Costs 836,238 832,587 587,228<br />
Aerospace Personnel Costs 3,360,963 3,746,679 2,739,787<br />
Airport & Farm<br />
Academics<br />
Personnel Costs<br />
Personnel Costs<br />
337,559<br />
9,991,875<br />
322,411<br />
9,149,308<br />
148,728<br />
7,873,583<br />
Operating<br />
Operating<br />
Costs<br />
Costs<br />
2,649,895<br />
2,213,547<br />
2,495,456<br />
1,479,990<br />
1,608,850<br />
1,242,707<br />
Total<br />
Total Aerospace<br />
Bookstore 3,486,133<br />
5,574,510<br />
3,328,043<br />
5,226,669<br />
2,196,078<br />
3,982,494<br />
Food<br />
Allied<br />
Service<br />
Health<br />
Personnel<br />
Personnel<br />
Costs<br />
Costs 4,275,915<br />
932,812<br />
4,129,305<br />
968,100<br />
3,886,986<br />
718,092<br />
Operating<br />
Operating<br />
Costs<br />
Costs<br />
1,041,880<br />
522,993<br />
837,300<br />
617,534<br />
801,400<br />
539,930<br />
Total<br />
Total Allied<br />
Food Service<br />
Health<br />
1,974,692<br />
4,798,908<br />
1,805,400<br />
4,746,839<br />
1,519,492<br />
4,426,916<br />
Housing<br />
C4EO<br />
Personnel<br />
Personnel<br />
Costs<br />
Costs<br />
1,712,793<br />
1,396,641<br />
1,531,226<br />
1,530,140<br />
1,416,007<br />
1,667,388<br />
Operating<br />
Operating<br />
Costs<br />
Costs<br />
2,500,377<br />
418,464<br />
3,033,975<br />
343,774<br />
3,261,866<br />
343,774<br />
Total<br />
Total C4EO<br />
Housing 4,213,170<br />
1,815,105<br />
4,565,201<br />
1,873,914<br />
4,677,873<br />
2,011,162<br />
Printing<br />
Construction<br />
Production<br />
& Safety<br />
Div Personnel<br />
Personnel<br />
Costs<br />
Costs 1,394,117<br />
281,928<br />
1,433,741<br />
302,424<br />
1,455,865<br />
150,552<br />
Operating<br />
Operating<br />
Costs<br />
Costs<br />
232,695<br />
215,149<br />
214,791<br />
212,166<br />
211,191<br />
212,166<br />
Total<br />
Total Construction<br />
Printing Production<br />
& Safety 1,609,266<br />
514,623<br />
1,645,907<br />
517,215<br />
1,668,031<br />
361,743<br />
Total<br />
Digital<br />
Auxiliary<br />
Transformation<br />
Services<br />
Personnel Costs<br />
10,954,519<br />
5,539,987<br />
10,966,612<br />
5,213,300<br />
9,333,756<br />
4,686,006<br />
Operating Costs 408,255 316,351 316,351<br />
Total Digital Transformation 5,948,242 5,529,651 5,002,357<br />
Enrollment Electrical Instrumentation Management<br />
Personnel Costs 5,278,988 6,062,626 5,984,687<br />
Operating Costs 551,508 492,738 552,832<br />
Enrollment Management Personnel Costs 7,771,645 8,328,465 7,459,614<br />
Total Electrical Instrumentation 5,830,496 6,555,364 6,537,519<br />
Operating Costs 2,775,930 2,248,176 2,280,377<br />
Industrial Manufacturing Personnel Costs 5,684,414 7,334,024 6,587,549<br />
Total Enrollment Management 10,547,575 10,576,641 9,739,991<br />
Operating Costs 1,744,896 1,267,210 1,297,210<br />
Student Services - Admin Personnel Costs 416,274 308,840 334,208<br />
Total Industrial Manufacturing 7,429,310 8,601,234 7,884,759<br />
Operating Costs 184,099 179,090 245,090<br />
Instructional Pool Personnel Costs 2,623,000 3,307,044 3,554,000<br />
Total Student Services Admin 600,373 487,930 579,298<br />
Operating Costs 6,663,897 6,519,830 4,257,298<br />
Total Enrollment Management 11,147,948 11,064,571 10,319,289<br />
Total Instructional Pool 9,286,897 9,826,874 7,811,298<br />
Instructional Sales Personnel Costs 730,373 701,812 476,328<br />
Facilities<br />
Operating Costs 75,713 60,762 60,762<br />
Total Instructional Sales 806,086 762,574 537,090<br />
Fleet Provosts & Admin Personnel Costs 4,005,080 73,276 5,216,464 135,456 6,097,403 138,820<br />
Operating Costs 1,304,314 1,161,613 1,171,445 702,076 1,171,645 871,086<br />
Total Fleet Provosts & Admin 1,377,590 5,166,693 1,306,901 5,918,540 1,310,465<br />
6,968,489<br />
Maintenance <strong>Strategic</strong> Partnerships & Physical <strong>Plan</strong>t Personnel Costs 4,072,910 459,232 4,669,718 125,744 3,935,291 84,324<br />
Operating Costs 3,174,837 1,686,846 2,666,884 56,200 2,754,826 56,200<br />
Total Maintenance <strong>Strategic</strong> Partnerships & Physical <strong>Plan</strong>t 7,247,747 2,146,078 7,336,602 181,944 6,690,117 140,524<br />
<strong>Plan</strong>ning, Transportation Construction & Admin Personnel Costs 3,516,725 831,724 1,182,247 3,772,873 3,665,374 924,988<br />
Operating Costs 1,122,676 135,564 253,530<br />
Total <strong>Plan</strong>ning, Construction & Admin 1,954,400 1,317,811 1,178,518<br />
Total Facilities 10,579,737 9,961,314 9,179,100<br />
Facilities - Transfer to Capital <strong>Budget</strong> 3,690,836 1,808,924 1,114,958<br />
Information Technology<br />
Infrastructure & Equipment Personnel Costs 511,276 529,440 266,844<br />
Operating Costs 893,561 246,721 193,920<br />
Total Infrastructure & Equipment 1,404,837 776,161 460,764<br />
Management Support & Operations Personnel Costs 3,178,390 3,263,702 2,784,697<br />
Operating Costs 493,860 449,076 554,076<br />
Total Management Support & Operations 3,672,250 3,712,778 3,338,773<br />
Shared Expenses Operating Costs 5,063,078 5,160,851 5,270,951<br />
Total Shared Expenses 5,063,078 5,160,851 5,270,951<br />
Total Information Technology 10,140,165 9,649,790 9,070,488<br />
Statewide Administration<br />
General Counsel Personnel Costs 2,391,586 2,412,404 2,194,866<br />
Operating Costs 703,854 622,417 713,964<br />
Total General Counsel 3,095,440 3,034,821 2,908,830<br />
Internal Audit Personnel Costs 362,592 382,772 406,236<br />
Operating Costs 19,529 20,300 19,800<br />
STRATEGIC PLAN & BUDGET REPORT<br />
Total Internal Audit 382,121 403,072 426,036<br />
Office of the CEO Personnel Costs 662,194 844,470 874,336<br />
Operating Costs 365,795 325,700 325,700<br />
Total Office of the CEO 1,027,989 1,170,170 1,200,036<br />
22
Information Technology<br />
Infrastructure & Equipment Personnel Costs 511,276 529,440 266,844<br />
Operating Costs 893,561 246,721 193,920<br />
Total Infrastructure & Equipment 1,404,837 776,161 460,764<br />
Management Support & Operations Personnel Costs 3,178,390 3,263,702 2,784,697<br />
Operating Costs 493,860 449,076 554,076<br />
Total Management Support & Operations 3,672,250 3,712,778 3,338,773<br />
Shared Expenses Operating Costs 5,063,078 5,160,851 5,270,951<br />
Total Shared Expenses 5,063,078 5,160,851 5,270,951<br />
Total Information Technology<br />
2020<br />
10,140,165<br />
2021<br />
9,649,790<br />
2022<br />
9,070,488<br />
EXHIBIT I: Detailed Operating Expense <strong>Budget</strong><br />
APPROVED BY BOARD OF REGENTS 8/19/2021<br />
Expense Type Original <strong>Budget</strong> Original <strong>Budget</strong> Original <strong>Budget</strong><br />
Instruction<br />
Statewide Administration<br />
Academics Personnel Costs 9,991,875 9,149,308 7,873,583<br />
General Counsel Personnel Costs 2,391,586 2,412,404 2,194,866<br />
Operating Costs 926,177 755,084 685,718<br />
Operating Costs 703,854 622,417 713,964<br />
Total Academics 10,918,052 9,904,392 8,559,301<br />
Total General Counsel 3,095,440 3,034,821 2,908,830<br />
Aerospace Personnel Costs 3,360,963 3,746,679 2,739,787<br />
Internal Audit Personnel Costs 362,592 382,772 406,236<br />
Operating Costs 2,213,547 1,479,990 1,242,707<br />
Operating Costs 19,529 20,300 19,800<br />
Total Aerospace 5,574,510 5,226,669 3,982,494<br />
Total Internal Audit 382,121 403,072 426,036<br />
Allied Health Personnel Costs 4,275,915 4,129,305 3,886,986<br />
Office of the CEO Personnel Costs 662,194 844,470 874,336<br />
Operating Costs 522,993 617,534 539,930<br />
Operating Costs 365,795 325,700 325,700<br />
Total Allied Health 4,798,908 4,746,839 4,426,916<br />
Total Office of the CEO 1,027,989 1,170,170 1,200,036<br />
C4EO Personnel Costs 1,396,641 1,530,140 1,667,388<br />
Total Statewide Administration 4,505,550 4,608,063 4,534,902<br />
Operating Costs 418,464 343,774 343,774<br />
Total C4EO 1,815,105 1,873,914 2,011,162<br />
Construction & Safety Personnel Costs 1,394,117 1,433,741 1,455,865<br />
Shared Resources<br />
Operating Costs 215,149 212,166 212,166<br />
Grants Total Personnel Construction Costs & Safety 1,609,266 200,721 1,645,907 38,633 1,668,031 1,968,562<br />
Digital Transformation Personnel Operating Costs 5,539,987 327,802 5,213,300 4,082,533 10,960,000<br />
4,686,006<br />
Operating Total Grants Costs 408,255 528,523 4,121,166 316,351 12,928,562 316,351<br />
<strong>Strategic</strong> Pool Total Personnel Digital Costs Transformation 5,948,242 5,000,000 5,529,6510 5,002,357 4,584,280<br />
Electrical Instrumentation Personnel Operating Costs 5,278,9880 6,062,6260 5,984,687 3,415,720<br />
Operating Total <strong>Strategic</strong> Costs Pool 5,000,000 551,508 492,7380 8,000,000 552,832<br />
Utilities & Other Total Personnel Electrical CostsInstrumentation 5,830,496 102,624 6,555,364 118,992 6,537,519 36,120<br />
Industrial Manufacturing Personnel Operating Costs 5,684,414 7,794,425 7,334,024 7,689,285 6,587,549 6,806,665<br />
Operating Total Utilities Costs & Other 1,744,896 7,897,049 1,267,210 7,808,277 1,297,210<br />
6,842,785<br />
Debt Services & Leases Total Personnel Industrial CostsManufacturing 7,429,310 13,476 8,601,2340 7,884,7590<br />
Instructional Pool Personnel Operating Costs 11,556,571 2,623,000 11,940,640 3,307,044 16,078,645<br />
3,554,000<br />
Operating Total Debt Costs Service & Leases 11,570,047 6,663,897 11,940,640 6,519,830 16,078,645<br />
4,257,298<br />
Total Shared Resources Total Instructional Pool 24,995,619 9,286,897 23,870,083 9,826,874 43,849,992<br />
7,811,298<br />
Instructional Sales Personnel Costs 730,373 701,812 476,328<br />
Total Operating Expenses Operating Costs 240,020,091 75,713 235,947,107 60,762 240,490,937 60,762<br />
Total Instructional Sales 806,086 762,574 537,090<br />
Provosts & Admin Personnel Costs 4,005,080 5,216,464 6,097,403<br />
Operating Costs 1,161,613 702,076 871,086<br />
Total Provosts & Admin 5,166,693 5,918,540 6,968,489<br />
<strong>Strategic</strong> Partnerships Personnel Costs 459,232 125,744 84,324<br />
Operating Costs 1,686,846 56,200 56,200<br />
Total <strong>Strategic</strong> Partnerships 2,146,078 181,944 140,524<br />
Transportation Personnel Costs 3,516,725 3,772,873 3,665,374<br />
STRATEGIC PLAN & BUDGET REPORT<br />
23
EXHIBIT II: TSTC Definitions<br />
EXHIBIT III: TSTC Fund Accounting<br />
CARES - Coronavirus Aid, Relief, and Economic<br />
Summary<br />
Security Act<br />
Core Ops – A group of Vice Chancellors that<br />
have oversight of the College’s core operations:<br />
Student Learning, Student Service, Advancement &<br />
Communications, and Finance.<br />
ERP – Enterprise Resource <strong>Plan</strong>ning software<br />
used to transform business processes, people and<br />
technology.<br />
Pipeline – The progression of a student through<br />
TSTC from time of application to measuring wages<br />
in a placed job in the Texas workforce.<br />
Program Vitality – The analysis of enrollment,<br />
graduation, job placement, persistence, student<br />
wage reports and other metrics to inform program<br />
mix.<br />
Definitions<br />
<strong>Budget</strong> – An expenditure plan.<br />
Scorecard – A periodic report of key student<br />
success and performance indicators and outcomes<br />
designed to support the strategic direction of the<br />
College’s Student Learning division.<br />
SEE – Survey of Employee Engagement, an annual<br />
survey that TSTC participates in to gather data on<br />
the teammates perception of the College.<br />
WIG – Wildly Important Goal, a Franklin Covey<br />
term from the book 4 Disciplines of Execution.<br />
24 STRATEGIC PLAN & BUDGET REPORT<br />
TSTC budgets are essentially expenditure plans.<br />
TSTC expenditure plans must be balanced against<br />
revenues for each fund, including use of prior<br />
revenues within a fund balance.<br />
TSTC establishes budgets at the unit level. Once<br />
budgets are established, TSTC maintains fiscal<br />
control by monitoring expenditures against the<br />
budget.<br />
The Board adopts an original budget for each fiscal<br />
year. During the year, the budget is adjusted to<br />
account for any necessary changes, including new<br />
gifts, grants and other revenue sources as they<br />
occur. Only budget changes over $500,000 require<br />
Board approval.<br />
Contribution Margin – Revenue minus direct cost.<br />
Describes the unit’s ability to cover variable or<br />
direct costs with revenue.<br />
Fund – A sum of money saved or made available<br />
for a particular purpose.<br />
Fund Accounting – The accounting for funds that<br />
serve different or separate purposes. In effect,<br />
accounting for various funds can be compared to<br />
accounting for different companies or different<br />
divisions of a company. All transactions are<br />
separately accounted for to keep the fund<br />
balances separate even though actual cash from<br />
some of the funds may be co- mingled in local<br />
bank accounts.<br />
Fund Accounting Equation – Beginning Balance +<br />
Revenues – Expenditures = Ending Balance.<br />
Unit – An account code that is associated with a<br />
department or unique purpose. Any number of<br />
units make up a TSTC fund.
APPROVED BY BOARD OF REGENTS 8/19/2021<br />
TSTC Funds<br />
Fund Numbers<br />
1. Education & General (E&G) – Appropriated by<br />
the state of Texas, kept in and expended from<br />
state treasury. Includes state tuition collected<br />
by TSTC (Fund 237) and general revenue of the<br />
state (Fund 001) for the purpose of instruction,<br />
student development, administration, operating<br />
and maintenance of plant, employee benefits<br />
and other authorized uses.<br />
8. <strong>Plan</strong>t Funds – Funds set aside for construction,<br />
renovation, repairs and debt service. <strong>Plan</strong>t funds<br />
are unique in that they generally originate in<br />
the other funds and are then moved into plant<br />
funds through the budgeting process. Includes<br />
both funds held in the state treasury as well as<br />
funds in TSTC local bank accounts.<br />
9. Balance Sheet Accounts – This fund is a<br />
repository for all TSTC balance sheet accounts<br />
including assets, liabilities and net assets.<br />
2. Loan Funds – Gifts and tuition set-asides for<br />
student loans. Not budgeted. These funds are<br />
kept in TSTC local bank accounts.<br />
3. Designated Funds – Funds for instruction,<br />
administration, operating and maintenance of<br />
plant, capital improvements, student services<br />
and other College uses. These funds are kept in<br />
TSTC local bank accounts.<br />
4. Auxiliary Funds – Includes funds related to TSTC<br />
operations that charge for services provided<br />
such as bookstores, food service, housing,<br />
airport and lease of property. These funds are<br />
kept in TSTC local bank accounts.<br />
5. Endowment Funds – Includes gifts or funds<br />
raised for providing long-term revenue<br />
for the College, from which only earnings<br />
are expendable. These funds are generally<br />
transferred to another fund prior to expenditure,<br />
not budgeted in Fund 5. These funds are kept in<br />
TSTC local bank accounts.<br />
6. Restricted Funds – Gifts and grants to be used<br />
for specific purposes defined by the external<br />
originating source: federal, state and local<br />
governments or private sources. These funds<br />
are kept in TSTC local bank accounts, but most<br />
operate on a reimbursement basis.<br />
7. Agency Funds – Funds which are other<br />
peoples’ money; administered by TSTC acting as<br />
custodian, such as for student organizations, The<br />
TSTC Foundation, etc. These funds are kept in<br />
TSTC local bank accounts. <strong>Budget</strong>s are set by the<br />
organization served.<br />
STRATEGIC PLAN & BUDGET REPORT<br />
25
EXHIBIT IV: Acknowledgements<br />
This presentation, accompanied by the video<br />
series, is the collaborative effort of many<br />
teammates across the College. Represented in the<br />
creation of these presentations are TSTC’s values<br />
of Excellence, Accountability, Service, and Integrity.<br />
The following teams and individuals contributed to<br />
this report and/or video representation of the past<br />
and future meaningful work done to Place More<br />
Texans in Great Paying Jobs while also making<br />
TSTC a Great(er) Place to Work.<br />
Thank you to these exceptional teammates:<br />
<strong>Budget</strong>, Accounting and <strong>Report</strong>ing Team<br />
Business Intelligence Team<br />
Communication and Creative Services Team<br />
Finance Administration Team<br />
Institutional Effectiveness Team<br />
Printshop Team<br />
Key Contributors:<br />
Ben Ranzinger, Rabenwolf Entertainment, LLC, Video Production<br />
Caitlin Simmonds, Publication Specialist II, Creative Services<br />
Chad Wooten, Associate Vice Chancellor for Finance<br />
Dawn Parker, Executive Assistant to the Vice Chancellor and Chief Financial Officer<br />
Jonathan Hoekstra, Vice Chancellor and Chief Financial Officer<br />
Jonathan Lasley, Executive Vice President for Business Intelligence<br />
Madelynne Johnston, Finance Chief of Staff<br />
Additional Contributors:<br />
Celina Garza, Vice President for Institutional Effectiveness<br />
Dave Huynh, Data Scientist I<br />
David Kofnovec, Senior Financial Analyst<br />
Fernando Guerrero, Senior Data Analyst<br />
Jay Gerik, Senior Manager, Business Intelligence<br />
Jennifer Verworn, Business Data Analyst III<br />
Jessica Montalvo, Senior Financial Analyst<br />
Melissa Moreno, Staff Assistant<br />
Nathan Ehlert, Senior Executive Director of <strong>Budget</strong><br />
Shannon Wiggins, Senior <strong>Budget</strong> Analyst<br />
Stephanie Vestal, Senior Data Analyst<br />
Tina Skidmore, Senior Executive Director for Business, Analytics, and <strong>Report</strong>ing<br />
26<br />
STRATEGIC PLAN & BUDGET REPORT
APPROVED BY BOARD OF REGENTS 8/19/2021<br />
© Copyright Texas State Technical College, All rights reserved. Published July<br />
2021.<br />
Texas State Technical College (TSTC) is accredited by the Southern Association<br />
of Colleges and Schools Commission on Colleges (SACSCOC) to award Associate<br />
Degrees and Certificates of Completion. Contact the Southern Association of<br />
Colleges and Schools Commission on Colleges at 1866 Southern Lane, Decatur,<br />
Georgia 30033-4097 or call 404-679-4500 for questions about the accreditation<br />
of Texas State Technical College.<br />
Equal opportunity shall be afforded within TSTC to all employees and applicants<br />
for admission or employment regardless of race, color, gender, religion, national<br />
origin, age, genetic information, disability or veteran status. TSTC will make<br />
reasonable accommodations for persons with disabilities. TSTC’s policy is that, in<br />
all aspects of its operations, each person with a disability shall be considered for<br />
admission or access to or treatment or employment in its programs and activities<br />
in accordance with Part 84 of Title 45, the regulation implementing Section 504<br />
of the Rehabilitation Act of 1973.<br />
STRATEGIC PLAN & BUDGET REPORT<br />
27


