Selectivity of Substance Identification by HPLC-DAD in Toxicological ...
Selectivity of Substance Identification by HPLC-DAD in Toxicological ...
Selectivity of Substance Identification by HPLC-DAD in Toxicological ...

Create successful ePaper yourself
Turn your PDF publications into a flip-book with our unique Google optimized e-Paper software.
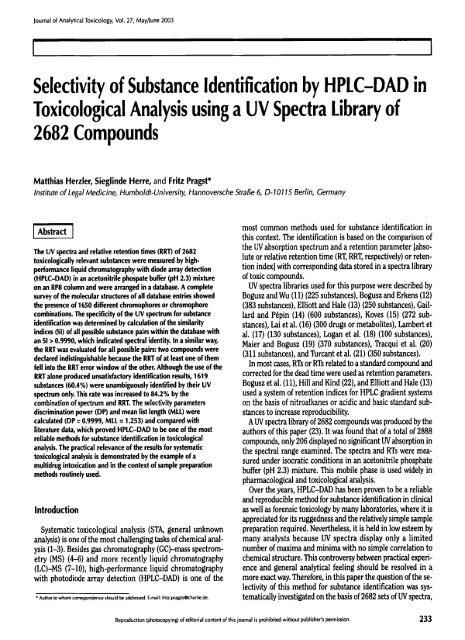
Journal <strong>of</strong> Analytical Toxicology, Vol. 27, May/June 2003<br />
<strong>Selectivity</strong> <strong>of</strong> <strong>Substance</strong> <strong>Identification</strong> <strong>by</strong> <strong>HPLC</strong>-<strong>DAD</strong> <strong>in</strong><br />
<strong>Toxicological</strong> Analysis us<strong>in</strong>g a UV Spectra Library <strong>of</strong><br />
2682 Compounds<br />
Matthias Herzler, Siegl<strong>in</strong>de Herre, and Fritz Pragst*<br />
Institute <strong>of</strong> Lega! Medic<strong>in</strong>e, Humboldt-University, Hannoversche Stral3e 6, D-I0115 Bed<strong>in</strong>, Germany<br />
Abstract [<br />
The UV spectra and relative retention times (RRT) <strong>of</strong> 2682<br />
toxicologically relevant substances were measured <strong>by</strong> high-<br />
performance liquid chromatography with diode array detection<br />
(<strong>HPLC</strong>-<strong>DAD</strong>) <strong>in</strong> an acetonitrile phospate buffer (pH 2.3) mixture<br />
on an RP8 column and were arranged <strong>in</strong> a database. A complete<br />
survey <strong>of</strong> the molecular structures <strong>of</strong> all database entries showed<br />
the presence <strong>of</strong> 1650 different chromophores or chromophore<br />
comb<strong>in</strong>ations. The specificity <strong>of</strong> the UV spectrum for substance<br />
identification was determ<strong>in</strong>ed <strong>by</strong> calculation <strong>of</strong> the similarity<br />
<strong>in</strong>dices (SI) <strong>of</strong> all possible substance pairs with<strong>in</strong> the database with<br />
an SI > 0.9990, which <strong>in</strong>dicated spectral identity. In a similar way,<br />
the RRT was evaluated for all possible pairs: two compounds were<br />
declared <strong>in</strong>dist<strong>in</strong>guishable because the RRT <strong>of</strong> at least one <strong>of</strong> them<br />
fell <strong>in</strong>to the RRT error w<strong>in</strong>dow <strong>of</strong> the other. Although the use <strong>of</strong> the<br />
RRT alone produced unsatisfactory identification results, 1619<br />
substances (60.4%) were unambiguously identified <strong>by</strong> their UV<br />
spectrum only. This rate was <strong>in</strong>creased to 84.2% <strong>by</strong> the<br />
comb<strong>in</strong>ation <strong>of</strong> spectrum and ART. The selectivity parameters<br />
discrim<strong>in</strong>ation power (DP) and mean list length (MLL) were<br />
calculated (DP = 0.9999, MLL = 1.253) and compared with<br />
literature data, which proved <strong>HPLC</strong>-<strong>DAD</strong> to be one <strong>of</strong> the most<br />
reliable methods for substance identification <strong>in</strong> toxicological<br />
analysis. The practical relevance <strong>of</strong> the results for systematic<br />
toxicological analysis is demonstrated <strong>by</strong> the example <strong>of</strong> a<br />
multidrug <strong>in</strong>toxication and <strong>in</strong> the context <strong>of</strong> sample preparation<br />
methods rout<strong>in</strong>ely used.<br />
Introduction<br />
Systematic toxicological analysis (STA, general unknown<br />
analysis) is one <strong>of</strong> the most challeng<strong>in</strong>g tasks <strong>of</strong> chemical anal-<br />
ysis (1-3). Besides gas chromatography (GC)-mass spectrom-<br />
etry (MS) (4-6) and more recently liquid chromatography<br />
(LC)-MS (7-10), high-performance liquid chromatography<br />
with photodiode array detection (<strong>HPLC</strong>--<strong>DAD</strong>) is one <strong>of</strong> the<br />
9 Author to whom correspondence should be addressed. E-mail: fritz.pra~harite.de.<br />
most common methods used for substance identification <strong>in</strong><br />
this context. The identification is based on the comparison <strong>of</strong><br />
the UV absorption spectrum and a retention parameter [abso-<br />
lute or relative retention time (RT, RRT, respectively) or reten-<br />
tion <strong>in</strong>dex] with correspond<strong>in</strong>g data stored <strong>in</strong> a spectra library<br />
<strong>of</strong> toxic compounds.<br />
UV spectra libraries used for this purpose were described <strong>by</strong><br />
Bogusz and Wu (11) (225 substances), Bogusz and Erkens (12)<br />
(383 substances), Elliott and Hale (13) (250 substances), Gail-<br />
lard and P~p<strong>in</strong> (14) (600 substances), Koves (15) (272 sub-<br />
stances), Lai et al. (16) (300 drugs or metabolites), Lambert et<br />
al. (17) (130 substances), Logan et al. (18) (100 substances),<br />
Maier and Bogusz (19) (370 substances), IYacqui et al. (20)<br />
(311 substances), and Turcant et al. (21) (350 substances).<br />
In most cases, RTs or RTs related to a standard compound and<br />
corrected for the dead time were used as retention parameters.<br />
Bogusz et al. (11), Hill and K<strong>in</strong>d (22), and Elliott and Hale (13)<br />
used a system <strong>of</strong> retention <strong>in</strong>dices for <strong>HPLC</strong> gradient systems<br />
on the basis <strong>of</strong> nitroalkanes or acidic and basic standard sub-<br />
stances to <strong>in</strong>crease reproducibility.<br />
A UV spectra library <strong>of</strong> 2682 compounds was produced <strong>by</strong> the<br />
authors <strong>of</strong> this paper (23). It was found that <strong>of</strong> a total <strong>of</strong> 2888<br />
compounds, only 206 displayed no significant UV absorption <strong>in</strong><br />
the spectral range exam<strong>in</strong>ed. The spectra and RTs were mea-<br />
sured under isocratic conditions <strong>in</strong> an acetonitrile phosphate<br />
buffer (pH 2.3) mixture. This mobile phase is used widely <strong>in</strong><br />
pharmacological and toxicological analysis.<br />
Over the years, <strong>HPLC</strong>-<strong>DAD</strong> has been proven to be a reliable<br />
and reproducible method for substance identification <strong>in</strong> cl<strong>in</strong>ical<br />
as well as forensic toxicology <strong>by</strong> many laboratories, where it is<br />
appreciated for its ruggedness and the relatively simple sample<br />
preparation required. Nevertheless, it is held <strong>in</strong> low esteem <strong>by</strong><br />
many analysts because UV spectra display only a limited<br />
number <strong>of</strong> maxima and m<strong>in</strong>ima with no simple correlation to<br />
chemical structure. This controversy between practical experi-<br />
ence and general analytical feel<strong>in</strong>g should be resolved <strong>in</strong> a<br />
more exact way. Therefore, <strong>in</strong> this paper the question <strong>of</strong> the se-<br />
lectivity <strong>of</strong> this method for substance identification was sys-<br />
tematically <strong>in</strong>vestigated on the basis <strong>of</strong> 2682 sets <strong>of</strong> UV spectra,<br />
Reproduction (photocopy<strong>in</strong>g) <strong>of</strong> editorial content <strong>of</strong> this journal is prohibited without publisher's permission. 233
RRT, and structural formulae conta<strong>in</strong>ed <strong>in</strong> the library men-<br />
tioned previously (23).<br />
Material and methods<br />
<strong>Toxicological</strong>ly relevant compounds<br />
The 2682 substances <strong>in</strong>cluded <strong>in</strong> the database and 206 further<br />
compounds, which were found to have no UV absorption, were<br />
selected from all fields <strong>of</strong> toxicological and pharmacological <strong>in</strong>-<br />
terest. All groups <strong>of</strong> therapeutic drugs were <strong>in</strong>cluded with a par-<br />
ticular consideration for those pharmaceuticals most frequently<br />
applied. In most cases, the drugs were generously donated <strong>by</strong> a<br />
large number <strong>of</strong> manufacturers, the enumeration <strong>of</strong> which is<br />
impossible <strong>in</strong> the frame <strong>of</strong> this section. Opiates, cannab<strong>in</strong>oids,<br />
coca<strong>in</strong>e and its metabolites, amphetam<strong>in</strong>es, and many designer<br />
drugs, as well as a number <strong>of</strong> halluc<strong>in</strong>ogens were purchased<br />
from the companies Sigma (Taufkirchen, Germany), Radian<br />
(Aust<strong>in</strong>, Texas), or Lipomed (Arlesheirn, Switzerland). All types<br />
<strong>of</strong> pesticides were <strong>in</strong>cluded. These compounds were mostly<br />
purchased from the firms Promochem (Wesel, Germany),<br />
Riedel de Hahn (Seelze, Germany), or Labor Dr. Ehrenstorfer<br />
(Augsburg, Germany). From these manufacturers, a number <strong>of</strong><br />
ecotoxic compounds (polycyclic aromatic hydrocarbons, poly-<br />
chlor<strong>in</strong>ated biphenyls, and chlor<strong>in</strong>ated phenols) were also ob-<br />
ta<strong>in</strong>ed. F<strong>in</strong>ally, a series <strong>of</strong> alkaloids <strong>in</strong>clud<strong>in</strong>g strychn<strong>in</strong>e,<br />
bruc<strong>in</strong>e, nicot<strong>in</strong>e or toxic glycosides, some aromatic or unsat-<br />
urated solvents, and some frequently applied chemical reagents<br />
were also <strong>in</strong>cluded. Almost all substances were organic com-<br />
pounds, and only a very small number <strong>of</strong> <strong>in</strong>organic anions<br />
such as NO2- and CrO 4- were analyzed. A complete list <strong>of</strong> all<br />
compounds is given <strong>by</strong> Pragst et al. (23) and can also be ob-<br />
ta<strong>in</strong>ed directly from the authors. All substances were given a<br />
code that consisted <strong>of</strong> the first letter <strong>of</strong> the substance name and<br />
a three-digit number assigned <strong>in</strong> the order <strong>of</strong> registration <strong>in</strong><br />
the laboratory (e.g., B145 for bufoten<strong>in</strong>e).<br />
Instruments<br />
Each compound was measured with the follow<strong>in</strong>g three<br />
<strong>HPLC</strong>-<strong>DAD</strong> devices: (1) A Shimadzu <strong>HPLC</strong> device (Shimadzu<br />
Europe GmbH, Duisburg, Germany) that consisted <strong>of</strong> a pump<br />
LC-6A, an autosampler SIL-9A, a <strong>DAD</strong> SPD-M10Avp, and a<br />
computer (standard IBM PC). The SPD-M10Avp was operated <strong>by</strong><br />
the s<strong>of</strong>tware Class-VP 5.032; (2) A Bio-Tek <strong>HPLC</strong> device (Bio-<br />
Tek Instruments GmbH, Neufahrn, Germany) that consisted <strong>of</strong><br />
a pump 525, sampler 560, and <strong>DAD</strong> 540 operated with the s<strong>of</strong>t-<br />
ware Kroma 2000; and (3) a Hewlett-Packard (Agilent) <strong>HPLC</strong><br />
device HP 1090 Series II (Agilent Technologies, Waldbronn,<br />
Germany) operated with the s<strong>of</strong>tware <strong>HPLC</strong>-Chemstation Rev.<br />
A.02.05.<br />
Wavelength calibration and accuracy checks <strong>of</strong> the <strong>DAD</strong> were<br />
performed regularly. The UV spectra obta<strong>in</strong>ed from the three<br />
devices were <strong>in</strong> excellent agreement with each other with<br />
respect to wavelength resolution, as well as to wavelength ac-<br />
curacy (24). For the evaluation presented <strong>in</strong> this paper, the<br />
spectra recorded with the Shimadzu SPD-M10Avp detector<br />
were used.<br />
234<br />
Journal <strong>of</strong> Analytical Toxicology, Vol. 27, May/June 2003<br />
The mobile phase was degassed <strong>by</strong> vacuum degassers DG-<br />
1210 (Optilab Chromatographie Technik, Berl<strong>in</strong>, Germany).<br />
<strong>HPLC</strong>-<strong>DAD</strong> conditions<br />
A reversed-phase <strong>HPLC</strong> column Lichrospher-RP8ec (5 ~m,<br />
250 x 4.0 mm) (Merck, Darmstadt, Germany) and two isocratic<br />
mobile phases A and B that consisted <strong>of</strong> acetonitrile (UV grade,<br />
Merck), and 0.1M phosphate buffer pH 2.3 <strong>in</strong> different ratios (A<br />
37:63, v/v; B 63:37, v/v) were used. The measurements were car-<br />
ried out at room temperature (20-25~ at a flow rate <strong>of</strong> 1<br />
mL/m<strong>in</strong> with a run time <strong>of</strong> 30 ra<strong>in</strong>.<br />
For the control <strong>of</strong> accurate performance, 10 IJL <strong>of</strong> a test so-<br />
lution that consisted <strong>of</strong> the follow<strong>in</strong>g substances dissolved <strong>in</strong><br />
the mobile phase was measured at the beg<strong>in</strong>n<strong>in</strong>g <strong>of</strong> each series:<br />
0.1 mg/mL histam<strong>in</strong>e for the determ<strong>in</strong>ation and control <strong>of</strong> to<br />
(time <strong>of</strong> an unreta<strong>in</strong>ed peak); 0.1 mg/mL caffe<strong>in</strong>e for control <strong>of</strong><br />
the autosampler (check <strong>of</strong> peak area); 0.1 mg/rnL <strong>of</strong> 5-(4-<br />
methylphenyl)-5-phenylhydanto<strong>in</strong> (MPPH, reference substance<br />
for the calculation <strong>of</strong> the RRT <strong>in</strong> mobile phase A) or 0.1 mg/rnL<br />
4-phenylbenzophenone (PBP, reference substance for the cal-<br />
culation <strong>of</strong> the RRT <strong>in</strong> mobile phase B), and 1 mg/rnL benzene<br />
for control <strong>of</strong> the resolution, accuracy, and reproducibility <strong>of</strong><br />
the UV spectrum (check <strong>of</strong> vibration bands). The test solution<br />
was stored <strong>in</strong> a brown glass vessel at 0-4~ and was stable<br />
under these conditions for at least three months.<br />
Measurement <strong>of</strong> the UV spectra and RRT<br />
For the measurement <strong>of</strong> the UV spectra, 1 IJg <strong>of</strong> each sub-<br />
stance (10 IJL <strong>of</strong> a 0.1-mg/mL solution <strong>in</strong> mobile phases A and<br />
B or <strong>in</strong> acetonitrile) was <strong>in</strong>jected. The UV spectrum between 195<br />
and 380 nm at the maximum <strong>of</strong> the chromatographic peak<br />
was corrected with respect to the absorbance <strong>of</strong> the solvent<br />
and stored. This wavelength range was chosen as a reasonable<br />
compromise between analytical demands and the aim <strong>of</strong> lim-<br />
it<strong>in</strong>g data file size. Only 173 (6.4%) <strong>of</strong> the 2682 compounds dis-<br />
played considerable absorption above 380 nm, however the<br />
correspond<strong>in</strong>g spectra were also sufficiently specific below this<br />
limit.<br />
The RRT <strong>of</strong> a compound i (RRTi) was calculated from the ab-<br />
solute retention time <strong>of</strong> i (RTi), the time <strong>of</strong> an unreta<strong>in</strong>ed peak<br />
(to), and the RT <strong>of</strong> the reference substance (RTMPPH or RTpsp)<br />
us<strong>in</strong>g:<br />
RRTi = (RTi - tO)/(RTMPPH - to) Eq. 1<br />
The spectra and RRTs <strong>of</strong> all 2682 compounds were published<br />
and are available as a book, as well as on CD-ROM (23) for use<br />
with customary <strong>HPLC</strong> s<strong>of</strong>tware.<br />
S<strong>of</strong>tware operations<br />
The structural formulae <strong>of</strong> all compounds were drawn us<strong>in</strong>g<br />
ISIS Draw 2.3 and stored <strong>in</strong> a substance database us<strong>in</strong>g ISIS<br />
Base 2.1.1 (both MDL Molecular Design Ltd., San Leandro,<br />
CA). All chmmophore substructures were determ<strong>in</strong>ed and reg-<br />
istered <strong>in</strong>to an additional chromophore database.<br />
UV spectra were recorded us<strong>in</strong>g the <strong>DAD</strong> s<strong>of</strong>tware CLASS-VP<br />
5.032 (Shimadzu Corp., Kyoto, Japan) and were afterwards<br />
converted <strong>in</strong>to the ASCII format. All 2682 spectra were then im-
Journal <strong>of</strong> Analytical Toxicology, Vol. 27, May/June 2003<br />
ported <strong>in</strong>to Excel 2000 (Micros<strong>of</strong>t Corp., Redmond, WA), which<br />
resulted <strong>in</strong> a data matrix <strong>of</strong> 2682 substance rows and 181 ab-<br />
sorbance columns that corresponded to the wavelength region<br />
from 200 to 380 nm. Absorbance values from 195 to199 run<br />
were omitted because <strong>of</strong> potentially <strong>in</strong>creased disturbances <strong>by</strong><br />
the solvent. The calculation <strong>of</strong> the similarity <strong>in</strong>dices (SI) be-<br />
tween all pairs <strong>of</strong> spectra was performed from this matrix us<strong>in</strong>g<br />
MatLab Version 5.3.0.10183 (Rll) (The Math Works Inc.,<br />
Natick, MA).<br />
Analysis <strong>of</strong> real samples<br />
The procedures used for sample preparation <strong>in</strong> the rout<strong>in</strong>e<br />
application <strong>of</strong> <strong>HPLC</strong>--<strong>DAD</strong> for STA were described <strong>in</strong> detail <strong>in</strong><br />
previous papers (3,25).<br />
Results and Discussion<br />
The absorption spectrum <strong>in</strong> the UY wavelength range <strong>in</strong>ves-<br />
tigated <strong>in</strong> this paper orig<strong>in</strong>ates ma<strong>in</strong>ly from the <strong>in</strong>teraction <strong>of</strong><br />
UY radiation with a conjugated system <strong>of</strong> ~-electrons and free<br />
electron pairs <strong>of</strong> hetero atoms <strong>in</strong> the form <strong>of</strong> ~* or n-~*<br />
transitions. The <strong>in</strong>volvement <strong>of</strong> o-electrons (~-~* or n--->a*<br />
transitions) is rather an exception and is limited to some com-<br />
pounds conta<strong>in</strong><strong>in</strong>g sulfur, brom<strong>in</strong>e, or iod<strong>in</strong>e. Therefore, not<br />
the complete molecule, but only the conjugated system <strong>of</strong> ~-<br />
electrons and free electron pairs <strong>of</strong> hetero atoms (the chro-<br />
mophore) is responsible for UY absorption. In general,<br />
unsaturated, but nonconjugated parts <strong>of</strong> the molecule, as well<br />
as isolated substituents do not or only <strong>in</strong>directly contribute to<br />
the absorption. Nevertheless, hyperconjugation effects also play<br />
a certa<strong>in</strong> role. Thus, <strong>in</strong> the authors' def<strong>in</strong>ition <strong>of</strong> a chro-<br />
mophore, substituents without n- or x-electrons conjugated to<br />
the chromophore were <strong>in</strong>cluded up to the first saturated carbon<br />
atom (see examples that follow).<br />
A high selectivity <strong>of</strong> UY spectra for substance identification<br />
would mean that the spectrum <strong>of</strong> each compound could be<br />
unambiguously identified <strong>in</strong> the presence <strong>of</strong> other compounds<br />
randomly picked from the <strong>in</strong>vestigated substance pool. A highly<br />
specific relationship between spectrum and chemical struc-<br />
(H O<br />
Dlazepam<br />
O--C--CaHt3<br />
r T ~. T ~, No substantial UV absorption,<br />
0 ~ v Y <strong>in</strong>fluence on the chromophore<br />
Testosterone enantate<br />
~T Jr Itraconazole<br />
4 isolated chrom<strong>of</strong>lhor~ = 1 ~oq~on I<strong>by</strong>s~11<br />
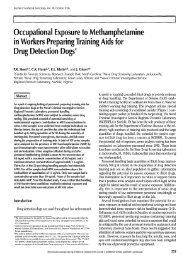
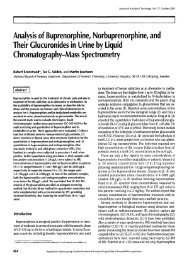
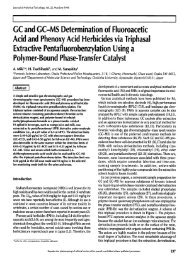
Figure 1. Structural formulae and chromophores <strong>of</strong> diazepam, testos-<br />
terone enantate, and itraconazole. Chromophores are drawn bold.<br />
ture would be the prerequisite. In order to f<strong>in</strong>d out to what ex-<br />
tent this demand was met for the library spectra, two strategies<br />
were chosen: (i) statistical assessment <strong>of</strong> the structural diversity<br />
<strong>of</strong> the registered chromophores and (ii) determ<strong>in</strong>ation <strong>of</strong> the<br />
dist<strong>in</strong>ctness <strong>of</strong> each spectrum <strong>by</strong> similarity calculations be-<br />
tween all spectra.<br />
Diversity <strong>of</strong> chremophores and absorption systems<br />
In Figure 1, the structural formulae <strong>of</strong> three compounds are<br />
shown with their chromophores drawn bold. For diazepam,<br />
the chromophore is almost identical with the whole molecule.<br />
However, <strong>in</strong> the case <strong>of</strong> testosterone enantate the absorption is<br />
limited to the cc,~-unsaturated carbonyl group. The predomi-<br />
nant part <strong>of</strong> the molecule has no absorption <strong>in</strong> the <strong>in</strong>vesti-<br />
gated wavelength range, but it may change the absorption <strong>of</strong><br />
the chromophore <strong>by</strong> electronic or sterical effects. Itraconazole<br />
possesses four different chromophores separated from each<br />
other <strong>by</strong> saturated carbon atoms. In this case, the UV spec-<br />
trum <strong>of</strong> the molecule is roughly the sum <strong>of</strong> the spectra <strong>of</strong> the<br />
four chromophores. In the follow<strong>in</strong>g, those structural parts <strong>of</strong><br />
a molecule <strong>in</strong>volved <strong>in</strong> UV absorption (one or more isolated<br />
chromophores) will be referred to as the absorption system.<br />
For 2560 <strong>of</strong> the 2682 compounds, such an absorption system<br />
could be def<strong>in</strong>ed. In the rema<strong>in</strong><strong>in</strong>g 122 cases (saturated sub-<br />
stances or <strong>in</strong>organic anions), the explanation for the UY ab-<br />
sorption was more complicated. By count<strong>in</strong>g out, it was found<br />
that <strong>in</strong> the 2560 compounds with a def<strong>in</strong>ed absorption system<br />
1486 different chromophores and a total <strong>of</strong> 1650 different ab-<br />
sorption systems were present. Some <strong>of</strong> the chromophores<br />
never appeared <strong>in</strong> comb<strong>in</strong>ation with others, whereas some<br />
comb<strong>in</strong>ations would conta<strong>in</strong> chromophores not found alone.<br />
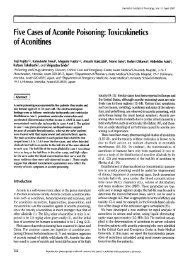
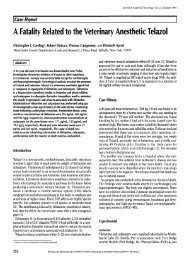
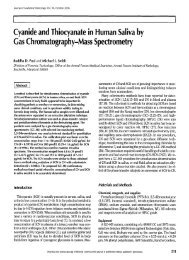
The frequency distribution is shown <strong>in</strong> Figure 2. Only once did<br />
1370 absorption system occur, 170 twice, and 47 three times.<br />
Nevertheless, some chromophores were found with a high fre-<br />
quency such as the toluene system (125x) or the 4-methylpent-<br />
3-en-2-one substructure <strong>of</strong> the steroids (64x).<br />
Practical experience, as well as the f<strong>in</strong>d<strong>in</strong>gs from the spectral<br />
similarity calculations <strong>of</strong> this work (see follow<strong>in</strong>g) lead to the<br />
conclusion that structurally different absorption systems will al-<br />
most always be dist<strong>in</strong>guishable from each other <strong>by</strong> their UY<br />
o (53.5% <strong>of</strong> compounds) . ~ ' j<br />
lOO<br />
90<br />
9 70<br />
-00<br />
-5o<br />
170(13.3%) ~'- 20<br />
,~, ~-;-T ........ ',~ ..... lo<br />
0 I 2 3 4 5 6 7 8 9 10111213 20406000100120<br />
Frequency<br />
Figure 2. Frequency <strong>of</strong> different absorption systems <strong>in</strong> 2560 toxicologically<br />
relevant compounds.<br />
235
spectra. At least 1370 compounds (53.5%) possess<strong>in</strong>g a unique<br />
absorption system should, therefore, exhibit a unique IN spec-<br />
trum, as well. On the other hand, different compounds with the<br />
same chromophore or absorption system are likely to produce<br />
similar spectra. However, because <strong>of</strong> sterical or electronic effects<br />
<strong>of</strong> the residual molecule, even <strong>in</strong> theses cases, spectral differ-<br />
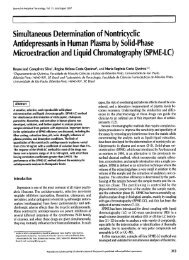
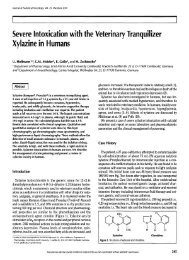
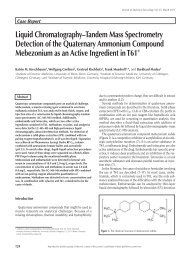
ences were <strong>of</strong>ten found. As an example, <strong>in</strong> Figure 3 the spectra<br />
<strong>of</strong> 32 steroids with the 3-methylcyclohexadienone chromophore<br />
are shown. The isolated substituents R1 and R2 at r<strong>in</strong>g B are ei-<br />
ther hydrogen or fluor<strong>in</strong>e. Depend<strong>in</strong>g on the number and po-<br />
sition <strong>of</strong> the fluor<strong>in</strong>e atoms, the spectra can roughly be<br />
subdivided <strong>in</strong>to four groups. The more distant substituents<br />
Ry-Rs lead to a further differentiation with<strong>in</strong> these groups,<br />
probably owed to sterical effects.<br />
<strong>Selectivity</strong> parameters<br />
For the characterization <strong>of</strong> the selectivity <strong>of</strong> an analytical<br />
method, several parameters have been <strong>in</strong>troduced <strong>in</strong> the past, <strong>of</strong><br />
which two were chosen here. The discrim<strong>in</strong>ation power (DP)<br />
(26) is a measure for the probability that two compounds se-<br />
lected <strong>by</strong> chance from the substance pool under consideration<br />
can be dist<strong>in</strong>guished <strong>by</strong> the method. It is calculated <strong>by</strong>:<br />
DP = 1 - [(u - n)/n(n - 1)]<br />
Eq. 2<br />
where u is the number <strong>of</strong> <strong>in</strong>dist<strong>in</strong>guishable substance pairs (all<br />
fields with a I <strong>in</strong> the identification matrix, see follow<strong>in</strong>g), n is<br />
the total number <strong>of</strong> substances under consideration, DPmax is 1<br />
(all compounds can be dist<strong>in</strong>guished from each other), and<br />
DPm<strong>in</strong> is 0 (all compounds are <strong>in</strong>dist<strong>in</strong>guishable).<br />
The mean list length (MLL) (27) is given <strong>by</strong> the average<br />
number <strong>of</strong> <strong>in</strong>dist<strong>in</strong>guishable substance pairs for each com-<br />
pound and is calculated <strong>by</strong>:<br />
MLL = u/n Eq. 3<br />
where MLLmi n is 1 (each substance is only <strong>in</strong>dist<strong>in</strong>guishable<br />
from itself) and MLLmax is n (all compounds are <strong>in</strong>dist<strong>in</strong>guish-<br />
able).<br />
The advantages or drawbacks <strong>of</strong> these parameters are dis-<br />
236<br />
~H a ~a<br />
i ,'~' i . % -.- n~<br />
9 ...... :,,~ !<br />
4 .... R ~F, RI~F, n~S [<br />
9 oo ,.;o ,;.o ,80 300 3,o<br />
~Inm<br />
Figure 3. Substituent effects on the UV spectra <strong>of</strong> 32 steroids with the<br />
3-methylcyclohexadienone.<br />
Journal <strong>of</strong> Analytical Toxicology, Vol. 27, May/June 2003<br />
cussed <strong>by</strong> Herzler (28). In short, it can be said that DP is a<br />
rather <strong>in</strong>sensitive parameter with respect to small differences<br />
between high-resolution analytical methods, whereas MLL does<br />
not consider the number <strong>of</strong> substances exam<strong>in</strong>ed (certa<strong>in</strong>ly it<br />
makes a big difference if a MLL <strong>of</strong> 1.5, for example, was found<br />
for a total <strong>of</strong> 100 or 1000 compounds). A truly fair comparison<br />
between different analytical methods only seems possible if an<br />
identical substance collective was exam<strong>in</strong>ed or if this collective<br />
reached a size and diversity <strong>in</strong> chemical structure representative<br />
for the given task.<br />
Specificity <strong>of</strong> the UV spectra evaluated from SI<br />
Mathematical models for the assessment <strong>of</strong> spectral simi-<br />
larity use the description <strong>of</strong> the spectrum as a vector <strong>in</strong><br />
n-dimensional space, where n is the number <strong>of</strong> absorbance-<br />
wavelength pairs measured. Details are described <strong>by</strong> Huber and<br />
George (29). For the wavelength range from 200 to 380 nm<br />
recorded with a spectral resolution <strong>of</strong> 1 nm, n equals 181. In the<br />
case <strong>of</strong> complete identity <strong>of</strong> two spectra, both vectors po<strong>in</strong>t <strong>in</strong><br />
exactly the same direction (i.e., the angle between them is 0 =<br />
0~ Different concentrations only have an effect on vector<br />
length, but not on its direction <strong>in</strong> space. The SI is def<strong>in</strong>ed as<br />
cos e and is calculated <strong>by</strong> Equation 4. For two identical spectra,<br />
cos 0 equals 1.0000. Because near 1.0000 the cos<strong>in</strong>e function is<br />
relatively <strong>in</strong>sensitive for changes <strong>of</strong> O, already small deviations<br />
from 1.0000 can <strong>in</strong>dicate significant differences between the<br />
spectra.<br />
S 1 9 S 2<br />
SI = cos0~s2= ~ Eq. 4<br />
where si equals the vectorized spectrum <strong>of</strong> compound i.<br />
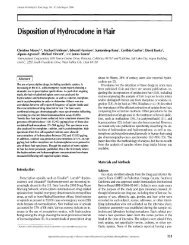
By us<strong>in</strong>g Equation 4, the SI <strong>of</strong> all possible pairs among<br />
the 2682 substances <strong>of</strong> the database (approximately 7.2 x 10⁶<br />
<strong>in</strong>dices) were calculated and entered <strong>in</strong>to a so-called similar-<br />
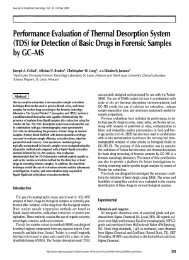
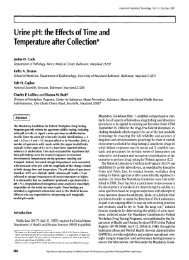
ity matrix. A small excerpt <strong>of</strong> this huge matrix is shown <strong>in</strong><br />
Figure 4a. Because the spectra <strong>of</strong> all compounds are identical<br />
with themselves, the diagonal fields <strong>of</strong> the matrix always<br />
show an SI <strong>of</strong> 1.0000. All other substance pairs occur twice <strong>in</strong><br />
the matrix.<br />
With up-to-date <strong>DAD</strong>s, IN spectra can be measured with high<br />
sensitivity and reproducibility. Nevertheless, <strong>in</strong> practical anal-<br />
ysis, spectra may be changed to a small extent <strong>by</strong> noise or ma-<br />
trix effects, and an <strong>in</strong>dex <strong>of</strong> 1.0000 for complete identity is not<br />
always met. Therefore, it was necessary to def<strong>in</strong>e a practical<br />
threshold value <strong>of</strong> SI above which two spectra were regarded as<br />
identical. For this purpose, a large number <strong>of</strong> library search op-<br />
erations were considered. As an example, <strong>in</strong> Figure 5 the spec-<br />
trum <strong>of</strong> temazepam is compared with the spectra <strong>of</strong> three other<br />
benzodiazep<strong>in</strong>es. It is seen that all three spectra differ from<br />
that <strong>of</strong> temazepam with an <strong>in</strong>creas<strong>in</strong>g SI from lormetazepam<br />
(SI = 0.9908) through flurazepam (SI = 0.9965) to camazepam<br />
(SI = 0.9993). As a result <strong>of</strong> the evaluation <strong>of</strong> such examples, a<br />
threshold SI <strong>of</strong> 0.9990 was chosen. Thus, <strong>in</strong> Figure 5, only the<br />
spectrum <strong>of</strong> camazepam would be considered identical with<br />
that <strong>of</strong> temazepam.<br />
This threshold value is also <strong>in</strong> agreement with the authors' ex-<br />
perience from the use <strong>of</strong> the spectra library <strong>in</strong> daily toxicolog-
Journal <strong>of</strong> Analytical Toxicology, Vol. 27, May/June 2003<br />
ical rout<strong>in</strong>e analysis. From undisturbed chromatographic peaks<br />
orig<strong>in</strong>at<strong>in</strong>g from an <strong>in</strong>jected amount > 10 ng, substances were<br />
always identified <strong>by</strong> their library spectrum with SI values above<br />
0.9990. Us<strong>in</strong>g customary sample preparation techniques, this<br />
substance amount corresponds to serum concentrations <strong>in</strong> the<br />
order <strong>of</strong> 50-100 ng/mL, or even less.<br />
By use <strong>of</strong> this criterion, the similarity matrix was transformed<br />
<strong>in</strong>to a so-called identification matrix (Figure 4b), <strong>in</strong> which all<br />
substance pairs with SI > 0.9990 were assigned a value <strong>of</strong> 1<br />
(identical) and all substance pairs with SI _< 0.9990 received a<br />
value <strong>of</strong> 0 (different). In this matrix, for each compound the<br />
number <strong>of</strong> identical spectra was counted. The results are shown<br />
<strong>in</strong> Figure 6. Of the 2682 substances, 1619 (60.4%) showed<br />
unique spectra. For 399 compounds (14.9%) there was one<br />
other and for 175 (6.5%) there were two further substances,<br />
each with an <strong>in</strong>dist<strong>in</strong>guishable spectrum. However, there were<br />
also spectra less specific, <strong>by</strong> far. For example, 28 substances<br />
were found to have 15 further candidates each with an identical<br />
spectrum. Us<strong>in</strong>g Equations 2 and 3, a DP <strong>of</strong> 0.9994 and MLL <strong>of</strong><br />
2.701 were calculated.<br />
i<br />
CODE ~ P3D7 I aM F310 13311 P312<br />
P| I l l 0.0518 I = m ~ 0.4888 0.5838 0.6380<br />
P307 0.858, Iml;;3]~]mn 0.8533 0.3365 0.4417 0.$353<br />
~ I N m I 0.4598 0.3028 0.6363<br />
P~|O<br />
Pill<br />
0.4~18<br />
0.5938<br />
0.0365<br />
0.4417<br />
I<br />
0.4585<br />
0.3928<br />
itIIRl~Illl<br />
0.7979<br />
0.7578<br />
Ilml,II<br />
0.7647<br />
0.8480<br />
Pil2 0.6~0 0.5355 0.6383 0.7647 0.9480 m*~*]q=<br />
Pi|3<br />
Pif4<br />
Pill<br />
0,7797<br />
0.6103<br />
0.6527<br />
0.782<br />
0.4842<br />
0.5590<br />
I<br />
I<br />
0.7746<br />
05088<br />
0.8508<br />
0.5774<br />
0.7688<br />
0.8482<br />
0.6599<br />
0.9939<br />
0.9482<br />
0.7203<br />
0.9710<br />
0.9813<br />
Pitt 0.6974 0.8576 I 0.7040 0.3677 0.4471 0.0059<br />
P310 0.7153 0.6760 I 03123 0.6272 0.8822 0.0076<br />
P320 0.7884 0.8121 I 0.7630 0.6643 0.8158 0.8790<br />
Pi31 0.6388 0.7866 I 0.8288 0.5602 0.7552 0.8674<br />
P332 0.5520 0.5443 I 0.5504 0.7760 0.9635 0.0977<br />
PiE3<br />
P324<br />
P3128<br />
0.8869<br />
0.7316<br />
0.6220<br />
0.6488<br />
0.6935<br />
0.4878<br />
I<br />
]<br />
1<br />
0.8806<br />
0.7287<br />
0,5207<br />
0.3579<br />
0.7251<br />
0.8159<br />
0.3724<br />
0.8881<br />
0,9936<br />
; 0.3457<br />
0.9675<br />
0.9728<br />
A-.~7<br />
0.~2<br />
o o,.~6<br />
0.4355<br />
o.5o6o<br />
I<br />
,I<br />
0.5883<br />
o0~s<br />
0.8032<br />
0.8893<br />
I ~ 1<br />
0.0759 [<br />
0.5425<br />
0.9666<br />
I I<br />
(a) Similarity matrix (spectrum only)<br />
Additional use <strong>of</strong> the RRT<br />
Besides the UV spectrum for all compounds, the RRT <strong>in</strong> mobile<br />
phases A (1993 compounds) or B (689 compounds) was<br />
available as an additional criterion for identification. The usefulness<br />
<strong>of</strong> the RRT for identification depends on the accuracy<br />
with which it can be reproduced.<br />
Over a period <strong>of</strong> more than two years, a standard test solution<br />
(see <strong>HPLC</strong>-<strong>DAD</strong> conditions) was measured with every series <strong>of</strong><br />
measurements for the spectrum library. The variation coefficients<br />
<strong>of</strong> the RT (VKRT = (SRT/RT) x 100%) <strong>of</strong> histam<strong>in</strong>e (dead<br />
time), as well as <strong>of</strong> the reference standards MPPH (mobile phase<br />
A) and PBP (mobile phase B) were found to be 3% for mobile<br />
phase A (n = 167 for toand 166 for RTMppH ) and 5% for eluent<br />
B (n = 49 for to and 71 for RTpBp). Although, <strong>in</strong> this way a<br />
rather <strong>in</strong>termediate precision (same laboratory, different analysts,<br />
different equipment) <strong>of</strong> the method was obta<strong>in</strong>ed; <strong>in</strong>terlaboratory<br />
method reproducibility should be comparable<br />
because <strong>of</strong> the long time period covered <strong>by</strong> these experiments.<br />
The <strong>in</strong>traday VKm- (repeatability) determ<strong>in</strong>ed <strong>by</strong> 15 consecutive<br />
analyses, each separated <strong>by</strong> a blank sample <strong>in</strong> eluent A for his-<br />
~ D D D D U N . i ~<br />
D ~ N U i , i I , i i , i<br />
! ~ I o m I I I I , I<br />
I~"~]I ~ U<br />
[,] I<br />
~ I<br />
~ i i, n n l l n " i R i<br />
m-nFlm ~ i , U '<br />
~ i i , U R N<br />
~ i , n n ~<br />
~ ~I~im oH uN oE o o i i l I l<br />
(c) <strong>Identification</strong> matrix (RRT only)<br />
CODE P'JOE P307 P3M P3 I0 P3 ! I P312<br />
m e<br />
Pi'~'~-- n o o 3 o o<br />
P3D7 ~ 0 n 0 0 0 0<br />
P'3~ 0 0 n o o o<br />
P310 0 0 0 n o o<br />
nil 0 0 0 0 n o<br />
F312 0 0 0 0 0 n<br />
13 0 0 0 0 0 0<br />
P314 0 0 0 0 0 0<br />
~10 0 0 0 0 0 0<br />
P317 0 0 0 0 0 0<br />
I~IE 0 0 0 0 0 0<br />
1~20 0 0 0 0 0 0<br />
l~21 0 0 0 3 0 0<br />
PSE2 0 0 0 3 0 0<br />
PSE3 0 0 0 0 0 0<br />
I~JE4 0 0 0 0 0 0<br />
t'~E 0 0 0 O 0 0<br />
0 0 0 3 0<br />
P327 0 0 0 0 0 0<br />
(b) <strong>Identification</strong> matrix (spectrum only) (d) Comb<strong>in</strong>ed identification matrix<br />
Figure 4. Excerpt from the matrices used for the evaluation <strong>of</strong> the selectivity <strong>of</strong> <strong>HPLC</strong>-<strong>DAD</strong> for substance identification with a database <strong>of</strong> 2682 compounds.<br />
Fields with <strong>in</strong>dist<strong>in</strong>guishable substance pairs were pr<strong>in</strong>ted <strong>in</strong>versely. Similarity matrix (spectrum only) (a), Sl <strong>of</strong> all possible substance pairs were calculated<br />
<strong>by</strong> Equation 4; identification matrix (spectrum only) (b), substance pairs with Sl > 0.9990 were assigned the value I (identical), and substance pairs with Sl<br />
tam<strong>in</strong>e, MPPH, and a third standard compound (caffe<strong>in</strong>e)<br />
ranged from 0.2 to 0.9% (n = 15). It was concluded from these<br />
measurements that the variation coefficients found were appli-<br />
cable over the entire RT range. By sett<strong>in</strong>g the RT error w<strong>in</strong>dow<br />
to 2SRT (correspond<strong>in</strong>g to a 95% confidence <strong>in</strong>terval), an <strong>in</strong>-<br />
dividual error w<strong>in</strong>dow for RRT was calculated for every com-<br />
pound from the long-term VKRT (3 and 5%, respectively) <strong>by</strong><br />
application <strong>of</strong> the rules <strong>of</strong> error propagation to equation 1.<br />
Two compounds were then rated identical if the RRT <strong>of</strong> at<br />
least one <strong>of</strong> them would fall <strong>in</strong>to the RRT error w<strong>in</strong>dow <strong>of</strong> the<br />
other; otherwise they were considered dist<strong>in</strong>guishable. Us<strong>in</strong>g<br />
this criterion, all compounds measured <strong>in</strong> mobile phase A were<br />
compared with each other <strong>in</strong> an RRT identification matrix<br />
(Figure 4c). In this matrix, aga<strong>in</strong>, compound pairs regarded as<br />
238<br />
i iTemazepam ~ .... Camazepkm, St =~.9993<br />
i i : N [ : N , ~[<br />
.......... ...... Li ............... ............ ............. i .... ~ i ............... i ................ i...! ............... i ...............<br />
i ~ I - i - 1 . i - p - i - I "<br />
2~ ~0 2~ 260 280 300 ~0 340 360 ~0<br />
;Temazepam .... Flurazepam, SI = 0.9965<br />
, ............... Y,-~I ................ i ............... i ............... i ................ i ................ ! ............... i ...............<br />
'~ j'//*~ i i i :: i (~H~CH~'N(QzHs),<br />
\..,Y ~.i ~ i i i ,, o ,<br />
9 , 9 , 9 , . , 9 , 9 , . i . , .<br />
200 220 240 260 280 300 320 340 360 380<br />
iTemazepam -~---Lortnetazep~m SI =i0.9908<br />
............... i .............. i ................ ! ................ ; .............. i ................ i ............................... i ...............<br />
, i i :, i ! i ~ i<br />
', ! ! i i i i ~i' o i<br />
~ i ] : ~i ................ ii ................ i~ ............... ii!i O""~'~ H i. ! .. i H.i c............. N t i! ...............<br />
i . ~. i i i. i i..~....! .............<br />
i iN ~ ! i i<br />
............................................... ~:, ........... i ............... i ................ i ............... i ............... i ..............<br />
i i i i i<br />
9 , . . . , . , . , . . . , 9 , .<br />
~Inm<br />
Figure 5. UV spectra with a different degree <strong>of</strong> similarity to that <strong>of</strong><br />
temazepam. With a threshold SI = 0.9990, the spectrum <strong>of</strong> camazepam<br />
is assessed to be identical, those <strong>of</strong> flurazepam and Iormetazepam are<br />
considered dist<strong>in</strong>guishable.<br />
Journal <strong>of</strong> Analytical Toxicology, Vol. 27, May/June 2003<br />
identical received a 1, and dist<strong>in</strong>guishable pairs were set to 0.<br />
The same procedure was performed for all compounds mea-<br />
sured <strong>in</strong> mobile phase B.<br />
From the evaluation <strong>of</strong> these matrices, the RRT alone turned<br />
out to be a rather uncharacteristic parameter for substance<br />
identification (under the separation conditions used here). In<br />
mobile phase A (1993 compounds), no compound was unam-<br />
biguously identified, and on average each compound had 124<br />
others from which it could not be dist<strong>in</strong>guished <strong>by</strong> the RRT<br />
alone (MLL = 125). The situation <strong>in</strong> mobile phase B (689 com-<br />
pounds) was only slightly improved (MLL = 94). This unfavor-<br />
able result was at least partly caused <strong>by</strong> the isocratic <strong>HPLC</strong><br />
conditions, which were chosen for practical reasons (recycl<strong>in</strong>g<br />
<strong>of</strong> the mobile phase, no condition<strong>in</strong>g <strong>of</strong> the column between<br />
runs, and higher reproducibility) and lead to an uneven distri-<br />
bution <strong>of</strong> RRT with an accumulation <strong>of</strong> substances <strong>in</strong> the early<br />
m<strong>in</strong>utes <strong>of</strong> the chromatogram.<br />
Nevertheless, <strong>in</strong> comb<strong>in</strong>ation with the UV spectrum, the RRT<br />
should significantly decrease the number <strong>of</strong> false-positive search<br />
results. Therefore, for both mobile phases the spectrum and<br />
RRT identification matrices were comb<strong>in</strong>ed <strong>by</strong> multiplication <strong>of</strong><br />
the contents <strong>of</strong> the correspond<strong>in</strong>g fields (Figure 4d). In this<br />
comb<strong>in</strong>ed identification matrix, two substances were considered<br />
identical only if SI > 0.9990 and their RRTs did not fall <strong>in</strong>to their<br />
mutual RRT error w<strong>in</strong>dows. The results for the 1993 com-<br />
pounds measured <strong>in</strong> mobile phase A are shown <strong>in</strong> Figure 7. It<br />
can be seen that the results achieved on the basis <strong>of</strong> the UV spec-<br />
trum alone are very similar to those shown <strong>in</strong> Figure 6, which<br />
lead to the conclusion that a representative substance collective<br />
was <strong>in</strong>vestigated. By <strong>in</strong>clusion <strong>of</strong> the RRT, the number <strong>of</strong> un-<br />
ambiguously identified substances <strong>in</strong>creased from 60.6% to<br />
84.2%, the number <strong>of</strong> substances with two hits (positive search<br />
results) decreased from 14.2% to 10.6%, and <strong>of</strong> those with<br />
three positive hits decreased from 7.0% to 2.6%. There were no<br />
compounds with more than six hits. The MLL was decreased to<br />
3~ (14,9%)<br />
175 (6.5%)<br />
1271 50 20 23<br />
28 Scale: 10:1<br />
2 4 6 8 10 12 14 16 18 20 22 24<br />
Number <strong>of</strong> compounds regarded as Identical<br />
. . . .<br />
26 20<br />
10@<br />
9O<br />
8O<br />
.7o~<br />
"0@!<br />
.50~<br />
-40_~<br />
- 3 0 ~<br />
Figure 6. Frequency <strong>of</strong> positive identification results <strong>in</strong> the whole <strong>of</strong> the<br />
spectra library (2682 compounds) on the basis <strong>of</strong> the UV spectrum<br />
alone. The comparison <strong>of</strong> every substance with itself is <strong>in</strong>cluded. Thus,<br />
1 compound regarded as identical <strong>in</strong>dicates that the correspond<strong>in</strong>g sub-<br />
stances can be successfully dist<strong>in</strong>guished from every other compound <strong>in</strong><br />
the spectra library, 2 means there is one other compound <strong>in</strong>dist<strong>in</strong>guish-<br />
able, and so on.<br />
2O<br />
1 0<br />
0
Journal <strong>of</strong> Analytical Toxicology, Vol. 27, May/June 2003<br />
1.25, which signified that, on average, every substance was <strong>in</strong>-<br />
dist<strong>in</strong>guishable only from 0.25 others (put differently, out <strong>of</strong><br />
1993 substances only every fourth could have been mistaken for<br />
one other compound).<br />
Example <strong>of</strong> <strong>in</strong>dist<strong>in</strong>guishable compounds<br />
An example <strong>of</strong> a compound found to be <strong>in</strong>dist<strong>in</strong>guishable<br />
from five other substances, even <strong>by</strong> the comb<strong>in</strong>ation <strong>of</strong> IN<br />
spectrum and RRT (LL = 6), is shown <strong>in</strong> Figure 8. All six com-<br />
pounds are esters <strong>of</strong> benzilic acid with a [3- or y-am<strong>in</strong>oalcohol or<br />
a [3- or y-ammoniumalcohol (please note that at the pH <strong>of</strong> the<br />
mobile phase the nitrogen <strong>in</strong> benactyz<strong>in</strong>e and trop<strong>in</strong>e benzilate<br />
will also be protonated, which expla<strong>in</strong>ed the chromatographic<br />
behavior similar to that <strong>of</strong> the other compounds).<br />
In this case, the ambiguity <strong>of</strong> identification arises from high<br />
structural similarity extend<strong>in</strong>g far <strong>in</strong>to the residual part <strong>of</strong> the<br />
molecule, remote from the actual chromophores (2 toluene<br />
chromophores). This need not always be a disadvantage; when<br />
work<strong>in</strong>g with a large spectra library, an essential part <strong>of</strong> the<br />
structure <strong>of</strong> an unknown substance may be deducible from its<br />
!<br />
!1205 (5o.e-,,',)<br />
1678 (54.2%)<br />
k",.\\\N UV spectrum only<br />
UV spectrum + RRT<br />
283 (14.2%)<br />
212 (10.6%) Scale: 10:1<br />
15 19<br />
140 (7.0%) ~ ~ 4 3 7 7 3 2 2 2<br />
52 (2.0%) ~ . ~ n<br />
. . . . . . : , :<br />
104<br />
24<br />
i 9 i 9 l 9 I 9 I 9 ! 9 ! i 9 i 9 i 9 ! 9 i 9 I<br />
0 2 4 6 8 10 12 14 16 18 20 22 24 26<br />
Number <strong>of</strong> compounds regarded as Identical<br />
Figure 7. Frequency <strong>of</strong> positive search results for the 1993 compounds<br />
measured <strong>in</strong> mobile phase A us<strong>in</strong>g UV spectra alone, as well as <strong>in</strong> com-<br />
b<strong>in</strong>ation with RRT (for explanation cf. Figure 6).<br />
, i ,, a ~ a ,,<br />
"i ..........<br />
~ E 1 r ~<br />
m ~ m<br />
M~<br />
III m 1J~OO<br />
Figure 8. Example <strong>of</strong> five compounds that cannot be dist<strong>in</strong>guished from<br />
the reference compound benactyz<strong>in</strong>e <strong>by</strong> the comb<strong>in</strong>ation <strong>of</strong> UV spec-<br />
trum and RRT.<br />
IN spectrum. On the other hand, it should be po<strong>in</strong>ted out,<br />
aga<strong>in</strong>, that there are numerous cases where small structural<br />
changes at some distance from the chromophore lead to dis-<br />
cernible spectra (Figure 3).<br />
It also should not be overlooked that multiple identification<br />
results constitute--<strong>in</strong> numbers--only a m<strong>in</strong>or problem; only<br />
5% <strong>of</strong> the substances can be confused with more than one<br />
other compound (Figure 7). Cases where there are exactly two<br />
candidates for identification (10.6%) should then be resolvable<br />
<strong>by</strong> an <strong>in</strong>dependent confirmation method (or sometimes even <strong>by</strong><br />
chang<strong>in</strong>g the <strong>HPLC</strong> separation system). Also, a repeated analysis<br />
<strong>of</strong> the sample spiked with a sufficient amount <strong>of</strong> the compound<br />
<strong>in</strong> question should reduce the number <strong>of</strong> identification candi-<br />
dates significantly because the <strong>in</strong>traday variance <strong>of</strong> RT (below<br />
1%, see previous) is much lower than on the two-year basis<br />
taken for this work.<br />
Comparison with literature data<br />
In Table I, DP and MLL found <strong>in</strong> the present work are com-<br />
pared with the results <strong>of</strong> other authors. Unfortunately, the<br />
number <strong>of</strong> substances evaluated for DP or MLL <strong>in</strong> the literature<br />
was approximately one order <strong>of</strong> magnitude smaller than <strong>in</strong> the<br />
<strong>HPLC</strong>,-<strong>DAD</strong> library described <strong>in</strong> this paper.<br />
Tak<strong>in</strong>g this <strong>in</strong>to account, <strong>HPLC</strong>-<strong>DAD</strong> was confirmed to be a<br />
highly selective method for substance identification with results<br />
similar to those found for GC-MS <strong>by</strong> Demme et al. (30) or de<br />
Zeeuw et al. (31) for much smaller substance groups. The rather<br />
poor results for <strong>HPLC</strong>-<strong>DAD</strong> <strong>in</strong> comb<strong>in</strong>ation with RT or a re-<br />
tention <strong>in</strong>dex scale published <strong>by</strong> Maier et al. (19) and de Zeeuw<br />
et as. (31) could be expla<strong>in</strong>ed <strong>by</strong> the fact that <strong>in</strong> these papers only<br />
IN maxima seem to have been used for substance identification.<br />
To the knowledge <strong>of</strong> the authors, the present work is the first to<br />
use the whole IN spectrum as a basis for the evaluation <strong>of</strong> the<br />
Table I. DP and MLL Results <strong>of</strong> the Present Investigation<br />
and Comparison with Literature Data<br />
Number <strong>of</strong> Authors,<br />
Method substances DP MLL Remarks reference<br />
<strong>HPLC</strong>-<strong>DAD</strong>, 2682 0.9994 2.701 Complete This<br />
UV spectra library paper<br />
<strong>HPLC</strong>-<strong>DAD</strong>, 1993 0.9999 1.253 Mobile This<br />
UV spectra + RRT phase A paper<br />
<strong>HPLC</strong>-<strong>DAD</strong>, 689 0.9998 1.118 Mobile This<br />
UV spectra + RRT phase B paper<br />
GC-MS (ion trap) 244 0.9997 1.073 Demme<br />
et al. (30)<br />
<strong>HPLC</strong>-<strong>DAD</strong>, 372 0.9930 5.390 Maier<br />
UV maxima + et al. (19)<br />
retention <strong>in</strong>dex<br />
<strong>HPLC</strong>-<strong>DAD</strong>, 99 0.9743 3.520 de Zeeuw<br />
UV maxima + RT et al. (31)<br />
GC-MS 99 0.9990 1.100 de Zeeuw<br />
et ai. (3 I)<br />
239
selectivity <strong>of</strong> <strong>HPLC</strong>-<strong>DAD</strong>. It is also the first to use a substance<br />
collective as large as 2682 compounds for the evaluation <strong>of</strong><br />
method selectivity.<br />
Application to real cases<br />
The results presented previously are based on the analysis <strong>of</strong><br />
pure substance solutions. However, the spectra measured <strong>in</strong> real<br />
cases could be altered <strong>by</strong> noise at low concentrations, as well as<br />
<strong>by</strong> overlapp<strong>in</strong>g with <strong>in</strong>sufficiently separated peaks or with peaks<br />
<strong>of</strong> matrix constituents. Furthermore, the <strong>HPLC</strong>-<strong>DAD</strong> mea-<br />
surement is only one step <strong>of</strong> the STA, and it is another <strong>in</strong>dis-<br />
pensable prerequisite that the substance can be obta<strong>in</strong>ed <strong>in</strong> a<br />
measurable state <strong>by</strong> an adequate sample preparation.<br />
The authors have been us<strong>in</strong>g <strong>HPLC</strong>-<strong>DAD</strong> <strong>in</strong> comb<strong>in</strong>ation<br />
with the steadily grow<strong>in</strong>g spectra library as the ma<strong>in</strong> method for<br />
general unknown analysis <strong>in</strong> about 350 forensic and 500 cl<strong>in</strong>ical<br />
cases per year s<strong>in</strong>ce 1992. Immunoassays for drugs <strong>of</strong> abuse and<br />
headspace GC for alcohol and volatile substances were also reg-<br />
ularly used, and GC-MS was available for supplementary and<br />
confirmatory analyses. The sample preparation rout<strong>in</strong>ely used<br />
for <strong>HPLC</strong>-<strong>DAD</strong> and data about the extractability and detection<br />
limits under these conditions for drugs frequently occurr<strong>in</strong>g <strong>in</strong><br />
<strong>in</strong>toxications, as well as examples <strong>of</strong> application were previ-<br />
ously published <strong>in</strong> detail (3,25). Briefly, <strong>in</strong> a rout<strong>in</strong>e case, from<br />
each 0.5 mL whole blood or serum, an acidic and basic extract<br />
(pH 2 and 9, respectively) <strong>in</strong> dichloromethane were prepared,<br />
and from a further aliquot <strong>of</strong> the whole blood or serum sample<br />
the prote<strong>in</strong> was precipitated with acetonitrile (1:1). The basic ex-<br />
tract and the supernatant <strong>of</strong> the prote<strong>in</strong> precipitation were an-<br />
alyzed <strong>in</strong> mobile phase A and the acidic extract <strong>in</strong> mobile phase<br />
B parallel on three <strong>HPLC</strong>-<strong>DAD</strong> <strong>in</strong>struments. In special cases,<br />
other liquid-liquid or solid-phase extraction conditions were ap-<br />
plied or the <strong>HPLC</strong> conditions were changed.<br />
With respect to the quality <strong>of</strong> the spectra obta<strong>in</strong>ed from the<br />
extracts, there was no difference to those from the pure sub-<br />
stances down to sample concentrations <strong>of</strong> 0.1 I~g/mL, and the<br />
problem <strong>of</strong> <strong>in</strong>terference <strong>by</strong> badly resolved peaks or matrix con-<br />
stituents was, <strong>in</strong> most cases, not severe. As a more complicated<br />
240<br />
I0,<br />
;0.<br />
!0.<br />
O.<br />
Trmce at 225 nm 4<br />
, i<br />
2<br />
2 3<br />
5<br />
poak cor~entTatlon ~JO/mL) SI<br />
1 caffeln8 0.27 0.9912<br />
2 zoplclone 1.38 0.9961<br />
3 delethylflurazepam 0.45 0.0908<br />
4 z01pldem 1.28 0.0999<br />
5 3-hydroxyflurazeplrn 0,20 0.9996<br />
6 nltrszepam 0.10 0.0996<br />
7 (2-hydroxyethyl)flurazepam 0.05 0.9995<br />
8 nor~lurazepam 0+13 0.9997<br />
9 dllLZep|nl @04 0.9977<br />
-- |peclTum pe*k 4<br />
.... zo~d*m IIb~ry<br />
-- .... sp41clTum ( h yl:lm x!mth polk yl)flu 7 mmpa m 1<br />
......... ~=., . . . . . . .<br />
4 6 8 10 1 1 16 18 20 200 245 290 335 380<br />
T~rne (rn<strong>in</strong>) k (nm)<br />
Figure 9. <strong>HPLC</strong>-<strong>DAD</strong> analysis <strong>of</strong> a multidrug <strong>in</strong>toxication. The sample was collected approxi-<br />
mately 24 h after <strong>in</strong>take. The chromatogram was obta<strong>in</strong>ed from the CH2Cl 2 extract <strong>of</strong> 0.5 mL<br />
whole blood at pH 9. By library search, zopiclone, zolpidem, nitrazepam, diazepam, and four<br />
flurazepam metabolites were identified. Flurazepam (RT marked <strong>by</strong> the arrow, tl/2 = 1-3 h) could<br />
not be identified unambiguously from the very small peak (< 0.01 pg/mL).<br />
Journal <strong>of</strong> Analytical Toxicology, Vol. 27, May/June 2003<br />
example, <strong>in</strong> Figure 9 the chromatogram <strong>of</strong> the basic CH2C12 ex-<br />
tract <strong>of</strong> an emergency case blood sample is shown. The 45-<br />
year-old man had taken <strong>in</strong> a drug mixture, presumably 24 h<br />
before admission to the hospital. The immunoassays <strong>of</strong> ur<strong>in</strong>e for<br />
the usual drugs <strong>of</strong> abuse were only positive for benzodiazep<strong>in</strong>es;<br />
blood alcohol was 0.0 mg/g. Of the approximately 20 peaks <strong>of</strong><br />
the chromatogram, 9 were identified <strong>by</strong> library search (UV spec-<br />
trum + RRT) as first hits with SIr 0.999 for 6 peaks and be-<br />
tween 0.991 and 0.998 for the other 3 peaks. Deviations <strong>of</strong> the<br />
actual RRT from the library data were found <strong>in</strong> the range <strong>of</strong><br />
0-1.8%. A multidrug <strong>in</strong>toxication <strong>by</strong> diazepam, flurazepam,<br />
nitrazepam, zolpidem, and zopiclone resulted. Approximate<br />
concentrations were calculated from the peak areas <strong>in</strong> the chro-<br />
matogram and <strong>in</strong>dependently measured specific peak areas and<br />
extraction yields <strong>of</strong> the drugs or metabolites. Flurazepam itself<br />
(RT marked <strong>by</strong> an arrow <strong>in</strong> Figure 9, half-life 1-3 h) was not un-<br />
ambiguously detected after the long survival time, but four <strong>of</strong><br />
its active metabolites were clearly identified. In order to illus-<br />
trate different degrees <strong>of</strong> spectral identity at different concen-<br />
trations, the spectra <strong>of</strong> zolpidem (peak 4, 1.38 mg/mL) and<br />
2-hydroxyethylflurazepam (peak 7, = 0.05 pg/mL) were overlaid<br />
with the correspond<strong>in</strong>g library spectra <strong>in</strong> the right part <strong>of</strong><br />
Figure 9. It is seen that there is a complete agreement for<br />
zolpidem, and that despite the noise at this low concentration,<br />
the spectrum <strong>of</strong> the flurazepam metabolite still agrees very<br />
well with the library spectrum. For the rema<strong>in</strong><strong>in</strong>g peaks, no sat-<br />
isfactory search results were obta<strong>in</strong>ed. 'I~o <strong>of</strong> these peaks (RT<br />
= 5.3 and 6.0 ra<strong>in</strong>) had typical benzodiazep<strong>in</strong>e spectra and<br />
could orig<strong>in</strong>ate from further flurazepam metabolites. For the<br />
other peaks no suitable spectra could be extracted because <strong>of</strong><br />
overlapp<strong>in</strong>g or the absorbance be<strong>in</strong>g too small. In the present<br />
case, this was not pursued any further because these peaks rep-<br />
resented only small concentrations and the symptoms <strong>of</strong> the pa-<br />
tient were sufficiently expla<strong>in</strong>ed <strong>by</strong> the results already obta<strong>in</strong>ed.<br />
In other cases the extraction <strong>of</strong> a higher sample amount (2 <strong>in</strong>-<br />
stead <strong>of</strong> 0.5 mL whole blood, if available), the use <strong>of</strong> more se-<br />
lective extraction conditions (e.g., 1-chlorobutane <strong>in</strong>stead <strong>of</strong><br />
dichloromethane for benzodiazep<strong>in</strong>es), and the improvement <strong>of</strong><br />
the <strong>HPLC</strong> separation <strong>by</strong> switch<strong>in</strong>g to a weaker<br />
mobile phase (with a greater buffer content)<br />
would have been applied <strong>in</strong> order to improve<br />
peak identification.<br />
From the acidic CH2CI2 extract, no additional<br />
<strong>in</strong>formation was ga<strong>in</strong>ed. Also, <strong>by</strong> <strong>in</strong>vestigation<br />
<strong>of</strong> the supernatant <strong>of</strong> the prote<strong>in</strong> precipitation,<br />
many hydrophilic substances with low extrac-<br />
tion yields <strong>in</strong> CH~CI2 (e.g., paracetamol or sal-<br />
icylic acid) could be excluded.<br />
Generally, a complicated analytical task such<br />
as the toxicological general unknown analysis<br />
I cannot always be solved <strong>by</strong> schematic application<br />
<strong>of</strong> a fixed procedure, but needs the availability <strong>of</strong><br />
alternative methods and a flexible choice or<br />
change <strong>of</strong> the conditions for sample prepara-<br />
tion, chromatographic separation, and spectro-<br />
metric detection <strong>by</strong> an experienced analyst.
Journal <strong>of</strong> Analytical Toxicology, Vol. 27, May/June 2003<br />
Conclusions<br />
In this evaluation <strong>of</strong> an extensive library <strong>of</strong> UV spectra and<br />
RRTs, the role <strong>of</strong> <strong>HPLC</strong>-<strong>DAD</strong> as one <strong>of</strong> the methods best suited<br />
for substance identification <strong>in</strong> the flame <strong>of</strong> systematic toxico-<br />
logical analysis was confirmed. More than 90% <strong>of</strong> the toxico-<br />
logically relevant substances under exam<strong>in</strong>ation showed a<br />
significant UV absorption <strong>in</strong> the <strong>in</strong>vestigated wavelength range.<br />
The great structural diversity <strong>of</strong> a substance collective that<br />
conta<strong>in</strong>ed compounds from all important fields <strong>of</strong> toxicological<br />
relevance <strong>in</strong> comb<strong>in</strong>ation with the excellent performance <strong>of</strong><br />
modem <strong>DAD</strong>s (<strong>in</strong> terms <strong>of</strong> resolution, accuracy, repeatability,<br />
and reproducibility) were found to provide a high degree <strong>of</strong><br />
method selectivity. Although literature data for a substance<br />
pool <strong>of</strong> similar magnitude was not available, DP and MLL values<br />
found for <strong>HPLC</strong>-<strong>DAD</strong> were comparable to those <strong>of</strong> compet<strong>in</strong>g<br />
GC-MS methods.<br />
The results <strong>of</strong> this <strong>in</strong>vestigation suggest that <strong>HPLC</strong>-<strong>DAD</strong> <strong>in</strong><br />
comb<strong>in</strong>ation with a suitable spectra library will cont<strong>in</strong>ue to<br />
make <strong>in</strong>dispensable contributions to the field <strong>of</strong> toxicological<br />
screen<strong>in</strong>g and systematic toxicological analysis. The advantages<br />
<strong>of</strong> an <strong>HPLC</strong> method such as a comparatively simple sample<br />
preparation (e.g., without the need for a derivatization re-<br />
quired), cost-effectiveness, and ruggedness are comb<strong>in</strong>ed with<br />
a highly selective detector. The onl<strong>in</strong>e coupl<strong>in</strong>g <strong>of</strong> a <strong>DAD</strong> with<br />
a modem LC-MS system, which enhances selectivity <strong>by</strong> the use<br />
<strong>of</strong> two <strong>in</strong>dependent detection modes, is seen as a particularly<br />
promis<strong>in</strong>g prospect for the future.<br />
Acknowledgments<br />
The authors thank Mrs. S. Menzel, Mrs. K. Malzacher, and Mr.<br />
M. Witteweg for their thorough assistance <strong>in</strong> the measurement<br />
<strong>of</strong> the <strong>HPLC</strong>-<strong>DAD</strong> library. Furthermore, they thank Dr. B.-T.<br />
Erxleben (Shimadzu Europe GmbH, Duisburg, Germany), Mrs.<br />
A. Herrndobler (Bio-Tek Instruments, Neufahrn, Germany),<br />
and Mrs. A. Kohn (Agilent Technologies, Waldbronn, Germany)<br />
for helpful discussions and technical support. They are also<br />
grateful to Dr. M. Rothe (Lung and Thorax Diagnostics GmbH,<br />
Berl<strong>in</strong>, Germany) for measur<strong>in</strong>g all UV spectra with the <strong>DAD</strong><br />
HP 1090 and Dr. W. Wlodarczyk (Department <strong>of</strong> Radiotherapy,<br />
University Hospital CharitY, Berl<strong>in</strong>, Germany) for provid<strong>in</strong>g a<br />
MatLab workplace.<br />
References<br />
1. R.A. de Zeeuw. Drug screen<strong>in</strong>g <strong>in</strong> biological fluids. The need for<br />
a systematic approach. J. Chromatogr. B: Biomed. Sci. AppL 689:<br />
71-79 (1997).<br />
2. A. Polett<strong>in</strong>i. Systematic toxicological analysis <strong>of</strong> drugs and poisons<br />
<strong>in</strong> biosamples <strong>by</strong> hyphenated chromatographic and spectroscopic<br />
techniques. J. Chromatogr. B: Biomed. 5ci. AppL 733:4763 (1999).<br />
3. F. Pragst, H.H. Maurer, J. Hallbach, U. Staerk, W.R. KCilpmann,<br />
E Degel, and H.J. Gibitz. Suchveffahren (General unknown). In<br />
Kl<strong>in</strong>isch-toxikologische Analytik, VeHahren und Interpretation,<br />
W.R. Kiflpmann, Ed. Wiley-VCH, We<strong>in</strong>heim, Germany, 2002, pp<br />
49-95.<br />
4. K. Pfleger, H.H. Maurer, and A. Weber. Mass Spectral and GC Data<br />
<strong>of</strong> Drugs, Poisons, Pesticides, Pollutants and Their Metabolites, 2nd<br />
ed., 1992-2000. Wiley-VCH, We<strong>in</strong>heim, Germany, 2000.<br />
5. B. Aebi and W. Bernhard. Advances <strong>in</strong> the use <strong>of</strong> mass spectral li-<br />
braries for forensic toxicology. J. Anal. Toxicol. 26:149-156<br />
(2002).<br />
6. A. Polelt<strong>in</strong>i, A. Groppi, C. Vignali, and M. Montagna. Fully-auto-<br />
mated systematic toxicological analysis <strong>of</strong> drugs, poisons, and<br />
metabolites <strong>in</strong> whole blood, ur<strong>in</strong>e, and plasma <strong>by</strong> gas chro-<br />
matography-full scan mass spectrometry. J. Chromatogr. B: Biomed.<br />
Sci. Appl. 713:265-279 (1998).<br />
7. P. Marquet. Is LC-MS suitable for a comprehensive screen<strong>in</strong>g <strong>of</strong><br />
drugs and poisons <strong>in</strong> cl<strong>in</strong>ical toxicology? Ther. Drug Monit. 24:<br />
125-I 33 (2002).<br />
8. W. We<strong>in</strong>mann, A. Wiedemann, B. Epp<strong>in</strong>ger, M. Renz, and M.<br />
Svoboda. Screen<strong>in</strong>g for drugs <strong>in</strong> serum <strong>by</strong> electrospray ioniza-<br />
tion/collision-<strong>in</strong>duced dissociation and library search<strong>in</strong>g. ]. Am.<br />
Soc. Mass Spec. 10:1028-1037 (1999).<br />
9. H.H. Maurer. Liquid chromatography-mass spectrometry <strong>in</strong><br />
forensic and cl<strong>in</strong>ical toxicology. J. Chromatogr. B: Biomecl. Sci.<br />
AppI. 713:3-25 (I 998).<br />
I 0. M. Rittner, F. Pragst, W.R. Bork, and J. Neumann. Screen<strong>in</strong>g method<br />
for seventy psychoactive drugs or drug metabolites <strong>in</strong> serum based<br />
on high-performance liquid chromatography-electrospray ioniza-<br />
tion mass spectrometry. J. Anal. Toxicol. 25:115-I 24 (2001).<br />
11. M. Bogusz and M. Wu. Standardized <strong>HPLC</strong>I<strong>DAD</strong> system, based on<br />
retention <strong>in</strong>dices and spectral library, applicable for systematic<br />
toxicological screen<strong>in</strong>g. J. Anal. Toxicol. 15:188-197 (1991).<br />
12. M. Bogusz and M. Erkens. Reversed-phase high-performance liquid<br />
chromatographic database <strong>of</strong> retention <strong>in</strong>dices and UV spectra <strong>of</strong><br />
toxicologically relevant substances and its <strong>in</strong>terlaboratory use.<br />
J. Chromatogr. A 674: 97-I 26 (I 994).<br />
13. S.P. Elliott and K.A. Hale. Applications <strong>of</strong> an <strong>HPLC</strong>-<strong>DAD</strong> drug-<br />
screen<strong>in</strong>g system based on retention <strong>in</strong>dices and UV spectra.<br />
J. Anal. Toxicol. 22:279-289 (1998).<br />
14. Y. Gaillard and G. P(~p<strong>in</strong>. Use <strong>of</strong> high-performance liquid chro-<br />
matography with photodiode-array UV detection for the creation<br />
<strong>of</strong> a 600-compound library. Application to forensic toxicology.<br />
J. Chromatogr. A 763:149-I 63 (I 997).<br />
15. E.M. Koves. Use <strong>of</strong> high-performance liquid chromatography-<br />
diode array detection <strong>in</strong> forensic toxicology. ]. Chromatogr. A 692:<br />
103-I 19 (I 995).<br />
16. C.-K. Lai, T. Lee, K.-M. Au, and A.Y.W. Chan. Uniform solid-phase<br />
extraction procedure for toxicological drug screen<strong>in</strong>g <strong>in</strong> serum<br />
and ur<strong>in</strong>e <strong>by</strong> <strong>HPLC</strong> with photodiode-array detection. Cl<strong>in</strong>. Chem.<br />
43:312-325 (1997).<br />
17. W.E. Lambert, E. Meyer, Y. Xue-P<strong>in</strong>g, and A.P. De Leenheer.<br />
Screen<strong>in</strong>g, identification, and quantitation <strong>of</strong> benzodiazep<strong>in</strong>es <strong>in</strong><br />
postmortem samples <strong>by</strong> <strong>HPLC</strong> with photodiode array detection.<br />
J. Anal. Toxicol. 19:35-40 (I 995).<br />
18. B.K. Logan, D.T. Stafford, I.R. Tebbett, and C.M. Moore. Rapid<br />
screen<strong>in</strong>g for I00 basic drugs and metabolites <strong>in</strong> ur<strong>in</strong>e us<strong>in</strong>g cation<br />
exchange solid-phase extraction and high-performance liquid<br />
chromatography with diode array detection. ]. Anal. Toxicol. 14:<br />
154-159 (1990).<br />
19. R.D. Maier and M. Bogusz. <strong>Identification</strong> power <strong>of</strong> a standardized<br />
<strong>HPLC</strong>-<strong>DAD</strong> system for systematic toxicological analysis. J. Anal<br />
Toxicol. 19:79-83 (1995).<br />
20. A. Tracqui, P. K<strong>in</strong>tz, and P. Mang<strong>in</strong>. Systematic toxicological anal-<br />
ysis us<strong>in</strong>g <strong>HPLC</strong>/<strong>DAD</strong>. J. Forensic Sci. 40:254-262 (I 995).<br />
21. A. Turcant, A. Premel-Cabic, A. Cailleux, and P. Alla<strong>in</strong>. Toxico-<br />
logical screen<strong>in</strong>g <strong>of</strong> drugs <strong>by</strong> microbore high-performance liquid<br />
chromatography with photodiode-array detection and ultraviolet<br />
spectral library searches. Cl<strong>in</strong>. Chem. 37:1210--1215 (I 991 ).<br />
22. D.W. Hill and A.J. K<strong>in</strong>d. Reversed-phase solvent-gradient <strong>HPLC</strong> re-<br />
tention <strong>in</strong>dexes <strong>of</strong> drugs. J. Anal. Toxicol. 18:233-242 (1994).<br />
23. E Pragst, M. Herzler, S. Herre, B.-T. Erxleben, and M. Rothe. UV<br />
Spectra <strong>of</strong> Toxic Compounds. Verlag Dr. Dieter Helm, Heppen-<br />
heim, Germany, 2001.<br />
24. M. Herzler, F. Pragst, S. Herre, and M. Rothe. <strong>Selectivity</strong> <strong>of</strong> pho-<br />
241
todiode array UV spectra for substance identification <strong>in</strong> systematic<br />
toxicological analysis. In Proceed<strong>in</strong>gs <strong>of</strong> the 37th TIAFT Triennial<br />
Meet<strong>in</strong>g, T. Lech, Ed. Institute <strong>of</strong> Forensic Research Publishers,<br />
Krak6w, Poland, 2000, pp 122-I 29.<br />
25. F. Pragst, M. Herzler, and S. Herre. Use <strong>of</strong> high performance liquid<br />
chromatography with photodiode array detection (<strong>HPLC</strong>-<strong>DAD</strong>)<br />
<strong>in</strong> cl<strong>in</strong>ical toxicology. Kl<strong>in</strong>. Biochem. Metab. 1:13-I 6 (2000).<br />
26. A.C. M<strong>of</strong>fat, K.W. Smalldon, and C. Brown. Optimum use <strong>of</strong><br />
paper, th<strong>in</strong>-layer and gas-liquid chromatography for the identifi-<br />
cation <strong>of</strong> basic drugs I. Determ<strong>in</strong>ation <strong>of</strong> effectiveness for a series<br />
<strong>of</strong> chromatographic systems. J. Chromatogr. 90:I-7 (I 974).<br />
27. P.G. Schepers, J.P. Franke, and R.A. de Zeeuw. System evaluation<br />
and substance identification <strong>in</strong> systematic toxicological analysis <strong>by</strong><br />
the mean list length approach. J. Anal. Toxicol. 7:272-278 (I 983).<br />
28. M. Herzler. UntersuchungenzurSelektivit~tder<strong>HPLC</strong>-<strong>DAD</strong> <strong>in</strong> der<br />
Systematischen Toxikologischen Analyse. Dissertation for the Post-<br />
242<br />
Journal <strong>of</strong> Analytical Toxicology, Vol. 27, May/June 2003<br />
graduate Study Course <strong>in</strong> Toxicology. University <strong>of</strong> Leipzig, Leipzig,<br />
Germany, 2001.<br />
29. L. Huber and S.A. George, Eds. Diode Array Detection <strong>in</strong> <strong>HPLC</strong>.<br />
Marcel Dekker, Inc., New York, NY, 1993.<br />
30. U. Demme, B. Ahrens, A. Kle<strong>in</strong>, and R. Werner. Discrim<strong>in</strong>at<strong>in</strong>g<br />
power nearly one--ion-trap GC-MS as an ideal tool for STA. In:<br />
Proceed<strong>in</strong>gs <strong>of</strong> the 38th Meet<strong>in</strong>g <strong>of</strong> TIAFT, I. Rasanen, Ed. Tall<strong>in</strong>a<br />
Raamatutri.ikikoja O0, Hels<strong>in</strong>ki, F<strong>in</strong>land, 2001, 19-26.<br />
31. R.A. de Zeeuw, J. Hartstra, and J.P. Franke. Potential and pitfalls <strong>of</strong><br />
chromatographic techniques and detection modes <strong>in</strong> substance<br />
identification for systematic toxicological analysis. J. Chromatogr.<br />
A 674:3-13 (1994).<br />
Manuscript received March 18, 2002;<br />
revision received August 7, 2002.