Create successful ePaper yourself
Turn your PDF publications into a flip-book with our unique Google optimized e-Paper software.
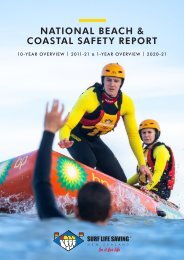
NATIONAL BEACH &<br />
COASTAL SAFETY REPORT<br />
<strong>10</strong>-YEAR OVERVIEW | <strong>20</strong><strong>10</strong>-<strong>20</strong> & 1-YEAR OVERVIEW | <strong>20</strong>19-<strong>20</strong>
KEY FINDINGS<br />
KEY FINDINGS<br />
<strong>10</strong>-YEAR OVERVIEW | <strong>20</strong><strong>10</strong>-<strong>20</strong><br />
<strong>10</strong> YEAR OVERVIEW | <strong>20</strong><strong>10</strong>-<strong>20</strong><br />
1<br />
Fatal Drownings in New Zealand<br />
Have INCREASED.<br />
2<br />
Our Fatal Drownings are 48%<br />
HIGHER Than Australia’s.<br />
18%<br />
48%<br />
There has been an 18% increase in the number of<br />
beach and coastal fatal drownings over the last five<br />
years, when compared to the previous five years.<br />
New Zealand has a 48% higher beach and<br />
coastal fatal drowning rate per capita (per.<br />
<strong>10</strong>0,000 pop.) than Australia.<br />
5<br />
Pasifika had the HIGHEST Fatal<br />
Drowning Rate Over the Last<br />
<strong>10</strong> years.<br />
6<br />
45% of Fatal Drownings<br />
Occured in SUMMER.<br />
1.5<br />
1.2<br />
0.9<br />
0.6<br />
0.3<br />
0.0<br />
All Others Maori Pacific Peoples<br />
Over the last ten years Pacific Peoples had the<br />
highest fatal drowning rate (1.31 per <strong>10</strong>0,000<br />
pop.) of any ethnicity, closely followed by Maori<br />
(1.13 per <strong>10</strong>0,000 pop.).<br />
Over the last ten years, 45% (n=172) of beach<br />
and coastal drowning fatalities occurred during<br />
the summer months of December, January and<br />
February. This figure represents nearly half of<br />
the total annual fatal drownings recorded,<br />
highlighting the increased risk associated with<br />
the busy summer season.<br />
9<br />
Surf <strong>Beach</strong>es Pose the GREATEST<br />
Risk for <strong>Beach</strong> and <strong>Coastal</strong> Fatal<br />
Drowning in New Zealand.<br />
38%<br />
Over the last ten years, 38% of beach and<br />
coastal fatal drownings occurred at a surf<br />
beach in New Zealand.
We call on those who have the authority, the legal or the moral responsibility,<br />
to work with us and our drowning prevention partners to stop the death toll from<br />
getting worse, and to reduce it to a level where we can be proud as an island nation<br />
to say ‘we have no preventable drownings on our beach and coastal areas’.<br />
3<br />
Last <strong>Year</strong> 22% of <strong>Beach</strong> and<br />
<strong>Coastal</strong> Fatal Drownings Occurred<br />
While SWIMMING/WADING.<br />
22%<br />
4<br />
Males are Fatally Drowning<br />
MORE Than Females.<br />
87%<br />
MALE<br />
13%<br />
FEMALE<br />
This figure represents nearly one quarter of the total<br />
number of drowning fatalities, highlighting the risk<br />
associated with swimming/wading.<br />
Of those who died from drowning over the last ten<br />
years, males represent 87% and females only 13%.<br />
Men are fatally drowning more on our beaches and<br />
coastlines than females.<br />
7<br />
Northland has New Zealand’s<br />
HIGHEST Fatal Drowning Rate<br />
3.04<br />
8<br />
Adults are Fatally Drowning<br />
MORE Than Children and Young<br />
Adolescents.<br />
Between <strong>20</strong><strong>10</strong>-<strong>20</strong>, Northland had the greatest<br />
average fatal drowning rate per capita (3.04 per<br />
<strong>10</strong>0,000 pop.). Auckland (with a much larger<br />
population), has a fatal drowning rate of only<br />
0.64. Therefore, the risk of drowning on the beach<br />
and coastline of Northland is nearly five times<br />
greater than Auckland.<br />
Adults over the age of 15 account for 95% of all<br />
drowning fatalities in the beach and coastal<br />
environment. The 35-44 and 65+ age groups have<br />
the greatest number of fatal drownings.<br />
<strong>10</strong><br />
Over the Last <strong>10</strong> <strong>Year</strong>s, the<br />
GREATEST RISK Activities on a<br />
<strong>Beach</strong> and <strong>Coastal</strong> Environment<br />
Have Been:<br />
However...<br />
Last <strong>Year</strong>, the GREATEST RISK<br />
Activities Were:<br />
Swimming/Wading<br />
Boating<br />
Falls (trips/slips)<br />
Swimming/Wading<br />
Boating<br />
Snorkelling
DROWNING SNAPSHOT<br />
<strong>10</strong>-YEAR OVERVIEW | <strong>20</strong><strong>10</strong>-<strong>20</strong><br />
360 87%<br />
MALE<br />
BEACH &<br />
COASTAL FATAL<br />
DROWNINGS<br />
13%<br />
FEMALE<br />
LOCATION<br />
38%<br />
SURF BEACH<br />
14%<br />
HARBOUR<br />
17%<br />
0-1KM<br />
OFFSHORE<br />
ACTIVITY<br />
22%<br />
SWIMMING/WADING<br />
17%<br />
BOATING<br />
17%<br />
FALLS
CONTENTS<br />
Synopsis 04<br />
Key Findings 05<br />
SECTION FIVE:<br />
REGIONAL OVERVIEWS<br />
35<br />
SECTION ONE:<br />
07<br />
CAPABILITY<br />
Capability 08<br />
Surf Life Saving Patrol<br />
Locations <strong>10</strong><br />
Surf Lifeguard Capability 11<br />
Rescues Per Region 12<br />
Assists Per Region 13<br />
Major First Aid Incidents 14<br />
Minor First Aid Incidents 15<br />
Searches Per Region 16<br />
Preventative Actions 17<br />
SECTION T WO:<br />
FATAL DROWNING<br />
ANALYSIS - <strong>20</strong><strong>10</strong>/<strong>20</strong><br />
19<br />
<strong>10</strong> <strong>Year</strong> <strong>National</strong> <strong>Overview</strong> <strong>20</strong><br />
SECTION THREE:<br />
FATAL DROWNING<br />
ANALYSIS - <strong>20</strong>19/<strong>20</strong><br />
1 <strong>Year</strong> <strong>National</strong> <strong>Overview</strong> 28<br />
SECTION FOUR:<br />
NON-FATAL<br />
DROWNING<br />
27<br />
31<br />
Non-Fatal Drownings <strong>Overview</strong> 32<br />
Comparison of Fatal and<br />
Non-Fatal Drownings on <strong>Beach</strong>es 33<br />
Northland 36<br />
Auckland 38<br />
Waikato 40<br />
Bay of Plenty 42<br />
Gisborne 44<br />
Hawke's Bay 46<br />
Taranaki 48<br />
Manawatu-Wanganui 50<br />
Wellington 52<br />
Tasman 54<br />
Marlborough 56<br />
West Coast 58<br />
Canterbury 60<br />
Otago 62<br />
Southland 64<br />
SECTION SIX:<br />
<strong>10</strong> YEAR ACTIVITY<br />
OVERVIEW <strong>20</strong><strong>10</strong>/<strong>20</strong><br />
67<br />
Snapshot: Swimming/Wading 68<br />
Snapshot: Boating 69<br />
Snapshot: Falls 70<br />
Snapshot: Snorkelling 71<br />
Snapshot: Watercraft 72<br />
Snapshot: Land Based Fishing 73<br />
Key Terms 74<br />
References 76
SYNOPSIS<br />
In the last five years, there has been an 18%<br />
increase in the number of <strong>Beach</strong> and <strong>Coastal</strong> Fatal<br />
Drownings compared to the previous five years.<br />
Each one leaves families and communities devastated. Our<br />
drowning toll is something every New Zealander should see<br />
as a national tragedy and one we all have a responsibility<br />
to address, but the real tragedy is that the majority of these<br />
are preventable.<br />
Drowning is not just tragic for those involved, but each<br />
drowning has a considerable economic impact too. The<br />
social cost to New Zealand of one water drowning fatality<br />
has been estimated at $3.948 million and this can be<br />
expected to be higher for children under 5 years-old who<br />
live longer. The social cost to New Zealand of one waterrelated<br />
serious injury resulting in hospitalisation is estimated<br />
as $394,800 (ACC, <strong>20</strong>16).<br />
Each year, more than three million people visit beaches<br />
and 1.5 million go boating (Water <strong>Safety</strong> New Zealand,<br />
<strong>20</strong>15). These people are exposed to a risk of drowning,<br />
which Surf Life Saving New Zealand (<strong>SLSNZ</strong>) is committed<br />
to reducing. <strong>SLSNZ</strong> is the leading beach and coastal safety,<br />
drowning prevention and rescue authority in New Zealand.<br />
The purpose of the organisation is to enable everyone to<br />
enjoy New Zealand’s beaches safely, with a vision of zero<br />
preventable drownings.<br />
The New Zealand coastline varies dramatically. The west<br />
coast is exposed to the energetic Tasman Sea whereas the<br />
east coast faces the South Pacific Ocean, which at times<br />
can be just as dangerous. The coastline of New Zealand<br />
is approximately 15,000km in length, the ninth longest<br />
coastline of any nation in the world. New Zealand beaches<br />
and coastal areas are known to be some of the most<br />
beautiful. However, our nation has a shocking annual beach<br />
and coastal drowning toll.<br />
During the last ten years, there has been an average<br />
of 36 beach and coastal fatal drownings per year. When<br />
comparing the first half of the decade (<strong>20</strong><strong>10</strong>-<strong>20</strong>15) to the<br />
later (<strong>20</strong>15-<strong>20</strong><strong>20</strong>), there has been an 18% increase from 33<br />
fatal drownings on average per year to 39.<br />
Even allowing for population growth, there has been a 12%<br />
increase in the five-year average beach and coastal fatal<br />
drowning rate over the last five years (0.83 per <strong>10</strong>0,000<br />
pop.), when compared to the previous five years (0.74 per<br />
<strong>10</strong>0,000 pop.).<br />
The New Zealand <strong>20</strong>19-<strong>20</strong> fatal drowning rate is 0.85 per<br />
<strong>10</strong>0,000 pop., which is above the ten-year average (0.78<br />
per <strong>10</strong>0,000 pop.). The New Zealand ten-year average<br />
beach and coastal fatal drowning rate is 48% greater than<br />
the Australian ten-year average (0.48 per <strong>10</strong>0,000 pop.).<br />
Despite some drowning trends in New Zealand being on<br />
the decline (Water <strong>Safety</strong> New Zealand, <strong>20</strong><strong>20</strong>), beach and<br />
coastal drownings are on the increase. In order to help<br />
understand the problem in more detail, <strong>SLSNZ</strong> produces<br />
this report on an annual basis, documenting incidents that<br />
have occurred within the coastal zone. The coastal zone<br />
is defined as “Tidal waters (estuary, harbour, marina and<br />
river/harbour bar); ocean up to 1km offshore; or inland up<br />
to five times the width of the inlet/river”.<br />
This report is designed to complement the <strong>National</strong><br />
Drowning <strong>Report</strong> produced by Water <strong>Safety</strong> New Zealand<br />
and to contribute to the New Zealand Water <strong>Safety</strong> Sector<br />
Strategy. The report provides an analysis of fatal and nonfatal<br />
drownings and rescues where a fatal or non-fatal<br />
drowning has been averted. It compares data from July<br />
<strong>20</strong>19 – June <strong>20</strong><strong>20</strong> with the ten-year average from July <strong>20</strong><strong>10</strong><br />
- June <strong>20</strong><strong>20</strong>. It also provides both a national and regional<br />
overview with a breakdown of who is drowning, where they<br />
are drowning and what they are doing when they drown.<br />
The report in itself does not provide answers, it simply<br />
provides the data in a way that highlights the problem and<br />
will aid further analysis to help provide potential solutions.<br />
<strong>SLSNZ</strong> will continue to undertake a comprehensive <strong>Coastal</strong><br />
Risk Assessment process using information gained from<br />
more in-depth studies of each fatal and non-fatal drowning<br />
as well as rescues. Using this information, <strong>SLSNZ</strong> is<br />
asking Central and Local Government, key landowners<br />
and stakeholders to clarify the responsibility for beach<br />
and coastal safety and then, using an evidence-based,<br />
collaborative and partnership approach, provide targeted<br />
safety interventions at local, regional and national levels<br />
that lead towards a safer future for all those that visit and<br />
recreate on beaches along New Zealand’s coastline.<br />
Road, fire and boating safety have had<br />
significant investment in public education<br />
strategies and campaigns, which has not only<br />
dramatically reduced deaths and injuries but<br />
also raised awareness of the issues. It's now<br />
time to do the same for beach and coastal<br />
safety.<br />
This report is our way of drawing a line in the sand.<br />
We, Surf Life Saving New Zealand, are saying “enough is<br />
enough”. We are calling for greater investment in a long<br />
term, evidence based beach and coastal safety education<br />
strategy.<br />
SURF LIFE SAVING NEW ZEALAND<br />
04<br />
NATIONAL BEACH & COASTAL SAFETY REPORT
KEY FINDINGS<br />
• <strong>Beach</strong> and coastal fatal drownings are increasing. There<br />
has been an 18% increase in the number of beach and<br />
coastal drowning fatalities over the last five years, when<br />
compared to the previous five years.<br />
• New Zealand has a 48% higher ten-year average beach<br />
and coastal fatal drowning rate per capita (per <strong>10</strong>0,000<br />
pop,) than Australia.<br />
• Last year, 22% of beach and coastal fatal drownings<br />
occurred while swimming/wading. This highlights the risk<br />
associated with swimming/wading.<br />
• Males are fatally drowning more than females on our<br />
beaches and coastline. Of those who died from drowning<br />
over the last ten years, males represent 87% and females<br />
13%.<br />
have significantly increased in recent years as more and<br />
more people require our services.<br />
• Over the last ten years, Surf Lifeguards have carried out<br />
951,695 preventative actions involving 3,775,982 members<br />
of the public, 6545 assists and <strong>10</strong>,229 rescues. That is a<br />
huge number of drownings that have been potentially<br />
averted because of the vital role that <strong>SLSNZ</strong> performs.<br />
• <strong>SLSNZ</strong> also saves lives on the land as well as in the sea.<br />
All Surf Lifeguards are first aid trained and many are trained<br />
as First Responders. Over the last <strong>10</strong> years, Surf Lifeguards<br />
have treated <strong>20</strong>,438 people who required minor or major<br />
first aid treatments.<br />
• Over the last ten years, Pacifika Peoples had the highest<br />
fatal drowning rate per capita (1.31 per <strong>10</strong>0,000 pop.) of<br />
any ethnicity, followed by Maori (1.13 per <strong>10</strong>0,000 pop.)<br />
and Other (0.91 per <strong>10</strong>0,000 pop,).<br />
• Over the last ten years, there were 172 beach and<br />
coastal drowning fatalities during the three summer months<br />
of December, January and February. This figure represents<br />
nearly half of the total annual beach<br />
BEACH<br />
and coastal<br />
&<br />
drowning<br />
fatalities recorded, highlighting the increased risk associated<br />
with the busy summer season.<br />
• Between <strong>20</strong><strong>10</strong>-<strong>20</strong>, Northland had the greatest average<br />
fatal drowning rate per capita (3.04 per <strong>10</strong>0,000 pop.).<br />
Auckland (with a much larger population), has a fatal<br />
drowning rate of only 0.64. Therefore, the risk of fatally<br />
drowning on the beach and coastal environments of<br />
Northland is nearly five times greater than Auckland 1 .<br />
38%<br />
• Over the last ten years, adults over the age of 15 account<br />
for 95% of all drowning fatalities in the beach and coastal<br />
environment. SURF The BEACH 35-44 and 65+ age groups have the<br />
greatest number of fatal drownings.<br />
LOCATION<br />
17%<br />
• Over the last ten years, 38% of beach and coastal fatal<br />
drownings occurred at a surf beach in New Zealand.<br />
• Over the last <strong>10</strong> years, swimming/wading, boating 0-1KM and<br />
falls (trips/slips) have been the highest risk activities OFFSHORE<br />
on the<br />
coast. Last year swimming/wading, boating and snorkelling<br />
were the highest risk activities.<br />
ACTIVITY<br />
• As part of the ‘<strong>National</strong> Search and Rescue Framework’,<br />
Volunteer <strong>SLSNZ</strong> Clubs are regularly called upon by the<br />
Police to respond to incidents out of hours. These call outs<br />
360 87%<br />
MALE<br />
COASTAL FATAL<br />
DROWNINGS<br />
13%<br />
FEMALE<br />
Males account for 87%<br />
of all <strong>Beach</strong> and <strong>Coastal</strong><br />
Drowning Fatalities. Our Fatal<br />
14%<br />
Drowning Toll is something<br />
every New Zealander<br />
HARBOUR<br />
should see as a national<br />
tragedy which we all have a<br />
responsibility to address.<br />
1 The population figures are based on those residing in the region, and do not<br />
include visitors. To gain a true picture of the ‘drowning risk’ in any area, future<br />
reports will attempt to allow for the seasonal influx of visitors.<br />
The <strong>National</strong> <strong>Beach</strong> and <strong>Coastal</strong> <strong>Safety</strong> <strong>Report</strong> only documents incidents that have<br />
occurred within the coastal zone. The coastal zone is defined as “Tidal waters<br />
(estuary, harbour, marina and river/harbour bar); ocean up to 1km offshore; or<br />
inland up to five times the width of the inlet/river”.<br />
SURF LIFE SAVING NEW ZEALAND<br />
05<br />
SYNOPSIS & KEY FINDINGS
CAPABILITY<br />
SECTION ONE<br />
<strong>10</strong>-YEAR OVERVIEW | <strong>20</strong><strong>10</strong>-<strong>20</strong><br />
&<br />
1-YEAR OVERVIEW | <strong>20</strong>19-<strong>20</strong><br />
STATISTICS | <strong>20</strong><strong>10</strong>-<strong>20</strong><br />
951,695<br />
PREVENTATIVE<br />
ACTIONS<br />
<strong>10</strong>,229<br />
RESCUES<br />
6,545<br />
ASSISTS<br />
2,946<br />
SEARCHES<br />
INVOLVING<br />
3,775,982<br />
MEMBERS OF THE PUBLIC<br />
40<br />
EMERGENCY<br />
CALLOUT SQUADS<br />
<strong>20</strong>,438<br />
FIRST AID<br />
TREATMENTS
CAPABILITY<br />
Surf Life Saving New Zealand has provided a Surf<br />
Lifeguard Service to the New Zealand public for 1<strong>10</strong> years.<br />
The service consists of 74 volunteer Surf Life Saving Clubs<br />
and Contract Surf Lifeguard Service. When combined, these<br />
services patrol a total 80+ locations country-wide. Between<br />
<strong>20</strong>19-<strong>20</strong> there were 4541 qualified Surf Lifeguards, with<br />
862 gaining their Surf Lifeguard Award during the season.<br />
Beyond the red and yellow flags, Surf Life Saving New<br />
Zealand provides surveillance at many remote beaches and<br />
coastlines through a fleet of Inflatable Rescue Boats, Rescue<br />
Water Craft, All-Terrain Vehicles and 4x4’s, and delivers an<br />
invaluable Search and Rescue service through a network of<br />
Volunteer Emergency Callout Squads.<br />
VOLUNTEER SURF LIFEGUARDS<br />
Seasonal patrols are provided by 74 volunteer Surf Life<br />
Saving Clubs, with patrols typically occurring between<br />
Labour Weekend (October) and Easter (April). Over the past<br />
few years, Surf Life Saving Clubs have been reviewing and<br />
adapting season lengths and daily patrol timings to meet<br />
the ever-changing demands of the communities they serve.<br />
The recommended Surf Lifeguard service requirements are<br />
evidence-based and derived from coastal risk assessments,<br />
which have been tailored towards existing patrol locations<br />
nationally. The coastal risk assessment also recommends<br />
new patrol locations, based upon risk-adjusted water use<br />
values for each site. Surf Life Saving New Zealand works<br />
with Surf Life Saving Clubs, communities and stakeholders<br />
to deliver services to areas with the greatest need.<br />
Volunteer clubs use standardised equipment that includes<br />
Rescue Tubes, Rescue Boards, Inflatable Rescue Boats and<br />
Rescue Water Craft to perform rescues and preventative<br />
actions that stop the public getting into dangerous situations.<br />
The organisation also provides a number of surveillance<br />
patrols to increase service coverage. All Terrain Vehicles and<br />
4x4 vehicles equipped with first aid and rescue equipment,<br />
ensure coverage is extended across larger stretches of the<br />
coastline and remote beaches. A number of Rescue Water<br />
Craft provide rapid response to remote areas and rock<br />
foreshores and participate in both surveillance and Search<br />
and Rescue activities.<br />
CONTRACT SURF LIFEGUARD SERVICE<br />
The Contract Surf Lifeguard Service is funded by Regional<br />
Councils and Local Territorial Authorities. Patrols primarily<br />
run on weekdays (Monday-Friday) through the summer<br />
school holidays (December-February). An evidence-based<br />
delivery model for the Contract Surf Lifeguard Service is also<br />
being used to expand the service to meet community need.<br />
In some areas, surveillance-based patrolling methods have<br />
been used to extend patrolling hours into the evening. This<br />
approach has proven effective for preventing Surf Lifeguard<br />
fatigue. On-call based services have also been successfully<br />
trialled in the Bay of Plenty, to extend patrols in response<br />
to periods of prolonged settled weather and dangerous<br />
swimming conditions, as well as providing additional safety<br />
services to the public.<br />
SEARCH AND RESCUE<br />
Emergency Callout Squads are used to assist Search and<br />
Rescue agencies or sometimes Maritime New Zealand,<br />
in NZ Police tasked incidents. There are currently 40<br />
active Emergency Callout Squads nationally. In <strong>20</strong>19-<strong>20</strong><br />
Emergency Callout Squads were involved in 73 Category 1<br />
Search and Rescue Operations. As a result of the operations,<br />
54 people were rescued, of which 54 people's lives were<br />
saved, with a further 31 people assisted to safety.<br />
Emergency Callout Squads were also involved in retrieving<br />
<strong>20</strong> persons who died, returning them back to their whanau<br />
and loved ones. Surf Lifeguards provided over 633 hours<br />
of service as part of official Search and Rescue Operations.<br />
SURF LIFEGUARD INTERVENTIONS <strong>20</strong><strong>10</strong>-<strong>20</strong><strong>20</strong><br />
The interventions performed whilst Surf Lifeguards have<br />
been protecting our beaches in the last decade have saved<br />
countless lives. The exact figure at present cannot be<br />
quantified, however through these actions Surf Life Saving<br />
New Zealand and its Volunteer Surf Lifeguards have likely<br />
saved more than <strong>10</strong>,<strong>20</strong>0 lives.<br />
Table 1<br />
Surf Lifeguard Interventions <strong>20</strong><strong>10</strong>-<strong>20</strong> (last <strong>10</strong>yrs)<br />
SURF LIFEGUARD<br />
INTERVENTION<br />
TOTALS<br />
(<strong>20</strong><strong>10</strong>-<strong>20</strong>)<br />
Rescues / Lives Saved <strong>10</strong>,229<br />
Assists (new category since <strong>20</strong>16/17) 6,545<br />
Preventative Actions<br />
People in Preventatives: 3,775,982<br />
951,695<br />
Searches 2,946<br />
First Aid Treatments <strong>20</strong>,438<br />
TOTAL INTERVENTIONS 991,853<br />
SURF LIFE SAVING NEW ZEALAND<br />
08<br />
NATIONAL BEACH & COASTAL SAFETY REPORT
CAPABILITY<br />
1-YEAR OVERVIEW | <strong>20</strong>19-<strong>20</strong><br />
Figure 01<br />
<strong>20</strong>19–<strong>20</strong>: Qualifications Held by Surf Lifeguards<br />
There were a total of 4,519 proficient Surf Lifeguards in <strong>20</strong>19-<strong>20</strong>, of which 862 were new recipients of the Surf Lifeguard<br />
Award. <strong>SLSNZ</strong> Surf Lifeguards currently hold a total of 8,953 awards, with 2,<strong>20</strong>1 first aid awards and 1,365 craft<br />
qualifications (IRB and RWC).<br />
PATROL<br />
SUPPORT<br />
143<br />
ADVANCED<br />
LIFEGUARD<br />
AWARD<br />
17<br />
SENIOR<br />
LIFEGUARD<br />
AWARD<br />
PATROL<br />
CAPTAIN<br />
<strong>10</strong>6<br />
FIRST AID<br />
2,<strong>20</strong>1<br />
IRB<br />
CREWSPERSONS<br />
MODULE<br />
374<br />
SURF LIFEGUARD<br />
AWARD<br />
4,519<br />
RADIO<br />
OPERATOR<br />
CERTIFICATE<br />
312<br />
BOARD<br />
RESCUE<br />
MODULE<br />
181<br />
SENIOR<br />
LIFEGUARD<br />
AWARD<br />
IRB DRIVER<br />
921<br />
RESCUE<br />
WATER<br />
CRAFT<br />
OPERATORS<br />
AWARD<br />
30<br />
Figure 02<br />
<strong>20</strong>19-<strong>20</strong>: Patrolling Surf Lifeguards per Region<br />
Lifeguards (n)<br />
800<br />
700<br />
600<br />
500<br />
400<br />
300<br />
<strong>20</strong>0<br />
<strong>10</strong>0<br />
Male Lifeguards<br />
Female Lifeguards<br />
0<br />
AUK BOP CAN GIS HKB MWT MBH NSN NTL OTA STL TKI WKO WGN WTC<br />
Region<br />
SECTION ONE<br />
09<br />
CAPABILITY
SURF LIFE SAVING PATROL LOCATIONS<br />
1-YEAR OVERVIEW | <strong>20</strong>19-<strong>20</strong><br />
Figure 03<br />
<strong>20</strong>19-<strong>20</strong>: Surf Life Saving Patrol Locations per Region<br />
There are a total of 74 Surf Life Saving Clubs in New Zealand who provide voluntary patrols during varying season lengths<br />
between Labour and Easter weekends.<br />
46<br />
Northland<br />
6<br />
13<br />
Auckland<br />
Bay of Plenty<br />
<strong>10</strong><br />
288<br />
8<br />
Waikato<br />
Gisborne<br />
5<br />
4<br />
Taranaki<br />
ND<br />
Tasman<br />
1<br />
Nelson<br />
Hawke’s Bay<br />
5<br />
Manawatu-Wanganui<br />
5<br />
Wellington<br />
8<br />
2<br />
West Coast<br />
Marlborough<br />
1<br />
Canterbury<br />
<strong>10</strong><br />
1<br />
Southland<br />
Otago<br />
5<br />
SURF LIFE SAVING NEW ZEALAND<br />
<strong>10</strong><br />
NATIONAL BEACH & COASTAL SAFETY REPORT
SURF LIFEGUARD CAPABILITY<br />
1-YEAR OVERVIEW | <strong>20</strong>19-<strong>20</strong><br />
Figure 04<br />
<strong>20</strong>19-<strong>20</strong>: Total Volunteer Surf Life Saving Patrols and Contract Surf Lifeguard Service per Region<br />
There are a total of 74 Surf Life Saving Clubs in New Zealand which provide voluntary patrols, up to a maximum season<br />
length between Labour and Easter weekends. The Contract Surf Lifeguard Service (Monday-Friday) provides 80 Lifeguard<br />
Patrols nationally.<br />
15<br />
12<br />
Volunteer Surf Life Saving Patrols<br />
Contract Surf Lifeguard Service<br />
Patrols (n)<br />
9<br />
6<br />
3<br />
0<br />
NTL AUK WKO BOP GIS TKI MWT HKB WGN NSN MBH WTC CAN OTA STL<br />
Region<br />
Figure 05<br />
<strong>20</strong>19-<strong>20</strong>: Equipment Used in a Rescue<br />
Figure 06<br />
<strong>20</strong>19-<strong>20</strong>: Patrolling Surf Lifeguards<br />
6%<br />
6%<br />
15%<br />
31%<br />
42%<br />
IRB<br />
42%<br />
IRB<br />
Rescue Tube<br />
Rescue Board<br />
RWC<br />
No Gear<br />
57%<br />
MALE<br />
43%<br />
FEMALE<br />
SECTION ONE<br />
11<br />
CAPABILITY
RESCUES PER REGION<br />
1-YEAR OVERVIEW | <strong>20</strong>19-<strong>20</strong><br />
“Rescue - Where a person requires immediate help to return to shore (or place of safety)<br />
and who without intervention would have suffered distress, injury or drowning.”<br />
Figure 07<br />
<strong>20</strong>19-<strong>20</strong>: Rescues per Region<br />
Northland 27<br />
<strong>20</strong>19-<strong>20</strong><br />
577<br />
RESCUES<br />
134 Auckland<br />
191 Waikato<br />
Bay of Plenty<br />
65<br />
Gisborne 12<br />
13<br />
Taranaki<br />
Hawke’s Bay<br />
42<br />
Tasman<br />
ND 6<br />
Nelson<br />
Manawatu-Wanganui<br />
16<br />
Wellington 19<br />
0<br />
West Coast<br />
Marlborough<br />
2<br />
Key to Rescues per Region<br />
1 - 14 Rescues<br />
Canterbury 30<br />
14 - 29 Rescues<br />
29 - 43 Rescues<br />
43 - 58 Rescues<br />
0<br />
Southland<br />
Otago <strong>20</strong><br />
ND<br />
58 - 72 Rescues<br />
No Data<br />
SURF LIFE SAVING NEW ZEALAND<br />
12<br />
NATIONAL BEACH & COASTAL SAFETY REPORT
ASSISTS PER REGION<br />
1-YEAR OVERVIEW | <strong>20</strong>19-<strong>20</strong><br />
“Assist - Where a person requires assistance to return to shore but would most likely be<br />
able to get themselves out of danger if unaided.”<br />
Figure 08<br />
<strong>20</strong>19-<strong>20</strong>: People Assisted to <strong>Safety</strong> per Region<br />
Northland 46<br />
<strong>20</strong>19-<strong>20</strong><br />
1,543<br />
ASSISTS<br />
288 Auckland<br />
246 Waikato<br />
Bay of Plenty 218<br />
Gisborne 21<br />
91<br />
Taranaki<br />
Tasman<br />
ND 23<br />
Nelson<br />
Hawke’s Bay 111<br />
Manawatu-Wanganui<br />
30<br />
Wellington<br />
183<br />
1<br />
West Coast<br />
Marlborough<br />
2<br />
Canterbury<br />
240<br />
Key to Assists per Region<br />
1 - 46 Assists<br />
46 - 92 Assists<br />
92 - 139 Assists<br />
139 - 185 Assists<br />
0<br />
Southland<br />
Otago 43<br />
ND<br />
185 - 231 Assists<br />
No Data<br />
SECTION ONE<br />
13<br />
CAPABILITY
MAJOR FIRST AID INCIDENTS PER REGION<br />
1-YEAR OVERVIEW | <strong>20</strong>19-<strong>20</strong><br />
“Major First Aid - Any incident where a patient is administered some form of advanced<br />
medical treatment, or requires hospitalization.”<br />
Figure 09<br />
<strong>20</strong>19-<strong>20</strong>: Major First Aid Incidents per Region<br />
Northland 24<br />
88<br />
Auckland<br />
Bay of Plenty<br />
43<br />
<strong>20</strong>19-<strong>20</strong><br />
296<br />
MAJOR<br />
FIRST AID<br />
INCIDENTS<br />
Tasman<br />
68 Waikato<br />
<strong>10</strong> Taranaki<br />
ND 1<br />
Nelson<br />
Gisborne 12<br />
Hawke’s Bay <strong>10</strong><br />
Manawatu-Wanganui 2<br />
Wellington 6<br />
0<br />
West Coast<br />
Marlborough<br />
1<br />
Key to Major First Aid Treatments<br />
per Region<br />
1 - 8 Treatments<br />
Canterbury<br />
23<br />
8 - 16 Treatments<br />
16 - 25 Treatments<br />
25 - 33 Treatments<br />
0<br />
Southland<br />
Otago<br />
8<br />
ND<br />
33 - 41 Treatments<br />
No Data<br />
SURF LIFE SAVING NEW ZEALAND<br />
14<br />
NATIONAL BEACH & COASTAL SAFETY REPORT
MINOR FIRST AID INCIDENTS PER REGION<br />
1-YEAR OVERVIEW | <strong>20</strong>19-<strong>20</strong><br />
“Minor First Aid - Where a patient is administered some form of<br />
minor medical treatment.”<br />
Figure <strong>10</strong><br />
<strong>20</strong>19-<strong>20</strong>: Minor First Aid Incidents per Region<br />
Northland<br />
139<br />
682<br />
Auckland<br />
Bay of Plenty<br />
478<br />
<strong>20</strong>19-<strong>20</strong><br />
2,2<strong>10</strong><br />
MINOR<br />
FIRST AID<br />
INCIDENTS<br />
Tasman<br />
469 Waikato<br />
23 Taranaki<br />
ND 8<br />
Nelson<br />
Gisborne<br />
Hawke’s Bay 37<br />
Manawatu-Wanganui 9<br />
Wellington 122<br />
57<br />
3<br />
West Coast<br />
Marlborough<br />
19<br />
Key to Minor First Aid Treatments<br />
per Region<br />
0 - 69 Treatments<br />
Canterbury<br />
111<br />
69 - 138 Treatments<br />
138 - <strong>20</strong>7 Treatments<br />
<strong>20</strong>7 - 276 Treatments<br />
4<br />
Southland<br />
Otago<br />
46<br />
ND<br />
276 - 345 Treatments<br />
No Data<br />
SECTION ONE<br />
15<br />
CAPABILITY
SEARCHES PER REGION<br />
1-YEAR OVERVIEW | <strong>20</strong>19-<strong>20</strong><br />
“Search - Any organised search for a missing person or group either at sea or on land.<br />
Searches include body recoveries.”<br />
Figure 11<br />
<strong>20</strong>19-<strong>20</strong>: Patrol Searches per Region<br />
Northland 15<br />
<strong>20</strong>19-<strong>20</strong><br />
319<br />
SEARCHES<br />
81 Auckland<br />
61 Waikato<br />
9 Taranaki<br />
Bay of Plenty<br />
44<br />
Gisborne<br />
8<br />
Hawke’s Bay<br />
12<br />
Tasman<br />
ND <strong>10</strong><br />
Nelson<br />
Manawatu-Wanganui<br />
12<br />
Wellington<br />
12<br />
4<br />
West Coast<br />
Marlborough<br />
0<br />
Canterbury<br />
36<br />
Key to Searches per Region<br />
1 - 7 Searches<br />
7 - 14 Searches<br />
14 - <strong>20</strong> Searches<br />
<strong>20</strong> - 27 Searches<br />
0<br />
Southland<br />
Otago 15<br />
ND<br />
27 - 34 Searches<br />
No Data<br />
SURF LIFE SAVING NEW ZEALAND<br />
16<br />
NATIONAL BEACH & COASTAL SAFETY REPORT
PREVENTATIVE ACTIONS PER REGION<br />
1-YEAR OVERVIEW | <strong>20</strong>19-<strong>20</strong><br />
“Preventative Action - Direct action taken to reduce or eliminate the probability of a<br />
specific rescue, first aid or other reportable incident occuring.”<br />
Figure 12<br />
<strong>20</strong>19-<strong>20</strong>: Preventative Actions per Region<br />
Northland<br />
3,440<br />
19,042<br />
Auckland<br />
Bay of Plenty<br />
22,838<br />
<strong>20</strong>19-<strong>20</strong><br />
<strong>10</strong>1,630<br />
PREVENTATIVE<br />
ACTIONS<br />
18,741 Waikato<br />
6,074 Taranaki<br />
36 Nelson<br />
ND Tasman<br />
Gisborne 1,984<br />
Hawke’s Bay 1,517<br />
Manawatu-Wanganui 9,759<br />
Wellington<br />
3,444<br />
72<br />
West Coast<br />
Marlborough<br />
132<br />
Key to Preventative Actions per Region<br />
1 - 2,875 Actions<br />
Canterbury<br />
11,883<br />
2,875 - 5,742 Actions<br />
5,742 - 8,6<strong>10</strong> Actions<br />
8,6<strong>10</strong> - 11,477 Actions<br />
43<br />
Southland<br />
Otago 2,625<br />
ND<br />
11,477 - 14,344 Actions<br />
No Data<br />
SECTION ONE<br />
17<br />
CAPABILITY
FATA L D R O W N I N G<br />
ANALYSIS<br />
SECTION TWO<br />
<strong>10</strong>-YEAR OVERVIEW | <strong>20</strong><strong>10</strong>-<strong>20</strong><br />
360 87%<br />
MALE<br />
BEACH &<br />
COASTAL FATAL<br />
DROWNINGS<br />
13%<br />
FEMALE<br />
LOCATION<br />
38%<br />
SURF BEACH<br />
17%<br />
0-1KM<br />
OFFSHORE<br />
14%<br />
HARBOUR<br />
ACTIVITY<br />
22%<br />
SWIMMING/WADING<br />
17%<br />
BOATING<br />
17%<br />
FALLS
NATIONAL OVERVIEW<br />
<strong>10</strong>-YEAR OVERVIEW | <strong>20</strong><strong>10</strong>-<strong>20</strong><br />
Each fatal drowning is a tragedy in its own right; it affects<br />
not only the close family and friends but the wider community.<br />
The research presented here aims to report and categorise<br />
fatal drownings, to better inform strategic decision making<br />
for preventative educational programmes and community<br />
engagement initiatives. The following section focuses on<br />
fatal drownings that have occurred in beach and coastal<br />
environments from <strong>20</strong><strong>10</strong>-<strong>20</strong>.<br />
There were 360 fatal drownings from <strong>20</strong><strong>10</strong>-<strong>20</strong>. Auckland<br />
region has the highest number of fatal drownings (n=98),<br />
followed by Northland (n=57) and Waikato (n=45). Surf<br />
beaches were the most dangerous environment with 138<br />
drowning fatalities, followed by 0-1 km from shore (n=60)<br />
and within harbours (n=51). The majority of beach and<br />
coastal fatal drownings occurred while swimming/wading<br />
(n=80) followed by boating (n=62) and falls (n=61).<br />
Figure 13<br />
<strong>20</strong><strong>10</strong>-<strong>20</strong>: Total number of New Zealand beach and coastal fatal drownings per year from <strong>20</strong><strong>10</strong>-<strong>20</strong> (n=360); and<br />
comparison of New Zealand vs Australian beach and coastal fatal drowning rates per <strong>10</strong>0,000 pop.<br />
Fatal Drownings (n)<br />
50<br />
45<br />
40<br />
35<br />
30<br />
25<br />
<strong>20</strong><br />
15<br />
<strong>10</strong><br />
5<br />
0<br />
Fatal Drownings<br />
NZ Fatal Drowning Rate<br />
AUS Fatal Drowning Rate<br />
<strong>20</strong><strong>10</strong>-11 <strong>20</strong>11-12 <strong>20</strong>12-13 <strong>20</strong>13-14 <strong>20</strong>14-15 <strong>20</strong>15-16 <strong>20</strong>16-17 <strong>20</strong>17-18 <strong>20</strong>18-19 <strong>20</strong>19-<strong>20</strong><br />
<strong>Year</strong><br />
The NZ <strong>20</strong>19-<strong>20</strong> fatal drowning rate per <strong>10</strong>0,000 pop.<br />
is 0.85, which is above the ten-year average (0.78 per<br />
<strong>10</strong>0,000 pop.). The NZ ten-year average beach and coastal<br />
fatal drowning rate per <strong>10</strong>0,000 pop. is 48% greater than<br />
the Australian ten-year average (0.48 per <strong>10</strong>0,000 pop.).<br />
The New Zealand <strong>10</strong>-year<br />
average beach and coastal fatal<br />
drowning rate is 48% higher than<br />
the Australian <strong>10</strong>-year average,<br />
and is on the increase.<br />
Figure 14<br />
<strong>20</strong><strong>10</strong>-15 and <strong>20</strong>15-<strong>20</strong> five-year average beach and<br />
coastal fatal drownings and average fatal drowning<br />
rate per <strong>10</strong>0,000 pop.<br />
<strong>20</strong><strong>10</strong>-15<br />
AVERAGE<br />
DROWNING RATE<br />
0.74<br />
PER <strong>10</strong>0,000 POPULATION<br />
1.2<br />
1.0<br />
0.8<br />
0.6<br />
0.4<br />
0.2<br />
0.0<br />
<strong>20</strong>15-<strong>20</strong><br />
AVERAGE<br />
DROWNING RATE<br />
0.83<br />
PER <strong>10</strong>0,000 POPULATION<br />
Fatal Drowning Rate<br />
(per <strong>10</strong>0,000 pop.)<br />
When comparing the first half of the decade (<strong>20</strong><strong>10</strong>-<strong>20</strong>15)<br />
to the later (<strong>20</strong>15-<strong>20</strong><strong>20</strong>), there has been an increase from<br />
33 (<strong>20</strong><strong>10</strong>-<strong>20</strong>15) fatal drownings on average per year to 39<br />
per year (<strong>20</strong>15-<strong>20</strong>). The five-year average fatal drowning<br />
rate has increased from 0.74 in the first half of the decade<br />
to 0.83 per <strong>10</strong>0,000 pop. in the later half.<br />
AVERAGE FATAL<br />
DROWNINGS<br />
33<br />
PER YEAR<br />
AVERAGE FATAL<br />
DROWNINGS<br />
39<br />
PER YEAR<br />
SURF LIFE SAVING NEW ZEALAND<br />
<strong>20</strong><br />
NATIONAL BEACH & COASTAL SAFETY REPORT
NATIONAL OVERVIEW<br />
<strong>10</strong>-YEAR OVERVIEW | <strong>20</strong><strong>10</strong>-<strong>20</strong><br />
Figure 15<br />
<strong>20</strong><strong>10</strong>-<strong>20</strong>: Regional comparison of total beach and coastal fatal drownings and fatal drowning rate per <strong>10</strong>0,000<br />
pop. (n=360).<br />
During <strong>20</strong><strong>10</strong>-<strong>20</strong> there were 360 fatal drownings in the beach and coastal environments. Auckland (n=98) experienced the<br />
highest fatal drowning number per region, followed by Northland (n=57) and Waikato (n=45). Northland, has the highest<br />
average fatal drowning rate per region (3.04 per <strong>10</strong>0,000 pop.), followed by West Coast (1.82 per <strong>10</strong>0,000 pop.) and<br />
Hawke’s Bay (0.98 per <strong>10</strong>0,000 pop.).<br />
Fatal Drownings (n)<br />
<strong>10</strong>0<br />
80<br />
65<br />
40<br />
<strong>20</strong><br />
Fatal Drownings<br />
Average Fatal Drowning Rate<br />
3.5<br />
3.0<br />
2.5<br />
2.0<br />
1.5<br />
1.0<br />
0.5<br />
Fatal Drowning Rate<br />
(per <strong>10</strong>0,000 pop.)<br />
0<br />
AUK<br />
NTL<br />
WKO<br />
WGN<br />
BOP<br />
CAN<br />
HKB<br />
OTA<br />
STL<br />
Region<br />
TKI<br />
WTC<br />
MWT<br />
TAS<br />
MBH<br />
GIS<br />
NSN<br />
0.0<br />
Figure 16<br />
<strong>20</strong><strong>10</strong>-<strong>20</strong>: Age groups and gender represented in beach<br />
and coastal fatal drownings (n=360).<br />
Age groups above 15 years old account for 95% (n=343) of<br />
all beach and coastal fatal drownings from <strong>20</strong><strong>10</strong>-<strong>20</strong>. Males<br />
account for 87% (n=314) of all drowning fatalities, whereas<br />
females account for 13% (n=46). The fatal drowning rate for<br />
males is greater than females across all age groups.<br />
Fatal Drownings (n)<br />
70<br />
60<br />
50<br />
40<br />
30<br />
<strong>20</strong><br />
<strong>10</strong><br />
Male<br />
Female<br />
89%<br />
More males are fatally<br />
drowning than females<br />
89%<br />
MALE<br />
MALE<br />
11%<br />
87%<br />
FEMALE<br />
FEMALE<br />
0<br />
0-4 5-14 15-24 25-34 35-44 45-54 55-64 MALE 65+<br />
Age<br />
More adults are fatally 11%<br />
13%<br />
drowning than children FEMALE<br />
SECTION TWO FATAL DROWNING ANALYSIS / <strong>10</strong> YEAR OVERVIEW <strong>20</strong>09-19<br />
21
NATIONAL OVERVIEW<br />
<strong>10</strong>-YEAR OVERVIEW | <strong>20</strong><strong>10</strong>-<strong>20</strong><br />
Figure 17<br />
<strong>20</strong><strong>10</strong>-<strong>20</strong> (ten-year average) and <strong>20</strong>19-<strong>20</strong>: Total beach and coastal fatal drownings by ethnicity.<br />
From <strong>20</strong><strong>10</strong>-<strong>20</strong>, NZ Europeans (n=13) had the greatest average number of total fatal drownings per year, followed by Maori<br />
(n=9), Asian (n=5) and Pacific People (n=5). In <strong>20</strong>19-<strong>20</strong>, with the exception of Pacific Peoples, the annual fatal drowning<br />
toll for all ethnicities exceeded the ten-year average. Pacific Peoples was the only ethnicity where the <strong>20</strong>19-<strong>20</strong> fatal drowning<br />
number dropped below the ten-year average.<br />
15<br />
Average Fatal Drownings per <strong>Year</strong> (<strong>20</strong><strong>10</strong>-<strong>20</strong>)<br />
Total Fatal Drownings (<strong>20</strong>19-<strong>20</strong>)<br />
Fatal Drownings (n)<br />
12<br />
9<br />
6<br />
3<br />
0<br />
NZ EUROPEAN MAORI<br />
PACIFIC PEOPLES ASIAN OTHER* UNKNOWN<br />
Ethnicity<br />
(*represents all other ethnicities)<br />
Figure 18<br />
<strong>20</strong><strong>10</strong>-<strong>20</strong> (ten-year average) and <strong>20</strong>19-<strong>20</strong>: <strong>Beach</strong> and coastal fatal drowning rates (per <strong>10</strong>0,000 pop.) by ethnicity<br />
(n=360).<br />
From <strong>20</strong><strong>10</strong>-<strong>20</strong>, Pacific Peoples recorded the highest average fatal drowning rate (1.31 per <strong>10</strong>0,000 pop.) of any ethnicity,<br />
followed by Maori (1.13 per <strong>10</strong>0,000 pop.) and Other ethnicities (0.91 per <strong>10</strong>0,000 pop.).<br />
During <strong>20</strong>19-<strong>20</strong> Other ethnicities represented the highest fatal drowning rate (1.52 per <strong>10</strong>0,000 pop.), followed by Maori<br />
(1.29 per <strong>10</strong>0,000 pop.) and Asian (0.99 per <strong>10</strong>0,000 pop.).<br />
With the exception of Pacific Peoples, the <strong>20</strong>19-<strong>20</strong> fatal drowning rates for each ethnicity exceeded their respective ten-year<br />
average. Pacific Peoples were the only ethnicity where the <strong>20</strong>19-<strong>20</strong> fatal drowning rate (0.79 per <strong>10</strong>0,000 pop.) dropped<br />
below the ten-year average (1.31 per <strong>10</strong>0,000 pop.).<br />
Rate (per <strong>10</strong>0,000 pop.)<br />
2.0<br />
1.5<br />
1.0<br />
0.5<br />
Fatal Drowning Rate (<strong>20</strong><strong>10</strong>-<strong>20</strong>)<br />
Fatal Drowning Rate (<strong>20</strong>19-<strong>20</strong>)<br />
0<br />
NZ EUROPEAN MAORI PACIFIC PEOPLES ASIAN OTHER*<br />
Ethnicity<br />
(*represents all other ethnicities)<br />
SURF LIFE SAVING NEW ZEALAND<br />
22<br />
NATIONAL BEACH & COASTAL SAFETY REPORT
NATIONAL OVERVIEW<br />
<strong>10</strong>-YEAR OVERVIEW | <strong>20</strong><strong>10</strong>-<strong>20</strong><br />
Figure 19<br />
<strong>20</strong><strong>10</strong>-<strong>20</strong>: <strong>Beach</strong> and coastal fatal drownings by month (n=360).<br />
The highest number of beach and coastal fatal drownings occurred in January (n=67), followed by February (n=54) and<br />
December (n=51). From <strong>20</strong><strong>10</strong>-<strong>20</strong>, 48% of all fatal drownings occurred during the summer months (Dec – Feb).<br />
80<br />
70<br />
Fatal Drownings<br />
Summer Season<br />
Fatal Drownings (n)<br />
60<br />
50<br />
40<br />
30<br />
<strong>20</strong><br />
<strong>10</strong><br />
0<br />
JUL AUG SEPT OCT NOV DEC JAN FEB MAR APR MAY JUN<br />
<strong>Year</strong><br />
Figure <strong>20</strong><br />
Comparison between the <strong>20</strong><strong>10</strong>-<strong>20</strong> ten year average (n=360) and <strong>20</strong>19-<strong>20</strong> count (n=42) for beach and coastal<br />
fatal drownings by activity.<br />
The activities listed below represent the top eight causes of fatal drowning within the beach and coastal environment between<br />
<strong>20</strong><strong>10</strong>-<strong>20</strong>. In <strong>20</strong>19-<strong>20</strong>, the number of drowning fatalities while boating, snorkelling, using watercraft and land-based fishing<br />
were above the ten–year average. Falls and net/shell fishing activities were below the ten-year average.<br />
SWIMMING / WADING<br />
SNORKELLING<br />
FALL<br />
<strong>20</strong><strong>10</strong>-<strong>20</strong><br />
8<br />
<strong>20</strong>19-<strong>20</strong><br />
8<br />
<strong>20</strong><strong>10</strong>-<strong>20</strong><br />
4<br />
LAND BASED FISHING<br />
<strong>20</strong>19-<strong>20</strong><br />
6<br />
<strong>20</strong><strong>10</strong>-<strong>20</strong><br />
6<br />
<strong>20</strong>19-<strong>20</strong><br />
4<br />
<strong>20</strong><strong>10</strong>-<strong>20</strong><br />
3<br />
<strong>20</strong>19-<strong>20</strong><br />
5<br />
BOATING<br />
NET / SHELL FISHING<br />
WATERCRAFT<br />
<strong>20</strong><strong>10</strong>-<strong>20</strong><br />
6<br />
<strong>20</strong>19-<strong>20</strong><br />
7<br />
<strong>20</strong><strong>10</strong>-<strong>20</strong><br />
2<br />
ATTEMPTING A RESCUE<br />
<strong>20</strong>19-<strong>20</strong><br />
1<br />
<strong>20</strong><strong>10</strong>-<strong>20</strong><br />
3<br />
<strong>20</strong>19-<strong>20</strong><br />
5<br />
<strong>20</strong>19-<strong>20</strong><br />
2<br />
<strong>20</strong>19-<strong>20</strong><br />
2<br />
SECTION TWO FATAL DROWNING ANALYSIS / <strong>10</strong> YEAR OVERVIEW <strong>20</strong>09-19<br />
23
Figure 21<br />
<strong>10</strong> YEAR OVERVIEW | <strong>20</strong><strong>10</strong>-<strong>20</strong><br />
Fatal Drownings Per Region<br />
South Island<br />
5<br />
Tasman<br />
0<br />
Nelson<br />
7<br />
West Coast<br />
Marlborough<br />
4<br />
Canterbury<br />
14<br />
12<br />
Southland<br />
Otago<br />
11<br />
SURF LIFE SAVING NEW ZEALAND NATIONAL BEACH AND COASTAL SAFETY REPORT<br />
24
Northland<br />
57<br />
North Island<br />
98<br />
288<br />
Auckland<br />
Bay of Plenty<br />
33<br />
45<br />
Waikato<br />
Gisborne<br />
8<br />
8<br />
Taranaki<br />
Hawke’s Bay<br />
<strong>20</strong><br />
Manawatu-Wanganui<br />
5<br />
Wellington<br />
33<br />
4<br />
360<br />
A TOTAL OF<br />
BEACH AND<br />
COASTAL FATAL<br />
DROWNINGS<br />
SECTION TWO FATAL DROWNING ANALYSIS / <strong>10</strong> YEAR OVERVIEW <strong>20</strong>09-19<br />
25
FATA L D R O W N I N G<br />
ANALYSIS<br />
SECTION THREE<br />
1-YEAR OVERVIEW | <strong>20</strong>19-<strong>20</strong><br />
42<br />
86%<br />
MALE<br />
BEACH &<br />
COASTAL FATAL<br />
DROWNINGS<br />
14%<br />
FEMALE<br />
LOCATION<br />
38%<br />
SURF BEACH<br />
17%<br />
ROCKY<br />
FORESHORE<br />
17%<br />
HARBOUR<br />
ACTIVITY<br />
19%<br />
SWIMMING/WADING<br />
17%<br />
BOATING<br />
14%<br />
SNORKELLING
NATIONAL OVERVIEW<br />
1-YEAR OVERVIEW | <strong>20</strong>19-<strong>20</strong><br />
In <strong>20</strong>19-<strong>20</strong> there were 42 fatal drownings at beach and coastal environments. Auckland had the highest<br />
fatalities per region (n=13), followed by Northland (n=8) and Wellington (n=5).<br />
The majority of drowning fatalities occurred while swimming/wading (n=8), followed by boating (n=7) and<br />
snorkelling (n=6).<br />
Surf beaches proved to be the most dangerous environment for drowning fatalities (n=16), followed by<br />
harbour (n=7) and rocky foreshore (n=7).<br />
Figure 22<br />
<strong>20</strong>19-<strong>20</strong>: <strong>Beach</strong> and coastal fatal drownings per region (n=42).<br />
42<br />
86%<br />
MALE<br />
14%<br />
BEACH &<br />
COASTAL FATAL<br />
DROWNINGS<br />
13 FEMALE Auckland<br />
Northland<br />
8<br />
Bay of Plenty<br />
3<br />
LOCATION<br />
38%<br />
SURF BEACH<br />
17%<br />
ROCKY<br />
FORESHORE<br />
1<br />
Waikato<br />
HARBOUR<br />
1 Taranaki<br />
Tasman<br />
288<br />
4<br />
17%<br />
0 Nelson<br />
Gisborne<br />
Hawke’s Bay<br />
1<br />
1<br />
ACTIVITY<br />
Manawatu-Wanganui<br />
0<br />
Wellington<br />
5<br />
1<br />
West Coast<br />
Marlborough<br />
1<br />
19%<br />
SWIMMING/WADING<br />
17%<br />
BOATING<br />
14%<br />
SNORKELLING<br />
Canterbury<br />
1<br />
0<br />
Southland<br />
Otago<br />
2<br />
SURF LIFE SAVING NEW ZEALAND<br />
28<br />
NATIONAL BEACH & COASTAL SAFETY REPORT
NATIONAL OVERVIEW<br />
1-YEAR OVERVIEW | <strong>20</strong>19-<strong>20</strong><br />
Figure 23<br />
<strong>20</strong>19-<strong>20</strong>: <strong>Beach</strong> and coastal fatal drownings by age<br />
and gender (n=42).<br />
The highest number of fatal drownings occurred in the<br />
65+ year age group (26%, n=11), followed by 55-64 (19%,<br />
n=8) and 45-54 (14%, n=6) age groups. Across all age<br />
groups males accounted for 86% (n=36) of fatal drownings,<br />
whereas females accounted for 14% (n=6). Within the 65+<br />
age group males made up <strong>10</strong>0% of the fatal drownings.<br />
Figure 25<br />
<strong>20</strong>19-<strong>20</strong>: <strong>Beach</strong> and coastal fatal drownings by month<br />
(n=42).<br />
The greatest number of fatal drownings occurred in<br />
February (21%, n=9), followed by January (17%, n=7)<br />
and November (14%, n=6). The summer months (Dec<br />
– Feb) accounted for nearly half (48%, n=21) of all fatal<br />
drownings. With the exception of Dec and Mar, the number<br />
of fatal drownings per month during <strong>20</strong>19-<strong>20</strong> exceeded the<br />
<strong>10</strong> year average.<br />
Fatal Drownings (n)<br />
12<br />
<strong>10</strong><br />
8<br />
6<br />
4<br />
2<br />
Male<br />
Female<br />
Fatal Drownings (n)<br />
8<br />
7<br />
6<br />
5<br />
4<br />
3<br />
2<br />
1<br />
Fatal Drownings (<strong>20</strong>19-<strong>20</strong>)<br />
Average Fatal Drownings (<strong>20</strong><strong>10</strong>-<strong>20</strong>)<br />
0<br />
0-4 5-14 15-24 25-34 35-44 45-54 55-64 65+<br />
Age Groups<br />
0<br />
JUL AUG SEPT OCT NOV DEC JAN FEB MAR APR MAY JUN<br />
Month<br />
Figure 24<br />
<strong>20</strong>19-<strong>20</strong>: <strong>Beach</strong> and coastal fatal drownings by activity<br />
(n=42).<br />
The majority of fatal drownings occurred while using<br />
watercraft (n=12), followed by swimming / wading (n=8)<br />
and rock fishing (n=5).<br />
Figure 26<br />
<strong>20</strong>19-<strong>20</strong>: <strong>Beach</strong> and coastal fatal drownings by<br />
location (n=42).<br />
The majority of fatal drownings occurred at surf beaches<br />
(n=16), in harbours (n=7) and adjacent to rocky foreshores<br />
(n=7).<br />
5%<br />
5%<br />
19%<br />
7%<br />
5%<br />
2% 2%<br />
<strong>10</strong>%<br />
12%<br />
19%<br />
Swimming/<br />
Wading<br />
17%<br />
12%<br />
12%<br />
14%<br />
17%<br />
Swimming/Wading<br />
Boating<br />
Snorkelling<br />
Land Based Fishing<br />
5% 2% Surf <strong>Beach</strong><br />
38%<br />
17%<br />
38%<br />
Surf<br />
<strong>Beach</strong><br />
Watercraft<br />
Fall<br />
Attempting a Rescue<br />
Scuba Diving<br />
Unknown<br />
Net/Shell Fishing<br />
Harbour<br />
Rocky Foreshore<br />
0-1km off Shore<br />
River/Harbour Bar<br />
Calm Water <strong>Beach</strong><br />
Marinas<br />
Estuary<br />
SECTION THREE FATAL DROWNING ANALYSIS / 1 YEAR OVERVIEW <strong>20</strong>18-19<br />
29
N O N - FATA L<br />
DROWNING ANALYSIS<br />
SECTION FOUR<br />
<strong>10</strong>-YEAR OVERVIEW | <strong>20</strong><strong>10</strong>-<strong>20</strong><br />
non-fatal drowning<br />
A subset of drowning, the process of experiencing<br />
respiratory impairment from submersion/<br />
immersion in liquid, where the outcome is<br />
classified as morbidity and no morbidity.<br />
258<br />
NON-FATAL<br />
DROWNING<br />
INCIDENTS<br />
AVERAGE NON-FATAL<br />
DROWNINGS<br />
PER YEAR<br />
26<br />
40%<br />
UNDER THE AGE OF<br />
25<br />
1:1.8<br />
INFANTS AND YOUNG<br />
CHILDREN (0-4) RATIO<br />
FATAL : NON-FATAL<br />
DROWNING INCIDENTS<br />
RATIO FATAL : NON-FATAL<br />
DROWNING INCIDENTS<br />
(all ages)
NON-FATAL DROWNING OVERVIEW<br />
<strong>10</strong>-YEAR OVERVIEW | <strong>20</strong><strong>10</strong>-<strong>20</strong><br />
The focus of drowning prevention research has long<br />
been on fatal drowning. However, this is only part of the<br />
drowning toll. Non-fatal drowning incidents are more<br />
difficult to quantify but are still significant and can often<br />
result in life-changing injuries and illnesses. The social cost<br />
to New Zealand of one severe water-related injury resulting<br />
in hospitalisation has been estimated at $394,800 (ACC,<br />
<strong>20</strong>16).<br />
Between <strong>20</strong><strong>10</strong> and <strong>20</strong><strong>20</strong>, there were 258 cases of nonfatal<br />
drownings recorded on beaches, representing an<br />
average of 26 non-fatal beach drowning incidents per year.<br />
For this report, we have assumed beach specific non-fatal<br />
drowning data includes both surf and calm water beach<br />
types.<br />
*The non-fatal drowning data used in this report is based<br />
on hospital stays of at least 24 hours and has been provided<br />
by Water <strong>Safety</strong> New Zealand as recorded in DrownBase. A<br />
large amount of environmental coding is set to ‘large body<br />
water’ which does not allow for more specific data analysis.<br />
There are likely more non-fatal drowning cases that have<br />
occurred within the coastal environment, however, due to<br />
the hospitalisation coding limitations highlighted above,<br />
many cases are indeterminable at this stage.<br />
NON-FATAL<br />
DROWNING INCIDENTS<br />
258<br />
BETWEEN <strong>20</strong><strong>10</strong>-<strong>20</strong><br />
40%<br />
70%<br />
MALE<br />
30%<br />
FEMALE<br />
AVERAGE NON-FATAL<br />
DROWNING INCIDENTS<br />
25<br />
PER YEAR<br />
25<br />
UNDER THE AGE OF<br />
Figure 27<br />
<strong>20</strong><strong>10</strong>-15 and <strong>20</strong>15-<strong>20</strong> five year average non-fatal<br />
drownings and average non-fatal drowning rate per<br />
<strong>10</strong>0,000 pop. at beaches.<br />
When comparing the first half of the decade (<strong>20</strong><strong>10</strong>-<strong>20</strong>15)<br />
to the later (<strong>20</strong>15-<strong>20</strong><strong>20</strong>), there has been no change in the<br />
five year average number of non-fatal drownings (n=26) at<br />
beaches. The five year average non-fatal drowning rate has<br />
decreased from 0.58 in the first half of the decade to 0.54<br />
per <strong>10</strong>0,000 pop. in the later half.<br />
Non-Fatal Drownings (n)<br />
50<br />
40<br />
30<br />
<strong>20</strong><br />
<strong>10</strong><br />
0<br />
<strong>20</strong><strong>10</strong>-11<br />
<strong>20</strong><strong>10</strong>-15<br />
AVERAGE NON-FATAL<br />
DROWNING RATE<br />
0.58<br />
PER <strong>10</strong>0,000 POPULATION<br />
AVERAGE NON-FATAL<br />
DROWNINGS<br />
<strong>20</strong>11-12<br />
26<br />
PER YEAR<br />
Figure 28<br />
<strong>20</strong><strong>10</strong>-<strong>20</strong>: Non-fatal drowning incidents on beaches by<br />
year and gender (n=258).<br />
The greatest number of non-fatal drowning incidents at<br />
beaches occurred during <strong>20</strong>14-15 (n=41), followed by <strong>20</strong>19-<br />
<strong>20</strong> (n=32) and <strong>20</strong>18-19 (n=31). Every year from <strong>20</strong><strong>10</strong>-<br />
<strong>20</strong> the number of males involved in non-fatal drowning<br />
incidents exceeds females. Males account for 67% (n=174)<br />
of non-fatal drownings, whereas females account for 33%<br />
(n=84).<br />
Female<br />
Male<br />
<strong>20</strong>12-13<br />
<strong>20</strong>13-14<br />
<strong>20</strong>14-15<br />
<strong>Year</strong><br />
<strong>20</strong>15-<strong>20</strong><br />
AVERAGE NON-FATAL<br />
DROWNING RATE<br />
0.54<br />
PER <strong>10</strong>0,000 POPULATION<br />
AVERAGE NON-FATAL<br />
DROWNINGS<br />
<strong>20</strong>15-16<br />
26<br />
PER YEAR<br />
<strong>20</strong>16-17<br />
<strong>20</strong>17-18<br />
<strong>20</strong>18-19<br />
<strong>20</strong>19-<strong>20</strong><br />
SURF LIFE SAVING NEW ZEALAND<br />
32<br />
NATIONAL BEACH & COASTAL SAFETY REPORT
COMPARISON OF NON-FATAL AND<br />
FATAL DROWNINGS ON NEW ZEALAND<br />
BEACHES BETWEEN <strong>20</strong><strong>10</strong>-<strong>20</strong><br />
To calculate the ratio of fatal to non-fatal drowning<br />
incidents the total number (n=141*) of fatal beach drowning<br />
incidents (surf beach and calm water beach) was compared<br />
with the total number of non-fatal surf beach and calm<br />
water beach incidents (n=258).<br />
The average ratio of fatal to non-fatal drowning incidents<br />
from <strong>20</strong><strong>10</strong>-<strong>20</strong><strong>20</strong> is 1:1.8. This figure indicates that for<br />
every fatal beach drowning, there are 1.8 non-fatal beach<br />
drowning incidents.<br />
The ratio of fatal to non-fatal drowning incidents is<br />
variable across age groups. Infants and young children (0-4<br />
years old) have the highest ratio (1:9.5), which indicates<br />
that for every fatal beach drowning, there are 9.5 non-fatal<br />
drowning incidents. On the other end of the spectrum, the<br />
55-64 age group has the lowest ratio (1:0.5), indicating that<br />
for every beach drowning fatality, there are 0.5 non-fatal<br />
drownings.<br />
Figure 29<br />
<strong>20</strong><strong>10</strong>-<strong>20</strong>: Fatal and non-fatal drowning incidents on<br />
beaches by age groups (n=399).<br />
The greatest number of non-fatal drownings occurred in<br />
the 15-24 year age group (n=54), followed by 65+ (n=40)<br />
and 35-44 (n=32) age groups. The number of non-fatal<br />
drowning incidents exceeded fatal drowning incidents within<br />
the 0-24 year age groups. The number of fatal drowning<br />
incidents exceeded non-fatal drowning incidents in the 25-<br />
65+ year age groups.<br />
Drownings (n)<br />
60<br />
50<br />
40<br />
30<br />
<strong>20</strong><br />
Fatal Drownings<br />
Non-Fatal Drownings<br />
<strong>10</strong><br />
TOTAL FATAL<br />
DROWNINGS<br />
TOTAL NON-FATAL<br />
DROWNINGS<br />
141 * 258<br />
RATIO FATAL : NON-FATAL<br />
1 : 1.8<br />
0-4 YEARS OLD RATIO<br />
FATAL : NON-FATAL 1 : 9.5<br />
55-64 YEARS OLD RATIO<br />
FATAL : NON-FATAL 1 : 0.5<br />
0<br />
0-4 5-14 15-24 25-34 35-44 45-54 55-64 65+<br />
Age Groups (<strong>Year</strong>s)<br />
Figure 30<br />
<strong>20</strong><strong>10</strong>-<strong>20</strong>: Fatal and non-fatal drowning incidents on<br />
beaches by year (n=399).<br />
Except for <strong>20</strong>16-17, the number of non-fatal drowning<br />
incidents at beaches exceeds fatal drowning incidents.<br />
The combined fatal and non-fatal drowning incidents was<br />
highest in <strong>20</strong>14-15 (n=57), followed by <strong>20</strong>19-<strong>20</strong> (n=50) and<br />
<strong>20</strong>18-19 (n=48).<br />
60<br />
50<br />
Non-Fatal Drownings<br />
Fatal Drownings<br />
Except for <strong>20</strong>16-17, the<br />
number of non-fatal drowning<br />
incidents at beaches exceeds<br />
fatal drowning incidents.<br />
Drownings (n)<br />
40<br />
30<br />
<strong>20</strong><br />
<strong>10</strong><br />
0<br />
<strong>20</strong><strong>10</strong>-11<br />
<strong>20</strong>11-12<br />
<strong>20</strong>12-13<br />
<strong>20</strong>13-14<br />
<strong>20</strong>14-15<br />
<strong>Year</strong><br />
<strong>20</strong>15-16<br />
<strong>20</strong>16-17<br />
<strong>20</strong>17-18<br />
<strong>20</strong>18-19<br />
<strong>20</strong>19-<strong>20</strong><br />
SECTION FOUR NON-FATAL DROWNING ANALYSIS / <strong>10</strong> YEAR OVERVIEW <strong>20</strong>09-19<br />
33
REGIONAL OVERVIEWS<br />
NZ Regions<br />
SECTION FIVE<br />
Northland<br />
Auckland<br />
Bay of Plenty<br />
Waikato<br />
Gisborne<br />
Taranaki<br />
Hawke’s Bay<br />
Manawatu-Wanganui<br />
Tasman<br />
Nelson<br />
Wellington<br />
Marlborough<br />
West Coast<br />
Canterbury<br />
Otago<br />
Southland
NORTHLAND / TE TAI TOKERAU<br />
Figure 31<br />
<strong>20</strong><strong>10</strong>-<strong>20</strong>: Northland Region beach and coastal fatal<br />
drownings and fatal drowning rate per <strong>10</strong>0,000<br />
population (n=57).<br />
During <strong>20</strong>19-<strong>20</strong>, there were eight beach and coastal<br />
drowning fatalities within the Northland Region, which is less<br />
than the ten-year average of six per year. The <strong>20</strong>19-<strong>20</strong> fatal<br />
drowning rate (4.22 per <strong>10</strong>0,000 pop.) was greater than the<br />
ten-year average (3.04 per <strong>10</strong>0,000 pop.).<br />
Figure 32<br />
<strong>20</strong><strong>10</strong>-<strong>20</strong>: Northland Region beach and coastal<br />
drownings by activity (n=57).<br />
Within the Northland Region during <strong>20</strong><strong>10</strong>-<strong>20</strong>, the majority<br />
of beach and coastal drowning fatalities occurred while<br />
swimming/wading (n=13), followed by using watercraft<br />
(n=11) and net/shell fishing (n=<strong>10</strong>).<br />
Fatal Drownings (n)<br />
<strong>10</strong><br />
9<br />
8<br />
7<br />
6<br />
5<br />
4<br />
3<br />
2<br />
1<br />
0<br />
<strong>20</strong><strong>10</strong>-11<br />
Fatal Drownings<br />
Fatal Drowning Rate<br />
<strong>20</strong>11-12<br />
<strong>20</strong>12-13<br />
<strong>20</strong>13-14<br />
<strong>20</strong>14-15<br />
<strong>20</strong>15-16<br />
<strong>Year</strong><br />
<strong>20</strong>16-17<br />
<strong>20</strong>17-18<br />
<strong>20</strong>18-19<br />
<strong>20</strong>19-<strong>20</strong><br />
4.5<br />
4.0<br />
3.5<br />
3.0<br />
2.5<br />
2.0<br />
1.5<br />
1.0<br />
0.5<br />
0.0<br />
Fatal Drowning Rate<br />
(per <strong>10</strong>0,000 pop.)<br />
5%<br />
7%<br />
7%<br />
12%<br />
5%<br />
4%<br />
23%<br />
Swimming/<br />
Wading<br />
18%<br />
23%<br />
19%<br />
Swimming/Wading<br />
Watercraft<br />
Net/Shell Fishing<br />
Boating<br />
Falls<br />
Snorkelling<br />
Attempting a Rescue<br />
Land Based Fishing<br />
Scuba Diving<br />
Figure 33<br />
Comparison of beach and coastal fatal drowning rates (per <strong>10</strong>0,000 pop.) by activity in the Northland Region:<br />
<strong>20</strong><strong>10</strong>-<strong>20</strong> (ten-year average) and <strong>20</strong>19-<strong>20</strong>.<br />
Within the Northland Region the <strong>20</strong>19-<strong>20</strong> fatal drowning rates (per <strong>10</strong>0,000 pop.) for swimming/wading, falls, watercraft,<br />
snorkelling, net/shell and land based fishing activities were less than their respective ten-year averages. However, the <strong>20</strong>19-<br />
<strong>20</strong> fatal drowning rates for boating and attempting a rescue activities were greater than the ten-year average.<br />
SWIMMING / WADING<br />
SNORKELLING<br />
FALL<br />
<strong>20</strong><strong>10</strong>-<strong>20</strong><br />
0.76<br />
<strong>20</strong>19-<strong>20</strong><br />
0.53<br />
<strong>20</strong><strong>10</strong>-<strong>20</strong><br />
0.23<br />
LAND BASED FISHING<br />
<strong>20</strong>19-<strong>20</strong><br />
0.00<br />
BOATING<br />
<strong>20</strong><strong>10</strong>-<strong>20</strong><br />
0.22<br />
<strong>20</strong>19-<strong>20</strong><br />
0.00<br />
<strong>20</strong><strong>10</strong>-<strong>20</strong><br />
0.18<br />
NET / SHELL FISHING<br />
<strong>20</strong>19-<strong>20</strong><br />
0.00<br />
WATERCRAFT<br />
<strong>20</strong><strong>10</strong>-<strong>20</strong><br />
0.38<br />
<strong>20</strong>19-<strong>20</strong><br />
1.58<br />
<strong>20</strong><strong>10</strong>-<strong>20</strong><br />
0.59<br />
ATTEMPTING A RESCUE<br />
<strong>20</strong>19-<strong>20</strong><br />
0.53<br />
<strong>20</strong><strong>10</strong>-<strong>20</strong><br />
0.63<br />
<strong>20</strong>19-<strong>20</strong><br />
0.53<br />
<strong>20</strong><strong>10</strong>-<strong>20</strong><br />
0.17<br />
<strong>20</strong>19-<strong>20</strong><br />
0.53<br />
36<br />
SURF LIFE SAVING NEW ZEALAND NATIONAL BEACH AND COASTAL SAFETY REPORT
FATAL DROWNING SNAPSHOT<br />
<strong>10</strong>-YEAR OVERVIEW | <strong>20</strong><strong>10</strong>-<strong>20</strong> 1-YEAR OVERVIEW | <strong>20</strong>19-<strong>20</strong><br />
FATAL DROWNINGS<br />
AVERAGE FATALITY<br />
8 4.22<br />
FATAL DROWNINGS BY LOCATION<br />
PER <strong>10</strong>0,000 POPULATION<br />
13%<br />
13%<br />
57<br />
Attempting a Rescue<br />
Boating<br />
Diving / Jumping<br />
Fall<br />
Net / Shell Fishing<br />
Rock Fishing<br />
Scuba Diving<br />
Snorkeling<br />
Swimming / Wading<br />
Watercraft<br />
25%<br />
50%<br />
Surf <strong>Beach</strong><br />
50%<br />
TOTAL FATAL DROWNINGS: 57<br />
AVERAGE FATAL DROWNINGS<br />
6<br />
PER YEAR<br />
AVERAGE FATALITY<br />
3.04<br />
PER <strong>10</strong>0,000 POPULATION<br />
Surf <strong>Beach</strong><br />
0-1 Km from Shore<br />
FATAL DROWNINGS BY ACTIVITY<br />
Harbour<br />
River/Harbour Bar<br />
KEY DEMOGRAPHIC<br />
45+ 45+<br />
YEAR OLD MALES<br />
SWIMMERS/WADERS<br />
81%<br />
MALE<br />
19%<br />
FEMALE<br />
YEAR OLD MALES<br />
WATERCRAFT<br />
13%<br />
13%<br />
13%<br />
38%<br />
Boating<br />
13%<br />
Boating<br />
Attempting a Rescue<br />
Net/Shell Fishing<br />
13%<br />
38%<br />
Scuba Diving<br />
Swimming/Wading<br />
Watercraft
AUCKLAND / TAMAKI-MAKAU-RAU<br />
Figure 34<br />
<strong>20</strong><strong>10</strong>-<strong>20</strong>: Auckland Region beach and coastal fatal<br />
drownings and fatal drowning rate per <strong>10</strong>0,000<br />
population (n=98).<br />
During <strong>20</strong>19-<strong>20</strong>, there were thirteen beach and coastal<br />
drowning fatalities within the Auckland Region, which is<br />
greater than the ten-year average of ten per year. The <strong>20</strong>19-<br />
<strong>20</strong> fatal drowning rate (0.77 per <strong>10</strong>0,000 pop.) was greater<br />
than the ten-year average (0.63 per <strong>10</strong>0,000 pop.).<br />
Figure 35<br />
<strong>20</strong><strong>10</strong>-<strong>20</strong>: Auckland Region beach and coastal<br />
drownings by activity (n=98).<br />
Within the Auckland Region during <strong>20</strong><strong>10</strong>-<strong>20</strong>, the majority<br />
of beach and coastal drowning fatalities occurred while<br />
swimming/wading (n=27), followed by boating (n=26) and<br />
falls (n=18).<br />
Fatal Drownings (n)<br />
<strong>20</strong><br />
<strong>20</strong><br />
15<br />
15<br />
<strong>10</strong><br />
<strong>10</strong><br />
5<br />
5<br />
0<br />
<strong>20</strong><strong>10</strong>-11<br />
Fatal Drownings<br />
Fatal Drowning Rate<br />
<strong>20</strong>11-12<br />
<strong>20</strong>12-13<br />
<strong>20</strong>13-14<br />
<strong>20</strong>14-15<br />
<strong>20</strong>15-16<br />
<strong>Year</strong><br />
<strong>20</strong>16-17<br />
<strong>20</strong>17-18<br />
<strong>20</strong>18-19<br />
<strong>20</strong>19-<strong>20</strong><br />
1.2<br />
1.0<br />
0.8<br />
0.6<br />
0.4<br />
0.2<br />
0.0<br />
Fatal Drowning Rate<br />
(per <strong>10</strong>0,000 pop.)<br />
11%<br />
<strong>10</strong>%<br />
3%<br />
3%<br />
17%<br />
2%<br />
1% 1% 1%<br />
22%<br />
28%<br />
Swimming/Wading<br />
Boating<br />
Fall<br />
Watercraft<br />
Land Based Fishing<br />
Attempting a Rescue<br />
Snorkelling<br />
Scuba Diving<br />
Diving/Jumping<br />
Net/Shell Fishing<br />
Unknown<br />
Figure 36<br />
Comparison of beach and coastal fatal drowning rates (per <strong>10</strong>0,000 pop.) by activity in the Auckland Region:<br />
<strong>20</strong><strong>10</strong>-<strong>20</strong> (ten-year average) and <strong>20</strong>19-<strong>20</strong>.<br />
Within the Auckland Region the <strong>20</strong>19-<strong>20</strong> fatal drowning rates (per <strong>10</strong>0,000 pop.) for falls, boating, snorkelling, net/shell<br />
fishing and attempting a rescue activities were less than their respective ten-year averages. However, the <strong>20</strong>19-<strong>20</strong> fatal<br />
drowning rates for watercraft and land-based fishing activities were greater than the ten-year average.<br />
SWIMMING / WADING<br />
SNORKELLING<br />
FALL<br />
<strong>20</strong><strong>10</strong>-<strong>20</strong><br />
0.18<br />
<strong>20</strong>19-<strong>20</strong><br />
0.18<br />
<strong>20</strong><strong>10</strong>-<strong>20</strong><br />
0.02<br />
LAND BASED FISHING<br />
<strong>20</strong>19-<strong>20</strong><br />
0.00<br />
BOATING<br />
<strong>20</strong><strong>10</strong>-<strong>20</strong><br />
0.12<br />
<strong>20</strong>19-<strong>20</strong><br />
0.06<br />
<strong>20</strong><strong>10</strong>-<strong>20</strong><br />
0.05<br />
NET / SHELL FISHING<br />
<strong>20</strong>19-<strong>20</strong><br />
0.24<br />
WATERCRAFT<br />
<strong>20</strong><strong>10</strong>-<strong>20</strong><br />
0.17<br />
<strong>20</strong>19-<strong>20</strong><br />
0.12<br />
<strong>20</strong><strong>10</strong>-<strong>20</strong><br />
0.01<br />
ATTEMPTING A RESCUE<br />
<strong>20</strong>19-<strong>20</strong><br />
0.00<br />
<strong>20</strong><strong>10</strong>-<strong>20</strong><br />
0.05<br />
<strong>20</strong>19-<strong>20</strong><br />
0.12<br />
<strong>20</strong><strong>10</strong>-<strong>20</strong><br />
0.02<br />
<strong>20</strong>19-<strong>20</strong><br />
0.00<br />
38<br />
SURF LIFE SAVING NEW ZEALAND NATIONAL BEACH AND COASTAL SAFETY REPORT
FATAL DROWNING SNAPSHOT<br />
<strong>10</strong>-YEAR OVERVIEW | <strong>20</strong><strong>10</strong>-<strong>20</strong> 1-YEAR OVERVIEW | <strong>20</strong>19-<strong>20</strong><br />
Auckland <strong>20</strong><strong>10</strong>-<strong>20</strong><strong>20</strong> Drownings<br />
FATAL DROWNINGS<br />
AVERAGE FATALITY<br />
13 0.77<br />
FATAL DROWNINGS BY LOCATION<br />
PER <strong>10</strong>0,000 POPULATION<br />
8%<br />
8%<br />
8%<br />
38%<br />
98<br />
Attempting a Rescue<br />
Boating<br />
Diving / Jumping<br />
Fall<br />
Net / Shell Fishing<br />
Rock Fishing<br />
Scuba Diving<br />
Snorkeling<br />
Swimming / Wading<br />
Watercraft<br />
15%<br />
38%<br />
Surf <strong>Beach</strong><br />
TOTAL FATAL DROWNINGS: 98<br />
23%<br />
AVERAGE FATAL DROWNINGS<br />
<strong>10</strong><br />
PER YEAR<br />
AVERAGE FATALITY<br />
0.63<br />
PER <strong>10</strong>0,000 POPULATION<br />
Surf <strong>Beach</strong> Rocky Foreshore Estuary<br />
Harbour Calm Water Beaach River<br />
FATAL DROWNINGS BY ACTIVITY<br />
91%<br />
MALE<br />
8%<br />
8%<br />
31%<br />
9%<br />
FEMALE<br />
23%<br />
31%<br />
Land Based<br />
Fishing<br />
31%<br />
Watercratf<br />
KEY DEMOGRAPHIC<br />
15+ 25+<br />
YEAR OLD MALES<br />
SWIMMING/WADING<br />
YEAR OLD MALES<br />
BOATING<br />
Land Based Fishing<br />
Watercraft<br />
Swimming/Wading<br />
31%<br />
Fall<br />
Unknown
WAIKATO<br />
Figure 37<br />
<strong>20</strong><strong>10</strong>-<strong>20</strong>: Waikato Region beach and coastal fatal<br />
drownings and fatal drowning rate per <strong>10</strong>0,000<br />
population (n=45).<br />
During <strong>20</strong>19-<strong>20</strong>, there were four beach and coastal<br />
drowning fatalities within the Waikato Region, which equals<br />
the ten-year average of four per year. The <strong>20</strong>19-<strong>20</strong> fatal<br />
drowning rate (0.82 per <strong>10</strong>0,000 pop.) was less than the<br />
ten-year average (1.02 per <strong>10</strong>0,000 pop.).<br />
Figure 38<br />
<strong>20</strong><strong>10</strong>-<strong>20</strong>: Waikato Region beach and coastal drownings<br />
by activity (n=45).<br />
Within the Waikato Region during <strong>20</strong><strong>10</strong>-<strong>20</strong>, the majority<br />
of beach and coastal drowning fatalities occurred while<br />
swimming/wading (n=11), followed by land-based fishing<br />
(n=8) and falls (n=6).<br />
Fatal Drownings (n)<br />
<strong>10</strong><br />
9<br />
8<br />
7<br />
6<br />
5<br />
4<br />
3<br />
2<br />
1<br />
0<br />
<strong>20</strong><strong>10</strong>-11<br />
Fatal Drownings<br />
Fatal Drowning Rate<br />
<strong>20</strong>11-12<br />
<strong>20</strong>12-13<br />
<strong>20</strong>13-14<br />
<strong>20</strong>14-15<br />
<strong>20</strong>15-16<br />
<strong>Year</strong><br />
<strong>20</strong>16-17<br />
<strong>20</strong>17-18<br />
<strong>20</strong>18-19<br />
<strong>20</strong>19-<strong>20</strong><br />
2.0<br />
1.8<br />
1.6<br />
1.4<br />
1.2<br />
1.0<br />
0.8<br />
0.6<br />
0.4<br />
0.2<br />
0.0<br />
Fatal Drowning Rate<br />
(per <strong>10</strong>0,000 pop.)<br />
9%<br />
9%<br />
7%<br />
11%<br />
2% 2%2%2%<br />
24%<br />
Swimming/<br />
Wading<br />
13%<br />
24%<br />
18%<br />
Swimming/Wading<br />
Land Based Fishing<br />
Falls<br />
Boating<br />
Net/Shell Fishing<br />
Snorkelling<br />
Scuba Diving<br />
Attempting a Rescue<br />
Diving/Jumping<br />
Watercraft<br />
Unknown<br />
Figure 39<br />
Comparison of beach and coastal fatal drowning rates (per <strong>10</strong>0,000 pop.) by activity in the Waikato Region:<br />
<strong>20</strong><strong>10</strong>-<strong>20</strong> (ten-year average) and <strong>20</strong>19-<strong>20</strong>.<br />
Within the Waikato Region the <strong>20</strong>19-<strong>20</strong> fatal drowning rates (per <strong>10</strong>0,000 pop.) for swimming/wading, falls, watercraft,<br />
snorkelling, land-based fishing, net/shell fishing and attempting a rescue activities were less than their respective ten-year<br />
averages. However, the <strong>20</strong>19-<strong>20</strong> fatal drowning rate for boating activities was greater than the ten-year average.<br />
SWIMMING / WADING<br />
SNORKELLING<br />
FALL<br />
<strong>20</strong><strong>10</strong>-<strong>20</strong><br />
0.25<br />
<strong>20</strong>19-<strong>20</strong><br />
0.21<br />
<strong>20</strong><strong>10</strong>-<strong>20</strong><br />
0.<strong>10</strong><br />
LAND BASED FISHING<br />
<strong>20</strong>19-<strong>20</strong><br />
0.00<br />
BOATING<br />
<strong>20</strong><strong>10</strong>-<strong>20</strong><br />
0.14<br />
<strong>20</strong>19-<strong>20</strong><br />
0.00<br />
<strong>20</strong><strong>10</strong>-<strong>20</strong><br />
0.18<br />
NET / SHELL FISHING<br />
<strong>20</strong>19-<strong>20</strong><br />
0.00<br />
WATERCRAFT<br />
<strong>20</strong><strong>10</strong>-<strong>20</strong><br />
0.11<br />
<strong>20</strong>19-<strong>20</strong><br />
0.21<br />
<strong>20</strong><strong>10</strong>-<strong>20</strong><br />
0.11<br />
ATTEMPTING A RESCUE<br />
<strong>20</strong>19-<strong>20</strong><br />
0.00<br />
<strong>20</strong><strong>10</strong>-<strong>20</strong><br />
0.02<br />
<strong>20</strong>19-<strong>20</strong><br />
0.00<br />
<strong>20</strong><strong>10</strong>-<strong>20</strong><br />
0.02<br />
<strong>20</strong>19-<strong>20</strong><br />
0.00<br />
40<br />
SURF LIFE SAVING NEW ZEALAND NATIONAL BEACH AND COASTAL SAFETY REPORT
FATAL DROWNING SNAPSHOT<br />
<strong>10</strong>-YEAR OVERVIEW | <strong>20</strong><strong>10</strong>-<strong>20</strong> 1-YEAR OVERVIEW | <strong>20</strong>19-<strong>20</strong><br />
FATAL DROWNINGS<br />
AVERAGE FATALITY<br />
4 0.82<br />
PER <strong>10</strong>0,000 POPULATION<br />
FATAL DROWNINGS BY LOCATION<br />
25%<br />
45<br />
Attempting a Rescue<br />
Boating<br />
Diving / Jumping<br />
Fall<br />
Net / Shell Fishing<br />
Rock Fishing<br />
Scuba Diving<br />
Snorkeling<br />
Swimming / Wading<br />
Watercraft<br />
50%<br />
0-1Km<br />
From Shore<br />
50%<br />
TOTAL FATAL DROWNINGS: 45<br />
25%<br />
AVERAGE FATAL DROWNINGS<br />
4<br />
PER YEAR<br />
KEY DEMOGRAPHIC<br />
15-34<br />
YEAR OLD MALES<br />
89%<br />
MALE<br />
11%<br />
FEMALE<br />
AVERAGE FATALITY<br />
1.02<br />
PER <strong>10</strong>0,000 POPULATION<br />
SWIMMING/WADING<br />
0-1Km From Shore Harbour Surf <strong>Beach</strong><br />
FATAL DROWNINGS BY ACTIVITY<br />
25%<br />
25%<br />
? 25%<br />
25%<br />
Unknown Watercraft<br />
25% 25%<br />
Scuba<br />
Diving<br />
Watercraft<br />
Swimming/Wading<br />
Swimming/<br />
Wading<br />
25%<br />
25%<br />
Scuba Diving<br />
Unknown
BAY OF PLENTY / TE MOANA-A-TOI<br />
Figure 40<br />
<strong>20</strong><strong>10</strong>-<strong>20</strong>: Bay of Plenty Region beach and coastal<br />
fatal drownings and fatal drowning rate per <strong>10</strong>0,000<br />
population (n=33).<br />
During <strong>20</strong>19-<strong>20</strong>, there were three beach and coastal<br />
drowning fatalities within the Bay of Plenty Region, which<br />
equals the ten-year average of three per year. The <strong>20</strong>19-<strong>20</strong><br />
fatal drowning rate (0.91 per <strong>10</strong>0,000 pop.) was less than<br />
the ten-year average (1.13 per <strong>10</strong>0,000 pop.).<br />
Figure 41<br />
<strong>20</strong><strong>10</strong>-<strong>20</strong>: Bay of Plenty Region beach and coastal<br />
drownings by activity (n=33).<br />
Within the Bay of Plenty Region during <strong>20</strong><strong>10</strong>-<strong>20</strong>, the<br />
majority of beach and coastal drowning fatalities were falls<br />
(n=7), followed by boating (n=6) and swimming/wading<br />
(n=6).<br />
Fatal Drownings (n)<br />
7<br />
6<br />
5<br />
4<br />
3<br />
2<br />
1<br />
0<br />
<strong>20</strong><strong>10</strong>-11<br />
Fatal Drownings<br />
Fatal Drowning Rate<br />
<strong>20</strong>11-12<br />
<strong>20</strong>12-13<br />
<strong>20</strong>13-14<br />
<strong>20</strong>14-15<br />
<strong>20</strong>15-16<br />
<strong>Year</strong><br />
<strong>20</strong>16-17<br />
<strong>20</strong>17-18<br />
<strong>20</strong>18-19<br />
<strong>20</strong>19-<strong>20</strong><br />
2.5<br />
2.0<br />
1.5<br />
1.0<br />
0.5<br />
0.0<br />
Fatal Drowning Rate<br />
(per <strong>10</strong>0,000 pop.)<br />
8%<br />
8%<br />
8%<br />
21%<br />
4% 4%<br />
25%<br />
Falls<br />
25%<br />
21%<br />
Falls<br />
Boating<br />
Swimming/Wading<br />
Land Based Fishing<br />
Snorkelling<br />
Watercraft<br />
Attempting a Rescue<br />
Net/Shell Fishing<br />
Figure 42<br />
Comparison of beach and coastal fatal drowning rates (per <strong>10</strong>0,000 pop.) by activity in the Bay of Plenty Region:<br />
<strong>20</strong><strong>10</strong>-<strong>20</strong> (ten-year average) and <strong>20</strong>19-<strong>20</strong>.<br />
Within the Bay of Plenty Region the <strong>20</strong>19-<strong>20</strong> fatal drowning rates (per <strong>10</strong>0,000 pop.) for falls, boating, watercraft,<br />
snorkelling, land-based fishing and attempting a rescue activities were less than their respective ten-year averages. However,<br />
the <strong>20</strong>19-<strong>20</strong> fatal drowning rates for swimming/wading and net/shell fishing were greater than the ten-year average.<br />
SWIMMING / WADING<br />
SNORKELLING<br />
FALL<br />
<strong>20</strong><strong>10</strong>-<strong>20</strong><br />
0.<strong>20</strong><br />
<strong>20</strong>19-<strong>20</strong><br />
0.61<br />
<strong>20</strong><strong>10</strong>-<strong>20</strong><br />
0.<strong>10</strong><br />
LAND BASED FISHING<br />
<strong>20</strong>19-<strong>20</strong><br />
0.30<br />
BOATING<br />
<strong>20</strong><strong>10</strong>-<strong>20</strong><br />
0.24<br />
<strong>20</strong>19-<strong>20</strong><br />
0.00<br />
<strong>20</strong><strong>10</strong>-<strong>20</strong><br />
0.<strong>10</strong><br />
NET / SHELL FISHING<br />
<strong>20</strong>19-<strong>20</strong><br />
0.00<br />
WATERCRAFT<br />
<strong>20</strong><strong>10</strong>-<strong>20</strong><br />
0.21<br />
<strong>20</strong>19-<strong>20</strong><br />
0.00<br />
<strong>20</strong><strong>10</strong>-<strong>20</strong><br />
0.08<br />
ATTEMPTING A RESCUE<br />
<strong>20</strong>19-<strong>20</strong><br />
0.30<br />
<strong>20</strong><strong>10</strong>-<strong>20</strong><br />
0.07<br />
<strong>20</strong>19-<strong>20</strong><br />
0.00<br />
<strong>20</strong><strong>10</strong>-<strong>20</strong><br />
0.11<br />
<strong>20</strong>19-<strong>20</strong><br />
0.00<br />
42<br />
SURF LIFE SAVING NEW ZEALAND NATIONAL BEACH AND COASTAL SAFETY REPORT
FATAL DROWNING SNAPSHOT<br />
<strong>10</strong>-YEAR OVERVIEW | <strong>20</strong><strong>10</strong>-<strong>20</strong> 1-YEAR OVERVIEW | <strong>20</strong>19-<strong>20</strong><br />
FATAL DROWNINGS<br />
AVERAGE FATALITY<br />
3 0.91<br />
PER <strong>10</strong>0,000 POPULATION<br />
FATAL DROWNINGS BY LOCATION<br />
33<br />
Attempting a Rescue<br />
Boating<br />
Diving / Jumping<br />
Fall<br />
Net / Shell Fishing<br />
Rock Fishing<br />
Scuba Diving<br />
Snorkeling<br />
Swimming / Wading<br />
Watercraft<br />
TOTAL FATAL DROWNINGS: 33<br />
33%<br />
67%<br />
Surf <strong>Beach</strong><br />
67%<br />
AVERAGE FATAL DROWNINGS<br />
3<br />
PER YEAR<br />
KEY DEMOGRAPHIC<br />
15+<br />
85%<br />
MALE<br />
15%<br />
FEMALE<br />
AVERAGE FATALITY<br />
1.13<br />
PER <strong>10</strong>0,000 POPULATION<br />
Surf <strong>Beach</strong><br />
Rocky Foreshore<br />
FATAL DROWNINGS BY ACTIVITY<br />
33%<br />
67%<br />
Swimming/<br />
Wading<br />
67%<br />
YEAR OLD MALES<br />
FALLS<br />
Swimming/Wading<br />
Net/Shell Fishing
GISBORNE / TE TAI RAWHITI<br />
Figure 43<br />
<strong>20</strong><strong>10</strong>-<strong>20</strong>: Gisborne Region beach and coastal fatal<br />
drownings and fatal drowning rate per <strong>10</strong>0,000<br />
population (n=8).<br />
During <strong>20</strong>19-<strong>20</strong>, there was one beach and coastal drowning<br />
fatality within the Gisborne Region, which is the greater than<br />
the ten-year average of less than one per year. The <strong>20</strong>19-<strong>20</strong><br />
fatal drowning rate (2.00 per <strong>10</strong>0,000 pop.) was greater<br />
than the ten-year average (1.67 per <strong>10</strong>0,000 pop.).<br />
Figure 44<br />
<strong>20</strong><strong>10</strong>-<strong>20</strong>: Gisborne Region beach and coastal<br />
drownings by activity (n=8).<br />
Within the Gisborne Region during <strong>20</strong><strong>10</strong>-<strong>20</strong>, beach and<br />
coastal drowning fatalities were attributed to snorkelling<br />
(n=4), attempting a rescue (n=1), diving/jumping (n=1),<br />
swimming / wading (n=1) and watercraft (n=1) activities.<br />
4<br />
Fatal Drownings<br />
Fatal Drowning Rate<br />
7<br />
6<br />
13%<br />
Fatal Drownings (n)<br />
3<br />
2<br />
1<br />
5<br />
4<br />
3<br />
2<br />
1<br />
Fatal Drowning Rate<br />
(per <strong>10</strong>0,000 pop.)<br />
13%<br />
13%<br />
50%<br />
Snorkelling<br />
50%<br />
Snorkelling<br />
Attempting a Rescue<br />
Diving/Jumping<br />
Swimming/Wading<br />
Watercraft<br />
0<br />
<strong>20</strong><strong>10</strong>-11<br />
<strong>20</strong>11-12<br />
<strong>20</strong>12-13<br />
<strong>20</strong>13-14<br />
<strong>20</strong>14-15<br />
<strong>20</strong>15-16<br />
<strong>Year</strong><br />
<strong>20</strong>16-17<br />
<strong>20</strong>17-18<br />
<strong>20</strong>18-19<br />
<strong>20</strong>19-<strong>20</strong><br />
0<br />
13%<br />
Figure 45<br />
Comparison of beach and coastal fatal drowning rates (per <strong>10</strong>0,000 pop.) by activity in the Gisborne Region:<br />
<strong>20</strong><strong>10</strong>-<strong>20</strong> (ten-year average) and <strong>20</strong>19-<strong>20</strong>.<br />
Within the Gisborne Region the <strong>20</strong>19-<strong>20</strong> fatal drowning rate (per <strong>10</strong>0,000 pop.) for swimming / wading, watercraft and<br />
attempting a rescue activities was less than their respective ten-year average. However, the <strong>20</strong>19-<strong>20</strong> fatal drowning rate for<br />
snorkelling activities was greater than the ten-year average.<br />
SWIMMING / WADING<br />
SNORKELLING<br />
FALL<br />
<strong>20</strong><strong>10</strong>-<strong>20</strong><br />
0.21<br />
<strong>20</strong>19-<strong>20</strong><br />
0.00<br />
<strong>20</strong><strong>10</strong>-<strong>20</strong><br />
0.82<br />
LAND BASED FISHING<br />
<strong>20</strong>19-<strong>20</strong><br />
2.00<br />
BOATING<br />
<strong>20</strong><strong>10</strong>-<strong>20</strong><br />
0.00<br />
<strong>20</strong>19-<strong>20</strong><br />
0.00<br />
<strong>20</strong><strong>10</strong>-<strong>20</strong><br />
0.00<br />
NET / SHELL FISHING<br />
<strong>20</strong>19-<strong>20</strong><br />
0.00<br />
WATERCRAFT<br />
<strong>20</strong><strong>10</strong>-<strong>20</strong><br />
0.00<br />
<strong>20</strong>19-<strong>20</strong><br />
0.00<br />
<strong>20</strong><strong>10</strong>-<strong>20</strong><br />
0.00<br />
ATTEMPTING A RESCUE<br />
<strong>20</strong>19-<strong>20</strong><br />
0.00<br />
<strong>20</strong><strong>10</strong>-<strong>20</strong><br />
0.21<br />
<strong>20</strong>19-<strong>20</strong><br />
0.00<br />
<strong>20</strong><strong>10</strong>-<strong>20</strong><br />
0.21<br />
<strong>20</strong>19-<strong>20</strong><br />
0.00<br />
44<br />
SURF LIFE SAVING NEW ZEALAND NATIONAL BEACH AND COASTAL SAFETY REPORT
FATAL DROWNING SNAPSHOT<br />
<strong>10</strong>-YEAR OVERVIEW | <strong>20</strong><strong>10</strong>-<strong>20</strong> 1-YEAR OVERVIEW | <strong>20</strong>19-<strong>20</strong><br />
FATAL DROWNINGS<br />
AVERAGE FATALITY<br />
1 2.00<br />
PER <strong>10</strong>0,000 POPULATION<br />
FATAL DROWNINGS BY LOCATION<br />
8<br />
Attempting a Rescue<br />
Boating<br />
Diving / Jumping<br />
Fall<br />
AVERAGE FATAL DROWNINGS<br />
HAWKE’S BAY / TE MATAU-A-MAUI<br />
Figure 46<br />
<strong>20</strong><strong>10</strong>-<strong>20</strong>: Hawke’s Bay Region beach and coastal<br />
fatal drownings and fatal drowning rate per <strong>10</strong>0,000<br />
population (n=<strong>20</strong>).<br />
During <strong>20</strong>19-<strong>20</strong>, there was one beach and coastal drowning<br />
fatality within the Hawke’s Bay Region, which is less than<br />
the ten-year average of two per year. The <strong>20</strong>19-<strong>20</strong> fatal<br />
drowning rate (1.22 per <strong>10</strong>0,000 pop.) is less than the tenyear<br />
average (2.00 per <strong>10</strong>0,000 pop.).<br />
Figure 47<br />
<strong>20</strong><strong>10</strong>-<strong>20</strong>: Hawke’s Bay Region beach and coastal<br />
drownings by activity (n=<strong>20</strong>).<br />
Within the Hawke’s Bay Region during <strong>20</strong><strong>10</strong>-<strong>20</strong>, the majority<br />
of beach and coastal drowning fatalities occurred as a fall<br />
(n=6) attempting a rescue (n=5), followed by swimming/<br />
wading (n=4).<br />
Fatal Drownings (n)<br />
5<br />
4<br />
3<br />
2<br />
1<br />
0<br />
<strong>20</strong><strong>10</strong>-11<br />
Fatal Drownings<br />
Fatal Drowning Rate<br />
<strong>20</strong>11-12<br />
<strong>20</strong>12-13<br />
<strong>20</strong>13-14<br />
<strong>20</strong>14-15<br />
<strong>20</strong>15-16<br />
<strong>Year</strong><br />
<strong>20</strong>16-17<br />
<strong>20</strong>17-18<br />
<strong>20</strong>18-19<br />
<strong>20</strong>19-<strong>20</strong><br />
3.0<br />
2.5<br />
2.0<br />
1.5<br />
1.0<br />
0.5<br />
0.0<br />
Fatal Drowning Rate<br />
(per <strong>10</strong>0,000 pop.)<br />
<strong>10</strong>%<br />
<strong>20</strong>%<br />
<strong>10</strong>%<br />
5%<br />
30%<br />
Falls<br />
25%<br />
30%<br />
Falls<br />
Attempting a Rescue<br />
Swimming/Wading<br />
Boating<br />
Scuba Diving<br />
Land Based Fishing<br />
Figure 48<br />
Comparison of beach and coastal fatal drowning rates (per <strong>10</strong>0,000 pop.) by activity in the Hawke’s Bay Region:<br />
<strong>20</strong><strong>10</strong>-<strong>20</strong> (ten-year average) and <strong>20</strong>19-<strong>20</strong>.<br />
Within the Hawke’s Bay Region the <strong>20</strong>19-<strong>20</strong> fatal drowning rates (per <strong>10</strong>0,000 pop.) for swimming/wading, boating,<br />
watercraft, land-based fishing and attempting rescue activities were less than their respective ten-year averages. However,<br />
the <strong>20</strong>19-<strong>20</strong> fatal drowning rate for falls was greater than the ten-year average.<br />
SWIMMING / WADING<br />
SNORKELLING<br />
FALL<br />
<strong>20</strong><strong>10</strong>-<strong>20</strong><br />
0.24<br />
<strong>20</strong>19-<strong>20</strong><br />
0.00<br />
<strong>20</strong><strong>10</strong>-<strong>20</strong><br />
0.00<br />
LAND BASED FISHING<br />
<strong>20</strong>19-<strong>20</strong><br />
0.00<br />
BOATING<br />
<strong>20</strong><strong>10</strong>-<strong>20</strong><br />
0.37<br />
<strong>20</strong>19-<strong>20</strong><br />
0.57<br />
<strong>20</strong><strong>10</strong>-<strong>20</strong><br />
0.06<br />
NET / SHELL FISHING<br />
<strong>20</strong>19-<strong>20</strong><br />
0.00<br />
WATERCRAFT<br />
<strong>20</strong><strong>10</strong>-<strong>20</strong><br />
0.12<br />
<strong>20</strong>19-<strong>20</strong><br />
0.00<br />
<strong>20</strong><strong>10</strong>-<strong>20</strong><br />
0.00<br />
ATTEMPTING A RESCUE<br />
<strong>20</strong>19-<strong>20</strong><br />
0.00<br />
<strong>20</strong><strong>10</strong>-<strong>20</strong><br />
0.00<br />
<strong>20</strong>19-<strong>20</strong><br />
0.00<br />
<strong>20</strong><strong>10</strong>-<strong>20</strong><br />
0.31<br />
<strong>20</strong>19-<strong>20</strong><br />
0.00<br />
46<br />
SURF LIFE SAVING NEW ZEALAND NATIONAL BEACH AND COASTAL SAFETY REPORT
FATAL DROWNING SNAPSHOT<br />
<strong>10</strong>-YEAR OVERVIEW | <strong>20</strong><strong>10</strong>-<strong>20</strong> 1-YEAR OVERVIEW | <strong>20</strong>19-<strong>20</strong><br />
FATAL DROWNINGS<br />
AVERAGE FATALITY<br />
1 0.57<br />
PER <strong>10</strong>0,000 POPULATION<br />
FATAL DROWNINGS BY LOCATION<br />
<strong>20</strong><br />
Attempting a Rescue<br />
Boating<br />
Diving / Jumping<br />
Fall<br />
AVERAGE FATAL DROWNINGS<br />
2<br />
PER YEAR<br />
KEY DEMOGRAPHIC<br />
0-24<br />
YEAR OLD MALES<br />
Net / Shell Fishing<br />
Rock Fishing<br />
Scuba Diving<br />
Snorkeling<br />
75%<br />
MALE<br />
25%<br />
FEMALE<br />
Swimming / Wading<br />
Watercraft<br />
TOTAL FATAL DROWNINGS: <strong>20</strong><br />
AVERAGE FATALITY<br />
1.22<br />
PER <strong>10</strong>0,000 POPULATION<br />
FALLS<br />
<strong>10</strong>0%<br />
Surf <strong>Beach</strong><br />
FATAL DROWNINGS BY ACTIVITY<br />
<strong>10</strong>0%<br />
Falls
TARANAKI<br />
Figure 49<br />
<strong>20</strong><strong>10</strong>-<strong>20</strong>: Taranaki Region beach and coastal fatal<br />
drownings and fatal drowning rate per <strong>10</strong>0,000<br />
population (n=8).<br />
During <strong>20</strong>19-<strong>20</strong>, there was one beach and coastal drowning<br />
fatality within the Taranaki Region, which equals the tenyear<br />
average of one per year. The <strong>20</strong>19-<strong>20</strong> fatal drowning<br />
rate (0.81 per <strong>10</strong>0,000 pop.) was greater than the ten-year<br />
average (0.69 per <strong>10</strong>0,000 pop.).<br />
Figure 50<br />
<strong>20</strong><strong>10</strong>-<strong>20</strong>: Taranaki Region beach and coastal<br />
drownings by activity (n=8).<br />
Within the Taranaki Region during <strong>20</strong><strong>10</strong>-<strong>20</strong>, the majority<br />
of beach and coastal drowning fatalities resulted from falls<br />
(n=3), followed by boating (n=2) attempting a rescue (n=1),<br />
boating (n=1), swimming/wading (n=1) and watercraft<br />
activities (n=1).<br />
Fatal Drownings (n)<br />
4<br />
3<br />
2<br />
1<br />
0<br />
<strong>20</strong><strong>10</strong>-11<br />
Fatal Drownings<br />
Fatal Drowning Rate<br />
<strong>20</strong>11-12<br />
<strong>20</strong>12-13<br />
<strong>20</strong>13-14<br />
<strong>20</strong>14-15<br />
<strong>20</strong>15-16<br />
<strong>Year</strong><br />
<strong>20</strong>16-17<br />
<strong>20</strong>17-18<br />
<strong>20</strong>18-19<br />
<strong>20</strong>19-<strong>20</strong><br />
3.0<br />
2.5<br />
2.0<br />
1.5<br />
1.0<br />
0.5<br />
0.0<br />
Fatal Drowning Rate<br />
(per <strong>10</strong>0,000 pop.)<br />
13%<br />
13%<br />
13%<br />
38%<br />
Falls<br />
25%<br />
38%<br />
Falls<br />
Boating<br />
Attempting a Rescue<br />
Swimming/Wading<br />
Watercraft<br />
Figure 51<br />
Comparison of beach and coastal fatal drowning rates (per <strong>10</strong>0,000 pop.) by activity in the Taranaki Region:<br />
<strong>20</strong><strong>10</strong>-<strong>20</strong> (ten-year average) and <strong>20</strong>19-<strong>20</strong>.<br />
Within the Taranaki Region the <strong>20</strong>19-<strong>20</strong> fatal drowning rates (per <strong>10</strong>0,000 pop.) for falls, boating, watercraft and<br />
attempting rescue activities were less than their respective ten-year averages. However, the <strong>20</strong>19-<strong>20</strong> fatal drowning rate for<br />
swimming/wading was greater than the ten-year average.<br />
SWIMMING / WADING<br />
SNORKELLING<br />
FALL<br />
<strong>20</strong><strong>10</strong>-<strong>20</strong><br />
0.08<br />
<strong>20</strong>19-<strong>20</strong><br />
0.81<br />
<strong>20</strong><strong>10</strong>-<strong>20</strong><br />
0.00<br />
LAND BASED FISHING<br />
<strong>20</strong>19-<strong>20</strong><br />
0.00<br />
BOATING<br />
<strong>20</strong><strong>10</strong>-<strong>20</strong><br />
0.27<br />
<strong>20</strong>19-<strong>20</strong><br />
0.00<br />
<strong>20</strong><strong>10</strong>-<strong>20</strong><br />
0.00<br />
NET / SHELL FISHING<br />
<strong>20</strong>19-<strong>20</strong><br />
0.00<br />
WATERCRAFT<br />
<strong>20</strong><strong>10</strong>-<strong>20</strong><br />
0.17<br />
<strong>20</strong>19-<strong>20</strong><br />
0.00<br />
<strong>20</strong><strong>10</strong>-<strong>20</strong><br />
0.00<br />
ATTEMPTING A RESCUE<br />
<strong>20</strong>19-<strong>20</strong><br />
0.00<br />
<strong>20</strong><strong>10</strong>-<strong>20</strong><br />
0.08<br />
<strong>20</strong>19-<strong>20</strong><br />
0.00<br />
<strong>20</strong><strong>10</strong>-<strong>20</strong><br />
0.09<br />
<strong>20</strong>19-<strong>20</strong><br />
0.00<br />
48<br />
SURF LIFE SAVING NEW ZEALAND NATIONAL BEACH AND COASTAL SAFETY REPORT
FATAL DROWNING SNAPSHOT<br />
<strong>10</strong>-YEAR OVERVIEW | <strong>20</strong><strong>10</strong>-<strong>20</strong> 1-YEAR OVERVIEW | <strong>20</strong>19-<strong>20</strong><br />
FATAL DROWNINGS<br />
AVERAGE FATALITY<br />
1 0.81<br />
PER <strong>10</strong>0,000 POPULATION<br />
FATAL DROWNINGS BY LOCATION<br />
8<br />
Attempting a Rescue<br />
Boating<br />
Diving / Jumping<br />
Fall<br />
Net / Shell Fishing<br />
Rock Fishing<br />
Scuba Diving<br />
Snorkeling<br />
Swimming / Wading<br />
Watercraft<br />
TOTAL FATAL DROWNINGS: 8<br />
<strong>10</strong>0%<br />
Surf <strong>Beach</strong><br />
AVERAGE FATAL DROWNINGS<br />
MANAWATU-WANGANUI<br />
Figure 52<br />
<strong>20</strong><strong>10</strong>-<strong>20</strong>: Manawatū-Wanganui Region beach and<br />
coastal fatal drownings and fatal drowning rate per<br />
<strong>10</strong>0,000 population (n=5).<br />
During <strong>20</strong>19-<strong>20</strong>, there were no beach and coastal drowning<br />
fatalities within the Manawatu-Wanganui Region, which is<br />
less than the ten-year average of less than one per year. The<br />
<strong>20</strong>19-<strong>20</strong> fatal drowning rate (0.00 per <strong>10</strong>0,000 pop.) was<br />
less than the ten-year average (0.17 per <strong>10</strong>0,000 pop.).<br />
Figure 53<br />
<strong>20</strong><strong>10</strong>-<strong>20</strong>: Manawatū-Wanganui Region beach and<br />
coastal drownings by activity (n=5).<br />
Within the Manawatu-Wanganui Region during <strong>20</strong><strong>10</strong>-<br />
<strong>20</strong>, the majority of beach and coastal drowning fatalities<br />
occurred while swimming/wading (n=3), followed by<br />
snorkelling activities (n=1).<br />
3<br />
Fatal Drownings<br />
Fatal Drowning Rate<br />
1.0<br />
<strong>20</strong>%<br />
Fatal Drownings (n)<br />
2<br />
1<br />
0.8<br />
0.6<br />
0.4<br />
0.2<br />
Fatal Drowning Rate<br />
(per <strong>10</strong>0,000 pop.)<br />
80%<br />
Swimming/Wading<br />
Snorkelling<br />
0<br />
<strong>20</strong><strong>10</strong>-11<br />
<strong>20</strong>11-12<br />
<strong>20</strong>12-13<br />
<strong>20</strong>13-14<br />
<strong>20</strong>14-15<br />
<strong>20</strong>15-16<br />
<strong>Year</strong><br />
<strong>20</strong>16-17<br />
<strong>20</strong>17-18<br />
<strong>20</strong>18-19<br />
<strong>20</strong>19-<strong>20</strong><br />
0.0<br />
80%<br />
Figure 54<br />
Comparison of beach and coastal fatal drowning rates (per <strong>10</strong>0,000 pop.) by activity in the Manawatū-Wanganui<br />
Region: <strong>20</strong><strong>10</strong>-<strong>20</strong> (ten-year average) and <strong>20</strong>19-<strong>20</strong>.<br />
Within the Manawatu-Wanganui Region the <strong>20</strong>19-<strong>20</strong> fatal drowning rate (per <strong>10</strong>0,000 pop.) for swimming/wading and<br />
snorkelling activities were less than their respective ten-year average.<br />
SWIMMING / WADING<br />
SNORKELLING<br />
FALL<br />
<strong>20</strong><strong>10</strong>-<strong>20</strong><br />
0.17<br />
<strong>20</strong>19-<strong>20</strong><br />
0.00<br />
<strong>20</strong><strong>10</strong>-<strong>20</strong><br />
0.04<br />
LAND BASED FISHING<br />
<strong>20</strong>19-<strong>20</strong><br />
0.00<br />
BOATING<br />
<strong>20</strong><strong>10</strong>-<strong>20</strong><br />
0.00<br />
<strong>20</strong>19-<strong>20</strong><br />
0.00<br />
<strong>20</strong><strong>10</strong>-<strong>20</strong><br />
0.00<br />
NET / SHELL FISHING<br />
<strong>20</strong>19-<strong>20</strong><br />
0.00<br />
WATERCRAFT<br />
<strong>20</strong><strong>10</strong>-<strong>20</strong><br />
0.00<br />
<strong>20</strong>19-<strong>20</strong><br />
0.00<br />
<strong>20</strong><strong>10</strong>-<strong>20</strong><br />
0.00<br />
ATTEMPTING A RESCUE<br />
<strong>20</strong>19-<strong>20</strong><br />
0.00<br />
<strong>20</strong><strong>10</strong>-<strong>20</strong><br />
0.00<br />
<strong>20</strong>19-<strong>20</strong><br />
0.00<br />
<strong>20</strong><strong>10</strong>-<strong>20</strong><br />
0.00<br />
<strong>20</strong>19-<strong>20</strong><br />
0.00<br />
50<br />
SURF LIFE SAVING NEW ZEALAND NATIONAL BEACH AND COASTAL SAFETY REPORT
FATAL DROWNING SNAPSHOT<br />
<strong>10</strong>-YEAR OVERVIEW | <strong>20</strong><strong>10</strong>-<strong>20</strong> 1-YEAR OVERVIEW | <strong>20</strong>19-<strong>20</strong><br />
FATAL DROWNINGS<br />
AVERAGE FATALITY<br />
5<br />
FATAL<br />
0 0.00<br />
DROWNINGS BY LOCATION<br />
PER <strong>10</strong>0,000 POPULATION<br />
Attempting a Rescue<br />
Boating<br />
Diving / Jumping<br />
Fall<br />
Net / Shell Fishing<br />
Rock Fishing<br />
Scuba Diving<br />
Snorkeling<br />
Swimming / Wading<br />
Watercraft<br />
ZERO<br />
Fatal<br />
Drownings<br />
TOTAL FATAL DROWNINGS: 5<br />
AVERAGE FATAL DROWNINGS AVERAGE FATALITY<br />
WELLINGTON / TE WHANGA-NUI-A-TARA<br />
Figure 55<br />
<strong>20</strong><strong>10</strong>-<strong>20</strong>: Wellington Region beach and coastal fatal<br />
drownings and fatal drowning rate per <strong>10</strong>0,000<br />
population (n=33).<br />
During <strong>20</strong>19-<strong>20</strong>, there were five beach and coastal<br />
drowning fatalities within the Wellington Region, which is<br />
greater than the ten-year average of three per year. The<br />
<strong>20</strong>19-<strong>20</strong> fatal drowning rate (0.94 per <strong>10</strong>0,000 pop.) was<br />
greater than the ten-year average (0.65 per <strong>10</strong>0,000 pop.).<br />
Fatal Drownings (n)<br />
6<br />
5<br />
4<br />
3<br />
2<br />
1<br />
0<br />
<strong>20</strong><strong>10</strong>-11<br />
Fatal Drownings<br />
Fatal Drowning Rate<br />
<strong>20</strong>11-12<br />
<strong>20</strong>12-13<br />
<strong>20</strong>13-14<br />
<strong>20</strong>14-15<br />
<strong>20</strong>15-16<br />
<strong>Year</strong><br />
<strong>20</strong>16-17<br />
<strong>20</strong>17-18<br />
<strong>20</strong>18-19<br />
<strong>20</strong>19-<strong>20</strong><br />
1.2<br />
1.0<br />
0.8<br />
0.6<br />
0.4<br />
0.2<br />
0.0<br />
Fatal Drowning Rate<br />
(per <strong>10</strong>0,000 pop.)<br />
Figure 56<br />
<strong>20</strong><strong>10</strong>-<strong>20</strong>: Wellington Region beach and coastal<br />
drownings by activity (n=33).<br />
Within the Wellington Region during <strong>20</strong><strong>10</strong>-<strong>20</strong>, the majority<br />
of beach and coastal drowning fatalities occurred while<br />
swimming/wading (n=7), followed by falls (n=6), snorkelling<br />
(n=5) and watercraft activities (n=5).<br />
12%<br />
6%<br />
3% 3% 3%<br />
3%<br />
15%<br />
15%<br />
21%<br />
Swimming/<br />
Wading<br />
21%<br />
18%<br />
Swimming/Wading<br />
Falls<br />
Snorkelling<br />
Watercraft<br />
Boating<br />
Scuba Diving<br />
Attempting a Rescue<br />
Diving/Jumping<br />
Net/Shell Fishing<br />
Land Based Fishing<br />
Figure 57<br />
Comparison of beach and coastal fatal drowning rates (per <strong>10</strong>0,000 pop.) by activity in the Wellington Region:<br />
<strong>20</strong><strong>10</strong>-<strong>20</strong> (ten-year average) and <strong>20</strong>19-<strong>20</strong>.<br />
Within the Wellington Region the <strong>20</strong>19-<strong>20</strong> fatal drowning rates (per <strong>10</strong>0,000 pop.) for swimming/wading, boating, landbased<br />
fishing and net/shell fishing activities were less than their respective ten-year averages. However, the <strong>20</strong>19-<strong>20</strong> fatal<br />
drowning rates for falls, watercraft, snorkelling and attempting a rescue activities were greater than the ten-year average.<br />
SWIMMING / WADING<br />
SNORKELLING<br />
FALL<br />
<strong>20</strong><strong>10</strong>-<strong>20</strong><br />
0.14<br />
<strong>20</strong>19-<strong>20</strong><br />
0.00<br />
<strong>20</strong><strong>10</strong>-<strong>20</strong><br />
0.<strong>10</strong><br />
LAND BASED FISHING<br />
<strong>20</strong>19-<strong>20</strong><br />
0.38<br />
BOATING<br />
<strong>20</strong><strong>10</strong>-<strong>20</strong><br />
0.12<br />
<strong>20</strong>19-<strong>20</strong><br />
0.19<br />
<strong>20</strong><strong>10</strong>-<strong>20</strong><br />
0.00<br />
NET / SHELL FISHING<br />
<strong>20</strong>19-<strong>20</strong><br />
0.00<br />
WATERCRAFT<br />
<strong>20</strong><strong>10</strong>-<strong>20</strong><br />
0.08<br />
<strong>20</strong>19-<strong>20</strong><br />
0.00<br />
<strong>20</strong><strong>10</strong>-<strong>20</strong><br />
0.02<br />
ATTEMPTING A RESCUE<br />
<strong>20</strong>19-<strong>20</strong><br />
0.00<br />
<strong>20</strong><strong>10</strong>-<strong>20</strong><br />
0.<strong>10</strong><br />
<strong>20</strong>19-<strong>20</strong><br />
0.19<br />
<strong>20</strong><strong>10</strong>-<strong>20</strong><br />
0.02<br />
<strong>20</strong>19-<strong>20</strong><br />
0.19<br />
52<br />
SURF LIFE SAVING NEW ZEALAND NATIONAL BEACH AND COASTAL SAFETY REPORT
FATAL DROWNING SNAPSHOT<br />
<strong>10</strong>-YEAR OVERVIEW | <strong>20</strong><strong>10</strong>-<strong>20</strong> 1-YEAR OVERVIEW | <strong>20</strong>19-<strong>20</strong><br />
FATAL DROWNINGS<br />
AVERAGE FATALITY<br />
33<br />
FATAL<br />
5 0.94<br />
DROWNINGS BY LOCATION<br />
PER <strong>10</strong>0,000 POPULATION<br />
<strong>20</strong>%<br />
Attempting a Rescue<br />
Boating<br />
Diving / Jumping<br />
Fall<br />
Net / Shell Fishing<br />
Rock Fishing<br />
Scuba Diving<br />
Snorkeling<br />
Swimming / Wading<br />
Watercraft<br />
<strong>20</strong>%<br />
40%<br />
Rocky<br />
Foreshore<br />
40%<br />
TOTAL FATAL DROWNINGS: 33<br />
AVERAGE FATAL DROWNINGS<br />
3<br />
PER YEAR<br />
KEY DEMOGRAPHIC<br />
25-34<br />
YEAR OLD MALES<br />
94%<br />
MALE<br />
6%<br />
FEMALE<br />
AVERAGE FATALITY<br />
0.65<br />
PER <strong>10</strong>0,000 POPULATION<br />
SWIMMING/WADING<br />
Rocky Foreshore<br />
Calm Water <strong>Beach</strong><br />
FATAL DROWNINGS BY ACTIVITY<br />
<strong>20</strong>%<br />
<strong>20</strong>%<br />
<strong>20</strong>%<br />
40%<br />
Snorkelling<br />
<strong>20</strong>%<br />
Snorkelling<br />
Attempting a Rescue<br />
Harbour<br />
Surf <strong>Beach</strong><br />
Falls<br />
Watercraft<br />
40%
TASMAN / TE TAI-O-AORERE<br />
Figure 58<br />
<strong>20</strong><strong>10</strong>-<strong>20</strong>: Tasman Region beach and coastal fatal<br />
drownings and fatal drowning rate per <strong>10</strong>0,000<br />
population (n=5).<br />
During <strong>20</strong>19-<strong>20</strong>, there was one beach and coastal drowning<br />
fatality within the Tasman Region, which is greater than the<br />
ten-year average of less than one per year. The <strong>20</strong>19-<strong>20</strong><br />
fatal drowning rate (1.81 per <strong>10</strong>0,000 pop.) was greater<br />
than the ten-year average (0.96 per <strong>10</strong>0,000 pop.).<br />
Figure 59<br />
<strong>20</strong><strong>10</strong>-<strong>20</strong>: Tasman Region beach and coastal drownings<br />
by activity (n=5).<br />
Within the Tasman Region during <strong>20</strong><strong>10</strong>-<strong>20</strong>, the beach and<br />
coastal drowning fatalities occurred while swimming/wading<br />
(n=2), net / shell fishing (n=1) land based fishing (n=1) and<br />
watercraft activities (n=1).<br />
Fatal Drownings (n)<br />
2<br />
1<br />
0<br />
<strong>20</strong><strong>10</strong>-11<br />
Fatal Drownings<br />
Fatal Drowning Rate<br />
<strong>20</strong>11-12<br />
<strong>20</strong>12-13<br />
<strong>20</strong>13-14<br />
<strong>20</strong>14-15<br />
<strong>20</strong>15-16<br />
<strong>Year</strong><br />
<strong>20</strong>16-17<br />
<strong>20</strong>17-18<br />
<strong>20</strong>18-19<br />
<strong>20</strong>19-<strong>20</strong><br />
4.0<br />
3.5<br />
3.0<br />
2.5<br />
2.0<br />
1.5<br />
1.0<br />
0.5<br />
0.0<br />
Fatal Drowning Rate<br />
(per <strong>10</strong>0,000 pop.)<br />
<strong>20</strong>%<br />
<strong>20</strong>%<br />
40%<br />
Swimming/<br />
Wading<br />
<strong>20</strong>%<br />
40%<br />
Swimming/Wading<br />
Land Based Fishing<br />
Net/Shell Fishing<br />
Watercraft<br />
Figure 60<br />
Comparison of beach and coastal fatal drowning rates (per <strong>10</strong>0,000 pop.) by activity in the Tasman Region:<br />
<strong>20</strong><strong>10</strong>-<strong>20</strong> (ten-year average) and <strong>20</strong>19-<strong>20</strong>.<br />
Within the Tasman Region the <strong>20</strong>19-<strong>20</strong> fatal drowning rates (per <strong>10</strong>0,000 pop.) for swimming/wading, land-based fishing<br />
and net/shell fishing activities were less than their respective ten-year averages. However, the <strong>20</strong>19-<strong>20</strong> fatal drowning rate<br />
for watercraft activities was greater than the ten-year average.<br />
SWIMMING / WADING<br />
SNORKELLING<br />
FALL<br />
<strong>20</strong><strong>10</strong>-<strong>20</strong><br />
0.39<br />
<strong>20</strong>19-<strong>20</strong><br />
0.00<br />
<strong>20</strong><strong>10</strong>-<strong>20</strong><br />
0.00<br />
LAND BASED FISHING<br />
<strong>20</strong>19-<strong>20</strong><br />
0.00<br />
BOATING<br />
<strong>20</strong><strong>10</strong>-<strong>20</strong><br />
0.00<br />
<strong>20</strong>19-<strong>20</strong><br />
0.00<br />
<strong>20</strong><strong>10</strong>-<strong>20</strong><br />
0.19<br />
NET / SHELL FISHING<br />
<strong>20</strong>19-<strong>20</strong><br />
0.00<br />
WATERCRAFT<br />
<strong>20</strong><strong>10</strong>-<strong>20</strong><br />
0.00<br />
<strong>20</strong>19-<strong>20</strong><br />
0.00<br />
<strong>20</strong><strong>10</strong>-<strong>20</strong><br />
0.22<br />
ATTEMPTING A RESCUE<br />
<strong>20</strong>19-<strong>20</strong><br />
0.00<br />
<strong>20</strong><strong>10</strong>-<strong>20</strong><br />
0.18<br />
<strong>20</strong>19-<strong>20</strong><br />
1.81<br />
<strong>20</strong><strong>10</strong>-<strong>20</strong><br />
0.00<br />
<strong>20</strong>19-<strong>20</strong><br />
0.00<br />
54<br />
SURF LIFE SAVING NEW ZEALAND NATIONAL BEACH AND COASTAL SAFETY REPORT
FATAL DROWNING SNAPSHOT<br />
<strong>10</strong>-YEAR OVERVIEW | <strong>20</strong><strong>10</strong>-<strong>20</strong> 1-YEAR OVERVIEW | <strong>20</strong>19-<strong>20</strong><br />
FATAL DROWNINGS<br />
AVERAGE FATALITY<br />
1 1.8<br />
PER <strong>10</strong>0,000 POPULATION<br />
FATAL DROWNINGS BY LOCATION<br />
Attempting a Rescue<br />
Boating<br />
Diving / Jumping<br />
Fall<br />
AVERAGE FATAL DROWNINGS<br />
MARLBOROUGH / TE TAUIHU-O-TE-WAKA<br />
Figure 61<br />
<strong>20</strong><strong>10</strong>-<strong>20</strong>: Marlborough Region beach and coastal<br />
fatal drownings and fatal drowning rate per <strong>10</strong>0,000<br />
population (n=4).<br />
During <strong>20</strong>19-<strong>20</strong>, there was one beach and coastal drowning<br />
fatality within the Marlborough Region, which is greater than<br />
the ten-year average of less than one per year. The <strong>20</strong>19-<strong>20</strong><br />
fatal drowning rate (2.02 per <strong>10</strong>0,000 pop.) was greater<br />
than the ten-year average (0.84 per <strong>10</strong>0,000 pop.).<br />
Figure 62<br />
<strong>20</strong><strong>10</strong>-<strong>20</strong>: Marlborough Region beach and coastal<br />
drownings by activity (n=4).<br />
Within the Marlborough Region during <strong>20</strong><strong>10</strong>-<strong>20</strong>, the<br />
majority of beach and coastal drowning fatalities were<br />
classified as falls (n=3), followed by scuba diving activities<br />
(n=1).<br />
Fatal Drownings (n)<br />
2<br />
1<br />
0<br />
<strong>20</strong><strong>10</strong>-11<br />
Fatal Drownings<br />
Fatal Drowning Rate<br />
<strong>20</strong>11-12<br />
<strong>20</strong>12-13<br />
<strong>20</strong>13-14<br />
<strong>20</strong>14-15<br />
<strong>20</strong>15-16<br />
<strong>Year</strong><br />
<strong>20</strong>16-17<br />
<strong>20</strong>17-18<br />
<strong>20</strong>18-19<br />
<strong>20</strong>19-<strong>20</strong><br />
2.5<br />
2.0<br />
1.5<br />
1.0<br />
0.5<br />
0.0<br />
Fatal Drowning Rate<br />
(per <strong>10</strong>0,000 pop.)<br />
25%<br />
75%<br />
Fall<br />
75%<br />
Falls<br />
Scuba Diving<br />
Figure 63<br />
Comparison of beach and coastal fatal drowning rates (per <strong>10</strong>0,000 pop.) by activity in the Marlborough Region:<br />
<strong>20</strong><strong>10</strong>-<strong>20</strong> (ten-year average) and <strong>20</strong>19-<strong>20</strong>.<br />
Within the Marlborough Region the <strong>20</strong>19-<strong>20</strong> fatal drowning rates (per <strong>10</strong>0,000 pop.) for falls was greater than the ten-year<br />
average.<br />
SWIMMING / WADING<br />
SNORKELLING<br />
FALL<br />
<strong>20</strong><strong>10</strong>-<strong>20</strong><br />
0.00<br />
<strong>20</strong>19-<strong>20</strong><br />
0.00<br />
<strong>20</strong><strong>10</strong>-<strong>20</strong><br />
0.00<br />
LAND BASED FISHING<br />
<strong>20</strong>19-<strong>20</strong><br />
0.00<br />
BOATING<br />
<strong>20</strong><strong>10</strong>-<strong>20</strong><br />
0.62<br />
<strong>20</strong>19-<strong>20</strong><br />
2.02<br />
<strong>20</strong><strong>10</strong>-<strong>20</strong><br />
0.00<br />
NET / SHELL FISHING<br />
<strong>20</strong>19-<strong>20</strong><br />
0.00<br />
WATERCRAFT<br />
<strong>20</strong><strong>10</strong>-<strong>20</strong><br />
0.00<br />
<strong>20</strong>19-<strong>20</strong><br />
0.00<br />
<strong>20</strong><strong>10</strong>-<strong>20</strong><br />
0.00<br />
ATTEMPTING A RESCUE<br />
<strong>20</strong>19-<strong>20</strong><br />
0.00<br />
<strong>20</strong><strong>10</strong>-<strong>20</strong><br />
0.00<br />
<strong>20</strong>19-<strong>20</strong><br />
0.00<br />
<strong>20</strong><strong>10</strong>-<strong>20</strong><br />
0.00<br />
<strong>20</strong>19-<strong>20</strong><br />
0.00<br />
56<br />
SURF LIFE SAVING NEW ZEALAND NATIONAL BEACH AND COASTAL SAFETY REPORT
FATAL DROWNING SNAPSHOT<br />
<strong>10</strong>-YEAR OVERVIEW | <strong>20</strong><strong>10</strong>-<strong>20</strong> 1-YEAR OVERVIEW | <strong>20</strong>19-<strong>20</strong><br />
FATAL DROWNINGS<br />
AVERAGE FATALITY<br />
1 2.02<br />
PER <strong>10</strong>0,000 POPULATION<br />
FATAL DROWNINGS BY LOCATION<br />
4<br />
Attempting a Rescue<br />
Boating<br />
Diving / Jumping<br />
Fall<br />
AVERAGE FATAL DROWNINGS<br />
WEST COAST / TE TAI POUTINI<br />
Figure 64<br />
<strong>20</strong><strong>10</strong>-<strong>20</strong>: West Coast Region beach and coastal fatal<br />
drownings and fatal drowning rate per <strong>10</strong>0,000<br />
population (n=7).<br />
During <strong>20</strong>19-<strong>20</strong>, there was one beach and coastal drowning<br />
fatality within the West Coast Region, which equals the tenyear<br />
average of one per year. The <strong>20</strong>19-<strong>20</strong> fatal drowning<br />
rate (3.<strong>10</strong> per <strong>10</strong>0,000 pop.) was greater than the ten-year<br />
average (2.13 per <strong>10</strong>0,000 pop.).<br />
Fatal Drownings (n)<br />
3<br />
2<br />
1<br />
Fatal Drownings<br />
Fatal Drowning Rate<br />
7.0<br />
6.0<br />
5.0<br />
4.0<br />
3.0<br />
2.0<br />
1.0<br />
Fatal Drowning Rate<br />
(per <strong>10</strong>0,000 pop.)<br />
Figure 65<br />
<strong>20</strong><strong>10</strong>-<strong>20</strong>: West Coast Region beach and coastal<br />
drownings by activity (n=7).<br />
Within the West Coast Region during <strong>20</strong><strong>10</strong>-<strong>20</strong>, the majority<br />
of beach and coastal drowning fatalities were classified<br />
as boating (n=3) and falls (n=3), followed by swimming/<br />
wading (n=1).<br />
14%<br />
43%<br />
Boating<br />
43%<br />
Falls<br />
43%<br />
0<br />
<strong>20</strong><strong>10</strong>-11<br />
<strong>20</strong>11-12<br />
<strong>20</strong>12-13<br />
<strong>20</strong>13-14<br />
<strong>20</strong>14-15<br />
<strong>20</strong>15-16<br />
<strong>Year</strong><br />
<strong>20</strong>16-17<br />
<strong>20</strong>17-18<br />
<strong>20</strong>18-19<br />
<strong>20</strong>19-<strong>20</strong><br />
0.0<br />
43%<br />
Falls<br />
Boating<br />
Swimming/Wading<br />
Figure 66<br />
Comparison of beach and coastal fatal drowning rates (per <strong>10</strong>0,000 pop.) by activity in the West Coast Region:<br />
<strong>20</strong><strong>10</strong>-<strong>20</strong> (ten-year average) and <strong>20</strong>19-<strong>20</strong>.<br />
Within the West Coast Region the <strong>20</strong>19-<strong>20</strong> fatal drowning rates (per <strong>10</strong>0,000 pop.) for swimming/wading and falls activities<br />
were less than their respective ten-year averages. However, the <strong>20</strong>19-<strong>20</strong> fatal drowning rate for boating was greater than the<br />
ten-year average<br />
SWIMMING / WADING<br />
SNORKELLING<br />
FALL<br />
<strong>20</strong><strong>10</strong>-<strong>20</strong><br />
0.30<br />
<strong>20</strong>19-<strong>20</strong><br />
0.00<br />
<strong>20</strong><strong>10</strong>-<strong>20</strong><br />
0.00<br />
LAND BASED FISHING<br />
<strong>20</strong>19-<strong>20</strong><br />
0.00<br />
BOATING<br />
<strong>20</strong><strong>10</strong>-<strong>20</strong><br />
0.91<br />
<strong>20</strong>19-<strong>20</strong><br />
0.00<br />
<strong>20</strong><strong>10</strong>-<strong>20</strong><br />
0.00<br />
NET / SHELL FISHING<br />
<strong>20</strong>19-<strong>20</strong><br />
0.00<br />
WATERCRAFT<br />
<strong>20</strong><strong>10</strong>-<strong>20</strong><br />
0.92<br />
<strong>20</strong>19-<strong>20</strong><br />
3.<strong>10</strong><br />
<strong>20</strong><strong>10</strong>-<strong>20</strong><br />
0.34<br />
ATTEMPTING A RESCUE<br />
<strong>20</strong>19-<strong>20</strong><br />
0.00<br />
<strong>20</strong><strong>10</strong>-<strong>20</strong><br />
0.00<br />
<strong>20</strong>19-<strong>20</strong><br />
0.00<br />
<strong>20</strong><strong>10</strong>-<strong>20</strong><br />
0.00<br />
<strong>20</strong>19-<strong>20</strong><br />
0.00<br />
58<br />
SURF LIFE SAVING NEW ZEALAND NATIONAL BEACH AND COASTAL SAFETY REPORT
FATAL DROWNING SNAPSHOT<br />
<strong>10</strong>-YEAR OVERVIEW | <strong>20</strong><strong>10</strong>-<strong>20</strong> 1-YEAR OVERVIEW | <strong>20</strong>19-<strong>20</strong><br />
FATAL DROWNINGS<br />
AVERAGE FATALITY<br />
1 3.<strong>10</strong><br />
PER <strong>10</strong>0,000 POPULATION<br />
FATAL DROWNINGS BY LOCATION<br />
Attempting a Rescue<br />
Boating<br />
Diving / Jumping<br />
Fall<br />
Net / Shell Fishing<br />
Rock Fishing<br />
Scuba Diving<br />
Snorkeling<br />
7<br />
Swimming / Wading<br />
Watercraft<br />
TOTAL FATAL DROWNINGS: 7<br />
<strong>10</strong>0%<br />
River/<br />
Harbour Bar<br />
AVERAGE FATAL DROWNINGS<br />
CANTERBURY / WAITAHA<br />
Figure 67<br />
<strong>20</strong><strong>10</strong>-<strong>20</strong>: Canterbury Region beach and coastal fatal<br />
drownings and fatal drowning rate per <strong>10</strong>0,000<br />
population (n=14).<br />
During <strong>20</strong>19-<strong>20</strong>, there was one beach and coastal drowning<br />
fatalities within the Canterbury Region, which equals the tenyear<br />
average of one per year. The <strong>20</strong>19-<strong>20</strong> fatal drowning<br />
rate (0.16 per <strong>10</strong>0,000 pop.) was less than the ten-year<br />
average (0.24 per <strong>10</strong>0,000 pop.).<br />
Figure 68<br />
<strong>20</strong><strong>10</strong>-<strong>20</strong>: Canterbury Region beach and coastal<br />
drownings by activity (n=14).<br />
Within the Canterbury Region during <strong>20</strong><strong>10</strong>-<strong>20</strong>, the<br />
majority of beach and coastal drowning fatalities occurred<br />
while snorkelling (n=4), followed by boating (n=2), falls<br />
(n=2), land based fishing (n=2), scuba diving (n=2) and<br />
swimming/wading activities (n=2).<br />
Fatal Drownings (n)<br />
5<br />
4<br />
3<br />
2<br />
1<br />
0<br />
<strong>20</strong><strong>10</strong>-11<br />
Fatal Drownings<br />
Fatal Drowning Rate<br />
<strong>20</strong>11-12<br />
<strong>20</strong>12-13<br />
<strong>20</strong>13-14<br />
<strong>20</strong>14-15<br />
<strong>20</strong>15-16<br />
<strong>Year</strong><br />
<strong>20</strong>16-17<br />
<strong>20</strong>17-18<br />
<strong>20</strong>18-19<br />
<strong>20</strong>19-<strong>20</strong><br />
0.7<br />
0.6<br />
0.5<br />
0.4<br />
0.3<br />
0.2<br />
0.1<br />
0.0<br />
Fatal Drowning Rate<br />
(per <strong>10</strong>0,000 pop.)<br />
14%<br />
14%<br />
14%<br />
29%<br />
Snorkelling<br />
14%<br />
14%<br />
29%<br />
Snorkelling<br />
Boating<br />
Falls<br />
Land Based Fishing<br />
Scuba Diving<br />
Swimming/Wading<br />
Figure 69<br />
Comparison of beach and coastal fatal drowning rates (per <strong>10</strong>0,000 pop.) by activity in the Canterbury Region:<br />
<strong>20</strong><strong>10</strong>-<strong>20</strong> (ten-year average) and <strong>20</strong>19-<strong>20</strong>.<br />
Within the Canterbury Region the <strong>20</strong>19-<strong>20</strong> fatal drowning rates (per <strong>10</strong>0,000 pop.) for swimming/wading, falls, boating<br />
and land based fishing were less than their respective ten-year averages. However, the <strong>20</strong>19-<strong>20</strong> fatal drowning rates for<br />
snorkelling was greater than the ten-year average.<br />
SWIMMING / WADING<br />
SNORKELLING<br />
FALL<br />
<strong>20</strong><strong>10</strong>-<strong>20</strong><br />
0.03<br />
<strong>20</strong>19-<strong>20</strong><br />
0.00<br />
<strong>20</strong><strong>10</strong>-<strong>20</strong><br />
0.07<br />
LAND BASED FISHING<br />
<strong>20</strong>19-<strong>20</strong><br />
0.16<br />
BOATING<br />
<strong>20</strong><strong>10</strong>-<strong>20</strong><br />
0.03<br />
<strong>20</strong>19-<strong>20</strong><br />
0.00<br />
<strong>20</strong><strong>10</strong>-<strong>20</strong><br />
0.03<br />
NET / SHELL FISHING<br />
<strong>20</strong>19-<strong>20</strong><br />
0.00<br />
WATERCRAFT<br />
<strong>20</strong><strong>10</strong>-<strong>20</strong><br />
0.03<br />
<strong>20</strong>19-<strong>20</strong><br />
0.00<br />
<strong>20</strong><strong>10</strong>-<strong>20</strong><br />
0.00<br />
ATTEMPTING A RESCUE<br />
<strong>20</strong>19-<strong>20</strong><br />
0.00<br />
<strong>20</strong><strong>10</strong>-<strong>20</strong><br />
0.00<br />
<strong>20</strong>19-<strong>20</strong><br />
0.00<br />
<strong>20</strong><strong>10</strong>-<strong>20</strong><br />
0.00<br />
<strong>20</strong>19-<strong>20</strong><br />
0.00<br />
60<br />
SURF LIFE SAVING NEW ZEALAND NATIONAL BEACH AND COASTAL SAFETY REPORT
FATAL DROWNING SNAPSHOT<br />
<strong>10</strong>-YEAR OVERVIEW | <strong>20</strong><strong>10</strong>-<strong>20</strong> 1-YEAR OVERVIEW | <strong>20</strong>19-<strong>20</strong><br />
FATAL DROWNINGS<br />
AVERAGE FATALITY<br />
1 0.16<br />
PER <strong>10</strong>0,000 POPULATION<br />
FATAL DROWNINGS BY LOCATION<br />
14<br />
Attempting a Rescue<br />
Boating<br />
Diving / Jumping<br />
Fall<br />
AVERAGE FATAL DROWNINGS<br />
1<br />
PER YEAR<br />
KEY DEMOGRAPHIC<br />
25-64<br />
YEAR OLD MALES<br />
Net / Shell Fishing<br />
Rock Fishing<br />
Scuba Diving<br />
Snorkeling<br />
Swimming / Wading<br />
Watercraft<br />
TOTAL FATAL DROWNINGS: 14<br />
93%<br />
MALE<br />
7%<br />
FEMALE<br />
AVERAGE FATALITY<br />
0.24<br />
PER <strong>10</strong>0,000 POPULATION<br />
SNORKELLING<br />
<strong>10</strong>0%<br />
Harbour<br />
FATAL DROWNINGS BY ACTIVITY<br />
<strong>10</strong>0%<br />
Snorkelling
OTAGO / OTAKOU<br />
Figure 70<br />
<strong>20</strong><strong>10</strong>-<strong>20</strong>: Otago Region beach and coastal fatal<br />
drownings and fatal drowning rate per <strong>10</strong>0,000<br />
population (n=11).<br />
During <strong>20</strong>19-<strong>20</strong>, there were two beach and coastal<br />
drowning fatalities within the Otago Region, which is greater<br />
than the ten-year average of one per year. The <strong>20</strong>19-<strong>20</strong><br />
fatal drowning rate (0.83 per <strong>10</strong>0,000 pop.) was greater<br />
than the ten-year average (0.49 per <strong>10</strong>0,000 pop.).<br />
Figure 71<br />
<strong>20</strong><strong>10</strong>-<strong>20</strong>: Otago Region beach and coastal drownings<br />
by activity (n=11).<br />
Within the Otago Region during <strong>20</strong><strong>10</strong>-<strong>20</strong>, the majority<br />
of beach and coastal drowning fatalities occurred while<br />
snorkelling (n=6), followed by boating (n=2) and falls (n=2).<br />
Fatal Drownings (n)<br />
5<br />
4<br />
3<br />
2<br />
1<br />
0<br />
<strong>20</strong><strong>10</strong>-11<br />
Fatal Drownings<br />
Fatal Drowning Rate<br />
<strong>20</strong>11-12<br />
<strong>20</strong>12-13<br />
<strong>20</strong>13-14<br />
<strong>20</strong>14-15<br />
<strong>20</strong>15-16<br />
<strong>Year</strong><br />
<strong>20</strong>16-17<br />
<strong>20</strong>17-18<br />
<strong>20</strong>18-19<br />
<strong>20</strong>19-<strong>20</strong><br />
1.8<br />
1.6<br />
1.4<br />
1.2<br />
1.0<br />
0.8<br />
0.6<br />
0.4<br />
0.2<br />
0.0<br />
Fatal Drowning Rate<br />
(per <strong>10</strong>0,000 pop.)<br />
18%<br />
18%<br />
9%<br />
55%<br />
Snorkelling<br />
55%<br />
Snorkelling<br />
Boating<br />
Falls<br />
Land Based Fishing<br />
Figure 72<br />
Comparison of beach and coastal fatal drowning rates (per <strong>10</strong>0,000 pop.) by activity in the Otago Region: <strong>20</strong><strong>10</strong>-<br />
<strong>20</strong> (ten-year average) and <strong>20</strong>19-<strong>20</strong>.<br />
Within the Otago Region the <strong>20</strong>19-<strong>20</strong> fatal drowning rates (per <strong>10</strong>0,000 pop.) for falls, and boating were less than their<br />
respective ten-year averages. However, the <strong>20</strong>19-<strong>20</strong> fatal drowning rates for land-based fishing and snorkelling was greater<br />
than the ten-year average.<br />
SWIMMING / WADING<br />
SNORKELLING<br />
FALL<br />
<strong>20</strong><strong>10</strong>-<strong>20</strong><br />
0.00<br />
<strong>20</strong>19-<strong>20</strong><br />
0.00<br />
<strong>20</strong><strong>10</strong>-<strong>20</strong><br />
0.26<br />
LAND BASED FISHING<br />
<strong>20</strong>19-<strong>20</strong><br />
0.42<br />
BOATING<br />
<strong>20</strong><strong>10</strong>-<strong>20</strong><br />
0.09<br />
<strong>20</strong>19-<strong>20</strong><br />
0.00<br />
<strong>20</strong><strong>10</strong>-<strong>20</strong><br />
0.04<br />
NET / SHELL FISHING<br />
<strong>20</strong>19-<strong>20</strong><br />
0.42<br />
WATERCRAFT<br />
<strong>20</strong><strong>10</strong>-<strong>20</strong><br />
0.<strong>10</strong><br />
<strong>20</strong>19-<strong>20</strong><br />
0.00<br />
<strong>20</strong><strong>10</strong>-<strong>20</strong><br />
0.00<br />
ATTEMPTING A RESCUE<br />
<strong>20</strong>19-<strong>20</strong><br />
0.00<br />
<strong>20</strong><strong>10</strong>-<strong>20</strong><br />
0.00<br />
<strong>20</strong>19-<strong>20</strong><br />
0.00<br />
<strong>20</strong><strong>10</strong>-<strong>20</strong><br />
0.00<br />
<strong>20</strong>19-<strong>20</strong><br />
0.00<br />
62<br />
SURF LIFE SAVING NEW ZEALAND NATIONAL BEACH AND COASTAL SAFETY REPORT
FATAL DROWNING SNAPSHOT<br />
<strong>10</strong>-YEAR OVERVIEW | <strong>20</strong><strong>10</strong>-<strong>20</strong> 1-YEAR OVERVIEW | <strong>20</strong>19-<strong>20</strong><br />
FATAL DROWNINGS<br />
AVERAGE FATALITY<br />
2 0.83<br />
PER <strong>10</strong>0,000 POPULATION<br />
FATAL DROWNINGS BY LOCATION<br />
Attempting a Rescue<br />
Boating<br />
Diving / Jumping<br />
Fall<br />
Net / Shell Fishing<br />
Rock Fishing<br />
Scuba Diving<br />
Snorkeling<br />
11<br />
Swimming / Wading<br />
Watercraft<br />
TOTAL FATAL DROWNINGS: 11<br />
50%<br />
<strong>10</strong>0%<br />
Rocky<br />
Foreshore<br />
AVERAGE FATAL DROWNINGS<br />
1<br />
PER YEAR<br />
KEY DEMOGRAPHIC<br />
15-54<br />
YEAR OLD MALES<br />
73%<br />
MALE<br />
27%<br />
FEMALE<br />
AVERAGE FATALITY<br />
0.49<br />
PER <strong>10</strong>0,000 POPULATION<br />
SNORKELLERS<br />
FATAL DROWNINGS BY ACTIVITY<br />
50%<br />
Land Based<br />
Fishing<br />
50%<br />
Net/Shell<br />
Fishing<br />
50% 34% 50%
SOUTHLAND / MURIHIKU<br />
Figure 73<br />
<strong>20</strong><strong>10</strong>-<strong>20</strong>: Southland Region beach and coastal fatal<br />
drownings and fatal drowning rate per <strong>10</strong>0,000<br />
population (n=12).<br />
During <strong>20</strong>19-<strong>20</strong>, there were no beach and coastal drowning<br />
fatalities within the Southland Region, which is less than<br />
the ten-year average of one per year. The <strong>20</strong>19-<strong>20</strong> fatal<br />
drowning rate (0.00 per <strong>10</strong>0,000 pop.) was less than the<br />
ten-year average (1.21 per <strong>10</strong>0,000 pop.).<br />
Figure 74<br />
<strong>20</strong><strong>10</strong>-<strong>20</strong>: Southland Region beach and coastal<br />
drownings by activity (n=12).<br />
Within the Southland Region during <strong>20</strong><strong>10</strong>-<strong>20</strong>, the majority<br />
of beach and coastal drowning fatalities occurred while<br />
boating (n=3) and based fishing (n=3), followed by<br />
snorkelling (n=2).<br />
Fatal Drownings (n)<br />
4<br />
3<br />
2<br />
1<br />
0<br />
<strong>20</strong><strong>10</strong>-11<br />
Fatal Drownings<br />
Fatal Drowning Rate<br />
<strong>20</strong>11-12<br />
<strong>20</strong>12-13<br />
<strong>20</strong>13-14<br />
<strong>20</strong>14-15<br />
<strong>20</strong>15-16<br />
<strong>Year</strong><br />
<strong>20</strong>16-17<br />
<strong>20</strong>17-18<br />
<strong>20</strong>18-19<br />
<strong>20</strong>19-<strong>20</strong><br />
3.5<br />
3.0<br />
2.5<br />
2.0<br />
1.5<br />
1.0<br />
0.5<br />
0.0<br />
Fatal Drowning Rate<br />
(per <strong>10</strong>0,000 pop.)<br />
8%<br />
8%<br />
17%<br />
8%<br />
8%<br />
25%<br />
Land Based<br />
Fishing<br />
25%<br />
Boating<br />
25%<br />
25%<br />
Boating<br />
Land Based Fishing<br />
Snorkelling<br />
Falls<br />
Scuba Diving<br />
Swimming/Wading<br />
Watercraft<br />
Figure 75<br />
Comparison of beach and coastal fatal drowning rates (per <strong>10</strong>0,000 pop.) by activity in the Southland Region:<br />
<strong>20</strong><strong>10</strong>-<strong>20</strong> (ten-year average) and <strong>20</strong>19-<strong>20</strong>.<br />
Within the Southland Region the <strong>20</strong>19-<strong>20</strong> fatal drowning rates (per <strong>10</strong>0,000 pop.) for swimming/wading, falls, boating,<br />
watercraft, snorkelling and land-based fishing activities were less than their respective ten-year averages.<br />
SWIMMING / WADING<br />
SNORKELLING<br />
FALL<br />
<strong>20</strong><strong>10</strong>-<strong>20</strong><br />
0.<strong>10</strong><br />
<strong>20</strong>19-<strong>20</strong><br />
0.00<br />
<strong>20</strong><strong>10</strong>-<strong>20</strong><br />
0.<strong>20</strong><br />
LAND BASED FISHING<br />
<strong>20</strong>19-<strong>20</strong><br />
0.00<br />
BOATING<br />
<strong>20</strong><strong>10</strong>-<strong>20</strong><br />
0.<strong>10</strong><br />
<strong>20</strong>19-<strong>20</strong><br />
0.00<br />
<strong>20</strong><strong>10</strong>-<strong>20</strong><br />
0.30<br />
NET / SHELL FISHING<br />
<strong>20</strong>19-<strong>20</strong><br />
0.00<br />
WATERCRAFT<br />
<strong>20</strong><strong>10</strong>-<strong>20</strong><br />
0.30<br />
<strong>20</strong>19-<strong>20</strong><br />
0.00<br />
<strong>20</strong><strong>10</strong>-<strong>20</strong><br />
0.00<br />
ATTEMPTING A RESCUE<br />
<strong>20</strong>19-<strong>20</strong><br />
0.00<br />
<strong>20</strong><strong>10</strong>-<strong>20</strong><br />
0.<strong>10</strong><br />
<strong>20</strong>19-<strong>20</strong><br />
0.00<br />
<strong>20</strong><strong>10</strong>-<strong>20</strong><br />
0.00<br />
<strong>20</strong>19-<strong>20</strong><br />
0.00<br />
64<br />
SURF LIFE SAVING NEW ZEALAND NATIONAL BEACH AND COASTAL SAFETY REPORT
FATAL DROWNING SNAPSHOT<br />
<strong>10</strong>-YEAR OVERVIEW | <strong>20</strong><strong>10</strong>-<strong>20</strong> 1-YEAR OVERVIEW | <strong>20</strong>19-<strong>20</strong><br />
FATAL DROWNINGS<br />
AVERAGE FATALITY<br />
0 0.00<br />
PER <strong>10</strong>0,000 POPULATION<br />
FATAL DROWNINGS BY LOCATION<br />
12<br />
Attempting a Rescue<br />
Boating<br />
Diving / Jumping<br />
Fall<br />
AVERAGE FATAL DROWNINGS<br />
1<br />
PER YEAR<br />
Net / Shell Fishing<br />
Rock Fishing<br />
Scuba Diving<br />
Snorkeling<br />
<strong>10</strong>0%<br />
MALE<br />
0%<br />
FEMALE<br />
Swimming / Wading<br />
Watercraft<br />
TOTAL FATAL DROWNINGS: 12<br />
AVERAGE FATALITY<br />
1.21<br />
PER <strong>10</strong>0,000 POPULATION<br />
KEY DEMOGRAPHIC<br />
15-34 25+<br />
YEAR OLD MALES YEAR OLD MALES<br />
LAND BASED FISHING BOATING<br />
ZERO<br />
Fatal<br />
Drownings<br />
FATAL DROWNINGS BY ACTIVITY<br />
ZERO<br />
Fatal<br />
Drownings
<strong>10</strong> YEAR ACTIVITY<br />
OVERVIEW <strong>20</strong><strong>10</strong>-<strong>20</strong><br />
SECTION SIX<br />
80<br />
62<br />
61<br />
SWIMMING/<br />
WADING<br />
BOATING<br />
FALLS<br />
(TRIPS/SLIPS)<br />
36<br />
31<br />
31<br />
SNORKELLING<br />
WATERCRAFT<br />
LAND BASED<br />
FISHING
SNAPSHOT: SWIMMING/WADING<br />
<strong>10</strong> YEAR OVERVIEW | <strong>20</strong><strong>10</strong>-<strong>20</strong><br />
<strong>20</strong><strong>10</strong>-<strong>20</strong><strong>20</strong><br />
FATAL DROWNINGS<br />
80<br />
SWIMMING/WADING<br />
FATAL DROWNINGS LOCATION<br />
13<br />
AVERAGE FATAL<br />
DROWNINGS PER YEAR<br />
8<br />
AVERAGE FATALITY RATE<br />
PER <strong>10</strong>0,000 POPULATION<br />
0.17<br />
27<br />
11<br />
6<br />
1<br />
KEY DEMOGRAPHIC<br />
15-44<br />
YEAR OLD MALES (NZ EUROPEAN)<br />
1<br />
2<br />
1<br />
0<br />
4<br />
0<br />
7<br />
4<br />
85%<br />
MALE<br />
15%<br />
FEMALE<br />
1<br />
0<br />
2<br />
SWIMMING & WADING FATAL DROWNINGS <strong>20</strong><strong>10</strong>-<strong>20</strong><br />
Fatal Drownings (n)<br />
12<br />
<strong>10</strong><br />
8<br />
6<br />
4<br />
2<br />
Fatal Drownings<br />
Fatal Drowning Rate<br />
0.30<br />
0.25<br />
0.<strong>20</strong><br />
0.15<br />
0.<strong>10</strong><br />
0.05<br />
Fatal Drowning Rate<br />
(per <strong>10</strong>0,000 pop.)<br />
0<br />
<strong>20</strong><strong>10</strong>-11<br />
<strong>20</strong>11-12 <strong>20</strong>12-13 <strong>20</strong>13-14 <strong>20</strong>14-15 <strong>20</strong>15-16 <strong>20</strong>16-17 <strong>20</strong>17-18 <strong>20</strong>18-19 <strong>20</strong>19-<strong>20</strong><br />
<strong>Year</strong><br />
0.00<br />
SURF LIFE SAVING NEW ZEALAND NATIONAL BEACH AND COASTAL SAFETY REPORT<br />
68
SNAPSHOT: BOATING<br />
<strong>10</strong> YEAR OVERVIEW | <strong>20</strong><strong>10</strong>-<strong>20</strong><br />
<strong>20</strong><strong>10</strong>-<strong>20</strong><strong>20</strong><br />
FATAL DROWNINGS<br />
62<br />
BOATING<br />
FATAL DROWNINGS LOCATION<br />
7<br />
AVERAGE FATAL<br />
DROWNINGS PER YEAR<br />
6<br />
AVERAGE FATALITY RATE<br />
PER <strong>10</strong>0,000 POPULATION<br />
0.14<br />
26<br />
5<br />
6<br />
0<br />
KEY DEMOGRAPHIC<br />
35+<br />
YEAR OLD MALES (PACIFIC PEOPLES & NZ EUROPEAN)<br />
3<br />
0<br />
2<br />
0<br />
0<br />
0<br />
4<br />
2<br />
95%<br />
MALE<br />
5%<br />
FEMALE<br />
3<br />
2<br />
2<br />
BOATING FATAL DROWNINGS <strong>20</strong><strong>10</strong>-<strong>20</strong><br />
Fatal Drownings (n)<br />
14<br />
12<br />
<strong>10</strong><br />
8<br />
6<br />
4<br />
2<br />
Fatal Drownings<br />
Fatal Drowning Rate<br />
0.30<br />
0.25<br />
0.<strong>20</strong><br />
0.15<br />
0.<strong>10</strong><br />
0.05<br />
Fatal Drowning Rate<br />
(per <strong>10</strong>0,000 pop.)<br />
0<br />
<strong>20</strong><strong>10</strong>-11 <strong>20</strong>11-12 <strong>20</strong>12-13 <strong>20</strong>13-14 <strong>20</strong>14-15 <strong>20</strong>15-16 <strong>20</strong>16-17 <strong>20</strong>17-18 <strong>20</strong>18-19 <strong>20</strong>19-<strong>20</strong><br />
<strong>Year</strong><br />
0.00<br />
SECTION SIX <strong>10</strong> YEAR ACTIVITY OVERVIEW <strong>20</strong>09-19<br />
69
SNAPSHOT: FALLS<br />
<strong>10</strong> YEAR OVERVIEW | <strong>20</strong><strong>10</strong>-<strong>20</strong><br />
<strong>20</strong><strong>10</strong>-<strong>20</strong><strong>20</strong><br />
FATAL DROWNINGS<br />
61<br />
FALLS<br />
FATAL DROWNINGS LOCATION<br />
4<br />
AVERAGE FATAL<br />
DROWNINGS PER YEAR<br />
6<br />
AVERAGE FATALITY RATE<br />
PER <strong>10</strong>0,000 POPULATION<br />
0.13<br />
18<br />
6<br />
7<br />
0<br />
KEY DEMOGRAPHIC<br />
15+<br />
YEAR OLD MALES (NZ EUROPEAN)<br />
3<br />
0<br />
3<br />
0<br />
0<br />
3<br />
6<br />
6<br />
79%<br />
MALE<br />
21%<br />
FEMALE<br />
1<br />
2<br />
2<br />
FALLS FATAL DROWNINGS <strong>20</strong><strong>10</strong>-<strong>20</strong><br />
Fatal Drownings (n)<br />
12<br />
<strong>10</strong><br />
8<br />
6<br />
4<br />
2<br />
Fatal Drownings<br />
Fatal Drowning Rate<br />
0.25<br />
0.<strong>20</strong><br />
0.15<br />
0.<strong>10</strong><br />
0.05<br />
Fatal Drowning Rate<br />
(per <strong>10</strong>0,000 pop.)<br />
0<br />
<strong>20</strong><strong>10</strong>-11 <strong>20</strong>11-12 <strong>20</strong>12-13 <strong>20</strong>13-14 <strong>20</strong>14-15 <strong>20</strong>15-16 <strong>20</strong>16-17 <strong>20</strong>17-18 <strong>20</strong>18-19 <strong>20</strong>19-<strong>20</strong><br />
<strong>Year</strong><br />
0.00<br />
SURF LIFE SAVING NEW ZEALAND NATIONAL BEACH AND COASTAL SAFETY REPORT<br />
70
SNAPSHOT: SNORKELLING<br />
<strong>10</strong> YEAR OVERVIEW | <strong>20</strong><strong>10</strong>-<strong>20</strong><br />
<strong>20</strong><strong>10</strong>-<strong>20</strong><strong>20</strong><br />
FATAL DROWNINGS<br />
36<br />
SNORKELLING<br />
FATAL DROWNINGS LOCATION<br />
4<br />
AVERAGE FATAL<br />
DROWNINGS PER YEAR<br />
4<br />
AVERAGE FATALITY RATE<br />
PER <strong>10</strong>0,000 POPULATION<br />
0.08<br />
3<br />
4<br />
3<br />
4<br />
KEY DEMOGRAPHIC<br />
25-54<br />
YEAR OLD MALES (MAORI)<br />
0<br />
0<br />
0<br />
0<br />
1<br />
0<br />
5<br />
0<br />
97%<br />
MALE<br />
3%<br />
FEMALE<br />
2<br />
6<br />
4<br />
SNORKELLING FATAL DROWNINGS <strong>20</strong><strong>10</strong>-<strong>20</strong><br />
Fatal Drownings (n)<br />
<strong>10</strong><br />
9<br />
8<br />
7<br />
6<br />
5<br />
4<br />
3<br />
2<br />
1<br />
0<br />
Fatal Drownings<br />
Fatal Drownings<br />
Fatal Drowning Rate<br />
Fatal Drowning Rate<br />
<strong>20</strong><strong>10</strong>-11 <strong>20</strong>11-12 <strong>20</strong>12-13 <strong>20</strong>13-14 <strong>20</strong>14-15 <strong>20</strong>15-16 <strong>20</strong>16-17 <strong>20</strong>17-18 <strong>20</strong>18-19 <strong>20</strong>19-<strong>20</strong><br />
<strong>Year</strong><br />
0.16<br />
0.14<br />
0.12<br />
0.<strong>10</strong><br />
0.08<br />
0.06<br />
0.04<br />
0.02<br />
0.00<br />
Fatal Drowning Rate<br />
(per <strong>10</strong>0,000 pop.)<br />
SECTION SIX <strong>10</strong> YEAR ACTIVITY OVERVIEW <strong>20</strong>09-19<br />
71
SNAPSHOT: WATERCRAFT<br />
<strong>10</strong> YEAR OVERVIEW | <strong>20</strong><strong>10</strong>-<strong>20</strong><br />
<strong>20</strong><strong>10</strong>-<strong>20</strong><strong>20</strong><br />
FATAL DROWNINGS<br />
31<br />
WATERCRAFT<br />
FATAL DROWNINGS LOCATION<br />
11<br />
AVERAGE FATAL<br />
DROWNINGS PER YEAR<br />
3<br />
AVERAGE FATALITY RATE<br />
PER <strong>10</strong>0,000 POPULATION<br />
0.07<br />
8<br />
1<br />
2<br />
1<br />
KEY DEMOGRAPHIC<br />
45+<br />
YEAR OLD MALES (NZ EUROPEAN)<br />
0<br />
1<br />
1<br />
0<br />
0<br />
0<br />
5<br />
0<br />
84%<br />
MALE<br />
16%<br />
FEMALE<br />
1<br />
0<br />
0<br />
WATERCRAFT FATAL DROWNINGS <strong>20</strong><strong>10</strong>-<strong>20</strong><br />
6<br />
5<br />
Fatal Drownings<br />
Fatal Drowning Rate<br />
0.14<br />
0.12<br />
Fatal Drownings (n)<br />
4<br />
3<br />
2<br />
0.<strong>10</strong><br />
0.08<br />
0.06<br />
0.04<br />
Fatal Drowning Rate<br />
(per <strong>10</strong>0,000 pop.)<br />
1<br />
0.02<br />
0<br />
<strong>20</strong><strong>10</strong>-11 <strong>20</strong>11-12 <strong>20</strong>12-13 <strong>20</strong>13-14 <strong>20</strong>14-15 <strong>20</strong>15-16 <strong>20</strong>16-17 <strong>20</strong>17-18 <strong>20</strong>18-19 <strong>20</strong>19-<strong>20</strong><br />
<strong>Year</strong><br />
0.00<br />
SURF LIFE SAVING NEW ZEALAND NATIONAL BEACH AND COASTAL SAFETY REPORT<br />
72
SNAPSHOT: LAND BASED FISHING<br />
SNAPSHOT: LAND BASED FISHING<br />
<strong>10</strong> YEAR OVERVIEW | <strong>20</strong><strong>10</strong>-<strong>20</strong><br />
<strong>20</strong><strong>10</strong>-<strong>20</strong><strong>20</strong><br />
FATAL DROWNINGS<br />
31<br />
LAND BASED FISHING<br />
FATAL DROWNINGS LOCATION<br />
3<br />
AVERAGE FATAL<br />
DROWNINGS PER YEAR<br />
3<br />
AVERAGE FATALITY RATE<br />
PER <strong>10</strong>0,000 POPULATION<br />
0.07<br />
8<br />
8<br />
3<br />
0<br />
KEY DEMOGRAPHIC<br />
25-64<br />
YEAR OLD MALES (ASIAN)<br />
0<br />
1<br />
0<br />
0<br />
0<br />
0<br />
1<br />
1<br />
90%<br />
MALE<br />
<strong>10</strong>%<br />
FEMALE<br />
3<br />
1<br />
2<br />
LAND BASED FISHING FATAL DROWNINGS <strong>20</strong><strong>10</strong>-<strong>20</strong><br />
Fatal Drownings (n)<br />
<strong>10</strong><br />
9<br />
8<br />
7<br />
6<br />
5<br />
4<br />
3<br />
2<br />
1<br />
0<br />
Fatal Drownings<br />
Fatal Drowning Rate<br />
<strong>20</strong><strong>10</strong>-11 <strong>20</strong>11-12 <strong>20</strong>12-13 <strong>20</strong>13-14 <strong>20</strong>14-15 <strong>20</strong>15-16 <strong>20</strong>16-17 <strong>20</strong>17-18 <strong>20</strong>18-19 <strong>20</strong>19-<strong>20</strong><br />
<strong>Year</strong><br />
0.16<br />
0.14<br />
0.12<br />
0.<strong>10</strong><br />
0.08<br />
0.06<br />
0.04<br />
0.02<br />
0.00<br />
Fatal Drowning Rate<br />
(per <strong>10</strong>0,000 pop.)<br />
SECTION SIX <strong>10</strong> YEAR ACTIVITY OVERVIEW <strong>20</strong>09-19<br />
73
KEY TERMS<br />
Adult – For this report, adults refer to a person 15 years of<br />
age and over, which aligns with the Stats NZ Tatauranga<br />
Aotearoa classification.<br />
Assist – Where a person requires assistance to return to shore<br />
but would most likely be able to get themselves out of danger<br />
if unaided.<br />
Attempting a Rescue – Trying to retrieve a person in distress<br />
and deliver them to a place of safety.<br />
<strong>Beach</strong> – A wave-deposited accumulation of sediment – usually<br />
sand, but ranging in size up to boulders – deposited between<br />
the upper tidal limit and the offshore area where waves first<br />
start breaking.<br />
<strong>Beach</strong> Fatal Drowning – Where the location of the fatality<br />
occurs on a surf beach, calm water beach or rocky foreshore<br />
and the cause of death involves drowning or immersion.<br />
Boating – Using either a powered vessel or sailing boat for<br />
pleasure and/or fishing.<br />
Bystander – A person who is present at an incident but not<br />
part of it initially.<br />
Calm Water <strong>Beach</strong> – An area of estuarine coastline with sand,<br />
gravel or pebbles that contains a sheltered foreshore, with no<br />
surf zone – e.g. harbour beach.<br />
<strong>Coastal</strong> – Tidal waters (estuary, harbour, marina and river/<br />
harbour bar); ocean up to 1km offshore; or inland up to five<br />
times the width of the inlet/river.<br />
Category 1 Search and Rescue Operations – Search and<br />
Rescue coordinated at a local level by the New Zealand Police;<br />
including land operations, river, lake and inland waterway<br />
operations and close-to-shore marine operations.<br />
<strong>Coastal</strong> Fatal Drowning – Where the location of the fatality<br />
is in tidal waters (estuary, harbour, marina and river/harbour<br />
bar), in the ocean up to 1km offshore or inland up to five<br />
times the width of the inlet/river and the cause of death<br />
includes drowning or immersion.<br />
<strong>Coastal</strong> Risk Assessment - A report that recommends levels<br />
of service provision at a location.<br />
Contract Surf Lifeguard Service – Surf Lifeguard services<br />
that are funded by regional councils and local territorial<br />
authorities, and managed by Surf Life Saving New Zealand<br />
or Surf Life Saving Northern Region<br />
Drowning – The process of experiencing respiratory<br />
impairment from submersion/immersion in liquid; outcomes<br />
are classified as death, morbidity and no morbidity.<br />
DrownBase TM – Database run by Water <strong>Safety</strong> New Zealand<br />
that collates all of the deaths from drowning in New<br />
Zealand. The dataset also includes information on non-fatal<br />
drownings.<br />
Emergency Callout Squads (ECOS) – These are made up<br />
of several combined clubs and volunteer surf lifeguards<br />
attached to external local rescue/emergency services. Squad<br />
members are qualified and equipped to respond to any<br />
incident within the beach and coastal environment.<br />
Emergency Response – An action taken by an SLS entity<br />
in response to a call for assistance from an emergency<br />
management organisation.<br />
Estuary - A partially enclosed coastal body of water that is<br />
either permanently or periodically open to the sea<br />
Falls (trips/slips) – An event that results in a person tripping/<br />
slipping so they end up accidentally immersed in water.<br />
Fatal Drowning Rate – A comparative rate of drowning (as<br />
the cause of death) to the size of the population in a given<br />
area.<br />
First Aid – First aid is the first and immediate assistance given<br />
to any person suffering from either a minor or serious illness<br />
or injury, with care provided to preserve life, prevent the<br />
condition from worsening, or to promote recovery.<br />
Harbour – Large inner body of water surrounded on several<br />
sides by prominences of land<br />
Hazard – A source of potential harm.<br />
Incident – Any unplanned event requiring lifesaving services<br />
intervention.<br />
Intervention – An action performed by a Surf Lifeguard to<br />
prevent a situation from deteriorating, which includes injury<br />
or drowning. Interventions include preventative actions,<br />
assists, rescues, searches, major first aids and minor first<br />
aids.<br />
IRB – Inflatable rescue boat.<br />
Land Based Fishing – Attempting to catch fish from the<br />
shoreline. The locations for such activities are generally<br />
rocky headlands, rock platforms, though wharfs, jetties and<br />
beaches are also common.<br />
Major First Aid – Any incident where a victim is administered<br />
some form of advanced medical treatment or requires<br />
hospitalization.<br />
Marina – A boat basin offering dockage and other service for<br />
small craft.<br />
Minor First Aid - Where a victim is administered some form of<br />
minor medical treatment – minor cut, bluebottle sting, sand<br />
in the eye, minor strain or sprains.<br />
Morbidity – Any physical or psychological state considered<br />
to be outside the realm of normal well-being. The term<br />
morbidity is often used to describe illness, impairment, or<br />
degradation of health.<br />
Net Fishing – Using a net to trawl the shallows of a beach/<br />
estuary for fish.<br />
Non-fatal Drowning – A subset of drowning, the process<br />
of experiencing respiratory impairment from submersion/<br />
immersion in liquid, where the outcome is classified as<br />
morbidity and no morbidity.<br />
Patrol – Surf Lifeguard service to monitor activities in/around<br />
SURF LIFE SAVING NEW ZEALAND<br />
74<br />
NATIONAL BEACH & COASTAL SAFETY REPORT
an aquatic environment and respond accordingly through<br />
either preventative actions or rescue operations. A patrol<br />
will use the red and yellow patrol flags to assign a safer<br />
swimming area.<br />
Patrol Flags – Red/yellow horizontally divided flags which<br />
are set after performing a risk assessment to determine the<br />
most suitable area for swimming. The flags identify a zone<br />
for swimming and bodyboarding within a patrolled location.<br />
Patrolled Location – A location supervised by a Surf Lifeguard<br />
service.<br />
Preventative Action – Direct action taken to reduce or<br />
eliminate the probability of a specific rescue, first aid or other<br />
reportable incident from occuring.<br />
Rescue – Where a person requires immediate help to return to<br />
shore (or place of safety) and who without intervention would<br />
have suffered distress, injury or drowning.<br />
Risk-Adjusted Water Use Values – Dictates how many<br />
lifeguards are required at patrol location at any given time.<br />
Rock/Cliff – A rock platform that may or may not have a high<br />
steep face.<br />
Rocky Foreshore - The area of coastline with shoreline rocks,<br />
including steep rocky cliffs that is exposed by low tides and<br />
submerged by high tides.<br />
RWC – Rescue water craft or JetSki.<br />
Scuba Diving – Swimming underwater with the aid of scuba<br />
equipment for recreational or commercial purposes.<br />
Searches - Any organised search for a missing person or group<br />
either at sea or on land. Searches include body recoveries.<br />
Search and Rescue – The search for and provision of aid to<br />
people who are in distress or imminent danger.<br />
Season – For the context of this report, the <strong>20</strong>19/<strong>20</strong> season is<br />
for the period of July <strong>20</strong>19 to June <strong>20</strong><strong>20</strong>.<br />
Shell Fishing – Collecting shellfish while onshore or wading/<br />
swimming in water.<br />
Snorkelling – Swimming with a snorkel and face mask.<br />
Surf <strong>Beach</strong> – An area of land with sand, gravel or pebbles that<br />
contains a foreshore and surf zone. Surf beaches include low<br />
energy and exposed coasts.<br />
Surf Lifeguard – An individual who undertakes patrols at a<br />
beach. As a minimum requirement they are qualified in surf<br />
rescue and basic lifeguard support.<br />
Surf Lifeguard Service – A coordinated group that exists to<br />
provide aquatic safety services to the public. This includes<br />
Volunteer Surf Life Saving Clubs, Contract Surf Lifeguards,<br />
RWCs, IRB’s, ATV’s and 4WD units.<br />
Surf Life Saving Club – An affiliated not-for-profit organisation<br />
that has volunteer members who provide patrols and coastal<br />
safety services to the community.<br />
Surf Life Saving New Zealand – The leading beach and<br />
coastal safety, drowning prevention and rescue authority<br />
in New Zealand. The purpose of the organisation is to<br />
reduce injuries, fatal drownings and non-fatal drownings<br />
on our beaches and coasts with a vision of zero preventable<br />
drownings.<br />
Surveillance Patrols – Surf Lifeguard services that monitor<br />
beach and water users without designating a red and yellow<br />
flagged area. This approach is effective for extending<br />
patrolling hours or season length, where resources are<br />
limited.<br />
Swimming – Moving through water by moving the body or<br />
parts of the body.<br />
Wading – Walking through water while partially immersed.<br />
Water <strong>Safety</strong> New Zealand – Water <strong>Safety</strong> New Zealand<br />
works with water safety sector organisations, individuals and<br />
the public to reduce the incidence of drowning and injury in<br />
New Zealand. The purpose is to lead a step change in New<br />
Zealand so people don’t drown with a vision that by <strong>20</strong>25<br />
more people in New Zealand respect the water and have the<br />
skills, knowledge and awareness to enjoy it safely.<br />
Watercraft – A piece of non-powered recreational equipment<br />
used in water. Examples include surfboards, stand-up<br />
paddleboards, body boards, windsurfers or kayaks.<br />
SYMBOL KEY<br />
Male and<br />
Female<br />
Female<br />
and Male<br />
Lifeguards<br />
Fall<br />
Boating<br />
Surf <strong>Beach</strong><br />
Fatal<br />
Drownings<br />
Rescue<br />
Land Based<br />
Fishing<br />
Snorkelling<br />
Calm Water<br />
<strong>Beach</strong><br />
Attempting<br />
a Rescue<br />
Rescue<br />
Tube<br />
Emergency<br />
Callout<br />
Squad<br />
Net/Shell<br />
Fishing<br />
Dive<br />
Preventative<br />
Action<br />
IRB<br />
Scuba Diving<br />
0-1Km<br />
Off Shore<br />
Assist<br />
Swimming /<br />
Wading<br />
Watercraft<br />
Rocky<br />
Foreshore<br />
Harbour Estuary Marina River/<br />
Harbour Bar<br />
SURF LIFE SAVING NEW ZEALAND<br />
75<br />
KEY TERMS
REFERENCES<br />
METHODOLOGY<br />
The <strong>National</strong> <strong>Beach</strong> and <strong>Coastal</strong> <strong>Safety</strong> <strong>Report</strong> <strong>20</strong><strong>20</strong><br />
contains information on SLS capability and membership<br />
capacity; rescues and emergency response; and fatal and<br />
non-fatal drownings for the period of 1 July <strong>20</strong><strong>10</strong> to 30 June<br />
<strong>20</strong><strong>20</strong>. This information is correct as of 17 November <strong>20</strong><strong>20</strong>.<br />
All care has been taken to ensure the statistical information<br />
included within this report is correct. However, pending the<br />
outcome of ongoing coronial investigations, this data may<br />
be amended. Data in figures may not always add up to<br />
<strong>10</strong>0% due to rounding.<br />
The <strong>National</strong> <strong>Beach</strong> and <strong>Coastal</strong> <strong>Safety</strong> <strong>Report</strong> only<br />
documents incidents that have occurred within the<br />
coastal zone. The coastal zone is defined as “Tidal waters<br />
(estuary, harbour, marina and river/harbour bar); ocean<br />
up to 1km offshore; or inland up to five times the width<br />
of the inlet/river”.<br />
LIMITATIONS AND RECOMMENDATIONS FOR FUTURE<br />
RESEARCH<br />
The regional fatal drowning rates per <strong>10</strong>0,000 population<br />
use regional population estimates obtained from Stats NZ.<br />
However, these regional estimates do not include visitors<br />
from elsewhere in New Zealand or visitors from overseas.<br />
Further research is recommended to adjust these figures to<br />
account for the seasonal influx of visitors to each respective<br />
region.<br />
Further research is required to enable Surf Life Saving New<br />
Zealand and water safety stakeholders to gain a greater<br />
understanding of how and why people are recreating on our<br />
coastlines. Additional research is also required to understand<br />
how residents and international tourists use beach and<br />
coastal areas for recreation. Whilst applied psychological<br />
research is also recommended to assess public behaviour<br />
and perception of risk on our beaches. These findings will<br />
be used to inform community engagement and education<br />
strategies nationally.<br />
CAPABILITY ANALYSIS<br />
The Patrols and Memberships (PAM) database is a central<br />
repository for all Surf Life Saving clubs in New Zealand. It<br />
is used to log details of members (contact details, awards,<br />
memberships), patrols and incidents. PAM holds this<br />
information securely, and the data gives us an understanding<br />
of trends across the whole organisation. The database<br />
includes the Customer Relationship Management System<br />
(CRM) which includes operational data such as rescues, first<br />
aids, membership statistics and awards. Information was<br />
extracted from the CRM to identify how many interventions<br />
were performed by volunteers, lifeguards and lifesaving<br />
services during <strong>20</strong>19-<strong>20</strong>; and how many active Surf<br />
Lifeguards and award holders there were during this period.<br />
FATAL DROWNING DATA ANALYSIS<br />
Fatal drownings statistics was recorded in DrownBase TM<br />
and shared for this report by Water <strong>Safety</strong> New Zealand<br />
(<strong>20</strong><strong>20</strong>). Water <strong>Safety</strong> New Zealand gives no warranty as to<br />
the correctness of the information or the data provided as it<br />
is supplied to WSNZ by third parties, not under its control.<br />
While WSNZ is satisfied as to its accuracy for the purposes<br />
for which it is supplied to it, WSNZ shall not be liable for any<br />
loss or damage arising directly or indirectly from the use of<br />
any data supplied. All reported statistics are provisional.<br />
The non-fatal drowning data used in this report is based<br />
on hospital stays of at least 24 hours and has been provided<br />
by WSNZ’s as recorded in DrownBase TM . The data is sorted<br />
by the ICD-<strong>10</strong>-AM/ACHI/ACS international coding system.<br />
SUGGESTED CITATION: Surf Life Saving New Zealand.<br />
(<strong>20</strong><strong>20</strong>). <strong>National</strong> <strong>Beach</strong> and <strong>Coastal</strong> <strong>Safety</strong> <strong>Report</strong> <strong>20</strong><strong>20</strong>.<br />
Wellington: Surf Life Saving New Zealand.<br />
ACKNOWLEDGEMENTS<br />
Surf Life Saving New Zealand would like to thank the<br />
following organisations for their assistance in the production<br />
of the <strong>National</strong> <strong>Beach</strong> & <strong>Coastal</strong> <strong>Safety</strong> <strong>Report</strong>. Water<br />
<strong>Safety</strong> New Zealand; Surf Life Saving Australia; Statistics<br />
New Zealand; <strong>SLSNZ</strong> regions and Volunteer Surf Life Saving<br />
clubs; <strong>SLSNZ</strong> would also like to thank our sponsors for their<br />
continued support and regional councils and local territorial<br />
authorities for their funding towards the cost of providing<br />
the Contract Lifeguard Service.<br />
The report was compiled by Dr Mick Kearney (<strong>National</strong><br />
<strong>Coastal</strong> <strong>Safety</strong> Manager), Adam Wooler (Chief Operations<br />
Officer) and Rajal Middleton (Head of Commercial and<br />
Marketing).<br />
PHOTOGRAPHIC MATERIAL<br />
Cover, Pages 6-7, 30-31, 34-35 and 77: Cody Keepa<br />
Pages 18-19: Tim Marshal (Unsplash.com)<br />
Pages 26-27: Ussama Azam (Unsplash.com)<br />
Pages 66-67: Chuam (Unsplash.com)<br />
SURF LIFE SAVING NEW ZEALAND<br />
76<br />
NATIONAL BEACH AND COASTAL SAFETY REPORT
Road, fire and boating<br />
safety have had significant<br />
investment in public education<br />
strategies and campaigns,<br />
which has not only<br />
dramatically reduced deaths<br />
and injuries but also raised<br />
awareness of the issues. It's<br />
now time to do the same for<br />
beach and coastal safety.<br />
© <strong>20</strong>19 SURF LIFE SAVING NEW ZEALAND<br />
This publication is copyright. Except as expressly provided<br />
in the Copyright Act 1968 and the Copyright Amendment Act<br />
<strong>20</strong>06, no part of this publication may be reproduced, stored in<br />
any retrieval systems or transmitted by any means (including<br />
electronic, mechanical, micro-copying, photocopying,<br />
recording or otherwise) without prior permission from Surf<br />
Life Saving New Zealand. Every attempt has been made to<br />
trace and acknowledge copyright, but in some cases, this<br />
may not have been possible. Surf Life Saving New Zealand<br />
apologises for any accidental infringements and would<br />
welcome any information to redress the situation.<br />
REFERENCES<br />
ACC. (<strong>20</strong>16). Value of a Statistical Life (VOSL) or “social<br />
costs” of drowning and drowning injury. Unpublished<br />
<strong>Report</strong>.<br />
Statistics New Zealand. (<strong>20</strong><strong>20</strong>, October <strong>10</strong>). Population<br />
Estimates-DPE. http://infoshare.stats.govt.nz/<br />
Water <strong>Safety</strong> New Zealand. (<strong>20</strong>15). New Zealand Water<br />
<strong>Safety</strong> Sector Strategy <strong>20</strong><strong>20</strong>. https://cdnflightdec.userfirst.<br />
co.nz/uploads/sites/watersafety/files/PDFs/Official_<br />
Documents/Sector-Strategy-Published-Version-Aug-<strong>20</strong>15.<br />
pdf<br />
Water <strong>Safety</strong> New Zealand. (<strong>20</strong><strong>20</strong>). Water <strong>Safety</strong> New<br />
Zealand Annual <strong>Report</strong> <strong>20</strong><strong>20</strong>. https://cdn-flightdec.userfirst.<br />
co.nz/uploads/sites/watersafety/files/Annual_<strong>Report</strong>s/<br />
WSNZ_<strong>20</strong><strong>20</strong>-Annual<strong>Report</strong>-FINAL_W.pdf<br />
SURF LIFE SAVING NEW ZEALAND<br />
77<br />
REFERENCES
CONTACT INFORMATION<br />
Surf Life Saving New Zealand<br />
Phone: +64 4 560 0383<br />
E-Mail: communications@surflifesaving.org.nz