

Livelihood Profile Amhara Region, Ethiopia North Wollo ... - FEG
Livelihood Profile Amhara Region, Ethiopia North Wollo ... - FEG
Livelihood Profile Amhara Region, Ethiopia North Wollo ... - FEG

Create successful ePaper yourself
Turn your PDF publications into a flip-book with our unique Google optimized e-Paper software.
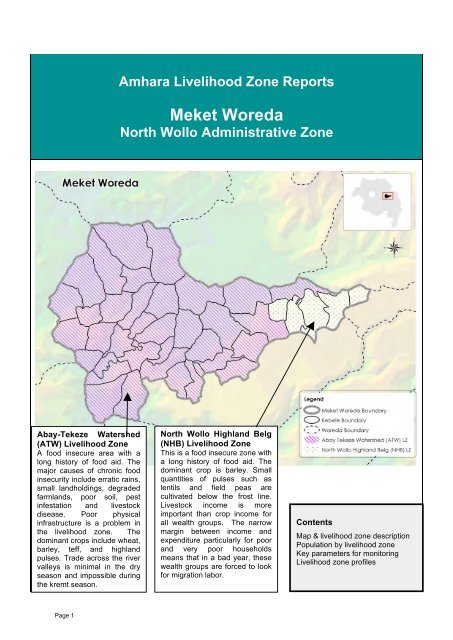
Abay-Tekeze Watershed<br />
(ATW) <strong>Livelihood</strong> Zone<br />
A food insecure area with a<br />
long history of food aid. The<br />
major causes of chronic food<br />
insecurity include erratic rains,<br />
small landholdings, degraded<br />
farmlands, poor soil, pest<br />
infestation and livestock<br />
disease. Poor physical<br />
infrastructure is a problem in<br />
the livelihood zone. The<br />
dominant crops include wheat,<br />
barley, teff, and highland<br />
pulses. Trade across the river<br />
valleys is minimal in the dry<br />
season and impossible during<br />
the kremt season.<br />
Page 1<br />
<strong>Amhara</strong> <strong>Livelihood</strong> Zone Reports<br />
Meket Woreda<br />
<strong>North</strong> <strong>Wollo</strong> Administrative Zone<br />
<strong>North</strong> <strong>Wollo</strong> Highland Belg<br />
(NHB) <strong>Livelihood</strong> Zone<br />
This is a food insecure zone with<br />
a long history of food aid. The<br />
dominant crop is barley. Small<br />
quantities of pulses such as<br />
lentils and field peas are<br />
cultivated below the frost line.<br />
Livestock income is more<br />
important than crop income for<br />
all wealth groups. The narrow<br />
margin between income and<br />
expenditure particularly for poor<br />
and very poor households<br />
means that in a bad year, these<br />
wealth groups are forced to look<br />
for migration labor.<br />
Contents<br />
Map & livelihood zone description<br />
Population by livelihood zone<br />
Key parameters for monitoring<br />
<strong>Livelihood</strong> zone profiles
Page 2<br />
<strong>Amhara</strong> <strong>Livelihood</strong> <strong>Profile</strong><br />
Population by <strong>Livelihood</strong> Zone and Kebele (2005)<br />
Woreda: Meket<br />
Zone: N <strong>Wollo</strong><br />
Woreda population 249,742<br />
<strong>Livelihood</strong> Zone: <strong>Livelihood</strong> Zone: <strong>Livelihood</strong> Zone:<br />
Abay Tekeze Watershed <strong>North</strong> <strong>Wollo</strong> Highland Belg<br />
LZ Population: 224,695 LZ Population: 25,047<br />
Population by Kebele: Population by Kebele: Population by Kebele:<br />
Agrit(005) 9,094 Adsegie Ab 4,386<br />
Ansa Wuha( 2,457 Denkena(04 3,933<br />
Arebal(028 5,228 Estayish(0 7,123<br />
Aydefer(03 6,524 Selonajie( 6,159<br />
Aymate(012 6,105 Wero(037) 3,446<br />
Berkeza(01 6,004<br />
Boya(036) 10,727<br />
Debeko(032 9,103<br />
Debre Kerb 4,963<br />
Debre Zebi 10,320<br />
Defergie(0 4,878<br />
Giorgis (0 7,009<br />
Hamusit(03 7,699<br />
Hana Mekuw 6,365<br />
Kemkem(026 5,047<br />
Kurisa(001 6,086<br />
Lama Debir 3,634<br />
Maserut(01 6,681<br />
Mekuwat(02 6,981<br />
Mesfin(029 8,940<br />
Sekoy Gebr 6,307<br />
Sendej(025 3,771<br />
Serko(006) 3,642<br />
Seron Meda 3,756<br />
Taguba Mes 8,429<br />
Tajja(030) 6,007<br />
Tebelat(01 8,154<br />
Temtemat(0 5,705<br />
Tiwuha(004 6,652<br />
Wefchina(0 4,471<br />
Wekieta(02 11,683<br />
Werkaye Ma 9,083<br />
Weyra Ber( 4,405<br />
Zbie(018) 3,692<br />
Zufan Amba 5,093
Content of the Woreda <strong>Profile</strong>s<br />
The Woreda <strong>Profile</strong>s are a compilation of the livelihood information directly relevant to a<br />
single woreda. They provide a map of the woreda showing the livelihood zones within<br />
the woreda, population data by kebele and livelihood zone within the woreda, the<br />
relevant livelihood zone profiles and the key parameters (indicators) for monitoring<br />
within the woreda. Please note that sources of food and income, whilst typical of the<br />
livelihood zone, might not be found in all woredas within the livelihood zone.<br />
Urban Populations<br />
Urban HEAs have not been completed for <strong>Ethiopia</strong>. Large urban centres are not included<br />
in the livelihood baselines.<br />
Source of Population Data<br />
Note: The 2005 woreda population is that estimated by the Central Statistical Authority.<br />
The list of kebeles in the woreda was taken from the 1994 census and each kebele's 2005<br />
population calculated by multiplying the 1994 census figure by the increase in total<br />
woreda population since 1994. Information from the 1994 census was used in preference<br />
to other sources of information since this represents the main official source of<br />
population data for the woreda. Difficulties were encountered due to changes in woreda<br />
and kebele boundaries since 1994. Many kebeles have been combined since 1994. Where<br />
kebeles have been renamed or combined since 1994, woreda officials were asked to<br />
assign the old 1994 kebele to one or other new kebele in the woreda. It was sometimes<br />
not possible to locate a kebele (e.g. because woreda officials did not recognize the name<br />
or did not include the kebele in their list). In these cases an 'unknown' category has been<br />
included in the population analysis. A 'not assigned' category has also been included for<br />
livelihood zones. Kebeles included in the 'not assigned' category could not be assigned to<br />
any of the livelihood zones in the woreda.<br />
Page 3
Key Parameters<br />
Abay Tekeze Watershed (ATW) - Key Parameters<br />
Item Key Parameter - Quantity Key Parameter – Price<br />
Crops • Meher Teff<br />
• Meher Barley<br />
• Meher Lentils<br />
• Meher Millet<br />
• Meher Wheat<br />
• Trees<br />
• Honey<br />
Livestock production • Cows’ milk<br />
• Cattle<br />
• Goats<br />
Other food and cash<br />
income<br />
• Chickens<br />
• Labour – migration<br />
• Labour Weeding/ploughing<br />
• Labour – harvesting<br />
<strong>North</strong> <strong>Wollo</strong> Highland Belg (NHB) - Key Parameters<br />
• Meher Maize<br />
• Meher Teff<br />
• Meher Lentils<br />
• Meher Wheat<br />
• Trees<br />
• Honey<br />
• Butter sales<br />
• Cattle<br />
• Goats<br />
• Chicken sales<br />
• Labour – migration<br />
• Labour – weeding/ploughing<br />
• Labour – harvesting<br />
Item Key Parameter - Quantity Key Parameter – Price<br />
Crops • Belg Pulses<br />
• Belg Wheat<br />
• Belg Barley<br />
• Belg Flax<br />
• Trees<br />
Livestock production • Cattle<br />
• Cow’s milk<br />
Other food and cash<br />
income<br />
Page 4<br />
• Belg Sorghum (staple)<br />
• Belg Barley<br />
• Belg Flax<br />
• Trees<br />
• Belg Pulses<br />
• Belg Wheat<br />
• Butter sales<br />
• Cattle<br />
• Sheep • Sheep<br />
• Labour – migration • Labour – migration
<strong>Livelihood</strong> <strong>Profile</strong><br />
<strong>Amhara</strong> <strong>Region</strong>, <strong>Ethiopia</strong><br />
Abay-Tekeze Watershed <strong>Livelihood</strong> Zone (ATW) October 2007 1<br />
Zone Description<br />
The livelihood zone stretches from the meher<br />
dependent woina dega area of north <strong>Wollo</strong> (Meket,<br />
Wadla, Delanta and Dawnt woredas) to the Southeastern<br />
part of the South Gonder Administrative Zone<br />
(E & W Esite, Farta, Lay Gayint, Simada and Tach<br />
Gayint woredas). The landscape has diverse<br />
characteristics: undulating, flat or hilly surfaces, and<br />
valleys dissecting the livelihood zone. The area is<br />
mainly woina dega, but includes some kola and dega<br />
agro-ecology. The vegetation includes scattered trees<br />
and bush/shrubs like acacia species, dodenia, dedeho<br />
(local name), Olia africana, Croton macrostacheous,<br />
embach (local name) and eucalyptus plantations.<br />
Major roads crossing the livelihood zone are Woreta to<br />
Woldia and Lalibela to Alemketema. The major rivers<br />
found in the livelihood zone are Beshilo,<br />
Chefa, Zita, Enchika, Gazo, Deremo, Tilkit and Arushe Wonkat. Rivers bordering the livelihood zone are Tekeze, Abay<br />
(Blue Nile) and Teleyaeyen. Major towns found in the livelihood zone are Mekaneesus, Wogeda, Arb Gebeya, Felakit,<br />
Kone and Wogel Tena. In the livelihood zone, there are many historical places which might attract tourists such as: Este<br />
Mekaneyesus church, the Bethlehem higher church school, Segoda Mariam church, Abune Arone, Chira Medahenialem<br />
church. In addition the topography and views recommend themselves to ecotourism.<br />
The population density is moderate with a scattered pattern of settlement. The rainfall pattern of the livelihood zone is<br />
erratic and of uneven distribution. The annual rainfall amount around the livelihood zone ranges from 800 – 1500mm.<br />
This is a mixed farming area of crop production and animal husbandry. Natural resources in the area include sands<br />
deposited in the major river, stones, eucalyptus trees, and remnants of natural forests around the churches. Crop<br />
production is entirely rain fed, except in very specific sites where vegetables are cultivated through traditional<br />
irrigation. There is only one rainy season – kremt - and it is used for the cultivation of both long and short cycle crops.<br />
In order of importance, the dominant crops of the <strong>Livelihood</strong> Zone are sorghum, teff and haricot beans. The methods of<br />
land preparation in the livelihood zone are mainly by ox-plowing but tilling by hand occurs in the hilly areas on steeply<br />
sloping land.<br />
Livestock in this zone are sheep, cattle and goats – these are usually grazed, but the middle and better off also purchase<br />
animal feed like hay and crop residues from October to January from the very poor and poor. Livestock are watered<br />
from the major rivers in the livelihood zone in the rainy season. In the dry season, shallow hand dug wells provide<br />
water for livestock in Estayish, Hamusit, Geregera, Mekaneyesus, Gibasra, Licha, Mikere, Agona, Lewaye, Workeye,<br />
kurite, Agrit, Berekeza, Araabal, and Debrezebit, in addition to many small streams and spring water which has been<br />
developed for both animal and human consumption. Water for livestock is usually free but in Meket district there is a<br />
minimum payment for guards and the maintenance of shallow well water sources for livestock. Better of wealth group<br />
replace their oxen and milking cows from their herd while the poor and middle wealth groups replace them through<br />
purchase from market. Most households keep poultry. The main diseases and parasites affecting livestock are anthrax,<br />
blackleg (cattle and equines), sheep pox, pasteurellosis (all livestock), African horse fever, lumpy skin and parasites<br />
(tick, mange, helminthiasis, fasciolla).<br />
Main natural constraints to accessing food and generating cash income include: drought, pest infestation and livestock<br />
disease. Poor physical infrastructure and complete obstruction of transportation during the rainy seasons also exacerbate<br />
the problem of accessing food and cash income.<br />
The Safety Net program is implemented in all the woredas via both public work and direct support.<br />
Field work for the current profile was undertaken in October 2007. The information presented refers to November 2005-October 2006 (EC Heder<br />
1998 to Tekemt 1999), a good year by local standards. Provided there are no fundamental and rapid shifts in the economy, the information in this<br />
profile is expected to remain valid for approximately five years (i.e. until 2012). ). The exchange rate January 2006 1USD = 8.67 ETB.<br />
Page 5
Based on the government policy about 20 percent of the PSNP beneficiaries receive direct support. The amount paid is<br />
3-6 months of wheat 15kg, pulses1.5 kg and 0.45 litres of oil per month (in return for 5 days work), or cash.<br />
About 50 – 60 percent of the people in the livelihood zone also access credit. Official credit is taken for the following<br />
activities: sheep and cattle fattening 1000-2000 ETB, sheep rearing 600-4000 ETB and petty trade 1500-5000 ETB.<br />
Repayment terms depend on the type of loan taken and start from one month to one year after receiving the loan.<br />
Interest rates range from 12.5% on loans taken from cooperatives to 18% from the <strong>Amhara</strong> Credit and Saving Institute<br />
(ACSI).<br />
The dominant crops of the livelihood zone are wheat, barley, teff, highland pulses (faba beans, lentils, field peas,<br />
chickpeas and vetch), highland oil crops (noug and flax), and lowland oil crops like safflower. With the exception of<br />
the very poor who obtains their food through purchase, own crop production covers the highest proportion of the annual<br />
food requirement of all other wealth groups. In a typical year, better-off and middle households have a high reliance<br />
upon livestock and crop sales as a means of generating cash income. For the poor and the very poor the Safety Net is<br />
the major source of cash income even in a typical year.<br />
Markets<br />
Poor physical infrastructure and the remote location of the livelihood zone are the major limiting factors that restrict<br />
viable trade interaction between the zone and external markets as well as between different markets within the zone.<br />
Trade interaction across the rivers valley is minimal during the dry season and totally impossible during the kremt<br />
season.<br />
As crop production is very low, almost all agricultural products are consumed locally and whatever is produced does<br />
not exceed the local demand. Haricot beans are the only crop supplied to external markets, mostly to the nearby town<br />
markets (at Dejen, Mota and Debre Tabor) as well as Dessie and Addis Ababa. When grain is unavailable in the local<br />
markets during the hunger season, maize is supplied to the livelihood zone from surplus producing areas in Gojam and<br />
other regions.<br />
Livestock and livestock products are sold in the major towns within the zone, based on proximity.<br />
Approximately half of the employment is found locally, and the remaining employment is gained by migration to<br />
Rayya Kobo, Jimma, East Shewa (Nazaret), Bale, Metemma, Humera, Pawi and Gondar.<br />
Seasonal Calendar<br />
Rainy Seasons Kremt<br />
May Jun Jul Aug Sep Oct Nov Dec Jan Feb Mar Apr<br />
Legend planting cons. green harvest W eeding<br />
W heat<br />
Barley<br />
Teff<br />
Highland pulses<br />
Livestock sales<br />
Cattle in heat<br />
Milk production<br />
Urban Labour<br />
Labour Migration<br />
Local labour<br />
Food purchase<br />
Hunger season<br />
Rainfall Pattern<br />
Dry belg<br />
oxen shoats cattle Land prep.<br />
May Jun Jul Aug Sep Oct Nov Dec Jan Feb Mar Apr<br />
There are 3 main seasons: Bega/dry season (January-May), kremt/rainy season (June–September) and meher/harvesting<br />
Page 6<br />
Abay Tekeze Watersheds <strong>Livelihood</strong> Zone
(October-December). There is a belg/small rains season (January–March) for some parts within <strong>North</strong> <strong>Wollo</strong>. Land<br />
preparation from (February-June) and weeding (July-September) are the most laborious and time-consuming activities.<br />
Agriculture is entirely dependent on kremt rains. Barley and teff have short, intermediate and long cycle crop varieties.<br />
Short cycle barley is grown from June to September and the short cycle teff from July-October. Long cycle barley, teff<br />
and wheat are grown from May/June -November/December.<br />
Different types of livestock are sold at different times of the year. Shoats are sold around the major Christian Festivals<br />
(New Year, Christmas and Easter) when the maximum prices are anticipated. Cattle are sold in the months when oxen<br />
are not needed for agricultural activities. There is some control over breeding to adjust the birth time of livestock to<br />
when sufficient feed is available.<br />
Labour migration occurs July – December to join the agricultural activity in Raya, Metemma, Pawi, Nazrate and<br />
Humera. From January- April/May people travel to Addis and Jimma for construction and coffee picking. Local<br />
employment opportunities start with weeding in July and continue through to harvesting in November. The hunger<br />
season and the period of the greatest dependence on the market for food is two-three months between August and<br />
October.<br />
Wealth Breakdown<br />
V ery<br />
P oor<br />
H H size<br />
Land area<br />
cultivated<br />
P oor 5-7 1-3 tim ad<br />
M iddle 6-8 5-7 tim ad<br />
B etteroff<br />
0% 20% 40%<br />
% of households<br />
Livestock/asset holding O ther assets<br />
4-6 0-2 tim ad 3-5 chickens 0-30 eucalyptus tree<br />
6-8 7-9 tim ad<br />
W ealth G roups C haracteristics<br />
3-5 shoats, 0-2 ox, 0-1<br />
cows, 3-5 chicken<br />
10-20 shoats, 0-2 ox, 2-4<br />
cow s, 0-2 donkey, 0-2<br />
horse, 3-5 chicken<br />
20-30 shoats, 1-3 oxen, 4-6<br />
cow s, 1-3 donkey, 0-2<br />
horse, 2-4 chicken<br />
4 tim ads=1 hectare<br />
50-150 eucalyptus tree<br />
300-400 eucalyptus tree,<br />
0-2 beehives<br />
500-700 eucalyptus tree,<br />
2-4 beehives<br />
The most important determinants of wealth are the size of land owned by households, and the ownership of livestock in<br />
general and ownership of plough oxen in particular. Ownership of a pair of oxen allows better-off households to<br />
prepare their land on time and rent-in the land of poor and very poor households on a contractual basis. The most<br />
common contractual agreement between the better-off`/middle and poor/very poor is ‘yekul’ (‘equal’) in which 50% of<br />
the harvest goes to each contracting party after threshing. Land holding ranges from 2-3 timad for the very poor to 5-7<br />
timads for the better-off. The difference in volume of crop production among the different socio-economic groups is<br />
partially attributable to the differences in land holdings and to the fact that the middle and better-off can rent in land<br />
from the poor.<br />
Poorer households exchange labor for ox plowing. One day of ox plowing is paid for with for two days labor and the<br />
eventual crop residues. Constraints to crop production for the better-off include shortage of land and its poor fertility,<br />
the limited supply of and high price of inputs (e.g. improved seeds and fertilizers), and lack of labor. Local solutions<br />
include using compost and selected local seeds.<br />
Livestock ownership is constrained by shortage of grazing land and feed, lack of labor to look after animals, the<br />
prevalence of animal diseases and lack of improved breeds. The better-off resolve some of these problems by buying<br />
crop residues and hay during the meher season, employing children from poorer households, obtaining veterinary<br />
services from the nearby agricultural office and using better local breeds.<br />
Eucalyptus trees are another source of income in this livelihood zone. The poor have limited land, and they lack the<br />
equipment for digging and watering eucalyptus plantations and have limited experience of growing trees. Local<br />
solutions adopted by poorer households are to rent equipment and get experience from the better-off.<br />
Page 7<br />
Abay Tekeze Watershed <strong>Livelihood</strong> Zone
Sources of Food – A good year (2005-06)<br />
The contribution of own crop production<br />
to the annual food requirement of the<br />
different households positively correlates<br />
with the economic status of the wealth<br />
groups consistently increasing from the<br />
very poor to the better-off. In a typical<br />
year, while the middle and better-off<br />
households cover more than 90% of their<br />
annual food needs, the poor and very poor<br />
can only afford to cover only about 50%<br />
and 40% of their requirement respectively.<br />
Main foods consumed by all wealth<br />
groups are wheat, barley and teff. The<br />
better off consume more teff and the poor<br />
consume more barley.<br />
All wealth groups, though to a different<br />
extent, rely on the purchase of food to<br />
make up their annual food deficit.<br />
Consumption of livestock products is only<br />
In the graph, food access is expressed as a percentage of minimum food<br />
requirements, taken as an average food energy intake of 2100 kcals per<br />
person per day.<br />
relevant to the better-off and middle, the better-off having the advantage of owning a larger number of livestock.<br />
The contribution of the Safety Net is significant for poor and very poor households, and they also take payments in kind<br />
(direct payment in grain) for casual work.<br />
Sources of Cash – a good year (2005-06)<br />
100%<br />
80%<br />
60%<br />
40%<br />
20%<br />
0%<br />
120%<br />
100%<br />
80%<br />
60%<br />
40%<br />
20%<br />
0%<br />
Annual<br />
income<br />
(ETB)<br />
1400-1800 1800-2200 2500-3500 4000-4500<br />
The graph provides a breakdown of total cash income<br />
according to income source.<br />
V.Poor Poor Middle Better-off<br />
Payment in kind<br />
Safty net<br />
Purchase<br />
livestock prod.<br />
There are differences in the type and<br />
relative importance of income options<br />
available to the different wealth groups.<br />
Higher crop production enables the<br />
better-off and middle households to<br />
generate much of their cash income from<br />
the sale of crops: highland pulses (lentils,<br />
field peas and faba beans), teff and wheat.<br />
The poor sell a small amount of teff.<br />
Ownership of larger numbers of livestock<br />
also separates the better-off and middle<br />
households from the other wealth groups.<br />
Thus the cash obtained through the sale of<br />
livestock is the second most important<br />
source of cash income for both wealth<br />
groups. Income from the sale of animals<br />
varies by wealth group as the poor often<br />
sell very young sheep when facing money<br />
shortages whilst the better off can sell<br />
when the animal is bigger and prices are better The combined contribution of labor sales and Safety Net receipts<br />
constitutes about 60% and more than 80% of the annual cash income of the poor and very poor respectively.<br />
Page 8<br />
V.Poor Poor Middle Better-off<br />
self-employment<br />
(e.g. firewood)<br />
prod.safety nets<br />
agr.labour<br />
livestock sales<br />
l/stock prod.<br />
sales<br />
crop sales<br />
crops<br />
Abay Tekeze Watersheds <strong>Livelihood</strong> Zone
Expenditure Patterns – a good year (2005-06)<br />
Annual expenses are divided in eight<br />
different categories. Expenditure on<br />
inputs (animal drugs, seeds, fertilizer,<br />
labor, tools) consistently increases in<br />
proportion from the very poor to the<br />
better-off.<br />
The absolute amount of cash spent on<br />
each category as well as the quantity and<br />
quality of items purchased also varies<br />
according to economic status.<br />
All wealth groups, except the better-off,<br />
purchase staple food (maize, barley,<br />
wheat), the poor purchase sorghum. The<br />
better-off also purchase sugar, oil and<br />
vegetables.<br />
100%<br />
80%<br />
60%<br />
40%<br />
20%<br />
0%<br />
V.Poor Poor Middle Better-off<br />
other<br />
gifts<br />
tax<br />
clothes<br />
social sev.<br />
inputs<br />
water<br />
HH items<br />
non-staple food<br />
staple food<br />
The graph provides a breakdown of total cash expenditure according to<br />
category of expenditure.<br />
While expenditure on staple food decreases with increasing wealth, expenditure on clothing and social services follow<br />
the reverse trend.<br />
Hazards<br />
In this <strong>Livelihood</strong> Zone, erratic rains, pest infestation, livestock disease and malaria are the recurring problems<br />
affecting agricultural productivity and human wellbeing.<br />
Erratic rains. Drought, which can include both insufficient amount of rainfall and uneven distribution over the rainy<br />
season, is the single most important cause of acute food insecurity in the livelihood zone.<br />
Livestock disease. These are mainly anthrax (cattle and goats), sheep and goat pox, lack leg, internal and external<br />
parasites (cattle and goats), pasteurellosis, African horse fever and lamp skin.<br />
Crop pests are a chronic problem in the <strong>Livelihood</strong> Zone, of which the most hazardous are stalk borer (sorghum and<br />
maize), <strong>Wollo</strong> bush crickets (teff), Aphids (all crops), cut worm, root rot, cut worm, shoot fly (teff), African boll worm<br />
and late blight. Striga (sorghum and maize)<br />
Coping Strategies<br />
Coping strategies employed by different wealth groups vary depending upon various factors including the phase and<br />
frequency of the hazard and the asset base of households. Poor households are more likely to adopt the following<br />
strategies:<br />
Labor migration. Compared to the other wealth groups, poor and very poor households have few expandable options<br />
except extending the duration of migration and involving more members of the household in it.<br />
Loans of cash and crops taken by the poor from better-off households<br />
The middle and the better-off are more likely to do adopt the following strategies<br />
Increased sale of livestock. This is an important strategy for better-off and middle households. They try to maintain<br />
the productive assets until all efforts to avoid asset depletion fail. Sale of livestock is less of an option for the poor and<br />
very poor who may only be able to sell a small number of additional shoats (poor) and poultry (poor and very poor).<br />
Switching of expenditure from non-food to staple food items. This is a common strategy for expanding purchases in<br />
a bad year, accompanied by purchasing either lower quality or small quantity. But some of this switching can have a<br />
particularly negative effect, notably in the case of reduced expenditure on schooling or basic agricultural inputs.<br />
Summary<br />
The Abay-Tekeze <strong>Livelihood</strong> Zone is food insecure area with a long history of food aid assistance. The major causes of<br />
chronic food insecurity include erratic rains (insufficient and uneven distribution), small landholdings, highly degraded<br />
farmlands, shallow & infertile soil, pest infestation and livestock disease. Poor physical infrastructure is also a serious<br />
problem in the livelihood zone. The dominant crops include wheat, barley, teff, and highland pulses (faba beans,<br />
lentils, field peas, chickpeas and vetch). There is only one rainy season - kremt and it is used for the cultivation of both<br />
long and short cycle crops. Trade interaction across the river valleys is minimal during the dry season and totally<br />
impossible during the kremt season. Wealth is determined by the size of land owned by households as well as by herd<br />
size in general and ownership of plough oxen in particular. In a typical year, while the middle and better-off households<br />
cover more than 90% of their annual food needs from their fields, the very poor can only manage to cover slightly<br />
above 60% of their requirement in this way.<br />
Page 9<br />
Abay Tekeze Watershed <strong>Livelihood</strong> Zone
<strong>Livelihood</strong> <strong>Profile</strong><br />
<strong>Amhara</strong> <strong>Region</strong>, <strong>Ethiopia</strong><br />
<strong>North</strong> <strong>Wollo</strong> Highland Belg <strong>Livelihood</strong> Zone (NHB) July 2007 1<br />
Zone Description<br />
The <strong>North</strong> <strong>Wollo</strong> Highland Belg ivelihood zone covers the<br />
belg dependent highlands of Delanta, Dawnt, Wadla and<br />
parts of Guba Lafto, Gidan and Meket. These all share a<br />
similar agro-ecological setting, cultivation practices,<br />
cropping season and crop types. The zone is an extensive<br />
high plain bisected by the River Zjita,giving the smaller<br />
Delanta Dawnt plateau to the south of the river and the<br />
greater plateau north of the river stretching from the<br />
highlands of Gubalafto in the east to the belg-dependent<br />
areas of Meket woreda in the west.<br />
Crop production is entirely rainfed, except in small number<br />
of localities where the Ministry of Agriculture has recently<br />
introduced small scale water harvesting.. There are two<br />
distinct rainy seasons- belg and kremt. The belg season is<br />
the most important one for the cultivation of both long and<br />
short cycle crops. Water logging in the kremt season and<br />
frost in October and November are the limiting factors for<br />
the cultivation of meher crops.<br />
In order of importance, the dominant crops of the <strong>Livelihood</strong> Zone are barley and wheat. Lentils and flax are also<br />
cultivated in favourable localitiesof the lower dega area, below the frost line and away from colder temperatures ofthe<br />
extreme dega areas.<br />
Livestock in this zone heep, cattle and equines. These graze freely on common land, but better off households also<br />
purchase straw and hay from the poorer wealth groups, particularly in April and May. The middle and better-off wealth<br />
groups replace oxen from their herd, whilst the poor replace animals through purchase. Sheep are slaughtered during key<br />
holidays. Oxen are used for ploughing; poorer households may also plough with horses.<br />
Main natural constraints to accessing food and generating cash income include drought, pest infestation, water logging, and<br />
frost, and livestock disease. Poor physical infrastructure and a complete obstruction of transportation during the rainy<br />
seasons also exacerbates the economic problem.<br />
The Safety Net programme exists in all the woredas in this zone, giving a combination of food (15kg wheat, 1.5kg pulse<br />
and 0.5liter oil per month per individual) and cash, distributed for six months of the year. In addition, supplementary food<br />
is distributed to malnourished children and lactating women. Credit packages are available for investment in livestock,<br />
petty trade and new agricultural technologies. Loans range from 850-2000 ETB and interest rates range from 12.5% to<br />
18% .<br />
Markets<br />
Poor market access is the major factor that limits trade interaction between the livelihood one and external markets. Poor<br />
roads – most of them with only dry-weather surfaces - and the remote location of much of the zone severely restrict the<br />
flow of goods in and out. As local inhabitants consume almost all local agricultural products, the major markets for local<br />
grain are the woreda centres within the zone. The problems of inaccessibility are most acute in the belg and kremt rains.<br />
Livestock and livestock products are the only items sold in external markets. Depending on the proximity of the different<br />
parts of the livelihood zone, these items are sold Dessie and Addis Ababa (from Delanta Dawnt,) and Gonder (from<br />
Wadla).<br />
In both good and bad years, the poor and very poor migrate in search of paid work opportunities. Local woreda centres can<br />
only provide very limited employment. Common destinations for migration are Addis Ababa, Dessie and Afdera (lake-salt<br />
1 Field work for the current profile was undertaken in July 2007. The information presented refers to June 2005-May 2006 (EC<br />
Hamle 1997 to Sene 1998), a good year by local standards. Provided there are no fundamental and rapid shifts in the economy, the<br />
information in this profile is expected to remain valid for approximately five years (i.e. until 2012). The exchange rate in the<br />
reference year was: US1=8.67 <strong>Ethiopia</strong>n birr.<br />
Page 10<br />
<strong>North</strong> <strong>Wollo</strong> Highland Belg <strong>Livelihood</strong> Zone
industry in Afar <strong>Region</strong>). The usual period of migration is between January and May. However, while the destination<br />
remains the same, the duration of migration is extended in a bad year.<br />
Local grain is almost totally unavailable on the market during the hunger season (April and May), and so a large quantity<br />
of grain (sorghum and maize) comes in from Gojam and Gonder.<br />
Seasonal Calendar<br />
Agriculture is entirely dependent on belg rains that last from March to May. The main crops (barley and wheat) are<br />
harvested in June and July. Land preparation is done from the end of the kremt season (September) far ahead of the<br />
planting in February. The consumption year starts in July after the harvest of the main crops.<br />
Except in September when both cattle and sheep are sold, sheep are sold around the festivals of Christmas and Easter when<br />
the maximum prices are anticipated, cattle are sold in June, October and November when there is no need for cattle for<br />
agricultural activities. Local paid work is available only during the harvesting months of June (barley and wheat) and<br />
November (flax).<br />
Migration for work by the very poor and poor is usually from February to June. Although the period of food purchase<br />
extends from February to May, the maximum dependency on the market coincides with the hunger season (April and<br />
May).<br />
Page 11<br />
<strong>North</strong> <strong>Wollo</strong> Highland Belg <strong>Livelihood</strong> Zone
Wealth Breakdown<br />
Wealth in this livelihood zone is determined by the ownership of livestock in general and the ownership of plough oxen in<br />
particular. There is no big difference in the ownership of land between different wealth groups. Land holding ranges from 3<br />
timad (very poor) to 4 timad (middle and better-off). The difference in crop production between the different wealth groups<br />
is the result of renting-out and renting-in of land by very poor and better of households respectively. The most common<br />
contractual agreement between the very poor and better-off households is share cropping (yekul -‘equal’) in which all<br />
agricultural inputs (labor, oxen, and seed) are provided by the better-off households and half of the harvest is kept by each<br />
contracting party.<br />
The ownership of a pair of oxen allows better-off households to plough land on time The ownership of a substantial<br />
number of sheep and cattle allows them both generate more cash income through the sale of livestock and livestock<br />
products, and to enhance their diet with dairy and meat.<br />
Middle households who own a single plough ox pair up (mekenajo) with another such household and retain all the<br />
production from their own land since they don’t have to share land to pay for ploughing.<br />
Sources of Food – A good year (2005-06)<br />
The main source of food for all wealth groups<br />
is own crop production. The contribution of<br />
own production increases by wealth group<br />
while contribution of purchased food<br />
decreases by wealth. Purchase and food aid are<br />
very important for the very poor and poor<br />
households, the combination outweighing the<br />
contribution of own crops. Middle and betteroff<br />
households obtain the highest proportion of<br />
the annual food requirement through the<br />
combination of own crop production and the<br />
share obtained from contractual agreement<br />
with very poor households.<br />
Dairy and meat are near-exclusively for the<br />
better-off and middle households.<br />
Page 12<br />
In the graph, food access is expressed as a percentage of food requirements, taken as an<br />
average food energy intake of 2100 kcals per person per day.<br />
<strong>North</strong> <strong>Wollo</strong> Highland Belg <strong>Livelihood</strong> Zone
Sources of Cash – a good year (2005-06)<br />
The graph provides a breakdown of total cash income according to income source.<br />
Annual<br />
income<br />
(ETB)<br />
1100-<br />
1500<br />
1500-1700 1750-2250 3200-3700<br />
Sources of cash income<br />
particularly reflect the asset base<br />
of different wealth groups. Sale of<br />
livestock and livestock products<br />
constitutes the highest proportion<br />
of the cash income of poor,<br />
middle and better-off households,<br />
but only about one-fifth for the<br />
very poor. Income from sale of<br />
crops and livestock and livestock<br />
products increases with wealth.<br />
‘Self employment’ means petty<br />
trade for the better-off households.<br />
Income from the Safety Net and sale of labor (agricultural, urban and construction) is the exclusively for the poor and very<br />
poor households..<br />
High dependence upon sale of livestock and livestock products by the better-off and middle households in a typical year<br />
implies special vulnerability to shocks that might affect livestock.<br />
Expenditure Patterns – a good year (2005-06)<br />
Annual expenses are divided in<br />
seven different categories: staple<br />
food, non-staple food, household<br />
items (pepper/salt, coffee, soap,<br />
kerosene, utensils and milling),<br />
inputs (seeds, animal drug cost<br />
and fertilizers), social services<br />
(schooling and medicine),<br />
clothing, tax and ‘other’<br />
(transportation, festival expenses,<br />
social contributions.)<br />
Expenditure on inputs increases<br />
with wealth – with the better-off<br />
hiring labor and restocking<br />
livestock.<br />
The graph provides a breakdown of total cash expenditure according to category of<br />
expenditure.<br />
All groups except the better-off purchase staple food (maize), all groups purchase pulses, whilst the better-off purchase<br />
some sugar. While expenditure on staple food decreases with increasing wealth, absolute expenditure on clothing and<br />
social services increases with wealth.<br />
Hazards<br />
Chronic hazards of the livelihood zone include drought, pest infestation, livestock disease and frost. With the exception of<br />
drought that occurs at an interval of approximately three years all other hazards occur annually in some degree..<br />
Coping Strategies<br />
Different wealth groups employ different coping strategies in a bad year. The initial strategy of poor households is the<br />
involvement of additional migrant laborers from the household and the extension of the duration of labor migration. Sale of<br />
more eucalyptus trees, purchase of cheaper (low quality items) and minimizing the quantity of some items are other options<br />
employed by poorer households.<br />
Increasing the sale of livestock, involvement in petty trading activities, avoiding expenditure on some household items ,<br />
Page 13<br />
<strong>North</strong> <strong>Wollo</strong> Highland Belg <strong>Livelihood</strong> Zone
purchase of cheaper items and purchase of smaller amount of items are the coping strategies employed by wealthier<br />
households.<br />
Summary<br />
The <strong>North</strong> <strong>Wollo</strong> Highland Belg <strong>Livelihood</strong> Zone is food insecure, with a long history of food aid distributions. The<br />
dominant crop in the <strong>Livelihood</strong> Zone is barley. Small quantities of pulses such as lentils and field peas are cultivated on<br />
the gentler slopes below the frost line. Own crop production covers the highest proportion of the annual food requirement<br />
particularly for the wealthier households. Livestock income is more important sources of income than crops for all wealth<br />
groups.<br />
The margin between income and expenditure particularly for poor and very poor households is very narrow and hardly<br />
begins to cover the food, income and expenditure gaps in a bad year. Thus these wealth groups are forced to resort either to<br />
unsustainable asset disposal or employment of other damaging coping strategies in a bad year. In the absence employment<br />
opportunities in near by rural and urban areas they are forced to look for other opportunities in far away areas that involve<br />
family separation for a long period of time.<br />
Asset loss due to drought and livestock disease can also affect the existing contractual ploughing/land use agreements<br />
between the very poor and better-off/middle households. Loss of productive assets by better-off and middle households not<br />
only reduce their food and cash income but also reduce their capacity to loan oxen, rent-in land or pay for labour.<br />
Page 14<br />
<strong>North</strong> <strong>Wollo</strong> Highland Belg <strong>Livelihood</strong> Zone


