ILEA Equity Plan | Elgin Community College (ECC)
There are wide and persistent gaps in college completion rates in Illinois, especially among students of color and low-income students. After an in-depth analysis of our institutional data, Elgin Community College (“ECC” or “the College” or “we” or “our”) has developed an Equity Plan containing annual growth targets for which progress updates will be shared publicly over the next five years. Our Equity Plan reflects the unique characteristics of our institution. For example, ECC is designated as a Hispanic Serving Institution by the US Department of Education, with just over 42% of the students identifying as Latinx or Hispanic. Also, the district served by ECC is widely diverse in terms of income and educational attainment. We will identify the obstacles students face and develop programs and policies that break down unnecessary college graduation barriers. Along with our fellow colleges, in the Partnership for College Completion organization, with this Illinois Equity in Attainment (“ILEA”) plan, we pledge to close the completion gaps by 2025.
There are wide and persistent gaps in college completion rates in Illinois, especially among students of color and low-income students. After an in-depth analysis of our institutional data, Elgin Community College (“ECC” or “the College” or “we” or “our”) has developed an Equity Plan containing annual growth targets for which progress updates will be shared publicly over the next five years. Our Equity Plan reflects the unique characteristics of our institution. For example, ECC is designated as a Hispanic Serving Institution by the US Department of Education, with just over 42% of the students identifying as Latinx or Hispanic. Also, the district served by ECC is widely diverse in terms of income and educational attainment. We will identify the obstacles students face and develop programs and policies that break down unnecessary college graduation barriers. Along with our fellow colleges, in the Partnership for College Completion organization, with this Illinois Equity in Attainment (“ILEA”) plan, we pledge to close the completion gaps by 2025.

Create successful ePaper yourself
Turn your PDF publications into a flip-book with our unique Google optimized e-Paper software.
Reporting<br />
Year<br />
Cohort<br />
African-<br />
American<br />
Students<br />
Latinx<br />
Students<br />
English<br />
White<br />
Students<br />
Pell<br />
Students<br />
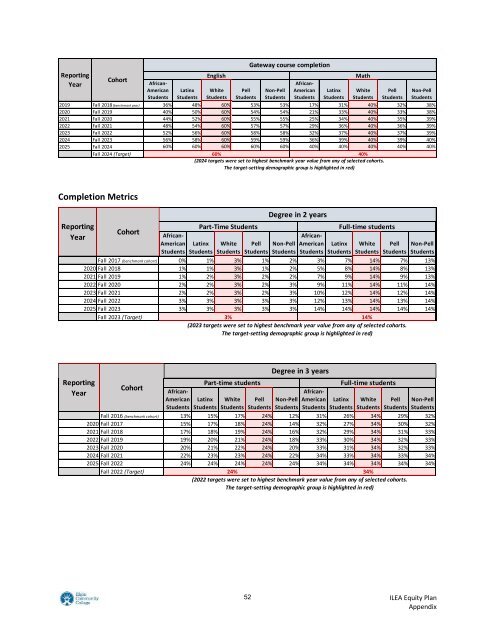
Gateway course completion<br />
Non-Pell<br />
Students<br />
African-<br />
American<br />
Students<br />
Latinx<br />
Students<br />
White<br />
Students<br />
Pell<br />
Students<br />
Non-Pell<br />
Students<br />
2019 Fall 2018 (benchmark year) 36% 48% 60% 53% 53% 17% 31% 40% 32% 38%<br />
2020 Fall 2019 40% 50% 60% 54% 54% 21% 33% 40% 33% 38%<br />
2021 Fall 2020 44% 52% 60% 55% 55% 25% 34% 40% 35% 39%<br />
2022 Fall 2021 48% 54% 60% 57% 57% 29% 36% 40% 36% 39%<br />
2023 Fall 2022 52% 56% 60% 58% 58% 32% 37% 40% 37% 39%<br />
2024 Fall 2023 56% 58% 60% 59% 59% 36% 39% 40% 39% 40%<br />
2025 Fall 2024 60% 60% 60% 60% 60% 40% 40% 40% 40% 40%<br />
Fall 2024 (Target)<br />
60% 40%<br />
(2024 targets were set to highest benchmark year value from any of selected cohorts.<br />
The target-setting demographic group is highlighted in red)<br />
Math<br />
Completion Metrics<br />
Reporting<br />
Year<br />
Cohort<br />
African-<br />
American<br />
Students<br />
Part-Time Students<br />
Latinx<br />
Students<br />
White<br />
Students<br />
Pell<br />
Students<br />
Degree in 2 years<br />
Non-Pell<br />
Students<br />
African-<br />
American<br />
Students<br />
Full-time students<br />
Latinx<br />
Students<br />
White<br />
Students<br />
Pell<br />
Students<br />
Non-Pell<br />
Students<br />
Fall 2017 (benchmark cohort) 0% 1% 3% 1% 2% 3% 7% 14% 7% 13%<br />
2020 Fall 2018 1% 1% 3% 1% 2% 5% 8% 14% 8% 13%<br />
2021 Fall 2019 1% 2% 3% 2% 2% 7% 9% 14% 9% 13%<br />
2022 Fall 2020 2% 2% 3% 2% 3% 9% 11% 14% 11% 14%<br />
2023 Fall 2021 2% 2% 3% 2% 3% 10% 12% 14% 12% 14%<br />
2024 Fall 2022 3% 3% 3% 3% 3% 12% 13% 14% 13% 14%<br />
2025 Fall 2023 3% 3% 3% 3% 3% 14% 14% 14% 14% 14%<br />
Fall 2023 (Target)<br />
3% 14%<br />
(2023 targets were set to highest benchmark year value from any of selected cohorts.<br />
The target-setting demographic group is highlighted in red)<br />
Reporting<br />
Year<br />
Cohort<br />
African-<br />
American<br />
Students<br />
Part-time students<br />
Latinx<br />
Students<br />
White<br />
Students<br />
Pell<br />
Students<br />
Degree in 3 years<br />
Non-Pell<br />
Students<br />
African-<br />
American<br />
Students<br />
Full-time students<br />
Latinx<br />
Students<br />
White<br />
Students<br />
Pell<br />
Students<br />
Non-Pell<br />
Students<br />
Fall 2016 (benchmark cohort) 13% 15% 17% 24% 12% 31% 26% 34% 29% 32%<br />
2020 Fall 2017 15% 17% 18% 24% 14% 32% 27% 34% 30% 32%<br />
2021 Fall 2018 17% 18% 19% 24% 16% 32% 29% 34% 31% 33%<br />
2022 Fall 2019 19% 20% 21% 24% 18% 33% 30% 34% 32% 33%<br />
2023 Fall 2020 20% 21% 22% 24% 20% 33% 31% 34% 32% 33%<br />
2024 Fall 2021 22% 23% 23% 24% 22% 34% 33% 34% 33% 34%<br />
2025 Fall 2022 24% 24% 24% 24% 24% 34% 34% 34% 34% 34%<br />
Fall 2022 (Target)<br />
24% 34%<br />
(2022 targets were set to highest benchmark year value from any of selected cohorts.<br />
The target-setting demographic group is highlighted in red)<br />
52<br />
<strong>ILEA</strong> <strong>Equity</strong> <strong>Plan</strong><br />
Appendix