ILEA Equity Plan | Elgin Community College (ECC)
There are wide and persistent gaps in college completion rates in Illinois, especially among students of color and low-income students. After an in-depth analysis of our institutional data, Elgin Community College (“ECC” or “the College” or “we” or “our”) has developed an Equity Plan containing annual growth targets for which progress updates will be shared publicly over the next five years. Our Equity Plan reflects the unique characteristics of our institution. For example, ECC is designated as a Hispanic Serving Institution by the US Department of Education, with just over 42% of the students identifying as Latinx or Hispanic. Also, the district served by ECC is widely diverse in terms of income and educational attainment. We will identify the obstacles students face and develop programs and policies that break down unnecessary college graduation barriers. Along with our fellow colleges, in the Partnership for College Completion organization, with this Illinois Equity in Attainment (“ILEA”) plan, we pledge to close the completion gaps by 2025.
There are wide and persistent gaps in college completion rates in Illinois, especially among students of color and low-income students. After an in-depth analysis of our institutional data, Elgin Community College (“ECC” or “the College” or “we” or “our”) has developed an Equity Plan containing annual growth targets for which progress updates will be shared publicly over the next five years. Our Equity Plan reflects the unique characteristics of our institution. For example, ECC is designated as a Hispanic Serving Institution by the US Department of Education, with just over 42% of the students identifying as Latinx or Hispanic. Also, the district served by ECC is widely diverse in terms of income and educational attainment. We will identify the obstacles students face and develop programs and policies that break down unnecessary college graduation barriers. Along with our fellow colleges, in the Partnership for College Completion organization, with this Illinois Equity in Attainment (“ILEA”) plan, we pledge to close the completion gaps by 2025.

You also want an ePaper? Increase the reach of your titles
YUMPU automatically turns print PDFs into web optimized ePapers that Google loves.
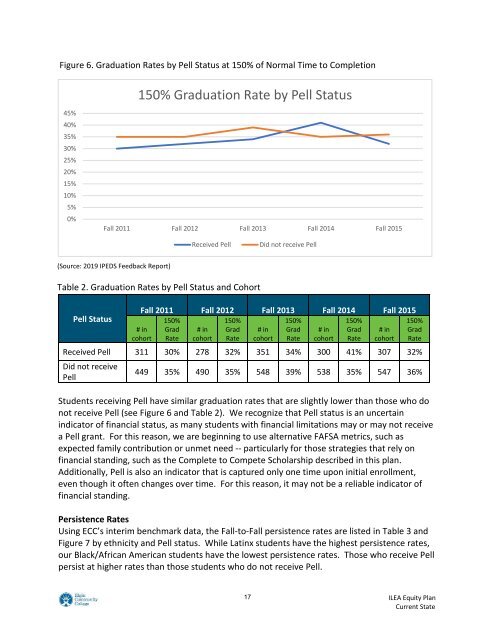
Figure 6. Graduation Rates by Pell Status at 150% of Normal Time to Completion<br />
45%<br />
40%<br />
35%<br />
30%<br />
25%<br />
20%<br />
15%<br />
10%<br />
5%<br />
0%<br />
150% Graduation Rate by Pell Status<br />
Fall 2011 Fall 2012 Fall 2013 Fall 2014 Fall 2015<br />
Received Pell<br />
Did not receive Pell<br />
(Source: 2019 IPEDS Feedback Report)<br />
Table 2. Graduation Rates by Pell Status and Cohort<br />
Pell Status<br />
Fall 2011 Fall 2012 Fall 2013 Fall 2014 Fall 2015<br />
# in<br />
cohort<br />
150%<br />
Grad<br />
Rate<br />
# in<br />
cohort<br />
150%<br />
Grad<br />
Rate<br />
# in<br />
cohort<br />
150%<br />
Grad<br />
Rate<br />
# in<br />
cohort<br />
150%<br />
Grad<br />
Rate<br />
# in<br />
cohort<br />
Received Pell 311 30% 278 32% 351 34% 300 41% 307 32%<br />
Did not receive<br />
Pell<br />
449 35% 490 35% 548 39% 538 35% 547 36%<br />
Students receiving Pell have similar graduation rates that are slightly lower than those who do<br />
not receive Pell (see Figure 6 and Table 2). We recognize that Pell status is an uncertain<br />
indicator of financial status, as many students with financial limitations may or may not receive<br />
a Pell grant. For this reason, we are beginning to use alternative FAFSA metrics, such as<br />
expected family contribution or unmet need -- particularly for those strategies that rely on<br />
financial standing, such as the Complete to Compete Scholarship described in this plan.<br />
Additionally, Pell is also an indicator that is captured only one time upon initial enrollment,<br />
even though it often changes over time. For this reason, it may not be a reliable indicator of<br />
financial standing.<br />
Persistence Rates<br />
Using <strong>ECC</strong>’s interim benchmark data, the Fall-to-Fall persistence rates are listed in Table 3 and<br />
Figure 7 by ethnicity and Pell status. While Latinx students have the highest persistence rates,<br />
our Black/African American students have the lowest persistence rates. Those who receive Pell<br />
persist at higher rates than those students who do not receive Pell.<br />
150%<br />
Grad<br />
Rate<br />
17<br />
<strong>ILEA</strong> <strong>Equity</strong> <strong>Plan</strong><br />
Current State