ILEA Equity Plan | Elgin Community College (ECC)
There are wide and persistent gaps in college completion rates in Illinois, especially among students of color and low-income students. After an in-depth analysis of our institutional data, Elgin Community College (“ECC” or “the College” or “we” or “our”) has developed an Equity Plan containing annual growth targets for which progress updates will be shared publicly over the next five years. Our Equity Plan reflects the unique characteristics of our institution. For example, ECC is designated as a Hispanic Serving Institution by the US Department of Education, with just over 42% of the students identifying as Latinx or Hispanic. Also, the district served by ECC is widely diverse in terms of income and educational attainment. We will identify the obstacles students face and develop programs and policies that break down unnecessary college graduation barriers. Along with our fellow colleges, in the Partnership for College Completion organization, with this Illinois Equity in Attainment (“ILEA”) plan, we pledge to close the completion gaps by 2025.
There are wide and persistent gaps in college completion rates in Illinois, especially among students of color and low-income students. After an in-depth analysis of our institutional data, Elgin Community College (“ECC” or “the College” or “we” or “our”) has developed an Equity Plan containing annual growth targets for which progress updates will be shared publicly over the next five years. Our Equity Plan reflects the unique characteristics of our institution. For example, ECC is designated as a Hispanic Serving Institution by the US Department of Education, with just over 42% of the students identifying as Latinx or Hispanic. Also, the district served by ECC is widely diverse in terms of income and educational attainment. We will identify the obstacles students face and develop programs and policies that break down unnecessary college graduation barriers. Along with our fellow colleges, in the Partnership for College Completion organization, with this Illinois Equity in Attainment (“ILEA”) plan, we pledge to close the completion gaps by 2025.

You also want an ePaper? Increase the reach of your titles
YUMPU automatically turns print PDFs into web optimized ePapers that Google loves.
Illinois <strong>Equity</strong> in Attainment<br />
<strong>Elgin</strong> <strong>Community</strong> <strong>College</strong><br />
<strong>Equity</strong> <strong>Plan</strong><br />
August 2020<br />
Updated
This page intentionally left blank.
Executive Summary<br />
Introduction<br />
In the state of Illinois, there are wide and persistent gaps in college completion rates especially<br />
among students of color and low-income students. After a deep analysis of our institutional<br />
data, <strong>Elgin</strong> <strong>Community</strong> <strong>College</strong> (“<strong>ECC</strong>” or “the <strong>College</strong>” or “we” or “our”) has developed an<br />
<strong>Equity</strong> <strong>Plan</strong> containing annual growth targets for which progress updates will be shared publicly<br />
over the course of the next five years. Our <strong>Equity</strong> <strong>Plan</strong> reflects the unique characteristics of our<br />
institution. For example, <strong>ECC</strong> is designated as a Hispanic Serving Institution by the US<br />
Department of Education with just over 42% of the students identifying as Latinx or Hispanic. In<br />
addition, the district served by <strong>ECC</strong> is widely diverse in terms of income and educational<br />
attainment. We will work to identify obstacles students face and develop programs and<br />
policies that break down unnecessary barriers to college graduation. Along with our fellow<br />
colleges, in the Partnership for <strong>College</strong> Completion organization, with this Illinois <strong>Equity</strong> in<br />
Attainment (“<strong>ILEA</strong>”) plan, we pledge to close the completion gaps by 2025.<br />
To frame the work of this plan, <strong>Equity</strong>, Diversity, and Inclusion Statements were adopted.<br />
Providing common definitions sets the tone needed to advance our work across the <strong>College</strong> and<br />
to reach our ultimate goal of creating an inclusive multicultural learning environment in which<br />
everyone has access and a sense of belonging. These statements are at the core of the<br />
decisions we make.<br />
Current State<br />
Annually, <strong>ECC</strong> compiles data and reflects upon their impact in terms of program excellence and<br />
service delivery. Participating in <strong>ILEA</strong> has given us a new lens with which to review our data and<br />
gain a deeper understanding of our student population and completion gaps. The graduation<br />
rate (at 150% of normal time to completion) between White and Latinx students is closer<br />
together and higher than the rate for Black/African American students which lags behind.<br />
Students receiving Pell have graduation rates (at 150%) that are only slightly lower than those<br />
who do not receive Pell. As for persistence rates, Latinx students have the highest persistence<br />
and Black/African Americans have the lowest persistence rates. Those who receive Pell persist<br />
at higher rates than those students who do not. The target population varies by metric as to<br />
which is the highest and lowest performing. However, we have the greatest and most<br />
consistent opportunity for improvement when it comes to our Black/African American students<br />
and closing the gaps.<br />
Future Vision<br />
Our <strong>Equity</strong> <strong>Plan</strong> is integrated into our overarching Strategic <strong>Plan</strong> for 2018 to 2022, for which<br />
there are four main themes: <strong>Equity</strong> and Learning; Holistic Programming; <strong>Community</strong><br />
Partnerships; and Service Excellence and Collaboration. There are 14 specific strategies in<br />
service of the main themes. Each year <strong>ECC</strong> prepares an Operating <strong>Plan</strong> of actions to be done<br />
i<br />
<strong>ILEA</strong> <strong>Equity</strong> <strong>Plan</strong><br />
Executive Summary
within departments and committees that align to these 14 strategies. Each of the <strong>ILEA</strong> <strong>Equity</strong><br />
<strong>Plan</strong> strategies align with our Strategic <strong>Plan</strong> goals and either are, or will be, incorporated into<br />
Operating <strong>Plan</strong>s moving forward. Therefore, our daily work is, and will continue to be, guided<br />
by these highly visible goals to which the <strong>College</strong> is fully committed and will be the reason we<br />
are able to close the completion gaps among our students.<br />
Targets and interim benchmark goals for the leading indicators and completion metrics have<br />
been set based on the current student demographic group with the highest benchmark. In<br />
order to close any gaps, all targeted populations should reach the same benchmark, showing<br />
incremental improvement over time as strategies are implemented. It was challenging to arrive<br />
at what target to use as we anticipate that many of the strategies will result in improvements<br />
among all students, not just those that are in target populations. So, there is some concern<br />
that while we will improve these metrics, a gap may still persist because there will be<br />
improvements across the board.<br />
Institutional Strategies<br />
<strong>Elgin</strong> <strong>Community</strong> <strong>College</strong> will execute seven strategies specifically to improve persistence and<br />
to close the gap on completion rates. Many of the strategies will close completion gaps in more<br />
than one, sometimes in all, of the student target groups. One strategy in particular, Strategy 6:<br />
Holistic Case Management Model, is a broad reaching, multi-pronged approach to better serve<br />
all our students. It will allow us to more easily tailor our communications and interactions with<br />
our students so they will receive the level of support they as individuals need to become<br />
successful students. This is not a cookie-cutter approach for every student rather it is a very<br />
specialized approach for every unique student based on their own characteristics.<br />
Evaluation <strong>Plan</strong><br />
We follow the PDSA model (<strong>Plan</strong>, Do, Study, Act) when implementing new plans. We value this<br />
continuous quality improvement technique because it is an ongoing process for achieving<br />
measurable improvement and its focus is on the process. Two times a year, our operating plan<br />
strategy leaders complete progress updates using a standardized form based on PDSA model<br />
and we will use the same form for our <strong>ILEA</strong> strategies. The evaluations will be funneled up<br />
through the <strong>ILEA</strong> <strong>Plan</strong> team to Cabinet and part of any public reporting the <strong>College</strong> does.<br />
ii<br />
<strong>ILEA</strong> <strong>Equity</strong> <strong>Plan</strong><br />
Executive Summary
Table of Contents<br />
Executive Summary ---------------------------------------------------------------------------------------------------i<br />
Signature Page --------------------------------------------------------------------------------------------------------iv<br />
Introduction ------------------------------------------------------------------------------------------------------------9<br />
Current State ---------------------------------------------------------------------------------------------------------15<br />
Future Vision ---------------------------------------------------------------------------------------------------------25<br />
Institutional Strategies ---------------------------------------------------------------------------------------------29<br />
Evaluation <strong>Plan</strong> ------------------------------------------------------------------------------------------------------45<br />
Budget -----------------------------------------------------------------------------------------------------------------46<br />
Timeline ---------------------------------------------------------------------------------------------------------------47<br />
<strong>ILEA</strong> Team -------------------------------------------------------------------------------------------------------------48<br />
Glossary ---------------------------------------------------------------------------------------------------------------49<br />
Appendix --------------------------------------------------------------------------------------------------------------51<br />
Works Cited ----------------------------------------------------------------------------------------------------------54<br />
iii<br />
<strong>ILEA</strong> <strong>Equity</strong> <strong>Plan</strong><br />
Table of Contents
This page intentionally left blank.
iv
v
1A: <strong>ILEA</strong> Overview<br />
1: Introduction<br />
Despite improvements in high school graduation and college matriculation rates for Illinois<br />
students, there are wide and persistent gaps in college completion rates especially for lowincome,<br />
first-generation students, and students of color. The launch of the Illinois <strong>Equity</strong> in<br />
Attainment (<strong>ILEA</strong>) marks a major step forward for 25 two-year and four-year public and private<br />
non-profit colleges and universities from northeastern Illinois and across the state who are<br />
committing to eliminate racial and socio-economic achievement gaps by 2025, while<br />
aggressively increasing completion rates on their campuses.<br />
<strong>ILEA</strong> is the signature initiative of the Partnership for <strong>College</strong> Completion (PCC), a non-profit<br />
organization founded in 2016 to catalyze and champion policies, systems, and practices that<br />
ensure all students can graduate from college and achieve their career aspirations. With an<br />
initial focus on northeastern Illinois, PCC has set a goal to eliminate institutional achievement<br />
gaps in college degree completion for low-income, Latino and African-American students in<br />
Illinois by 2025, establishing the region as a national leader in equity in attainment.<br />
Beginning with this initial cohort, PCC will offer direct support and resources to the 25 colleges<br />
and universities who have volunteered to be members of <strong>ILEA</strong>. PCC will work alongside these<br />
partner colleges to jointly set commitments, identify appropriate evidence-based strategies to<br />
utilize on their campuses, and scale effective practices. PCC will support policy and practice<br />
change efforts that have the explicit goal of eliminating racial and socioeconomic degree<br />
completion gaps, while increasing institutional college completion rates overall.<br />
By participating in <strong>ILEA</strong>, partners commit to a core set of principles:<br />
• <strong>College</strong>s are responsible for graduating all of their degree-seeking students as quickly<br />
and efficiently as possible.<br />
• All students can graduate with college degrees if they have the right information, tools,<br />
and supports.<br />
• Achievement gaps between low-income, Black and Latino students and their higherincome<br />
and White peers are unacceptable and should be eliminated.<br />
• These efforts will be undertaken without sacrificing institutional quality or excellence or<br />
increasing admission standards.<br />
The <strong>ILEA</strong> colleges will conduct a deep analysis of their institutional data, develop equity plans<br />
that contain annual growth targets, and report progress toward their goals, which will be<br />
shared publicly. The colleges will also work to identify obstacles students face and develop<br />
programs and policies that break down unnecessary barriers to college graduation.<br />
The launch of <strong>ILEA</strong> follows a galvanizing 2017 PCC report, “Unequal Opportunity in Illinois: A<br />
Look at Who Graduates <strong>College</strong> and Why It Matters,” which found that only 33.7 percent of<br />
9<br />
<strong>ILEA</strong> <strong>Equity</strong> <strong>Plan</strong><br />
Introduction
African American students who start at four-year institutions earn bachelor’s degrees within six<br />
years – a rate 32.7 percentage points below that of their White peers. For Latinos, 49.3 percent<br />
are earning degrees, a gap of 17.1 percentage points. The completion gap between low-income<br />
and wealthier students is also alarming: according to Advance Illinois, only 37 percent of lowincome<br />
students graduate in six years while 75 percent of wealthier students do.<br />
Increased and more equitable graduation outcomes across the diversity of our state’s higher<br />
education institutions benefits students, their families and the state of Illinois. A 3% increase in<br />
graduation rates is projected to produce $1.7B increase in net earnings, $132M increase in tax<br />
revenue, and $35M in public system savings. The progress of the <strong>ILEA</strong> member colleges and<br />
universities will provide a set of learnings that the Partnership will document and share with<br />
practitioners and policymakers across Illinois, the region and the nation, establishing a path<br />
forward that will promote equity in college achievement.<br />
For more information on <strong>ILEA</strong>, please visit: http://partnershipfcc.org/ilea.<br />
1B: Institution Overview<br />
<strong>Elgin</strong> <strong>Community</strong> <strong>College</strong> is excited to be a part of the Illinois <strong>Equity</strong> in Attainment (<strong>ILEA</strong>) cohort.<br />
Regarding our participation, <strong>ECC</strong> President Dr. Sam states: “We look forward to using the<br />
frameworks and tools developed through this partnership to enhance our ability to fulfill the<br />
<strong>Elgin</strong> <strong>Community</strong> <strong>College</strong> mission: ‘to improve people’s lives through learning’. Through the<br />
expertise and support of <strong>ILEA</strong> members, we intend to strengthen our skills in defining,<br />
deploying, and assessing equity-based quality practices that remove barriers and ensure the<br />
delivery of resources needed by all students to achieve their goals.”<br />
Mission<br />
<strong>ECC</strong>’s mission is to improve people’s lives through learning. The mission is the core driver<br />
behind every goal and objective in <strong>Elgin</strong> <strong>Community</strong> <strong>College</strong>’s 5-year Strategic <strong>Plan</strong> for 2018 to<br />
2022. Our promise to the residents of Illinois <strong>Community</strong> <strong>College</strong> District 509 is to create and<br />
provide high-quality learning environments that meet their needs while enriching their lives<br />
and communities. Our mission was crafted along with our vision, wherein we challenge<br />
ourselves to achieve excellence in how we improve lives. Our Mission is to be a national leader<br />
in promoting success for all students. Specifically, we strive to make recognized institution and<br />
to benchmark our performance against peers nationally. The Vision is attained through a<br />
commitment to provide innovative and affordable learning opportunities for all constituencies<br />
and to promote cultural competence and community partnership in our decisions and actions.<br />
Taken together, the mission and vision guide everything we do. Our mission calls us to improve<br />
the lives of others, and our vision promises excellence in how we do this.<br />
Background<br />
<strong>Elgin</strong> <strong>Community</strong> <strong>College</strong> was founded in 1949 as an extension of <strong>Elgin</strong> Area School District U46<br />
and later incorporated in 1966 under the Illinois <strong>Community</strong> <strong>College</strong> Board. Presently, District<br />
10<br />
<strong>ILEA</strong> <strong>Equity</strong> <strong>Plan</strong><br />
Introduction
509, which is served by <strong>ECC</strong>, covers a 360 square mile area in the northwestern Chicagoland<br />
region that encompasses parts of five counties, and serves 25 incorporated municipalities and<br />
substantial unincorporated areas, the largest being the city of <strong>Elgin</strong> with a population of<br />
113,000. The District’s service population is estimated at 457,915, and the city of <strong>Elgin</strong><br />
accounts for a quarter of this total. Median household incomes of District varies widely by city,<br />
block, and zip codes with a range of about $75,000 in St. Charles and Bartlett to $54,000 in <strong>Elgin</strong><br />
and Carpentersville. About 7.8% (35,517 of 457,915) of the population in our district lives<br />
below the poverty line.<br />
The 217 acre main campus is in southwest <strong>Elgin</strong>, and the college operates two satellite<br />
locations: the Center for Emergency Services in Burlington to the west of the District and the<br />
Education and Work Center located in Hanover Park to the east. Currently, the college offers<br />
138 degree and certificate programs in university transfer and career education across a variety<br />
of disciplines. The college offers a large adult education program providing pre-collegiate<br />
education for adults as well as high school equivalency (GED/HiSET) and English as a Second<br />
Language courses. As of last academic year, <strong>ECC</strong> has an annual unduplicated enrollment of over<br />
14,547 (FTE=6,470). The Fall 2019 headcount was 9,931 (FTE = 5,451).<br />
Among students enrolled in credit programs and adult education, approximately 54% are<br />
women, and the average age is 26. Just over 42% of students identify as Latino or Hispanic, and<br />
the <strong>College</strong> is a recognized Hispanic Serving Institution by the US Department of Education. The<br />
remainder of students are 40% White, 8% Asian, and 5% African American. The vast majority of<br />
students attend in person, with about 21% wholly or primarily enrolled in online courses. The<br />
<strong>College</strong> offers a number of non-credit and continuing education courses and programs as well<br />
as corporate training for business clients. The college offers an array of student athletics<br />
programs and is a member of the Illinois Skyway Collegiate Conference. <strong>ECC</strong> is also a<br />
recognized Military Friendly School and enrolls a sizable number of veterans. Finally, it hosts a<br />
vibrant performing arts series each year as well as a number of local musical ensembles.<br />
Figure 1: <strong>ECC</strong> Student by Race/Ethnicity<br />
Figure 2: <strong>ECC</strong> Teaching Faculty by Employment<br />
The <strong>College</strong> employs 122 full-time faculty, 402 part-time faculty, 48 administrators, 236 staff<br />
and has been led since 2007 by Dr. David Sam, the college’s eighth president.<br />
11<br />
<strong>ILEA</strong> <strong>Equity</strong> <strong>Plan</strong><br />
Introduction
History of <strong>Equity</strong> Work<br />
We joined Achieving the Dream (“ATD”) in 2009, the Higher Learning<br />
Commission (“HLC”) Student Success Academy in 2018, and <strong>ILEA</strong> in<br />
2019. These three efforts work through the lens of equity to bring<br />
about student success at <strong>ECC</strong>. ATD is a national network; the HLC<br />
Student Success Academy operates regionally; and <strong>ILEA</strong> is a statewide<br />
organization. Student success is front and center in our Mission and<br />
all of our operational plan goals are in service of student success, and<br />
together these three affiliations provide context that guides our<br />
efforts. Prior to any decision we make, we always ask ourselves, “how<br />
will this impact students?”<br />
<strong>ECC</strong><br />
ATD<br />
Student<br />
Success<br />
<strong>ILEA</strong><br />
HLC<br />
Student<br />
Success<br />
Academy<br />
Figure 3.<br />
<strong>ECC</strong> <strong>Equity</strong> Framework<br />
Given its history and institutional context, <strong>ECC</strong> is well-positioned to dramatically impact student<br />
success and achieve equity in attainment. The <strong>College</strong>’s Mission, the demographic shifts within<br />
the student and community populations, the current reality of student outcomes, and an<br />
opportunity to design a systemic student success framework call us to urgently address issues<br />
of equity in our institution. While the <strong>College</strong> has significant achievement gaps to close, a solid<br />
foundation has been laid to execute this plan.<br />
1C: <strong>Equity</strong>, Diversity, and Inclusion Statements<br />
During the Fall 2019 semester, faculty, administrators, and staff developed the following<br />
statements with direct and indirect input from students and community members. These<br />
statements are used to frame the work of this plan, providing common definitions and tone<br />
needed to advance our work from 2019 until the end of 2025.<br />
<strong>Equity</strong> Statement<br />
As a Leader <strong>College</strong>, <strong>Elgin</strong> <strong>Community</strong> <strong>College</strong> believes intentional and meaningful inclusion of<br />
diverse experiences, backgrounds, and social identities in all aspects of the institution is a moral<br />
imperative which deepens and enriches the educational and workplace experience for<br />
everyone. At the core of <strong>ECC</strong>’s mission to improve people’s lives through learning is the<br />
recognition that as a community college we are successful only when we are providing access<br />
to quality education—as well as appropriate and equitable support in an inclusive<br />
environment—to all members of our community. We are aware of the persistent pernicious<br />
effects of structural racism, systemic poverty, and other societal barriers on members of our<br />
community. As such, the <strong>College</strong> is committed to the on-going intentional review and design of<br />
resources, policies, and procedures to ensure that effective supports exist throughout the<br />
student and employee experience. Moreover, the <strong>College</strong> is dedicated to dismantling the<br />
structures and systems, and challenging the attitudes that create or sustain inequities in the<br />
first place.<br />
Diversity Statement<br />
<strong>Elgin</strong> <strong>Community</strong> <strong>College</strong> recognizes that diversity is an invaluable resource to teaching,<br />
learning, and personal growth. Understanding that the pursuit of excellence requires a diverse<br />
12<br />
<strong>ILEA</strong> <strong>Equity</strong> <strong>Plan</strong><br />
Introduction
and representative community, the <strong>College</strong> strives to cultivate an environment that represents<br />
our extensive network, while ensuring that it reflects race, age, ethnicity, gender identity,<br />
sexual orientation, religion, disability status, political affiliation, veteran status, socioeconomic<br />
background, and the myriad other expressions of humanity. It is imperative that all<br />
communities are full participants in the construction of knowledge and diversity of thought.<br />
Inclusion Statement<br />
<strong>Elgin</strong> <strong>Community</strong> <strong>College</strong> recognizes and values its communities’ social, cultural, and<br />
geographical differences. The <strong>College</strong> is committed to ensuring these differences are<br />
represented and acknowledged throughout the campus at every level. It is not only a moral<br />
imperative but also serves to enrich and strengthen the experiences of students and employees<br />
in our institution. We commit to making prominent our value of inclusivity in all institutional<br />
decisions that we make.<br />
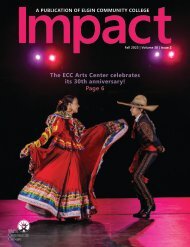
The <strong>College</strong> has been inspired by and uses the<br />
image in Figure 4 to help convey our mindset on<br />
equality, equity, diversity and inclusion. We refer<br />
to it as The MAGIC Mindset. <strong>ECC</strong>’s Multicultural<br />
and Global Initiatives Committee’s (“MAGIC”)<br />
mission is to prepare individuals to succeed in a<br />
diverse society by providing and supporting<br />
multicultural learning experiences at <strong>Elgin</strong><br />
<strong>Community</strong> <strong>College</strong> and within District 509 with the<br />
ultimate goal of creating an inclusive environment<br />
at the <strong>College</strong>. Posters of The MAGIC Mindset are<br />
found throughout the campus to serve as a<br />
reinforcing reminder. This imagery was adopted<br />
and adapted from a NCORE (National Conference<br />
on Race and <strong>Equity</strong> in American Higher Education)<br />
workshop presentation and was rolled out June 19,<br />
2017. Figure 4. Interaction Institute for Social Change<br />
Artist: Angus Maguire<br />
1D: Purpose of the <strong>Equity</strong> <strong>Plan</strong><br />
The purpose of the <strong>Equity</strong> <strong>Plan</strong> is to identify and commit to strategies based on a deep analysis<br />
of our institutional data to close the completion gap. The plan includes annual growth targets<br />
and report progress toward our goals, which will be shared publicly. We will fold the <strong>Equity</strong><br />
<strong>Plan</strong> into the reporting for all our strategic goals which are posted publically in the fall and<br />
internally twice a year (interim and annual updates). <strong>ECC</strong> will work to identify obstacles<br />
students face and develop programs and policies that break down unnecessary barriers to<br />
college graduation.<br />
13<br />
<strong>ILEA</strong> <strong>Equity</strong> <strong>Plan</strong><br />
Introduction
1E: Campus Engagement <strong>Plan</strong><br />
All members of our campus community were engaged over the course of the development of<br />
our <strong>ILEA</strong> <strong>Equity</strong> <strong>Plan</strong>. (The key campus groups consulted were: Administrative team, Faculty<br />
Senate, Staff (SS<strong>ECC</strong>A), Deans Council, Student Success Infrastructure, Student Government<br />
Association, and President’s Cabinet). The campus stakeholders that were involved in the initial<br />
development of the plan were students, faculty, staff, administration, and Board of Trustees.<br />
We incorporated feedback from student focus groups and surveys to identify issues and<br />
solutions. A cross section of employees comprised our <strong>ILEA</strong> team which analyzed the data, the<br />
current state, the current pilot projects, and who considered new solutions to address equity<br />
barriers. Many of the pilot projects already underway or in proposal stages include a cross<br />
section of employees and each of these teams were interviewed as part of the plan<br />
development to determine how their project fit and how we could support it to scale it up.<br />
Once the <strong>Equity</strong>, Diversity, and Inclusion statements were drafted, our president posted them<br />
and invited feedback from all faculty, staff, and administration. The feedback was considered<br />
by the team and revisions were made incorporating the various ideas.<br />
A draft of the final report for the December 2019 submission was reviewed in its entirety by the<br />
<strong>ILEA</strong> team. It was presented to the president and board of trustees for a final review and<br />
endorsement. The student trustee was included in this feedback as a student representative.<br />
The final plan is posted on our website. As it will be a living document, there will be<br />
opportunity to continue to engage the entire campus in feedback and updates.<br />
Over 2020, we are committed to surveying the current climate across the faculty, staff,<br />
administration, and student body so that we have a baseline measurement and can track our<br />
progress over the next five years. A marketing plan will be developed to roll out campus wide<br />
beginning in the Fall semester (although it will be changed due to COVID-19 and what will work<br />
for a virtual environment). The campaign will begin to define equity and what it means at <strong>ECC</strong><br />
and how it is incorporated into our daily work. This is still in the early stages of development<br />
but it is in our Operating <strong>Plan</strong> and will be tailored to address our needs based on the<br />
assessment results.<br />
14<br />
<strong>ILEA</strong> <strong>Equity</strong> <strong>Plan</strong><br />
Introduction
2A: Overview<br />
2. Current State<br />
At the start of each fiscal year (July/August), <strong>ECC</strong> compiles data and reflects upon their impact<br />
in terms of program excellence and service delivery. Data is reported in both summative and<br />
formative ways through the following:<br />
• Annual Performance Report of Key Institutional Indicators (summative and quantitative)<br />
• Program Review Reports of Department-Level milestones (formative, both quantitative<br />
and qualitative)<br />
• Annual Report of Accomplishments in Meeting Goals and Strategies of the <strong>ECC</strong> Strategic<br />
<strong>Plan</strong> (summative and qualitative)<br />
• Student Success Dashboards (quantitative)<br />
In addition, academic departments and departments/offices within the Division of Student<br />
Services and Development review real-time data pertaining to student success and process<br />
improvements within their respective areas. These data are contained in the following ways:<br />
• Student Services and Development Annual Reports<br />
• Program Health Scorecards<br />
• Student Success Dashboards<br />
Any of the indicators and milestones/intermediate outcomes listed above can be disaggregated<br />
to review differences by characteristics of interest, such as race/ethnicity or age. These efforts<br />
allow us to understand inequalities that become the focus of our initiatives and interventions.<br />
Graduation and retention are two institutional indicators that we routinely disaggregate, as<br />
shown below.<br />
Graduation Rates<br />
Figure 5 illustrates the graduation rates for African-American, Latinx, and White students over<br />
the past five cohorts using the first-time, full-time, degree/certificate seeking IPEDS cohorts.<br />
The graduation rates reported are at the 150% of normal time to completion and include<br />
degrees and certificates.<br />
15<br />
<strong>ILEA</strong> <strong>Equity</strong> <strong>Plan</strong><br />
Current State
Figure 5. Graduation Rates by Race/Ethnicity at 150% of Normal Time to Completion<br />
45%<br />
40%<br />
35%<br />
30%<br />
25%<br />
20%<br />
15%<br />
10%<br />
5%<br />
0%<br />
150% Graduation Rate by Race/Ethnicity<br />
Fall 2011 Fall 2012 Fall 2013 Fall 2014 Fall 2015<br />
White Black/African-American Hispanic/Latinx<br />
(Source: 2019 IPEDS Feedback Report)<br />
Table 1. Graduation Rates by Race/Ethnicity and Cohort<br />
Race/Ethnicity<br />
Fall 2011 Fall 2012 Fall 2013 Fall 2014 Fall 2015<br />
150%<br />
150%<br />
150%<br />
150%<br />
Grad # in Grad # in Grad # in Grad # in<br />
Rate cohort Rate cohort Rate cohort Rate cohort<br />
# in<br />
cohort<br />
White 505 35% 502 36% 499 40% 420 39% 471 37%<br />
Black/African-<br />
American<br />
150%<br />
Grad<br />
Rate<br />
31 10% 26 19% 32 22% 21 29% 18 6%<br />
Latinx 215 28% 250 27% 256 34% 280 38% 254 32%<br />
The graduation rates shown in Table 1 illustrate positive progress among all groups except for<br />
the Fall 2015 cohort in which all three groups saw a decline in graduation rates. The graduation<br />
rate between White and Latinx students is closer together and higher than the rate for<br />
Black/African American students which lags behind. Our current data suggests a need to work<br />
on closing graduation rate gaps.<br />
16<br />
<strong>ILEA</strong> <strong>Equity</strong> <strong>Plan</strong><br />
Current State
Figure 6. Graduation Rates by Pell Status at 150% of Normal Time to Completion<br />
45%<br />
40%<br />
35%<br />
30%<br />
25%<br />
20%<br />
15%<br />
10%<br />
5%<br />
0%<br />
150% Graduation Rate by Pell Status<br />
Fall 2011 Fall 2012 Fall 2013 Fall 2014 Fall 2015<br />
Received Pell<br />
Did not receive Pell<br />
(Source: 2019 IPEDS Feedback Report)<br />
Table 2. Graduation Rates by Pell Status and Cohort<br />
Pell Status<br />
Fall 2011 Fall 2012 Fall 2013 Fall 2014 Fall 2015<br />
# in<br />
cohort<br />
150%<br />
Grad<br />
Rate<br />
# in<br />
cohort<br />
150%<br />
Grad<br />
Rate<br />
# in<br />
cohort<br />
150%<br />
Grad<br />
Rate<br />
# in<br />
cohort<br />
150%<br />
Grad<br />
Rate<br />
# in<br />
cohort<br />
Received Pell 311 30% 278 32% 351 34% 300 41% 307 32%<br />
Did not receive<br />
Pell<br />
449 35% 490 35% 548 39% 538 35% 547 36%<br />
Students receiving Pell have similar graduation rates that are slightly lower than those who do<br />
not receive Pell (see Figure 6 and Table 2). We recognize that Pell status is an uncertain<br />
indicator of financial status, as many students with financial limitations may or may not receive<br />
a Pell grant. For this reason, we are beginning to use alternative FAFSA metrics, such as<br />
expected family contribution or unmet need -- particularly for those strategies that rely on<br />
financial standing, such as the Complete to Compete Scholarship described in this plan.<br />
Additionally, Pell is also an indicator that is captured only one time upon initial enrollment,<br />
even though it often changes over time. For this reason, it may not be a reliable indicator of<br />
financial standing.<br />
Persistence Rates<br />
Using <strong>ECC</strong>’s interim benchmark data, the Fall-to-Fall persistence rates are listed in Table 3 and<br />
Figure 7 by ethnicity and Pell status. While Latinx students have the highest persistence rates,<br />
our Black/African American students have the lowest persistence rates. Those who receive Pell<br />
persist at higher rates than those students who do not receive Pell.<br />
150%<br />
Grad<br />
Rate<br />
17<br />
<strong>ILEA</strong> <strong>Equity</strong> <strong>Plan</strong><br />
Current State
Table 3. Fall-to-Fall Persistence Rates by Cohort, Race/Ethnicity and Pell Status<br />
Figure 7. First Fall to Second Fall Persistence Rates by Cohort, Race/Ethnicity and Pell Status<br />
(Source: <strong>ECC</strong> Institutional Data, Fall 2019)<br />
Implications of Current State<br />
Through <strong>ECC</strong>’s continuing work with ATD and HLC along with the evolution of the Student<br />
Success Infrastructure Council (“SSI”), in reflecting on the current status of student success, <strong>ECC</strong><br />
is well-positioned to dramatically impact student success and achieve equity in attainment. As<br />
the data above illustrate, graduation rates for the three target populations have gaps that need<br />
18<br />
<strong>ILEA</strong> <strong>Equity</strong> <strong>Plan</strong><br />
Current State
to be addressed. In other areas, such as persistence rates, one target population (Latinx<br />
students) has the highest persistence rates of any group while another target population<br />
(Black/African American students) has the lowest persistence rates. Those who receive Pell<br />
persist at higher rates than those students who do not receive Pell.<br />
The obvious implication of the current state is to close the gap with African American students.<br />
However, despite the fact Latinx students demonstrate higher persistence rates than other<br />
races/ethnicities, there is always room for improvement. Our largest population of students<br />
are and therefore, we need to continuously assess and reinvent ways of identifying where<br />
equity gaps may exist beyond the metrics used in the <strong>ILEA</strong> <strong>Plan</strong>. We have to take into account<br />
metrics that reflect our student population and where other gaps may exists such as with our<br />
part-time students (taking 3-8 credits at a time), adult learners, etc.<br />
2B: Past and Present Strategies<br />
For years, <strong>ECC</strong> has incorporated institutional structures to address equity attainment across all<br />
populations as part of our Strategic <strong>Plan</strong>. There have been multiple strategies, both past and<br />
present, which have ranged from a single event, to pilot programs that have become<br />
institutionalized, to complete reorganization of department functions, all in an effort to<br />
contribute to improving completion rates for each target student group. Examples of recent<br />
efforts making a positive difference are: Early <strong>College</strong> Credit/Dual Credit; Student Leaders;<br />
African American Connections; Accelerated Learning Pathways; and Financial Aid<br />
Counselors/Literacy Workshops. Below is a listing of some of the more recent efforts that are<br />
making a positive difference:<br />
Early <strong>College</strong> Credit/Dual Credit<br />
<strong>ECC</strong> offers secondary partners multiple options for high school students to earn college credit<br />
while in high school. Most recently, the college has expanded options for students to enroll in<br />
college courses at their high school building. In addition to in-high school dual credit courses<br />
being delivered, we continue to offer full-time and part-time general education and careertechnical<br />
education (CTE) courses on <strong>ECC</strong> campus.<br />
The Dual Credit Partnerships has grown since becoming an intentional focus. The number of<br />
schools that partner, the number of courses offered, and the number of students participating<br />
increases every year. This translates into a cost savings in tuition and an increase in the number<br />
of credits and even Associate degrees earned. As the Spring 2020 semester ends, we anticipate<br />
celebrating another class of Accelerate <strong>College</strong> (full-time dual credit program) students, 30 in<br />
total, graduating with an associate’s degree prior to their high school graduation. This is up<br />
from 10 students in 2019. The following are some of the highlights of the program:<br />
• 2019-2020<br />
o Estimated tuition saved: $891,705<br />
o Credits earned: 5,923. (This does not include the credits that may be earned upon<br />
completion of courses that are still in session over summer months due to COVID-19.<br />
o Students participated: 620 (103% increase)<br />
19<br />
<strong>ILEA</strong> <strong>Equity</strong> <strong>Plan</strong><br />
Current State
o Increased number of college courses delivered via the in-high school dual credit<br />
program model to 9.<br />
o Established a Dual Credit Advisory Council, comprised of District representatives,<br />
who have identified multiple methods to improve processes and communication.<br />
o Continued dual credit courses online during the COVID-19 “shelter at home” process<br />
and maintained student and teacher support and rigor<br />
• 2018-2019<br />
o Estimated tuition saved: $672,696.00<br />
o Credit hours earned: 5,050<br />
o Students participated: 305<br />
o Expanded in-high school options for English 101 and 102<br />
• 2017-2018<br />
o Estimated tuition saved: $551,604<br />
o Credit hours earned: 4,276<br />
o Students participated: 280<br />
o Visited South Texas <strong>College</strong> to learn about their robust dual credit programs<br />
(offerings at 78 high schools)<br />
Student Leaders<br />
Student Life is very proud of our co-curricular offerings to students and the emphasis we place<br />
on student success inside the classroom to complement their out-of-class experiences.<br />
Students Leaders perform higher compared to All Students in average hours completed,<br />
percentage of hours completed and grade point average, as displayed in Table 4.<br />
Table 4. Student Leader Performance Academic Year 2018-2019<br />
African-American Connections<br />
The African-American Fall and Spring Connection events were created to develop and foster a<br />
supportive, academically-engaged community of African-American students. By connecting<br />
students with peers, faculty, staff, and administrators committed to their success, we are<br />
setting the foundation for continued and intentional engagement throughout the academic<br />
year as well as connecting students with resources and support early on during their programs.<br />
20<br />
<strong>ILEA</strong> <strong>Equity</strong> <strong>Plan</strong><br />
Current State
Table 5. African-American Connection Event Attendance Academic Year 2018-2019<br />
Semester Length of event Attendees Attendees (FY 18)<br />
Fall 2018 1 Day 79 49<br />
Spring 2019 1 Day 57 67<br />
Members of The Black Student Achievers (“BSA”) attempt a higher number of credits,<br />
participate at a higher rate of full-time status, have a higher GPA, and better retention rates<br />
compared to non-BSA African American students from semester to semester and from year to<br />
year.<br />
Table 6. Comparison between African American students who are members of the Black<br />
Student Achievers and non-BSA members: Academic Year 2017-2018.<br />
Black Student Achievers Non-BSA African Americans<br />
Demographics Number of Students 62 467<br />
Average Age 23.2 27.6<br />
% New 5% 13%<br />
% Female 50% 59%<br />
Fall 2017 Credits Attempted (avg.) 11.4 9.5<br />
% Full time 66% 40%<br />
GPA 2.07 1.97<br />
Cumulative GPA Before Semester 2.26 2.32<br />
Spring 2018 Credits Attempted (avg.) 11.6 9.4<br />
Full time (SP18) 64% 39%<br />
GPA 1.95 1.99<br />
Cumulative GPA After Semester 2.17 2.21<br />
FA17 to SP18 Retention 95% 65%<br />
FA17 to FA18 Retention* 60% 31%<br />
W in FY 18 39% 39%<br />
* Retention to Fall 2018 is based on registration data through late May.<br />
Accelerated Developmental Pathways<br />
For several years, <strong>ECC</strong> has delivered accelerated models of developmental education that<br />
reduce time and cost for students who place into developmental math, reading, or English.<br />
Gains made by these programs continue to inform future scaling and institutionalization, and<br />
many are reported in the college's 2019 Aspen Prize for <strong>Community</strong> <strong>College</strong> Excellence<br />
application.<br />
• Hybrid Math (MTH-099). The MTH-099 course at <strong>ECC</strong> blends separate basic and<br />
intermediate algebra courses (each four credit hours) into a single 6-credit hour hybrid<br />
course. Students placing on the higher end of the ALEKS math placement test but below<br />
college-level are eligible to take MTH-099 and thus save time and tuition. First<br />
implemented in fall 2011, <strong>ECC</strong> has found that students taking this course are as<br />
successful as students in stand-alone developmental courses. Over the 8 years that<br />
MTH-099 has run, approximately 140 students enroll each year in it versus in standalone<br />
MTH-096 and MTH-098 courses. Results show that students in MTH-099 are not<br />
only more successful than similarly placed students in stand-alone courses (71% earn<br />
21<br />
<strong>ILEA</strong> <strong>Equity</strong> <strong>Plan</strong><br />
Current State
grades of C or higher versus 64% among students who enroll in MTH-096) but they are<br />
also less likely to withdraw (8% withdraw from MTH-099 versus 16% for MTH-096, on<br />
average). Moreover, 70% of students completing MTH-099 have gone on to enroll in a<br />
college-level math course versus only 31% of students in the traditional MTH-096-to-<br />
MTH-098 sequence.<br />
• Practical Math (MTH-095). Similar to MTH-099, the MTH-095 (Preparatory Math for<br />
General Education) course serves as an alternate to the traditional MTH-096-to-MTH-<br />
098 developmental sequence. This course is specifically intended for students who only<br />
intend to enroll as far as MTH-102 or MTH-104, the college’s general education collegelevel<br />
math courses. MTH-095 was first implemented in fall 2016, and <strong>ECC</strong> has found<br />
students who complete the course are successful. Over the 3 years this course has run,<br />
approximately 150 developmental math students enrolled in it each year instead of in<br />
the MTH-096-to-MTH-098 sequence. Students enrolling in MTH-095 have a slightly<br />
higher average course success (67% earn grades of C or higher compared to 64% for<br />
MTH-096) and lower withdrawal rate (10% for MTH-095 versus 16% for MTH-096, on<br />
average). Finally, 40% of students completing MTH-099 have gone on to enroll in a<br />
college-level math course versus only 31% of developmental students in the traditional<br />
MTH-096-to-MTH-098 sequence.<br />
• Accelerated Learning Program (ALP). Since 2013, <strong>ECC</strong>'s ALP program combines<br />
developmental and college-level writing courses back-to-back in a single term. Rather<br />
than taking two semesters to complete ENG-098 and ENG-101, students who place into<br />
ENG-098 are eligible to enroll in a hybrid section of ENG-101 and ENG-098 together. The<br />
ENG-101 section is a traditional offering of college-level writing that includes students<br />
who place directly into ENG-101 and students who elect to enroll in the ALP program.<br />
The ENG-098 class section always meets immediately following the ENG-101 class, and<br />
is framed a source of additional support for material learned in the ENG-101 portion of<br />
the course.<br />
Over the 6 years that this course has been offered, the success rate (grades of C or<br />
better) of students in ALP sections of ENG-098 has been similar to or higher than<br />
comparable success in traditional stand-alone ENG-098 sections. When comparing the<br />
aggregate success rate in ALP sections of ENG-098 (77%) to that of traditional ENG-098<br />
sections (74%), we see that students in the accelerated course are not adversely<br />
impacted by the accelerated nature of the combined course. We also find that less than<br />
two-thirds (62%) of students who complete the traditional ENG-098 course ever move<br />
on to enroll in ENG-101 in a subsequent semester. Due to the co-enrolled sequencing of<br />
the ALP program, 100% of students in ALP ENG-098 courses enroll in the first collegelevel<br />
English course. Finally, in their ENG-101 coursework, students in the ALP program<br />
are just as successful as students who move on to ENG-101 from a traditional ENG-098<br />
course. The aggregate success rate for ALP students in ENG-101 has been 75%,<br />
compared to the aggregate success rate of 78% for students following the traditional<br />
course sequence. Given the program's success, all ENG-098 offerings transitioned to ALP<br />
sections beginning in the 2018-19 academic year.<br />
22<br />
<strong>ILEA</strong> <strong>Equity</strong> <strong>Plan</strong><br />
Current State
• <strong>College</strong> Literacy (LTC-099). LTC-099 is an additional accelerated literacy course, which<br />
combines four developmental courses for reading and/or writing into a single 5-credit<br />
hour course. This course was first offered in fall 2016 and is especially advantageous for<br />
students who place two levels below college-level in reading and English. For such<br />
students, it is possible to meet <strong>ECC</strong>'s minimum competency requirement for collegelevel<br />
English with just one course (5 credit hours) and in one semester instead of the<br />
four courses (12 combined hours) and at least 2 semesters that the traditional<br />
developmental course pathway would have required. In evaluation of the effectiveness<br />
of LTC-099, the college has focused on student performance in high-enrolled, freshman<br />
college-level courses that have college-level reading and writing requirements as<br />
prerequisites. Our analyses show that students who place into both developmental<br />
reading and writing are much more likely to enroll in a college-level course within the<br />
first two years (86%) than students who enroll in the traditional developmental<br />
sequences (67%). We also find that students who place into both developmental<br />
reading and writing are more likely to be successful in their subsequent college-level<br />
courses if they complete LTC-099 (74%) than if they complete the traditional<br />
developmental course sequence (64%).<br />
Financial Aid Counselors/Literacy Workshops<br />
Our Student Financial Services Department is invested in student success and recognizes<br />
financial problems are distracting and worrisome for students. Sound financial health has been<br />
proven to be a catalyst to a student successfully completing college, but is often overlooked.<br />
The <strong>College</strong>’s Financial $marts Financial Literacy Program is a financial education program first<br />
implemented in 2009 to help teach critical financial literacy skills. It reflects a joint partnership<br />
between the <strong>College</strong>’s Financial Aid office and the Student Services and Development Division<br />
to educate students, families, and community members about financial literacy – how to<br />
prepare a budget, how to manage debt, and improve understanding of financial aid and student<br />
loans. Prior to its launch, <strong>ECC</strong> students were borrowing more through student loans; the cohort<br />
default rate was rising; and students were struggling to remain enrolled due to financial<br />
barriers. Mandatory one-on-one loan advising for all students seeking student loans was added<br />
to this program in 2012. Today, Financial $marts encompasses pre-collegiate non-profit youth<br />
organizations and individual presentations at area high schools that work closely with <strong>ECC</strong>’s<br />
Alliance for <strong>College</strong> Readiness. This program has seen a nearly 60% reduction in both the<br />
number of and total amount of student loans taken on by current students between 2009-2010<br />
and 2017-2018. The 3-year student loan default rate has similarly been cut approximately in<br />
half since the program was first implemented.<br />
23<br />
<strong>ILEA</strong> <strong>Equity</strong> <strong>Plan</strong><br />
Current State
Figure 8: The 2018-2019 Financial Literacy Program<br />
Financial Aid 101 helps participants learn how to pay for college and more. Financial Literacy<br />
101 is an engaging multimedia experience that combines a robust curriculum tailored to the<br />
needs of students with a learning model designed to actually prevent financial problems before<br />
they start. No registration or payment is required. Registrants can select their user type based<br />
on general or by specific student cohorts or student support service type (TRIO or Upward<br />
Bound). One-on-one, private, and individual financial counseling is also available by<br />
appointment.<br />
Summary and Lessons Learned<br />
Over the years, we have gained some general insights and lesson learned across all<br />
interventions. While we believe that many of our improvement strategies help students who<br />
exhibit gaps, we have not always developed them with a focus on closing gaps per se. At <strong>ECC</strong>,<br />
groups exhibiting gaps are not limited to the three groups targeted by <strong>ILEA</strong> but also include<br />
adult students, students enrolled in online courses and programs, and students who are<br />
undecided about their program of study – all of whom are the focus on actions occurring<br />
presently in our Operating <strong>Plan</strong>. However, interventions for targeted populations are not<br />
always scalable because the groups are so small and interventions are too specific. We are also<br />
shifting away from using deficit terms like “gap” and are approaching these statistics as<br />
opportunities for growth. As improvement strategies are integrated, we noticed we tend to do<br />
well in planning but do not always clearly define expected outcomes or document metrics to<br />
know whether a strategy is working, and projects can become siloed and associated with one<br />
person, team, department, etc., without intentional integration.<br />
24<br />
<strong>ILEA</strong> <strong>Equity</strong> <strong>Plan</strong><br />
Current State
3A. Goal<br />
Table 7. 2018-2022 Strategic <strong>Plan</strong><br />
Theme: EQUITY AND<br />
LEARNING<br />
Goal: Identify an expand<br />
practices to raise academic<br />
achievement and completion<br />
Strategy 1: Create equitable<br />
learning environments to<br />
ensure students acquire the<br />
knowledge and skills needed<br />
for academic and career<br />
success<br />
Strategy 2: Develop students'<br />
self-advocacy skills and<br />
professional behaviors<br />
Strategy 3: Study and model<br />
research-based teaching<br />
practices that elevate student<br />
learning<br />
3. Future Vision<br />
The goal of <strong>ILEA</strong> <strong>Equity</strong> <strong>Plan</strong> is, over the course of five years, to incrementally close the<br />
completion gap among African American, Latinx, and Pell Grant recipients so that there is no<br />
difference from the other students. The targets are further defined in Section 3C. Interim<br />
Benchmark Goals. We are committed to reaching these targets by implementing the strategies<br />
presented in Section 4. Institutional Strategies.<br />
3B. Vision<br />
Our <strong>Equity</strong> <strong>Plan</strong> is integrated into <strong>ECC</strong>’s overarching five year Strategic <strong>Plan</strong> for 2018 to 2022<br />
(Table 7). The four main themes of our Strategic <strong>Plan</strong> are: <strong>Equity</strong> and Learning; Holistic<br />
Programming; <strong>Community</strong> Partnerships; and Service Excellence and Collaboration. The themes<br />
have a total of 14 strategies. A more detailed annual Operating <strong>Plan</strong> further drills down these<br />
strategies into 21 specific actions to be completed every year over the five year cycle. For<br />
example, completing the <strong>ILEA</strong> <strong>Plan</strong> was action item in service of Strategy 1: Create equitable<br />
learning environments to ensure students acquire the knowledge and skills needed for academic<br />
and career success. The Operating <strong>Plan</strong> is developed by the Cabinet with the input from<br />
students, employees, and external partners. It is intended to guide operations and budgets of<br />
<strong>ECC</strong> departments, offices, and committees. It is also used as a framework for tracking progress<br />
and reporting. The plan is a work in progress and reexamined periodically as the college<br />
deploys the <strong>ECC</strong> Strategic <strong>Plan</strong>. The Strategic <strong>Plan</strong> is posted on our website and is displayed on<br />
posters throughout campus and invites comments to be sent to an email box for consideration.<br />
Theme: HOLISTIC<br />
PROGRAMMING<br />
Goal: Strategically build and<br />
maintain enrollment and<br />
purposeful pathways<br />
Strategy 4: Strengthen<br />
outreach, recruitment,<br />
retention, and completion of<br />
key target populations<br />
Strategy 5: Routinely assess<br />
and adjust college practices to<br />
ensure students make informed<br />
decisions<br />
Strategy 6: Develop an<br />
institution-wide approach to<br />
class scheduling and the<br />
efficient delivery of services<br />
Theme: COMMUNITY<br />
PARTNERSHIPS<br />
Goal: Advance relationships<br />
that benefit the college,<br />
students, and partnering<br />
organizations<br />
Strategy 7: Prepare students<br />
and ensure successful<br />
transitions through the<br />
educational pipeline (preschool<br />
through bachelor’s degree)<br />
Strategy 8: Strengthen student<br />
learning connections outside<br />
the classroom<br />
Strategy 9: Leverage<br />
community and workforce<br />
partnerships to develop<br />
resources and secure funding<br />
that supports program and<br />
student needs<br />
Strategy 10: Design and<br />
structure programs in ways that<br />
respond to community and<br />
workforce needs<br />
Theme: SERVICE EXCELLENCE<br />
Goal: Instill a culture of<br />
service excellence and<br />
collaboration<br />
Strategy 11: Provide relevant<br />
continuing education<br />
opportunities for employees<br />
Strategy 12: Improve<br />
recruitment, hiring, and<br />
onboarding of new employees<br />
Strategy 13: Strengthen crossdepartmental<br />
communication<br />
and opportunities for dialog<br />
and reflection<br />
Strategy 14: Systematically use<br />
evidence to guide academic<br />
and operational Improvements<br />
and redirect resources for<br />
maximum impact
3C. Interim Benchmark Goals<br />
Ultimately, as part of PCC’s <strong>ILEA</strong> initiative, along with 27 other colleges and universities in<br />
Illinois, we are committed to eliminating racial and socio-economic achievement gaps while<br />
aggressively increasing completion rates among these target populations by 2025. After<br />
identifying each of the gaps in the Leading Indicators and Degree Completion metrics, we had<br />
to determine what targets to use that would demonstrate that the gaps are closed. This posed<br />
a couple of challenging issues: 1) Our data show that some target populations referred to in this<br />
plan, e.g., Latinx students, do not always perform behind other populations, rather, they set the<br />
bar in terms of performance; 2) We recognize that there are multiple approaches we could take<br />
in calculating the gaps and targets.<br />
There is a certain degree, based on the <strong>ILEA</strong> spreadsheet, to which one may assume that the<br />
White students are always going to have the highest rates of completion. This is not the case<br />
across the board for <strong>ECC</strong> students. This issue was a point of discussion as we grappled with<br />
whether to follow the <strong>ILEA</strong> template for ethnicity groups (African American, Latinx, and White<br />
only) or to tweak it a bit to reflect a broader range of ethnicity groups (include Asian, Native<br />
American, etc.) or to create one group of All Other Students combining an aggregate of the<br />
remaining students outside those three groups. This introduced issues with looking at very<br />
small numbers (which still exists somewhat as the African American population is small in<br />
comparison to other student ethnicity groups). In the end, we decided to use the breakouts<br />
given by <strong>ILEA</strong> as it does represent the majority of students.<br />
Once we were decided on keeping the breakouts as given, we needed to set the targets. What<br />
does it mean to close the gap? Can we use data to select our targets? Are these statistically<br />
significant gaps and targets? After analyzing a couple of potential approaches (including 1.<br />
using aggregate averages and the lowest statistically significant improvement, and 2. selecting<br />
an acceptable but somewhat arbitrary target across all student groups irrespective of current<br />
performance), we decided to take current performance into consideration and simply use the<br />
best performing student group as the target to reach for all groups. If all student groups are<br />
the same, the gap will be closed. We recognize, however, that all students, and not just the<br />
target populations, will benefit from some of the strategies. Therefore, even the student group<br />
with the best performance, on which the target is based, would be expected to improve and<br />
potentially exceed the target we set. If so, would this just create a new gap? Also, for some of<br />
the lower performing target populations, the targets set require significant improvement and<br />
may not be realistic in terms of typical goal setting processes. Nonetheless, we decided to<br />
select targets based on current data and define closing the gap as when the target populations<br />
reach the current top performance, even if they still may be lower than the highest group in<br />
five years (especially if that group improves). The team determined while this is a possibility,<br />
the current goal is to improve the target populations, and for this reason, we extrapolate using<br />
current data.<br />
The goal is to bring each of the targeted student populations up to the level of our highest<br />
performing student group. We set interim benchmarks based on the difference between each<br />
26<br />
<strong>ILEA</strong> <strong>Equity</strong> <strong>Plan</strong><br />
Future Vision
student group’s current performance and the future target and divided the difference by the<br />
number of reporting years evenly. The increase from year to year is in equal intervals. It is<br />
likely, that real change may not happen in equal intervals, rather we will see slower movement<br />
early on as some strategies are further developed or not yet implemented, and in a few years<br />
start to see greater amounts of improvement.<br />
For example, the Table 8 depicts the first of <strong>ILEA</strong>’s benchmarks, i.e., credits accumulated first<br />
fall. Part-time Pell students are the highest demographic group for this benchmark when<br />
looking at part-time standing, and White students are the highest group for full-time standing.<br />
That is, 50% of the population of Pell students achieve the part-time threshold of at least 7<br />
hours set by <strong>ILEA</strong>, and 16% of White students achieve the threshold of at least 15 credits.<br />
Therefore, all other part-time student groups not at 50% have a gap to close, as do all other<br />
full-time student groups not at 16%. Over the course of the next five years, interim targets are<br />
set so that at the end of the five years, the target is 50% or 16%, no matter the starting point,<br />
for each student group.<br />
Table 8. Interim Benchmarks for Credits Accumulated First Fall<br />
Reporting<br />
Year<br />
Cohort<br />
African-<br />
American<br />
Students<br />
Credits accumulated first fall<br />
Part-time students (at least 7) Full-time students (at least 15)<br />
Latinx<br />
Students<br />
White<br />
Students<br />
Pell<br />
Students<br />
Non-Pell<br />
Students<br />
African-<br />
American<br />
Students<br />
Latinx<br />
Students<br />
White<br />
Students<br />
Pell<br />
Students<br />
The full set of targets and interim benchmarks for all seven of the leading indicators and<br />
completion metrics are in the Appendix.<br />
Non-Pell<br />
Students<br />
2019 Fall 2018 (benchmark year) 29% 37% 40% 50% 32% 6% 12% 16% 12% 15%<br />
2020 Fall 2019 33% 39% 42% 50% 35% 8% 13% 16% 13% 15%<br />
2021 Fall 2020 36% 41% 43% 50% 38% 9% 13% 16% 13% 15%<br />
2022 Fall 2021 40% 44% 45% 50% 41% 11% 14% 16% 14% 16%<br />
2023 Fall 2022 43% 46% 47% 50% 44% 13% 15% 16% 15% 16%<br />
2024 Fall 2023 47% 48% 48% 50% 47% 14% 15% 16% 15% 16%<br />
2025 Fall 2024 50% 50% 50% 50% 50% 16% 16% 16% 16% 16%<br />
Fall 2024 (Target)<br />
50% 16%<br />
(2024 targets were set to highest benchmark year value from any of selected cohorts.<br />
The target-setting demographic group is highlighted in red)<br />
27<br />
<strong>ILEA</strong> <strong>Equity</strong> <strong>Plan</strong><br />
Future Vision
This page intentionally left blank.
4. Institutional Strategies<br />
<strong>Elgin</strong> <strong>Community</strong> <strong>College</strong> will execute seven strategies specifically to improve persistence and<br />
to close the gap on completion rates. The process for selecting these strategies included a<br />
thorough review of institutional data, <strong>ILEA</strong> team member discussions, and input from college<br />
faculty, staff, and students. The <strong>ILEA</strong> team considered interventions already vetted and<br />
developed in the form of pilot projects that could be expanded to focus on the target areas<br />
(African Americans, Latinx, low-income students) and be fully institutionalized within five years.<br />
In addition to these improvement projects, as an institution, our culture is shifting from making<br />
institutional policies, procedures, and processes based on what makes sense to departmental<br />
functions to one that is openly reviewing and revising said practices through an equity lens to<br />
remove systemic barriers impeding student success. As we make this cultural shift we will<br />
continue to address barriers which further influence our chosen strategies.<br />
As the team worked through these strategies, it became apparent that there were not as many<br />
separate and different strategies for each specific group, rather the strategies were overarching<br />
and typically applicable for more than one of the targeted groups. There is overlap even if<br />
there is a unique spin for each separate group. The <strong>ILEA</strong> team ultimately determined that the<br />
most comprehensive approach to address each student is on an individual level which will drive<br />
us to adopt a holistic case management model (Strategy 6). While all these strategies have<br />
been selected specifically to keep our focus on equity, each serves the <strong>ECC</strong> 2018-2022 Strategic<br />
<strong>Plan</strong> that drives our daily work and our mission To Improve People’s Lives Through Learning.<br />
Aligning the <strong>Equity</strong> <strong>Plan</strong> strategies with our overall Strategic <strong>Plan</strong> provides added support and<br />
commitment to ensuring the implementation of the strategies and meeting the goal to close<br />
the gap.<br />
STRATEGY OVERVIEW<br />
There are a total of six direct student-facing <strong>ILEA</strong> strategies and one indirect student-facing<br />
strategy. The same strategy may be used for more than one targeted student population.<br />
Listed by targeted student population, the following are the strategies for each:<br />
Direct Student Facing Strategies<br />
• African American Students<br />
o <strong>ILEA</strong> <strong>Equity</strong> <strong>Plan</strong> Strategy 1: MAP - Mandatory Advising Program<br />
o <strong>ILEA</strong> <strong>Equity</strong> <strong>Plan</strong> Strategy 2: OER - Open Educational Resources<br />
o <strong>ILEA</strong> <strong>Equity</strong> <strong>Plan</strong> Strategy 3: Mentoring (TRIUMPH and Peer to Peer)<br />
o <strong>ILEA</strong> <strong>Equity</strong> <strong>Plan</strong> Strategy 6: Holistic Case Management Model<br />
• Latinx Students<br />
o <strong>ILEA</strong> <strong>Equity</strong> <strong>Plan</strong> Strategy 1: MAP - Mandatory Advising Program<br />
o <strong>ILEA</strong> <strong>Equity</strong> <strong>Plan</strong> Strategy 2: OER - Open Educational Resources<br />
o <strong>ILEA</strong> <strong>Equity</strong> <strong>Plan</strong> Strategy 3: Mentoring (TRIUMPH)<br />
29<br />
<strong>ILEA</strong> <strong>Equity</strong> <strong>Plan</strong><br />
Institutional Strategies
o <strong>ILEA</strong> <strong>Equity</strong> <strong>Plan</strong> Strategy 4: OLAS Expansion and Outreach<br />
o <strong>ILEA</strong> <strong>Equity</strong> <strong>Plan</strong> Strategy 6: Holistic Case Management Model<br />
• Pell Recipients<br />
o <strong>ILEA</strong> <strong>Equity</strong> <strong>Plan</strong> Strategy 1: MAP - Mandatory Advising Program<br />
o <strong>ILEA</strong> <strong>Equity</strong> <strong>Plan</strong> Strategy 2: OER – Open Educational Resources<br />
o <strong>ILEA</strong> <strong>Equity</strong> <strong>Plan</strong> Strategy 5: Complete to Compete Grant<br />
o <strong>ILEA</strong> <strong>Equity</strong> <strong>Plan</strong> Strategy 6: Holistic Case Management Model<br />
Indirect Student Facing Strategy<br />
While most of the <strong>ILEA</strong> <strong>Plan</strong> strategies provide direct student support, we acknowledge we<br />
need to educate ourselves on the best ways to support students. The way we do that is<br />
through professional development which is an indirect strategy.<br />
o <strong>ILEA</strong> <strong>Equity</strong> <strong>Plan</strong> Strategy 7: TIDE - Teaching/Learning, Inclusion, Diversity, and <strong>Equity</strong><br />
group formation<br />
Strategy Alignment<br />
Each of the <strong>ILEA</strong> <strong>Equity</strong> <strong>Plan</strong> Strategies aligns with one or more of our campus-wide Operating<br />
<strong>Plan</strong> strategies that support <strong>ECC</strong>’s Strategic <strong>Plan</strong> for 2018 to 2022 as shown in Table 9.<br />
30<br />
<strong>ILEA</strong> <strong>Equity</strong> <strong>Plan</strong><br />
Institutional Strategies
Table 9. <strong>ILEA</strong> Strategy Alignment to <strong>ECC</strong> Strategic <strong>Plan</strong> 2018 TO 2022<br />
<strong>ILEA</strong> <strong>Equity</strong><br />
<strong>Plan</strong> Strategy<br />
Theme: EQUITY AND LEARNING Theme: HOLISTIC PROGRAMMING Theme: COMMUNITY PARTNERSHIPS Theme: SERVICE EXCELLENCE<br />
Goal: Identify an expand practices to<br />
raise academic achievement and<br />
completion<br />
Strategy 1:<br />
Create<br />
equitable<br />
learning<br />
environment<br />
s to ensure<br />
students<br />
acquire the<br />
knowledge<br />
and skills<br />
needed for<br />
academic<br />
and career<br />
success<br />
Strategy 2:<br />
Develop<br />
students'<br />
selfadvocacy<br />
skills and<br />
professional<br />
behaviors<br />
Strategy 3:<br />
Study and<br />
model<br />
researchbased<br />
teaching<br />
practices<br />
that elevate<br />
student<br />
learning<br />
Goal: Strategically build and maintain<br />
enrollment and purposeful pathways<br />
Strategy 4:<br />
Strengthen<br />
outreach,<br />
recruitment,<br />
retention,<br />
and<br />
completion<br />
of key target<br />
populations<br />
Strategy 5:<br />
Routinely<br />
assess and<br />
adjust<br />
college<br />
practices to<br />
ensure<br />
students<br />
make<br />
informed<br />
decisions<br />
Strategy 6:<br />
Develop an<br />
institutionwide<br />
approach to<br />
class<br />
scheduling<br />
and the<br />
efficient<br />
delivery of<br />
services<br />
Goal: Advance relationships that benefit the college,<br />
students, and partnering organizations<br />
Strategy 7:<br />
Prepare<br />
students<br />
and ensure<br />
successful<br />
transitions<br />
through the<br />
educational<br />
pipeline<br />
(preschool<br />
through<br />
bachelor’s<br />
degree)<br />
Strategy 8:<br />
Strengthen<br />
student<br />
learning<br />
connections<br />
outside the<br />
classroom<br />
MAP <br />
OER <br />
Mentoring:<br />
TRIUMPH<br />
Mentoring:<br />
Peer to Peer<br />
<br />
<br />
OLAS <br />
Complete to<br />
Compete<br />
Grant<br />
Holistic Case<br />
Management<br />
Model<br />
<br />
<br />
Strategy 9:<br />
Leverage<br />
community<br />
and<br />
workforce<br />
partnerships<br />
to develop<br />
resources<br />
and secure<br />
funding that<br />
supports<br />
program<br />
and student<br />
needs<br />
Strategy 10:<br />
Design and<br />
structure<br />
programs in<br />
ways that<br />
respond to<br />
community<br />
and<br />
workforce<br />
needs<br />
Goal: Instill a culture of service excellence and<br />
collaboration<br />
Strategy 11:<br />
Provide<br />
relevant<br />
continuing<br />
education<br />
opportunities<br />
for<br />
employees<br />
Strategy 12:<br />
Improve<br />
recruitment,<br />
hiring, and<br />
onboarding<br />
of new<br />
employees<br />
Strategy 13:<br />
Strengthen<br />
crossdepartmental<br />
communication<br />
and<br />
opportunities<br />
for<br />
dialog and<br />
reflection<br />
<br />
TIDE <br />
Strategy 14:<br />
Systematically<br />
use<br />
evidence to<br />
guide<br />
academic<br />
and<br />
operational<br />
Improvements<br />
and<br />
redirect<br />
resources<br />
for<br />
maximum<br />
impact<br />
31<br />
<strong>ILEA</strong> <strong>Equity</strong> <strong>Plan</strong><br />
Institutional Strategies
SPECIFIC STRATEGY DESCRIPTIONS<br />
<strong>ECC</strong> is committed to implementing, evolving, and institutionalizing the following specific<br />
strategies. During 2019, each strategy is in a different stage of development. Some are brand<br />
new and will require great planning in the next year while others are well established and<br />
proven strategies that we are expanding in order to close the gaps by 2025.<br />
<strong>ILEA</strong> EQUITY PLAN STRATEGY 1: MANDATORY ADVISING PROGRAM (MAP)<br />
In an effort to promote and foster an environment of academic success, the <strong>ECC</strong> Academic<br />
Advising Team instituted a Mandatory Advising Program (MAP) Pilot in February 2019. Studies<br />
have shown that students who meet with an advisor either “sometimes” or “often” had<br />
significantly higher persistence rates than those who did not (Klepfer & Hull, 2012). The goal of<br />
MAP is to ensure students meet with an advisor, especially at key academic milestones. MAP<br />
targeted all current, full-time, transfer degree students who were on track to complete 24-36<br />
credit hours by the end of the Spring 2019 semester. Seven hundred and twenty five (725)<br />
students were identified to participate in the pilot. As of Fall 2019, 92% of students (667) had<br />
completed their MAP appointment.<br />
The MAP appointment includes:<br />
• Identification of academic goals (reassessment, if necessary)<br />
• Discussion and/or confirmation of program of study<br />
• Transfer/pathway guidance<br />
• Courses planned for upcoming semester(s)<br />
• Create “next steps” towards successful completion<br />
• Discuss overcoming barriers to success<br />
• If undecided-referred to Career Development<br />
• Discussion of success strategies<br />
• Access to Time Management Module, an online tutorial in Desire2Learn, the <strong>College</strong>’s<br />
learning management system, to teach students how to manage their time<br />
During their entire enrollment, 94% of MAP group students met with an advisor compared to<br />
69% of Other Spring 2019 Students. While 86% met with their assigned advisor during the<br />
advising year compared to 37%. Of those who met with any advisor, the average number of<br />
appointments this advising year was 3.0 for MAP compared to 2.2 (Table 10).<br />
Table 10. Map Pilot Advising Appointment Results<br />
MAP<br />
Group<br />
Other Spring<br />
2019 Students<br />
Ever met with any advisor 94% 69%<br />
Met with assigned advisor this Advising Year 86% 37%<br />
Of those who've met with any advisor, average number<br />
appointments this Adv. Year 3.0 2.2<br />
32<br />
<strong>ILEA</strong> <strong>Equity</strong> <strong>Plan</strong><br />
Institutional Strategies
To assess the first pilot group of MAP students from Spring 2019, a comparison group was<br />
created with students who fell just outside the credit boundaries. These two groups were<br />
similar in gender, race/ethnicity, age, and academic success. Retention rates and advising<br />
appointments were higher among the MAP group than the comparison group.<br />
Table 11. Map Pilot Retention Results<br />
MAP<br />
Group<br />
Comparison<br />
Group<br />
Spring 2019 students enrolled in Fall 2019 80% 67%<br />
Latinx students 84% 71%<br />
Black/African American 70% 38%<br />
As Table 11 displays, the MAP students enrolled in Fall 2019 at a rate of 80% compared to 67%<br />
for the comparison group. This retention rate increase can be seen within minority student<br />
groups as well. Latinx students enrolled 13 percentage points higher and Black/African-<br />
American students saw a 32 percentage point increase.<br />
As part of the <strong>ILEA</strong> <strong>Equity</strong> <strong>Plan</strong>, mandatory advising will be continued. The strategy is<br />
connected to other institutional efforts and supports <strong>ECC</strong>’s strategies in our 2018-2022<br />
Strategic <strong>Plan</strong>. See Table 9 for specific strategies that are aligned.<br />
The Success Indicators used to demonstrate this strategy is having an impact are:<br />
• Student completion of course and programs<br />
• Student progression through their pathway<br />
• Transfer to subsequent educational<br />
• Student engagement and satisfaction with college programs and services<br />
• Student mastery of learning outcomes<br />
• Enrollment of identified target populations<br />
• Degree of fit between students’ goals, skills, and experiences and college programs and<br />
services<br />
• Readiness of incoming students<br />
• Preparedness of graduates for transfer and/or employment<br />
<strong>ILEA</strong> EQUITY PLAN STRATEGY 2: OER – OPEN EDUCATIONAL RESOURCES<br />
Open Educational Resources (“OER”) are high quality educational content/materials that are<br />
free to students. OER is a growing movement in higher education. It is broadly defined as “the<br />
open provision of educational resources, enabled by information and communication<br />
technologies, for consultation, use, and adaptation by a community of users for noncommercial<br />
purposes” (UNESCO, 2002, p. 24). At <strong>ECC</strong>, OER will “encompass free, online learning content,<br />
software tools, and accumulated digital curricula that are not restricted by copyright license<br />
and available to retain, reuse, revise, remix, and redistribute” (Hilton, Fischer, Wiley, &<br />
Williams, 2016). By removing the cost of these materials access to higher education will<br />
improve, costs will be reduced, student performance will be improved and more students will<br />
complete in less time and with less debt.<br />
33<br />
<strong>ILEA</strong> <strong>Equity</strong> <strong>Plan</strong><br />
Institutional Strategies
We believe this strategy will improve equal access to higher education, improve affordability<br />
and decrease debt. Article 26 of the United Nations’ Universal Declaration of Human Rights has<br />
language embedded within it concerning the importance of equal access to higher education. In<br />
our own country, state, and school district, people do not have equal access to higher<br />
education. Higher education is structured in a way that mostly serves to reinforce social<br />
inequality. Of course this issue is broader than just textbooks, but textbooks and school<br />
supplies are an area of costs that do impact affordability and therefore accessibility, and the<br />
cost of which is something that we can work to decrease or remove. The cost of textbooks has<br />
risen 3-4 times the rate of inflation since 1980, according to the Bureau of Labor Statistics<br />
http://www.bls.gov/cpi/. At <strong>ECC</strong>, we estimate it costs students $3,000 in textbooks and<br />
materials to complete an associate’s degree. We estimate that our typical student completes<br />
their degree with just over $3,062 of federal debt. By moving to OER we could make higher<br />
education more accessible and decrease student debt.<br />
Research supports a positive impact on Federal Pell Grant recipient student performance. In a<br />
study of 21,822 students, “OER improve[d] end-of-course grades and decrease[d] DFW (D, F,<br />
and Withdrawal letter grades) rates for all students. They also improve[d] course grades at<br />
greater rates and decrease[d] DFW rates at greater rates for Pell recipient students, part-time<br />
students, and populations historically underserved by higher education.” (Colvard, Watson &<br />
Park, 2018). The study results also demonstrated a narrowing in the gap in academic<br />
performance between white and non-white student groups following OER adoption.<br />
To successfully implement OER, faculty are provided support from librarians, the copyright<br />
officer, and instructional technology/distance learning coordinators. A stipend will likely be<br />
determined to financially support the development efforts of those research and implement<br />
OER material for their coursework. This strategy was first proposed in the Fall 2019. A<br />
committee has been formed to design and implement a pilot program and faculty members will<br />
be solicited to join that pilot.<br />
The OER strategy is connected to other institutional efforts and supports <strong>ECC</strong>’s strategies in our<br />
2018-2022 Strategic <strong>Plan</strong>. See Table 9 for specific strategies that are aligned.<br />
The Success Indicators used to demonstrate this strategy is having an impact are:<br />
• Student completion of course and programs<br />
• Student progression through coursework<br />
• Transfer to subsequent educational<br />
• Student engagement and satisfaction with college programs and services<br />
• Student mastery of learning outcomes<br />
• Enrollment of identified target populations<br />
<strong>ILEA</strong> EQUITY PLAN STRATEGY 3: MENTORING<br />
Mentoring programs, in general, offer a structured forum for students to build relationships;<br />
openly discuss concerns and issues; be connected to valuable resources; make meaningful<br />
34<br />
<strong>ILEA</strong> <strong>Equity</strong> <strong>Plan</strong><br />
Institutional Strategies
connections so they are engaged and more likely to continue; and provide access to positive<br />
role-models. These benefits lead students to higher self-esteem and levels of academic<br />
achievement. And, the connections made can result in employment upon college completion.<br />
Our <strong>Equity</strong> <strong>Plan</strong> has two mentoring programs: TRIUMPH and Peer to Peer.<br />
TRIUMPH<br />
<strong>ECC</strong> is proud to offer the Transforming and Impacting Undergraduate Men Pursuing Higher<br />
Education (TRIUMPH) Program to increase the number of males of color graduating from<br />
community colleges. The program helps male students of color realize their potential, and<br />
equips them with the tools to succeed in their academic, personal, and future professional lives.<br />
TRIUMPH, which was started by Triton <strong>College</strong> in 2014, is now a partnership between three<br />
community colleges: Triton, Waubonsee, and <strong>Elgin</strong>. The partnership allows the schools to pool<br />
resources and services, and to create synergies that can be shared among this small, yet very<br />
specific set of students (especially African-American males) who face unique challenges through<br />
the education process. For example, students lack skills of problem solving, so if their car stops<br />
running or becomes unreliable, they live with it and just do not get to where they need to go.<br />
This program works with them to find solutions like forming a network for rides, planning to<br />
buy a car by budgeting and understanding how long they would have to work to afford a car; or<br />
getting and comparing multiple quotes for necessary repairs and how to pay for it, etc. These<br />
students often have manual labor type jobs that affects their energy and ability to focus. Many<br />
have many stressful life events and stressful home situation with which they are dealing.<br />
The TRIUMPH Program is open to any male student of color who is interested. Upon joining,<br />
the student first becomes a prospective scholar and then becomes an inducted scholar. To<br />
become an inducted scholar, a student must: enroll in six credit hours, complete ten hours of<br />
community service, be in good financial standing with the school, and attend four workshops.<br />
The program offers mentoring, networking, study sessions, volunteering, and service projects<br />
to cultivate skills in these areas:<br />
• Conflict resolution<br />
• Emotion management<br />
• Financial literacy<br />
• Goal setting<br />
• Public speaking<br />
• Time management<br />
• Writing<br />
An example of an opportunity TRIUMPH scholars will have is an invitation to attend is a half-day<br />
conference on Men of Color in January 2020 (co-sponsored by all three colleges in the<br />
partnership). The keynote presenter will be Luke Wood, PhD, Associate Professor of<br />
<strong>Community</strong> <strong>College</strong> Leadership and the Director of the Doctoral Program Concentration in<br />
<strong>Community</strong> <strong>College</strong> Leadership at San Diego State University (SDSU).<br />
35<br />
<strong>ILEA</strong> <strong>Equity</strong> <strong>Plan</strong><br />
Institutional Strategies
A highlight of the program is being inducted as a scholar after meeting the requirements. A<br />
ceremony is held at the end of each semester and members earn their cardigan sweaters,<br />
which are coveted and worn with pride. Once a scholar, students are paired with a mentor to<br />
prepare to transition outside of <strong>ECC</strong>. An emphasis is placed on building a personal brand (how<br />
one speaks and how one treats people) so they can enter the next stage of their education or<br />
career with the necessary skills to navigate life’s challenges as well rounded individuals poised<br />
for success.<br />
National research shows that males of color who start college as a freshman are less likely than<br />
either sex of any race or ethnicity to complete their degree. At <strong>ECC</strong>, we found this to be<br />
consistent. Our Black/African American males had the greatest gap. Whether being compared<br />
to female Black/African American students or being compared to other men of color (Latinx),<br />
Black/African American male students’ completion rates are disproportionately lower and have<br />
not improve over time as we have seen with other student subgroups. We learned from<br />
student focus groups conducted at <strong>ECC</strong> in 2018 that male students of color sometimes feel they<br />
are targets of microaggression in the form of stereotypes based on pejorative perceptions<br />
(Solórzano et al., 2000). With the TRIUMPH mentoring program we believe we will be able to<br />
reach and engage these students to close the gap on completion. Mentoring is a way to give<br />
individual attention and connection with each student.<br />
TRIUMPH is a new strategy for the college and was first implemented in Fall 2019. During this<br />
planning semester, there are already 13 students in the program. Recruiting efforts are<br />
continuing. By the second year, participation is expected to be 100 men of color.<br />
The TRIUMPH program is connected to other institutional efforts and supports <strong>ECC</strong>’s strategies<br />
in our 2018-2022 Strategic <strong>Plan</strong>. See Table 9 for specific strategies that are aligned.<br />
The Success Indicators used to demonstrate this strategy is having an impact are:<br />
• Student completion of course and programs<br />
• Student progression through coursework<br />
• Student job attainment<br />
• Transfer to subsequent educational institutions<br />
• Student engagement and satisfaction with college programs and services<br />
• Student mastery of learning outcomes<br />
• Enrollment of identified target populations<br />
• Degree of fit between students’ goals, skills, and experiences and college programs and<br />
services<br />
• Preparedness of graduates for transfer and/or employment<br />
• Employer and community satisfaction with college programs, services and graduates<br />
Peer to Peer Mentoring Program<br />
The Peer Mentoring Program is intended for both female and male African American students<br />
and runs for the entire academic year. Student participants serve as both the coaches<br />
36<br />
<strong>ILEA</strong> <strong>Equity</strong> <strong>Plan</strong><br />
Institutional Strategies
(mentors) and scholars (mentees). Students must participate for at least one year as a scholar<br />
before applying to become a coach. Coaches are selected based on individual readiness and<br />
being interviewed. This is a small program and students mostly learn about it through word of<br />
mouth; there is some marketing and students can be approached to join as well. The role of<br />
the coach is to go beyond providing accountability academically. It is to help scholars make<br />
connections, become engrained in the <strong>ECC</strong> culture, and to provide an opportunity check-in with<br />
students to see how they are doing. Mentors are able to help address issues beyond academics<br />
and connect scholars to resources. This student population tends to be more open with peers<br />
than perhaps going to faculty, staff or administration.<br />
For the fall of 2019, the program had 7 coaches and 7 scholars. In addition to providing<br />
mentoring, the program brings in speakers on subjects like “how to talk to a professor” and<br />
“how to be an excellent student in the classroom.” Speakers may be <strong>ECC</strong> faculty and staff or<br />
from the community at large. Although data gathering is sparse, prior attempts to pilot peer to<br />
peer mentoring have suggested its benefit for student persistence. In the history of the Peer to<br />
Peer Mentoring Program, of the 30 student scholars, 23 have completed the program; 89% of<br />
the students retained from Fall 2018 to Spring 2019; there was only a 5% withdraw rate<br />
(compared to <strong>ECC</strong> rate of 18%).<br />
As part of the <strong>ECC</strong> <strong>Equity</strong> <strong>Plan</strong>, we plan to continue to grow the peer mentoring program. While<br />
this student population is a smaller percentage of the college’s demographic, it is still an<br />
important program to support student persistence, completion, and success.<br />
In Fiscal Year 2016, <strong>Elgin</strong> <strong>Community</strong> <strong>College</strong>’s Student Success Infrastructure <strong>Equity</strong><br />
Coordinating Council approved a pilot project to sponsor a part-time coordinator for an African<br />
American peer mentoring program. It is known that higher education often serves as the best<br />
means of social mobility available to our nation’s youth, and that attending college is associated<br />
with more stable patterns of employment and higher earnings. Given the success <strong>ECC</strong> found<br />
with its Latinx student organization on campus, there was a desire to model the same set up for<br />
African Americans in Student. As a result, a part-time coordinator position was approved and<br />
the peer mentoring program began in 2017. Both the coordinator position and the peer<br />
mentoring program proved to be valuable and the coordinator position became full time in<br />
2018. The program began its second full year in the 2019-2020 academic year.<br />
The Peer Mentoring program is connected to other institutional efforts and supports <strong>ECC</strong>’s<br />
strategies in our 2018-2022 Strategic <strong>Plan</strong>. See Table 9 for specific strategies that are aligned.<br />
The Success Indicators used to demonstrate this strategy is having an impact are:<br />
• Student completion of course and programs<br />
• Student progression through coursework<br />
• Student job attainment<br />
• Transfer to subsequent educational institutions<br />
• Student engagement and satisfaction with college programs and services<br />
37<br />
<strong>ILEA</strong> <strong>Equity</strong> <strong>Plan</strong><br />
Institutional Strategies
• Student mastery of learning outcomes<br />
• Enrollment of identified target populations<br />
• Degree of fit between students’ goals, skills, and experiences and college programs and<br />
services<br />
• Preparedness of graduates for transfer and/or employment<br />
<strong>ILEA</strong> EQUITY PLAN STRATEGY 4: OLAS EXPANSION AND OUTREACH<br />
<strong>ECC</strong> is proud to be a Hispanic Serving Institution “HSI”. The Organization of Latin American<br />
Students (“OLAS”) is the second largest student organization on campus and historically has had<br />
a rich, deeply engrained, and active presence. While Latinx students are part of the gap across<br />
the higher educational system, at <strong>ECC</strong>, they are close to on par with or better than White<br />
students on some benchmarks. For example, Figure 9 illustrates that 3-year completion rates<br />
for full-time Latinx students are typically 8 to 10 points behind completion rates for Full-time<br />
White student, with a 4 to 5 point completion rate difference between these groups when the<br />
completion window is extended to 4. However, when comparing Part-time Latinx students to<br />
Part-time White students, there are no such gaps, with Latinx students completing at similar or<br />
better rates than White students years as illustrated in Figure 10.<br />
Despite little to no completion gaps for Latinx students, there is a sense we want to do more<br />
and we believe focusing on outreach through OLAS, given the large population of students, is<br />
important. In recent focus groups with Latinx and Undocumented student groups, most<br />
students told us that they knew of <strong>ECC</strong> as a Hispanic-Serving Institution, but that their day-today<br />
experiences at the college did not make this obvious to them or other students. Both<br />
African American and Latinx student groups highlighted a continuing difficulty with finding<br />
timely information about college policies and practices. Latinx students also highlighted the<br />
importance of their family and community relationships as significant support structures to<br />
their overall success in college.<br />
During the first year of the five year plan, we will identify strategies to implement over the<br />
following four years. Although this is a well-established student entity at <strong>ECC</strong>, we plan to<br />
improve outreach in order to impact this significant population through our Student Services<br />
guidance and support. Therefore, it is not yet known exactly how or what is going to be done<br />
specifically, just that there will be more dedicated staff and resources to determining the best<br />
outreach strategies. Some possible ideas as we consider operating budgets over the next five<br />
years may be more dedicated academic advisors for Latinx students, more dedicated staff to<br />
support OLAS, working with recruiting for representation, and creating an environment where<br />
we routinely talk about data and intentionally bring key groups together to strategize. We are<br />
also examining successful programs at other colleges to incorporate best practices. For<br />
example, programs that focus on providing support in the areas of academic advising, tutoring,<br />
vocational, career, personal and financial counseling, and providing an environmental support<br />
system relevant to the development of a positive self-image and a feeling of belonging.<br />
38<br />
<strong>ILEA</strong> <strong>Equity</strong> <strong>Plan</strong><br />
Institutional Strategies
Figure 9. 3 Year Graduations Rates for Full and Part Time Students by Race/Ethnicity<br />
(Source: <strong>ECC</strong> Institutional Data, Fall 2019)<br />
Figure 10. 4 Year Graduations Rates for Full and Part Time Students by Race/Ethnicity<br />
(Source: <strong>ECC</strong> Institutional Data, Fall 2019)<br />
39<br />
<strong>ILEA</strong> <strong>Equity</strong> <strong>Plan</strong><br />
Institutional Strategies
The OLAS Expansion and Outreach strategy is connected to other institutional efforts and<br />
supports <strong>ECC</strong>’s strategies in our 2018-2022 Strategic <strong>Plan</strong>. See Table 9 for specific strategies<br />
that are aligned.<br />
The Success Indicators used to demonstrate this strategy is having an impact are:<br />
• Student completion of course and programs<br />
• Student progression through coursework<br />
• Student job attainment<br />
• Transfer to subsequent educational institutions<br />
• Student engagement and satisfaction with college programs and services<br />
• Enrollment of identified target populations<br />
• Preparedness of graduates for transfer and/or employment<br />
• Responsiveness to student and community needs<br />
<strong>ILEA</strong> EQUITY PLAN STRATEGY 5: COMPLETE TO COMPETE GRANT<br />
The purpose of the Complete to Compete Grant strategy is to give support to financially<br />
disadvantaged students who are most at-risk of not completing their degrees compared to their<br />
peers.<br />
Born out of the desire of the Foundation Board to want to do more for students, the question,<br />
“What problem must be solved?” was asked. The foundation used volunteers in a call<br />
campaign to stopped out students in order to better understand why they stopped out so close<br />
to completion. A common response was due to a lack financial resources. This feedback,<br />
coupled with the Strategic <strong>Plan</strong> which guides every day decisions, the answer became clear:<br />
provide financial support for those students close to completing their 60 hours for a degree<br />
who are at highest risk of stopping out (based on predictive analytics) for reasons outside of<br />
academics. For example, students may have to work more to afford school and regular living<br />
expenses or child care, so they are unable to attend school full-time.<br />
As this idea was further explored, it was determined it wasn’t enough to pay for the direct costs<br />
to attend (i.e., credits), rather the need is to offset income so the student did not have to work<br />
as much and could focus on school. Therefore, money from the Complete to Compete grant is<br />
allowed to be spent on ancillary costs (e.g., bills, day care, etc.). It is “no strings attached” as<br />
long as it is going to help the student finish school.<br />
This grant has been in development since January, 2019, and the first student recipients will<br />
receive their awards in Fall 2020. During Spring 2020, eligible students will be identified and an<br />
invitation to apply will be sent. Student eligibility requirements are to: have a least 45 credit<br />
hours completed by the end of Spring 2020; be able to finish within a year (end of 2021). Based<br />
on the requirements, there are approximately 350 students that will be invited to apply.<br />
As part of the selection criteria, a composite score will be calculated based on a set of<br />
characteristics used to identify those least likely to complete without an intervention. Some of<br />
40<br />
<strong>ILEA</strong> <strong>Equity</strong> <strong>Plan</strong><br />
Institutional Strategies
the variables in the composite score will be Pell eligibility, credits completed, 2.0+ accumulative<br />
GPA, semester GPA prior to completing 45 credits, EFC (FAFSA calculated Expected Family<br />
Contribution), and unmet financial need (total direct and indirect costs to attend). (All<br />
completed applications that are not awarded the Complete to Compete Grant will go into the<br />
general scholarship pool.) We anticipate the first cohort to have EFC of less than $1,000, be<br />
part-time, have an average accumulative GPA of 2.8 but declining, taken four years to reach<br />
credit requirement, and be the average age of 25.<br />
The inaugural grant is expected to be awarded to 20 students. Awardees will be required to<br />
meet with an advisor at least two times a semester, develop an Educational <strong>Plan</strong>, check-in with<br />
faculty on a regular basis, and maintain good standing (2.0 GPA or above). The first year,<br />
$120,000 is projected, giving each student approximately $6000. The project is funded by a<br />
foundation fundraising campaign. In the second and third year the goal is to scale it up.<br />
Eventually, a $3,000,000 endowment will aim to sustain the fund and be extended to more<br />
students. Also, up to $1,000 will be given toward debt to help students start out debt free after<br />
completion (part of the overall $6,000 maximum disbursement).<br />
The Complete to Compete Grant is connected to other institutional efforts and supports <strong>ECC</strong>’s<br />
strategies in our 2018-2022 Strategic <strong>Plan</strong>. See Table 9 for specific strategies that are aligned.<br />
The Success Indicators used to demonstrate this strategy is having an impact are:<br />
• Student completion of course and programs<br />
• Student progression through coursework<br />
• Student job attainment<br />
• Transfer to subsequent educational institutions<br />
• Student engagement and satisfaction with college programs and services<br />
• Enrollment of identified target populations<br />
<strong>ILEA</strong> EQUITY PLAN STRATEGY 6: HOLISTIC CASE MANAGEMENT MODEL<br />
The purpose is to further evolve our academic advising into a case management model, which is<br />
relationship-based, student-centered, data-driven, and holistic. We will achieve this model by<br />
introducing two new resources: predictive analytics software and Student Success Coaches.<br />
In 2014, the <strong>College</strong> reorganized our approach from academic counseling to academic advising<br />
with a shift toward case management. In 2019, we implemented MAP (Mandatory Advising<br />
Program, see Strategy 1 above). The MAP has been successful but we are challenged by large<br />
caseloads and the level of need varies greatly across the student body. Current academic<br />
advisors have enormous caseloads. Industry best practices recommend 300 active students per<br />
advisor while <strong>ECC</strong> advisors can have 800-900 active students and 1300-1400 non-active. To<br />
successfully advise that many students, our advisors have to be very targeted in their<br />
communications, have to understand who their students are, and be able to engage and build a<br />
relationship with those students. Identifying students for interventions is also still challenging.<br />
41<br />
<strong>ILEA</strong> <strong>Equity</strong> <strong>Plan</strong><br />
Institutional Strategies
Much of the onus is on highly engaged faculty who are willing to alert advising of potential<br />
need.<br />
Technology is going to aid advisors in both targeting their communications and identifying their<br />
most vulnerable students so they are better able to prioritize their limited time with those<br />
students. New early alert software has been selected from a vendor. Using an algorithm of our<br />
institutional data both static (standardized test scores, high school GPA, etc.) and dynamic<br />
(attendance, current class grade, mid-term grade, etc.) all students will receive a predictive<br />
score unique to themselves based on key factors: attended financial aid appointment, class<br />
attendance, etc. Based on the predictive analytics assigned, outreach, and interventions will be<br />
administered. Scores will place students in a red, yellow, or green category based on the risk<br />
score assigned. This score can change throughout the semester as student performance<br />
changes. Based on the various alerts that can be triggered, academic advisors will tailor<br />
messaging to students individually or in bulk (with some personalization) with the appropriate<br />
intervention. These interventions can be anything from reminders and check-ins or connecting<br />
the student to <strong>ECC</strong> or outside resources. Advisors may not spend a lot of time with students in<br />
green and only send them important general messages and limit interactions to more<br />
traditional advising. While they may spend more time on students in the red. <strong>Equity</strong> is a central<br />
feature of the new case management system.<br />
Not all student needs are related to navigating the academic and procedural aspects of college.<br />
The resources needed may be beyond what an academic advising expert can provide. With the<br />
creation of Student Success Coaches, we believe we can further support our students with an<br />
added layer of support for those that need it. Student Success Coaches will emphasize the<br />
importance of establishing and cultivating a personal connection with each student in their<br />
caseload. By developing relationships with students, coaches will gain a more complete<br />
understanding of each student’s unique situation, cultural background, personal circumstances,<br />
and needs. They can then provide student-centered supports by connecting students to<br />
relevant campus resources (TRIUMPH, tutoring, financial aid) or through direct referrals and<br />
personal connections to community resources for serious personal matters (i.e., food and<br />
housing insecurity, abusive relationships, transportation challenges, etc.). The role of a Success<br />
Coach is to offer everything from soft skills to community resources, most importantly it is to<br />
understand the social implications and roots of our students’ challenges.<br />
In order to deliver the high touch, case-by-case management we envision, we will need to<br />
increase staff. We anticipate the new technology will help advisors and coaches use their time<br />
more effectively, it will also likely identify more students who have been falling through the<br />
cracks. Currently there are 13 academic advisors which may need to be increased. However,<br />
by hiring three success coaches who are dedicated to handle the most vulnerable of our<br />
students and are trained to support the social aspects and obstacles at a high level, they may be<br />
able to handle the intense cases more effectively and simultaneously free up the current<br />
number of academic advisors to handle their caseloads without increasing the number of<br />
positions needed.<br />
42<br />
<strong>ILEA</strong> <strong>Equity</strong> <strong>Plan</strong><br />
Institutional Strategies
The Holistic Case Management Model strategy is connected to other institutional efforts and<br />
supports <strong>ECC</strong>’s strategies in our 2018-2022 Strategic <strong>Plan</strong>. See Table 9 for specific strategies<br />
that are aligned.<br />
The Success Indicators used to demonstrate this strategy is having an impact are:<br />
• Student completion of course and programs<br />
• Student progression through coursework<br />
• Student job attainment<br />
• Transfer to subsequent educational institutions<br />
• Student engagement and satisfaction with college programs and services<br />
• Enrollment of identified target populations<br />
• Preparedness of graduates for transfer and/or employment<br />
<strong>ILEA</strong> EQUITY PLAN STRATEGY 7: TIDE: Teaching/Learning Inclusion, Diversity, and <strong>Equity</strong><br />
The TIDE Group works in conjunction with <strong>ECC</strong>’s Center for Enhancement of Teaching &<br />
Learning (“CETL”), Professional/Organizational Development, and Student Services for the<br />
purpose of building on current faculty training to highlight key challenges and concerns in<br />
promoting diversity and to illustrate ways of incorporating an understanding of cultural<br />
inclusivity in the classroom and beyond. Despite having as a priority of the overall <strong>ECC</strong> Strategic<br />
<strong>Plan</strong> to promote diversity and advance opportunities for marginalized students, achieving these<br />
goals in the day-to-day classroom is harder to accomplish. Our student body is diverse along<br />
many lines, including race, ethnicity, age, religion, and previous college experience. We also<br />
have a large contingency of non-traditional students. Too, many of our students are working<br />
parents, first-generation, full-time employees, immigrants, English-language learners, and<br />
more. All of these demographic characteristics combine into a very diverse campus, which<br />
makes the need for strong cultural competency and inclusivity paramount. The goal of this<br />
TIDE program is to assist in developing a training framework and resources aimed at preparing<br />
faculty to intentionally create culturally responsive classrooms and curriculum. This will include<br />
both internally and externally developed content. The TIDE program will move faculty beyond<br />
awareness to action: incorporating specific strategies for enhancing ones’ own cultural<br />
competence and then addressing how equity and inclusion play out in the classroom.<br />
During Fall 2019, TIDE piloted a series of introductory equity-minded pedagogy workshops with<br />
faculty in the English Department (based on scheduling availability and expressed interest). The<br />
five sessions consisted of:<br />
1. Introduction to TIDE, starting conversations, language, self-awareness, etc.<br />
2. Belongingness<br />
3. Culturally Responsive Assessment<br />
4. Culturally Responsive Syllabi<br />
5. Reflections – Focus Group<br />
The first four sessions have been approved by the CETL Advisory Committee to award CETL lane<br />
movement credit.<br />
43<br />
<strong>ILEA</strong> <strong>Equity</strong> <strong>Plan</strong><br />
Institutional Strategies
Based on the feedback from the fall sessions, a spring series of monthly introductory workshops<br />
is planned and will incorporate any applicable changes. The pilot will be opened up to other<br />
departments who are interested in using the same model. Ultimately, the vision is for this to<br />
become an institutionalized program for all faculty to attend this introductory series and<br />
develop an intermediate level to continue advancing concepts related to culturally responsive<br />
classrooms for those who completed the introduction workshops. Students should start to feel<br />
as though their course materials and classrooms reflect who they are and the faculty they<br />
encounter are inclusive. Research indicates that students truly benefit from inclusive<br />
classrooms and culturally responsive instruction. “A pedagogy that empowers students<br />
intellectually, socially, emotionally, and politically by using cultural referents to impart<br />
knowledge, skills, and attitudes” is the definition of culturally responsive instruction as defined<br />
by Dr. Gloria Ladson-Billings in her book The Dreamkeepers (1994). Students thrive in the<br />
classrooms of teachers who have high expectations for students from all cultural backgrounds,<br />
use a variety of resources, promote positive social and academic development, and collaborate<br />
with colleagues and parents (Krasnoff, 2016).<br />
Additionally, in 2020-2021, the focus will include training TIDE members and other faculty and<br />
administrators in <strong>Equity</strong> Coaching to be equipped to support other faculty in designing and<br />
facilitating equitable courses and classrooms. The intention is to create a sustainable model of<br />
faulty support related to equity and culturally responsive teaching practices. The certification<br />
program will be based on a series of workshops facilitated by NAPE (National Association for<br />
Partnerships in <strong>Equity</strong>).<br />
The TIDE program strategy is connected to other institutional efforts and supports <strong>ECC</strong>’s<br />
strategies in our 2018-2022 Strategic <strong>Plan</strong>. See Table 9 for specific strategies that are aligned.<br />
The Success Indicators used to demonstrate this strategy is having an impact are:<br />
• Student completion of course and programs<br />
• Student progression through coursework<br />
• Student engagement and satisfaction with college programs and services<br />
• Employee mastery of professional development goals<br />
• Effectiveness and efficiency of institutional processes<br />
• Employee awareness and understanding of institutional processes<br />
44<br />
<strong>ILEA</strong> <strong>Equity</strong> <strong>Plan</strong><br />
Institutional Strategies
5. Evaluation <strong>Plan</strong><br />
At <strong>ECC</strong>, when it comes to evaluating any of our plans, from small pilot projects to key strategies<br />
in our Operating <strong>Plan</strong>, we follow the PDSA model (<strong>Plan</strong>, Do, Study, Act). Two times a year our<br />
strategy leaders, assigned to each of the Operating <strong>Plan</strong> actions, complete a progress update<br />
using the following form. As <strong>ILEA</strong> strategies are implemented, this same progress update<br />
process will be followed. The updates will be informed by summative and formative (both<br />
quantitative and qualitative) and student feedback. Students are often key collaborators.<br />
FY202X OPERATING PLAN PROGRESS UPDATE FORM<br />
Goal: (Insert here)<br />
Strategy #: (Insert here)<br />
Action X.X (Insert here)<br />
Report Date<br />
PLAN<br />
DO<br />
STUDY<br />
Leaders<br />
Key Collaborators<br />
What activities<br />
are we doing?<br />
What forms of<br />
evidence were<br />
used to know<br />
whether activities<br />
worked as<br />
intended?<br />
Where is progress<br />
documented?<br />
ACT<br />
What will the<br />
college do next?<br />
Cabinet Feedback:<br />
Next Steps:<br />
The PDSA model is a continuous cycle of improvement:<br />
• <strong>Plan</strong> - Define the actions and set budgets<br />
• Do – Implement actions and collect results<br />
• Study – Analyze and study the results of the action, summarize and share<br />
• Act – Reflect on meaning and implement new actions<br />
45<br />
<strong>ILEA</strong> <strong>Equity</strong> <strong>Plan</strong><br />
Evaluation <strong>Plan</strong>
6. Budget<br />
The Strategic <strong>Plan</strong>ning and Budget Council (“SPBC”) is <strong>ECC</strong>’s body that recommends to the<br />
President and Board annual budgets based on Operating <strong>Plan</strong> goals. The ideas and actions<br />
articulated in the strategies will be vetted for fair quotes and estimates of value for each of our<br />
strategies. We do this as part of our budget each year. It has been <strong>ECC</strong> practice to set budgets<br />
annually by the SPBC. We have a tightly regulated bidding process by both the Board and state<br />
law. We budget in a zero based manner meaning we plan our budgets from scratch without<br />
any assumptions of carry over funds from prior years. The reason for this is we want to test the<br />
viability from the prior year before we commit the following year.<br />
In general, costs to implement these seven strategies will include software, personnel, travel,<br />
training, additional stipends to engage faculty/staff and general supplies like publications, NAPE<br />
toolkits, books for common reading, etc. Through various sources of funding (internal<br />
operating funds, technology fund, foundation fundraising, federal stimulus funds, etc.) these<br />
plans are viable. Some of the strategies are already in motion and funded currently.<br />
Finally, as part of deliberations on future Operating <strong>Plan</strong>s, the <strong>College</strong> President and <strong>ECC</strong> senior<br />
leaders created a Chief <strong>Equity</strong>, Diversity, and Inclusion (“EDI”) Officer position. The budget for<br />
the position has been approved, a national search will be held in 2020 with the position starting<br />
in fiscal year 2021. This position will report to the <strong>College</strong> President and lead the development<br />
and implementation of proactive EDI initiatives in support of the <strong>College</strong>’s Strategic <strong>Plan</strong> to<br />
create a learning and working environment where all have an opportunity to succeed. Some of<br />
the responsibilities will include providing strategic leadership for developing and maintaining<br />
EDI policies and plans; partnering with campus leaders, faculty, students, staff, and internal and<br />
external constituencies to ensure programming supports the <strong>College</strong>’s values and strategic<br />
goals; establishing and overseeing an EDI taskforce that will guide institutional transformation,<br />
promotion, and implementation of related programs, projects, and initiatives; collaborating<br />
with Teaching, Learning and Student Development and CETL to support inclusive excellence in<br />
the curriculum and classroom through the implementation of pedagogy and scholarly activities<br />
supporting EDI. At present, we estimate a salary and benefits package of $150,000 and costs<br />
for related travel and materials.<br />
46<br />
<strong>ILEA</strong> <strong>Equity</strong> <strong>Plan</strong><br />
Budget
7. Timeline<br />
Much of 2019 has been spent identifying the gaps, understanding the contributing factors to<br />
those gaps, and identifying appropriate strategies to use in the <strong>ILEA</strong> <strong>Equity</strong> <strong>Plan</strong>. The selected<br />
strategies are all in different phases of development. Some were pilots already deployed that<br />
we will continue to evolve as we scale them up while others are well thought out ideas that<br />
require further development before anything is implemented. In 2020, each of the key parties<br />
will complete a project plan for their strategy. Just as with any of our other actions from the<br />
Operating <strong>Plan</strong>, updates using the same form in Section 5 Evaluation <strong>Plan</strong> will be completed<br />
twice a year to the <strong>ILEA</strong> team and up through to Cabinet.<br />
<strong>ILEA</strong> <strong>Equity</strong> <strong>Plan</strong> Implementation<br />
2020<br />
2021 - 2024 2025<br />
• Continue work<br />
already in progress<br />
• Further develop new<br />
strategies<br />
• Create strategy<br />
specific 5 year<br />
timelines<br />
• Collect and analyze<br />
data for each strategy<br />
• Implement all<br />
strategies<br />
• Institutionalize pilot<br />
projects<br />
• Collect and analyze<br />
data for each strategy<br />
and make necessary<br />
changes<br />
• Monitor interim<br />
targets<br />
• Report updates twice<br />
a year<br />
• Collect and analyze<br />
data for each strategy<br />
and make necessary<br />
changes<br />
• Monitor interim<br />
targets<br />
• Report updates twice<br />
a year<br />
• Close completion<br />
gaps<br />
For each strategy, a member of the <strong>ILEA</strong> team has been assigned to support the strategy and<br />
the strategy’s main contact.<br />
<strong>ILEA</strong> <strong>Plan</strong> Strategy <strong>ILEA</strong> Team Member Strategy Main Contact<br />
1: MAP - Mandatory Advising Program Gregory Robinson Peggy Gundrum<br />
2: OER - Open Educational Resources Peggy Heinrich Tim Moore<br />
3: Mentoring (TRIUMPH and Peer to Peer) Amybeth Maurer Erik Enders<br />
4: OLAS Expansion and Outreach Rodrigo Lopez Gaea Atta<br />
5: Complete to Compete Grant Philip Garber David Davin<br />
6: Holistic Case Management Model John Long John Long<br />
7: TIDE – Teaching/Learning, Inclusion,<br />
Diversity, and <strong>Equity</strong> group formation<br />
Deborah Orth<br />
Tyler Roeger and<br />
Susan Timm<br />
47<br />
<strong>ILEA</strong> <strong>Equity</strong> <strong>Plan</strong><br />
Timeline
<strong>ILEA</strong> Leadership Team<br />
David Sam, PhD, JD, LLM<br />
<strong>ILEA</strong> Core Team (in alphabetical order)<br />
Soma Chattopadhyay, PhD<br />
Philip Garber, PhD<br />
Peggy Heinrich, EdD<br />
John Long, MS<br />
Rodrigo Lopez, MPA<br />
Amybeth Maurer, MEd<br />
Deborah Orth, MA<br />
Gregory Robinson, PhD<br />
8. <strong>ILEA</strong> Team<br />
President<br />
Manuel Salgado Jr, PhD<br />
Tanya Ternes, MA<br />
Key Campus Groups Consulted for <strong>Equity</strong> <strong>Plan</strong> Development<br />
Administrative Team<br />
Faculty Senate<br />
Staff (SS<strong>ECC</strong>A)<br />
Deans Council<br />
Student Success Infrastructure<br />
Student Government Association<br />
President’s Cabinet<br />
Instructor of Engineering<br />
Vice President of <strong>Plan</strong>ning, Institutional<br />
Effectiveness, & Technology<br />
Vice President of Teaching, Learning, &<br />
Student Development<br />
Director of Student Success & Judicial Affairs<br />
Assistant Dean of School Partnerships<br />
Director of Orientation & Student Life<br />
Project Assessment Administrator<br />
Asst. Vice President of Student Services &<br />
Development / Dean of Students<br />
Professor of Psychology<br />
Director of Institutional Research<br />
48<br />
<strong>ILEA</strong> <strong>Equity</strong> <strong>Plan</strong><br />
<strong>ILEA</strong> Team
8. Glossary<br />
Cohort – A way of grouping students to compare across a number of access, performance,<br />
persistence, and completion indicators. In the Excel file that accompanies these documents<br />
and is used to set disaggregated early momentum and degree completion targets in service of<br />
eliminating gaps among target student groups, cohort refers to when students entered the<br />
college/university (e.g., Fall 2019 cohort is the student group that entered the institution in the<br />
fall of 2019). Secondarily, we also refer to the <strong>ILEA</strong> cohort as the group of 25 member colleges<br />
and universities.<br />
Completion Gap – The difference in college completion rates between student groups at the<br />
same college or university. <strong>ILEA</strong> is focused on the completion gap between African-American<br />
and White students, Latino/a, and White students, and low-income and higher income students<br />
(as indicated by Pell receipt).<br />
<strong>Equity</strong> – A campus culture and environment in which every student receives the supports<br />
they need to complete their degree equitably and in a timely manner when compared to<br />
their peer in other racial or socioeconomic groups. PCC is interested in supporting <strong>ILEA</strong> cohort<br />
members as they refine how they support African-American, Latino/a, and low-income students<br />
on their campuses. This can include redesigning existing supports, creating new supports and<br />
eliminating seen and unseen barriers for student success.<br />
<strong>Equity</strong> <strong>Plan</strong> – A roadmap that outlines how each <strong>ILEA</strong> cohort member plans to close gaps in<br />
degree attainment for low-income, African American, and Latino/a students. The <strong>ILEA</strong> <strong>Equity</strong><br />
<strong>Plan</strong> will describe how each cohort member plans to close gaps in degree attainment for the<br />
target student groups.<br />
Graduation Rate – The percentage of students that complete their degree. For students<br />
enrolled in community college, completing their degree in 2 years is 100% time and completing<br />
their degree in 3 years is 150% time. For students enrolled in a four-year institution, completing<br />
their degree in 4 years is 100% time and completing their degree in 6 years is 150% time. There<br />
are specific time to degree periods for analysis, goal setting, and reporting within the <strong>Equity</strong><br />
<strong>Plan</strong> for different target populations (e.g. entering freshmen, transfer students, part-time<br />
students.<br />
Illinois <strong>Equity</strong> in Attainment (<strong>ILEA</strong>) – A Partnership for <strong>College</strong> Completion (PCC) initiative that<br />
aims to close gaps in degree attainment among different racial and socioeconomic groups at<br />
25 two-year and four-year public and private non-profit colleges and universities in the state<br />
of Illinois. We aim to accomplish this goal by supporting, convening, and providing targeted<br />
resources, training, and support to the 25 <strong>ILEA</strong> cohort members, and facilitating the process of<br />
developing and executing on a campus-wide equity plan.<br />
49<br />
<strong>ILEA</strong> <strong>Equity</strong> <strong>Plan</strong><br />
Glossary
Lagging Indicator – A metric that represents the measurement of a specific output over time.<br />
For <strong>ILEA</strong>, an example of a lagging indicator is a graduation rate, by time to degree and particular<br />
student population. Graduation rates are our ultimate goal<br />
Leading Indicator – A metric that has evidence of being a predictor of a specific outcome. A<br />
leading indicator is often referred to as an early momentum indicator. We are interested in<br />
tracking a set of metrics that have evidence of predicting degree completion and measuring<br />
progress toward that goal. For community colleges, these metrics include: credits accumulated<br />
first fall, credits accumulated first year, gateway course completion, and fall 1 to fall 2<br />
persistence. For 4-year universities, these metrics include: credits accumulated first fall, credits<br />
accumulated first year, gateway course completion in year 1, fall 1 to fall 2 persistence, credits<br />
accumulated by end of second year, and fall 2 to fall 3 persistence.<br />
Institutional Strategy – A reform strategy that affects at least 50% of the total targeted<br />
student population that it aims to serve. For <strong>ILEA</strong>, we are interested in implementing<br />
institutional strategies we believe they have the requisite scale to significantly impact equity in<br />
degree completion.<br />
150% Time – Refers to students’ time to degree. 150% time refers to the percentage of<br />
students that complete their degree within three years for associate degree seekers and within<br />
six years for bachelor’s degree seekers.<br />
50<br />
<strong>ILEA</strong> <strong>Equity</strong> <strong>Plan</strong><br />
Glossary
9. Appendix<br />
Continued From 3C. Interim Benchmark Goals<br />
Leading Indicators<br />
Reporting<br />
Year<br />
Cohort<br />
African-<br />
American<br />
Students<br />
Latinx<br />
Students<br />
Part-time students<br />
White<br />
Students<br />
Pell<br />
Students<br />
Fall 1 to Fall 2 persistence<br />
Non-Pell<br />
Students<br />
African-<br />
American<br />
Students<br />
Latinx<br />
Students<br />
Full-time students<br />
White<br />
Students<br />
Pell<br />
Students<br />
Non-Pell<br />
Students<br />
2019 Fall 2018 (benchmark year) 38% 51% 39% 57% 40% 54% 73% 68% 72% 69%<br />
2020 Fall 2019 41% 52% 42% 57% 43% 57% 73% 69% 72% 70%<br />
2021 Fall 2020 44% 53% 45% 57% 46% 60% 73% 70% 72% 70%<br />
2022 Fall 2021 48% 54% 48% 57% 49% 64% 73% 71% 73% 71%<br />
2023 Fall 2022 51% 55% 51% 57% 51% 67% 73% 71% 73% 72%<br />
2024 Fall 2023 54% 56% 54% 57% 54% 70% 73% 72% 73% 72%<br />
2025 Fall 2024 57% 57% 57% 57% 57% 73% 73% 73% 73% 73%<br />
Fall 2024 (Target)<br />
57% 73%<br />
(2024 targets were set to highest benchmark year value from any of selected cohorts.<br />
The target-setting demographic group is highlighted in red)<br />
Reporting<br />
Year<br />
Cohort<br />
African-<br />
American<br />
Students<br />
Credits accumulated first fall<br />
Part-time students (at least 7) Full-time students (at least 15)<br />
Latinx<br />
Students<br />
White<br />
Students<br />
Pell<br />
Students<br />
Non-Pell<br />
Students<br />
African-<br />
American<br />
Students<br />
Latinx<br />
Students<br />
White<br />
Students<br />
Pell<br />
Students<br />
Non-Pell<br />
Students<br />
2019 Fall 2018 (benchmark year) 29% 37% 40% 50% 32% 6% 12% 16% 12% 15%<br />
2020 Fall 2019 33% 39% 42% 50% 35% 8% 13% 16% 13% 15%<br />
2021 Fall 2020 36% 41% 43% 50% 38% 9% 13% 16% 13% 15%<br />
2022 Fall 2021 40% 44% 45% 50% 41% 11% 14% 16% 14% 16%<br />
2023 Fall 2022 43% 46% 47% 50% 44% 13% 15% 16% 15% 16%<br />
2024 Fall 2023 47% 48% 48% 50% 47% 14% 15% 16% 15% 16%<br />
2025 Fall 2024 50% 50% 50% 50% 50% 16% 16% 16% 16% 16%<br />
Fall 2024 (Target)<br />
50% 16%<br />
(2024 targets were set to highest benchmark year value from any of selected cohorts.<br />
The target-setting demographic group is highlighted in red)<br />
Reporting<br />
Year<br />
Cohort<br />
African-<br />
American<br />
Students<br />
Credits accumulated first year<br />
Part-time students (at least 15) Full-time students (at least 30)<br />
Latinx<br />
Students<br />
White<br />
Students<br />
Pell<br />
Students<br />
Non-Pell<br />
Students<br />
African-<br />
American<br />
Students<br />
Latinx<br />
Students<br />
White<br />
Students<br />
Pell<br />
Students<br />
Non-Pell<br />
Students<br />
2019 Fall 2018 (benchmark year) 23% 26% 32% 39% 25% 0% 5% 9% 7% 8%<br />
2020 Fall 2019 26% 28% 33% 39% 27% 2% 6% 9% 7% 8%<br />
2021 Fall 2020 28% 30% 34% 39% 30% 3% 6% 9% 8% 8%<br />
2022 Fall 2021 31% 33% 36% 39% 32% 5% 7% 9% 8% 9%<br />
2023 Fall 2022 34% 35% 37% 39% 34% 6% 8% 9% 8% 9%<br />
2024 Fall 2023 36% 37% 38% 39% 37% 8% 8% 9% 9% 9%<br />
2025 Fall 2024 39% 39% 39% 39% 39% 9% 9% 9% 9% 9%<br />
Fall 2024 (Target)<br />
39% 9%<br />
(2024 targets were set to highest benchmark year value from any of selected cohorts.<br />
The target-setting demographic group is highlighted in red)<br />
51<br />
<strong>ILEA</strong> <strong>Equity</strong> <strong>Plan</strong><br />
Appendix
Reporting<br />
Year<br />
Cohort<br />
African-<br />
American<br />
Students<br />
Latinx<br />
Students<br />
English<br />
White<br />
Students<br />
Pell<br />
Students<br />
Gateway course completion<br />
Non-Pell<br />
Students<br />
African-<br />
American<br />
Students<br />
Latinx<br />
Students<br />
White<br />
Students<br />
Pell<br />
Students<br />
Non-Pell<br />
Students<br />
2019 Fall 2018 (benchmark year) 36% 48% 60% 53% 53% 17% 31% 40% 32% 38%<br />
2020 Fall 2019 40% 50% 60% 54% 54% 21% 33% 40% 33% 38%<br />
2021 Fall 2020 44% 52% 60% 55% 55% 25% 34% 40% 35% 39%<br />
2022 Fall 2021 48% 54% 60% 57% 57% 29% 36% 40% 36% 39%<br />
2023 Fall 2022 52% 56% 60% 58% 58% 32% 37% 40% 37% 39%<br />
2024 Fall 2023 56% 58% 60% 59% 59% 36% 39% 40% 39% 40%<br />
2025 Fall 2024 60% 60% 60% 60% 60% 40% 40% 40% 40% 40%<br />
Fall 2024 (Target)<br />
60% 40%<br />
(2024 targets were set to highest benchmark year value from any of selected cohorts.<br />
The target-setting demographic group is highlighted in red)<br />
Math<br />
Completion Metrics<br />
Reporting<br />
Year<br />
Cohort<br />
African-<br />
American<br />
Students<br />
Part-Time Students<br />
Latinx<br />
Students<br />
White<br />
Students<br />
Pell<br />
Students<br />
Degree in 2 years<br />
Non-Pell<br />
Students<br />
African-<br />
American<br />
Students<br />
Full-time students<br />
Latinx<br />
Students<br />
White<br />
Students<br />
Pell<br />
Students<br />
Non-Pell<br />
Students<br />
Fall 2017 (benchmark cohort) 0% 1% 3% 1% 2% 3% 7% 14% 7% 13%<br />
2020 Fall 2018 1% 1% 3% 1% 2% 5% 8% 14% 8% 13%<br />
2021 Fall 2019 1% 2% 3% 2% 2% 7% 9% 14% 9% 13%<br />
2022 Fall 2020 2% 2% 3% 2% 3% 9% 11% 14% 11% 14%<br />
2023 Fall 2021 2% 2% 3% 2% 3% 10% 12% 14% 12% 14%<br />
2024 Fall 2022 3% 3% 3% 3% 3% 12% 13% 14% 13% 14%<br />
2025 Fall 2023 3% 3% 3% 3% 3% 14% 14% 14% 14% 14%<br />
Fall 2023 (Target)<br />
3% 14%<br />
(2023 targets were set to highest benchmark year value from any of selected cohorts.<br />
The target-setting demographic group is highlighted in red)<br />
Reporting<br />
Year<br />
Cohort<br />
African-<br />
American<br />
Students<br />
Part-time students<br />
Latinx<br />
Students<br />
White<br />
Students<br />
Pell<br />
Students<br />
Degree in 3 years<br />
Non-Pell<br />
Students<br />
African-<br />
American<br />
Students<br />
Full-time students<br />
Latinx<br />
Students<br />
White<br />
Students<br />
Pell<br />
Students<br />
Non-Pell<br />
Students<br />
Fall 2016 (benchmark cohort) 13% 15% 17% 24% 12% 31% 26% 34% 29% 32%<br />
2020 Fall 2017 15% 17% 18% 24% 14% 32% 27% 34% 30% 32%<br />
2021 Fall 2018 17% 18% 19% 24% 16% 32% 29% 34% 31% 33%<br />
2022 Fall 2019 19% 20% 21% 24% 18% 33% 30% 34% 32% 33%<br />
2023 Fall 2020 20% 21% 22% 24% 20% 33% 31% 34% 32% 33%<br />
2024 Fall 2021 22% 23% 23% 24% 22% 34% 33% 34% 33% 34%<br />
2025 Fall 2022 24% 24% 24% 24% 24% 34% 34% 34% 34% 34%<br />
Fall 2022 (Target)<br />
24% 34%<br />
(2022 targets were set to highest benchmark year value from any of selected cohorts.<br />
The target-setting demographic group is highlighted in red)<br />
52<br />
<strong>ILEA</strong> <strong>Equity</strong> <strong>Plan</strong><br />
Appendix
Reporting<br />
Year<br />
Cohort<br />
African-<br />
American<br />
Students<br />
Degree in 4 years<br />
Part-time students<br />
Latinx<br />
Students<br />
White<br />
Students<br />
Pell<br />
Students<br />
Non-Pell<br />
Students<br />
Fall 2015 (benchmark cohort) 5% 21% 20% 20% 19%<br />
2020 Fall 2016 8% 21% 20% 20% 19%<br />
2021 Fall 2017 10% 21% 20% 20% 20%<br />
2022 Fall 2018 13% 21% 21% 21% 20%<br />
2023 Fall 2019 16% 21% 21% 21% 20%<br />
2024 Fall 2020 18% 21% 21% 21% 21%<br />
2025 Fall 2021 21% 21% 21% 21% 21%<br />
Fall 2021 (Target)<br />
21%<br />
(2021 targets were set to highest benchmark year value from any of selected cohorts.<br />
The target-setting demographic group is highlighted in red)<br />
53<br />
<strong>ILEA</strong> <strong>Equity</strong> <strong>Plan</strong><br />
Appendix
10. Works Cited<br />
Article 26 of the United Nations’ Universal Declaration of Human Rights<br />
https://www.un.org/en/universal-declaration-human-rights/<br />
Colvard, N. B., Watson, C. E., & Park, H. (2018). The Impact of Open Educational Resources on<br />
Various Student Success Metrics. International Journal of Teaching and Learning in Higher<br />
Education, Volume 30, Number 2, pp. 262 – 276. http://www.isetl.org/ijtlhe/ISSN 1812-9129<br />
Goldston, Cora (September 19, 2017).<br />
https://ies.ed.gov/ncee/edlabs/regions/midwest/blogs/culturally-responsive-instruction-bestpractices.aspx<br />
Hilton III, J. L., Fischer, L., Wiley, D., & William, L. (2016). Maintaining Momentum Toward<br />
Graduation: OER and the Course Throughput Rate. The International Review of Research in<br />
Open and Distributed Learning, 17 (6). https://doi.org/10.19173/irrodl.v17i6.2686<br />
Klepfer, K. & Hull, J. (2012). High school rigor and good advice: Setting students up to succeed.<br />
Center for Public Education (National School Boards Association).<br />
http://www.centerforpubliceducation.org/MainMenu/Staffingstudents/High-school-rigor-andgood-advice-Setting-up-students-to-succeed<br />
Krasnoff, Basha. (2016). Culturally Responsive Teaching: A Guide to Evidence-Based Practices<br />
for Teaching All Students Equitably<br />
https://educationnorthwest.org/sites/default/files/resources/culturally-responsiveteaching.pdf<br />
Ladson-Billings, G. (1994). The dreamkeepers: Successful teachers of African American children.<br />
San Francisco, Calif.: Jossey-Bass Publishers.<br />
Solózarno, D., Ceja, M., & Yosso, T. (2000). Critical race theory, racial microaggressions, and<br />
campus racial climate: The experiences of African American college students. The Journal of<br />
Negro Education, 69(1/2), 60 - 73.<br />
UNESCO. (2002). Forum on the impact of open courseware for higher education in developing<br />
countries: Final report. Retrieved from http://unesdoc.unesco.org/images/0012/001285/12<br />
8515e.pdf<br />
Watson, C. E., & Colvard, N. B. (2018). Open educational resources (OERs): Another high impact<br />
practice? Paper presented at the annual meeting of the Association of American <strong>College</strong>s and<br />
Universities, Washington, DC.<br />
54<br />
<strong>ILEA</strong> <strong>Equity</strong> <strong>Plan</strong><br />
Works Cited