

Jahresbericht 08 - PMOD/WRC
Jahresbericht 08 - PMOD/WRC
Jahresbericht 08 - PMOD/WRC

Create successful ePaper yourself
Turn your PDF publications into a flip-book with our unique Google optimized e-Paper software.
Scientific Research Activities 23<br />
Modeling Changes in Global Ozone and Atmospheric Dynamics in the 21st Century<br />
with the Chemistry-Climate Model SOCOL<br />
Eugene Rozanov, Tatiana Egorova, and Werner Schmutz<br />
in collaboration with Vladimir Zubov and Igor Karol (MGO, Russia)<br />
Our previous simulations of the future total ozone evolution<br />
showed that total ozone in the second half of the<br />
21st century tends to exceed the pre-ozone hole values.<br />
To elucidate the causes of this super-recovery we<br />
have carried out a series of time-slice runs and showed<br />
that the additional increase in total ozone results from<br />
the acceleration of the meridional circulation due to<br />
enhanced tropospheric wave forcing.<br />
The <strong>PMOD</strong>/<strong>WRC</strong> and the Main Geophysical Observatory<br />
(Russia) have been partners in the SCOPES Joint Research<br />
Project titled “Modeling of the global ozone and climate<br />
evolution in the first half of the XXI century” from 2005 to<br />
20<strong>08</strong>. To elucidate the causes of the so-called total ozone<br />
super recovery we have performed three time-slice numerical<br />
experiments with the chemistry-climate model<br />
SOCOL for the years 2000, 2050 and 2100. Sea surface<br />
temperature, sea ice, concentrations of greenhouse gases<br />
and ozone depleting substances (ODS) were taken from<br />
the IPCC scenario A1B and WMO scenario Ab and used as<br />
the boundary conditions for these experiments consisted of<br />
the 10-year spin-up runs and the two-year five members<br />
ensemble runs with the slightly different initial conditions.<br />
This ensemble approach was necessary to estimate the<br />
statistical significance of the changes in the total ozone and<br />
other considered quantities. Analysis of the results of the<br />
model experiments revealed cooling the model stratosphere<br />
by about 5 K from 2000 to 2050 and by about 10 K<br />
from 2000 to 2100 years. The simulated temperature of<br />
the lower atmosphere increases by about 2.5 K in 2100.<br />
Tropospheric heating causes the growth of the planetary<br />
wave activity at the tropopause level leading to the increase<br />
of the Eliassen-Palm flux divergence in the middle and<br />
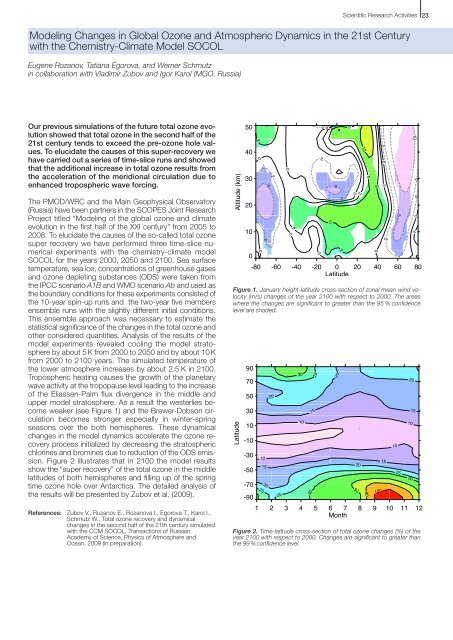
upper model stratosphere. As a result the westerlies become<br />
weaker (see Figure 1) and the Brewer-Dobson circulation<br />
becomes stronger especially in winter-spring<br />
seasons over the both hemispheres. These dynamical<br />
changes in the model dynamics accelerate the ozone recovery<br />
process initialized by decreasing the stratospheric<br />
chlorines and bromines due to reduction of the ODS emission.<br />
Figure 2 illustrates that in 2100 the model results<br />
show the “super recovery” of the total ozone in the middle<br />
latitudes of both hemispheres and filling up of the spring<br />
time ozone hole over Antarctica. The detailed analysis of<br />
the results will be presented by Zubov et al. (2009).<br />
References: Zubov V., Rozanov E., Rozanova I., Egorova T., Karol I.,<br />
Schmutz W., Total ozone recovery and dynamical<br />
changes in the second half of the 21th century simulated<br />
with the CCM SOCOL, Transactions of Russian<br />
Academy of Science, Physics of Atmosphere and<br />
Ocean, 2009 (in preparation).<br />
Altitude (km)<br />
50<br />
40<br />
30<br />
20<br />
10<br />
-5<br />
0<br />
-80 -60 -40 -20 0<br />
Latitude<br />
20 40 60 80<br />
Figure 1. January height-latitude cross-section of zonal mean wind velocity<br />
(m/s) changes of the year 2100 with respect to 2000. The areas<br />
where the changes are significant to greater than the 95 % confidence<br />
level are shaded.<br />
Latitude<br />
90<br />
70<br />
50<br />
30<br />
10<br />
-10<br />
-30<br />
-50<br />
-70<br />
2<br />
0<br />
0<br />
-2<br />
10<br />
25<br />
15<br />
20<br />
-2<br />
20<br />
0<br />
0<br />
2<br />
0<br />
-2<br />
-2<br />
0<br />
Figure 2. Time-latitude cross-section of total ozone changes (%) of the<br />
year 2100 with respect to 2000. Changes are significant to greater than<br />
the 99 % confidence level.<br />
2<br />
5<br />
-5<br />
-90<br />
1 2 3 4 5 6 7 8 9 10 11 12<br />
Month<br />
25<br />
30<br />
10<br />
30<br />
25<br />
15<br />
20<br />
2<br />
-2<br />
5<br />
0<br />
50<br />
2<br />
20<br />
10<br />
80<br />
5<br />
5<br />
0<br />
-2<br />
0<br />
2<br />
120<br />
-2<br />
15<br />
10<br />
-5<br />
25<br />
10<br />
-10-5<br />
-2<br />
0<br />
2<br />
20<br />
30<br />
15


