Working Group 3.2 Forest soil processes and change
Working Group 3.2 Forest soil processes and change
Working Group 3.2 Forest soil processes and change

Create successful ePaper yourself
Turn your PDF publications into a flip-book with our unique Google optimized e-Paper software.
19th World Congress of Soil Science<br />
<strong>Working</strong> <strong>Group</strong> <strong>3.2</strong><br />
<strong>Forest</strong> <strong>soil</strong> <strong>processes</strong> <strong>and</strong> <strong>change</strong><br />
Soil Solutions for a Changing World,<br />
Brisbane, Australia<br />
1 – 6 August 2010
Table of Contents<br />
Page<br />
Table of Contents ii<br />
1 A Network of Experimental <strong>Forest</strong>s <strong>and</strong> Ranges: Providing Soil<br />
Solutions for a Changing World<br />
2 A simple method for the determination of nitrate in potassium<br />
chloride extracts from forest <strong>soil</strong>s<br />
3 An equation for yield prediction for Pinus Taeda l. as a function<br />
of <strong>soil</strong> properties<br />
4 Changes forest <strong>soil</strong>s under human factors (Komi Republic,<br />
Russia)<br />
5 Changes in <strong>soil</strong> chemistry following a watershed-scale<br />
application of wollastonite (CaSiO3) at Hubbard Brook, New<br />
Hampshire, USA<br />
6 Changes in <strong>soil</strong> chemistry in the surroundings of wood ant<br />
(Formica polyctena) nests<br />
7 Comparison of <strong>soil</strong> microbial biomass C, N <strong>and</strong> P between<br />
natural secondary forests <strong>and</strong> Larix olgensis plantations under<br />
temperate climate<br />
8 Comparison of Soil Water Repellency <strong>and</strong> Sorptivity between an<br />
Acacia caven (Highly-Perturbed) <strong>and</strong> Cryptocarya alba<br />
(Slightly-Perturbed) Dominated Ecosystem<br />
9 Current organic carbon stock in top<strong>soil</strong> of forest l<strong>and</strong> in Japan 30<br />
10 Determinants of <strong>soil</strong> organic matter chemistry in maritime<br />
temperate forest ecosystems<br />
11 Development of <strong>soil</strong> quality indices for natural forest habitats of<br />
lowl<strong>and</strong>s <strong>and</strong> upl<strong>and</strong>s in Pol<strong>and</strong> <strong>and</strong> its application in silviculture<br />
– project description<br />
12 Effect of manganese concentration on beech leaf litter<br />
decomposition: results from field <strong>and</strong> laboratory experiments<br />
13 Effects of balanced fertilization on bamboo's quality 44<br />
14 Effects of ecological succession on chemical characteristics of<br />
humic <strong>and</strong> fulvic acids in a Japanese volcanic ash <strong>soil</strong>.<br />
15 Effects of plantation forest species on <strong>soil</strong> properties 49<br />
16 Estimation of annual <strong>soil</strong> respiration rate in a larch forest in<br />
Central Siberia<br />
17 Evaluation of growth of paricá (Schizolobium amazonicum<br />
Huber (Duck)) in differents agroforestry systems in northeast of<br />
Pará, Brazil.<br />
1<br />
4<br />
8<br />
12<br />
16<br />
19<br />
22<br />
26<br />
33<br />
37<br />
40<br />
46<br />
52<br />
56<br />
ii
Table of Contents (Cont.)<br />
18 How an advanced combination of <strong>soil</strong> science, biogeochemistry,<br />
<strong>and</strong> paleo-ecology helps Ecuadorian cloud forest management<br />
Page<br />
19 Impact of forest <strong>soil</strong> compaction on <strong>soil</strong> atmosphere composition 63<br />
20 Impact of tree species on the distribution of amorphous silica in<br />
an acid brown <strong>soil</strong><br />
21 Impacts of nitrogen additions <strong>and</strong> harvest residue management<br />
on chemical composition of <strong>soil</strong> carbon in a plantation forest<br />
22 Lignin phenols <strong>and</strong> cutin- <strong>and</strong> suberin-derived aliphatic<br />
monomers as biomarkers for st<strong>and</strong> history, SOM source, <strong>and</strong><br />
turnover<br />
23 Long-term <strong>change</strong>s in a forested Spodosol 78<br />
24 Micromorphological <strong>and</strong> Chemical Characteristics of Placic <strong>and</strong><br />
Ortstein Horizons in Subtropical Subalpine <strong>Forest</strong>s<br />
25 Mine Soil Suitability for Native <strong>Forest</strong>s in the USA 86<br />
26 Monitoring scheme for examine carbon–water coupling in a<br />
forested watershed<br />
27 Nutrient release from Eucalyptus gr<strong>and</strong>is <strong>and</strong> Pinus taeda<br />
harvest residues<br />
28 Short-term Effects of Litter Extraction on Soil Respiration, Soil<br />
Temperature <strong>and</strong> Soil Water Content in a Sclerophyll <strong>Forest</strong> of<br />
Central Chile<br />
29 Soil carbon stocks estimation with reference to the degree of<br />
volcanic ash additions in Japanese forest <strong>soil</strong>s<br />
30 Soil Nutrients, Aboveground Productivity <strong>and</strong> Vegetative<br />
Diversity After 10 Years of Experimental Acidification <strong>and</strong> Base<br />
Cation Depletion<br />
31 Spatiotemporal distribution pattern of <strong>soil</strong> temperature in forest<br />
gap in Pinus koraiensis-dominated broadleaved mixed forest in<br />
Xiao Xing’an Mountains, China<br />
32 Substrates Used In SIR Assays Can Inhibit Basal Respiration In<br />
Rewetted Soil<br />
33 The effect of warming on the CO2 emissions of young <strong>and</strong> old<br />
organic <strong>soil</strong> from a Sitka spruce plantation.<br />
34 The effect of wood ants (Formica s. str.) on <strong>soil</strong> chemical <strong>and</strong><br />
microbiological properties<br />
35 Tree nutrition <strong>and</strong> chemical properties of a s<strong>and</strong>y <strong>soil</strong> in a pine<br />
plantation receiving repeated biosolids applications<br />
59<br />
67<br />
70<br />
74<br />
82<br />
90<br />
94<br />
98<br />
102<br />
104<br />
107<br />
111<br />
115<br />
119<br />
123<br />
iii
Table of Contents (Cont.)<br />
36 Using the multivariate data set of SOM quality to assess the<br />
management induced <strong>change</strong>s in forest <strong>soil</strong>s<br />
37 Effects of nitrogen addition on fluxes <strong>and</strong> concentrations of<br />
dissolved organic matter <strong>and</strong> inorganic nitrogen under a<br />
temperate old-growth forest in northeast China<br />
Page<br />
38 Planning the forest roads in reforestation - cases in south Brazil 135<br />
39 Quantified <strong>soil</strong> dynamics <strong>and</strong> spatial fragmentation within the<br />
shifting agricultural l<strong>and</strong>scape in southern Cameroon<br />
40 Soil fertility of Pinus taeda L. areas with low growth rates in<br />
Jaguaria �va – Paran� State, Brazil<br />
127<br />
131<br />
138<br />
142<br />
iv
A network of experimental forests <strong>and</strong> ranges: Providing <strong>soil</strong> solutions for a<br />
changing world<br />
Mary Beth Adams<br />
USDA <strong>Forest</strong> Service, Timber <strong>and</strong> Watershed Laboratory, Parsons, WV 26287, USA, Email mbadams@fs.fed.us<br />
Abstract<br />
The network of experimental forests <strong>and</strong> ranges of the USDA <strong>Forest</strong> Service represents significant<br />
opportunities to provide <strong>soil</strong> solutions to critical issues of a changing world. This network of 81<br />
experimental forests <strong>and</strong> ranges encompasses broad geographic, biological, climatic <strong>and</strong> physical scales, <strong>and</strong><br />
includes long-term data sets, <strong>and</strong> long-term experimental manipulations. Examples of knowledge gained<br />
from individual experimental forests <strong>and</strong> ranges, <strong>and</strong> from cross-site studies of these valuable research sites<br />
are provided herein.<br />
Key Words<br />
Research networks, experimental forests, long-term research.<br />
Introduction<br />
The Experimental <strong>Forest</strong>s <strong>and</strong> Ranges (EFRs) of the <strong>Forest</strong> Service, U.S. Department of Agriculture, were<br />
established to represent major forest vegetation types of the United States, to help provide science-based<br />
answers for management of the nation’s forests <strong>and</strong> ranges, <strong>and</strong> to serve as “outdoor classrooms” to educate<br />
l<strong>and</strong> managers <strong>and</strong> the public. The first Experimental <strong>Forest</strong>, Fort Valley Experimental <strong>Forest</strong> in Arizona,<br />
was established in 1908. Data collected from EFRs during the last 100 years can be used to address regional<br />
<strong>and</strong> continental scale questions about forest <strong>and</strong> range management, key forest ecosystem <strong>processes</strong>, wildlife<br />
habitat requirements, watershed management, <strong>and</strong> other topics, including <strong>soil</strong> <strong>processes</strong>. Research from the<br />
network of 81 Experimental <strong>Forest</strong>s <strong>and</strong> Ranges can also address critical questions related to <strong>soil</strong><br />
productivity, carbon storage, protection of water quality, remediation of pollution, <strong>and</strong> help provide <strong>soil</strong>based<br />
solutions for our changing world.<br />
Why this network?<br />
The network of EFRs spans broad geographic <strong>and</strong> environmental ranges, from the tropical forests of St.<br />
Croix in the US Virgin Isl<strong>and</strong>s <strong>and</strong> Hawaii to boreal forests in Alaska (Figure 1) (Adams et al. 2008). The<br />
elevation of these research properties ranges from 30 meters (m) (Silas Little Experimental <strong>Forest</strong> in New<br />
Jersey) to 3500 m in the alpine Glacier Lakes Ecosystem Experiments Site (GLEES) in Wyoming. The EFRs<br />
occur in 26 provinces or ecoregions defined by Bailey (1995), representing more than 55% of the area of the<br />
continental U.S. The coterminous United States has 38 Holdridge life zones (Lugo et al. 1999), of which at<br />
least 14 contain experimental forests or ranges. The network also includes six subtropical life zones in the<br />
Caribbean, 5 tropical life zones in Hawaii <strong>and</strong> several boreal zones in Alaska. Sites in the EFR network<br />
represent 11 of the 12 <strong>soil</strong> Orders in the U.S. Soil Taxonomy System (Table 1, Soil Survey Staff 2006), <strong>and</strong><br />
most parent materials from volcanics to alluvial materials to solid rock to organics <strong>and</strong> glacial materials. This<br />
broad geographic spread, covering nearly 50 degrees of latitude, results in the network reflecting a great<br />
range of temperature, precipitation, <strong>and</strong> vegetation conditions (Lugo et al. 2006). There are even<br />
experimental forests located within or near large urban areas (Baltimore Ecosystem Study, Maryl<strong>and</strong>, <strong>and</strong><br />
San Dimas Experimental <strong>Forest</strong>, California) addressing questions of urban ecosystem structure <strong>and</strong> function<br />
<strong>and</strong> the wildl<strong>and</strong>/urban interface.<br />
The network of EFRs also includes sites with extensive long-term data sets on climate, vegetation, <strong>and</strong><br />
hydrology. Hydrological <strong>and</strong> meteorological data have been collected at most experimental watersheds for<br />
decades, in some cases for as long as 70 years, <strong>and</strong> are now easily accessed through a web-based data<br />
harvester system (www.fsl.orst.edu/climhy/hydrodb/). Long-term <strong>soil</strong> data are not as common, but examples<br />
do exist of important contributions to underst<strong>and</strong>ing long-term <strong>soil</strong> <strong>processes</strong>, such as the Calhoun<br />
Experimental <strong>Forest</strong> in South Carolina. There, long-term observational <strong>and</strong> experimental studies of <strong>soil</strong><br />
<strong>processes</strong> have examined <strong>soil</strong> <strong>change</strong> at multiple time scales, from the decadal to millennial.<br />
© 2010 19 th World Congress of Soil Science, Soil Solutions for a Changing World<br />
1 – 6 August 2010, Brisbane, Australia. Published on DVD.<br />
1
Table 1. Soil Orders represented within the USDA <strong>Forest</strong> Service Network of Experimental <strong>Forest</strong>s <strong>and</strong> Ranges.<br />
Alfisols<br />
Andisols<br />
Aridisols<br />
Entisols<br />
Gelisols<br />
Histosols<br />
Inceptisols<br />
Mollisols<br />
Oxisols<br />
Spodosols<br />
Ultisols<br />
The work is particularly noteworthy for documenting <strong>soil</strong> recovery <strong>processes</strong> following ab<strong>and</strong>onment after<br />
protracted agriculture for cotton (Gossypium hirsutum) <strong>and</strong> associated accelerated <strong>soil</strong> erosion, followed by<br />
planting to loblolly pine (Pinus taeda) (Richter <strong>and</strong> Markewitz 2001).<br />
Many EFRs also are sites for long-term manipulative research, which help us to underst<strong>and</strong> the effects of<br />
various disturbances on ecosystem <strong>processes</strong> <strong>and</strong> components over longer temporal scales. For example, a<br />
long-term study of the effects of silvicultural practices on Appalachian hardwood forest composition <strong>and</strong><br />
growth on the Fernow Experimental <strong>Forest</strong> (West Virginia) was recently used by Davis et al. (2009) to<br />
compare carbon storage resulting from these different cutting practices over a 55-year-period. Many of the<br />
Experimental <strong>Forest</strong>s have similar research studies evaluating silvicultural treatments over multiple decades<br />
which could be used to address these questions on regional to national scales. The long-term silvicultural <strong>and</strong><br />
fire ecology study sites on the Escambia Experimental <strong>Forest</strong> (Alabama) have provided “living laboratories”<br />
available to university <strong>and</strong> agency researchers working to unravel the interconnecting <strong>processes</strong> essential to<br />
restoring the once-extensive longleaf pine (Pinus palustris) forest ecosystem.<br />
Because EFRs are dedicated to long-term research, they provide an excellent opportunity to underst<strong>and</strong><br />
ecosystem <strong>processes</strong> over many decades. For example, research at Hubbard Brook Experimental <strong>Forest</strong><br />
(New Hampshire) was instrumental in documenting acidic deposition <strong>and</strong> its effects on <strong>soil</strong> <strong>and</strong> water<br />
chemistry in north America. Data from more than 50 years of research on the Marcell Experimental <strong>Forest</strong><br />
in Minnesota has been used to underst<strong>and</strong> peatl<strong>and</strong> functions in northern ecosystems, develop peatl<strong>and</strong><br />
hydrologic models, <strong>and</strong> develop research <strong>and</strong> monitoring programs that have later exp<strong>and</strong>ed nationally <strong>and</strong><br />
internationally.<br />
Opportunities Associated with EFRs<br />
Finally, there are opportunities associated with the network of EFRs. These arise from the ability to link<br />
studies from different ecoregions, <strong>soil</strong> or vegetation types to study l<strong>and</strong>scape scale <strong>processes</strong> <strong>and</strong> questions.<br />
For example, as part of studies of carbon dynamics under the USDA Global Climate Change Program,<br />
scientists are linking intensive ground-based measurements of carbon stocks, forest growth, <strong>and</strong> climate from<br />
experimental forests with spatially extensive but coarse resolution measurements. Through this work,<br />
scientists at the Bartlett Experimental <strong>Forest</strong> in New Hampshire, the Marcell Experimental <strong>Forest</strong> in<br />
Minnesota, the Fraser Experimental <strong>Forest</strong> in Colorado, <strong>and</strong> GLEES are linking l<strong>and</strong>scape monitoring to<br />
carbon management at a scale relevant to local l<strong>and</strong> management decisions.<br />
The opportunity also exists for studying impacts of human activities by using manipulative experiments at a<br />
variety of sites, or to conduct experiments with similar treatments at several EFRs. Because EFRs are set<br />
aside for manipulative research, these experiments are protected for the long term – much longer than is<br />
generally possible in an academic setting. Opportunities exist to address important issues relative to<br />
challenges of managing forests <strong>and</strong> ranges in a changing world, using long-term data available from EFRs.<br />
For example, at Priest River Experimental <strong>Forest</strong> in Idaho, daily weather records dating back to 1911 have<br />
been used in large-scale models to predict continental scale vegetation <strong>change</strong>s resulting from climate<br />
<strong>change</strong>.<br />
Finally, the <strong>Forest</strong> Service network of EFRs is linked with other research <strong>and</strong> monitoring networks, further<br />
increasing the information available, <strong>and</strong> the opportunities for synergistic research efforts. These networks<br />
© 2010 19 th World Congress of Soil Science, Soil Solutions for a Changing World<br />
1 – 6 August 2010, Brisbane, Australia. Published on DVD.<br />
2
include the National Atmospheric Deposition program, the Long-Term Ecological Research (LTER) network<br />
<strong>and</strong> National Ecological Observatory Network (NEON) of the National Science Foundation, <strong>and</strong> the Long-<br />
Term Soil Productivity study, to name only a few. The <strong>Forest</strong> Service EFRs also are part of a larger USDA<br />
association of long-term research sites, particularly suited to addressing issues of a changing world (Moran et<br />
al. 2008).<br />
References<br />
Adams MB, Loughry L, Plaugher L Eds. (2008) Experimental <strong>Forest</strong>s <strong>and</strong> Ranges of the USDA <strong>Forest</strong><br />
Service. General Technical Report NE-321 (Revised) [CD-ROM] (USDA <strong>Forest</strong> Service, Northern<br />
Research Station Newtown Square, PA).<br />
Bailey RG (1995) Description of the ecoregions of the United States. 2nd ed. rev. <strong>and</strong> exp<strong>and</strong>ed Misc. Pub.<br />
No. 1391 (rev.) (USDA <strong>Forest</strong> Service, Washington, DC).<br />
Davis SC, Hessl AE, Scott CJ, Adams MB, Thomas RB (2009) <strong>Forest</strong> carbon sequestration <strong>change</strong>s in<br />
response to timber harvest. <strong>Forest</strong> Ecology <strong>and</strong> Management 258(9), 2101-2109.<br />
Lugo AE, Swanson FJ, Gonzalez OR, et al. (2006) Long-term research at the USDA <strong>Forest</strong><br />
Service’s Experimental <strong>Forest</strong>s <strong>and</strong> Ranges. Bioscience 56(1), 39-48.<br />
Lugo AE, Brown SL, Dodson R, Smith TS, Shugart HH (1999) The Holdridge life zones of the<br />
conterminous United States in relation to ecosystem mapping. Journal of Biogeography 26, 1025-<br />
1038.<br />
Moran MS, Peters DPC, McClaran MP, Nichols MH, Adams MB (2008) Long-term data collection at USDA<br />
experimental sites for studies of ecohydrology. Ecohydrology 1(4), 377-393.<br />
Richter DD Jr, Markewitz D (2001) Underst<strong>and</strong>ing Soil Change. (Cambridge University Press. Cambridge,<br />
UK).<br />
Soil Survey Staff (2006) Keys to Soil Taxonomy, 10th ed. (USDA-Natural Resources Conservation Service,<br />
Washington, DC).<br />
© 2010 19 th World Congress of Soil Science, Soil Solutions for a Changing World<br />
1 – 6 August 2010, Brisbane, Australia. Published on DVD.<br />
3
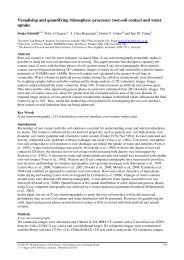
A simple method for the determination of nitrate in potassium chloride extracts<br />
from forest <strong>soil</strong>s<br />
Shinji Kaneko A , Masahiro Inagaki A <strong>and</strong> Tomoaki Morishita A<br />
A Department of <strong>Forest</strong> Site Environment, <strong>Forest</strong>ry <strong>Forest</strong> Products Research Institute, 1 Matsunosato, Tsukuba, Ibaraki, Japan, Email<br />
kanekos@affrc.go.jp<br />
Abstract<br />
We developed a simple method to determine NO3 - -N in KCl extracts from forest <strong>soil</strong>s. The measurement<br />
principle of the method is based on the difference of the spectral adsorption properties between dissolved<br />
organic carbon (DOC) <strong>and</strong> nitrate. In this method, NO3 - -N concentration was obtained by measuring the<br />
absorbance of KCl extracts at 220nm <strong>and</strong> 260nm wavelengths. We term this method as the UV method. We<br />
measured NO3 - -N concentration of fifty six KCl extracts from six forest <strong>soil</strong>s in central <strong>and</strong> western Japan by<br />
using the UV method. The results were highly correlated to those by the automated Cd reduction method. It<br />
suggests that the UV method is a reliable method to determine NO3 - -N in KCl extracts. It is the most simple<br />
procedure to determine NO3 - -N in KCl extracts from forest <strong>soil</strong>s.<br />
Key Words<br />
Nitrate, rapid determination, forest <strong>soil</strong>s, available nitrogen, nitrogen mineralization.<br />
Introduction<br />
Nitrogen is a most important nutrient for higher plants, so available nitrogen <strong>and</strong> nitrogen mineralization<br />
potential of <strong>soil</strong>s are indicators for <strong>soil</strong> fertility. This nitrogen is evaluated by the amounts of NH4 + -N <strong>and</strong><br />
NO3 - -N that are extracted with KCl solution from <strong>soil</strong>s. For determining NO3 - -N, expensive equipments or<br />
time consuming methods such as flow injection (automated Cd reduction methods) <strong>and</strong> Kjeldahl<br />
determination method are needed. So, several rapid methods have been devised for NO3 - -N determination<br />
(Cataldo et al. 1975; Kanno et al.1968; Norman <strong>and</strong> Stucki 1981; Sakata 2000; Yang et al. 1998). Yang et<br />
al. (1998) developed a simple method by applying the salicylate method (Cataldo et al. 1975;Kanno et<br />
al.1968). This method is very simple but it needs some steps such as reagent adding <strong>and</strong> heating.<br />
The aim of this study was to develop more simple method for determining NO3 - -N in KCl extracts. NO3 - -N<br />
could be determined by a UV absorption method in solution where the dissolved organic carbon (DOC)<br />
concentration is low. The UV absorption method, however, cannot be applied for the determination of NO3 - -<br />
N in KCl extracts from forest <strong>soil</strong>s because these solutions usually contain considerable amount of DOC.<br />
DOC absorbs light at all wavelengths between 200 nm <strong>and</strong> 300nm. The absorbance of DOC gradually<br />
decreases from 200 nm to 300nm. On the other h<strong>and</strong>, NO3 - -N also absorbs UV light at less than 250 nm<br />
wavelength. Based on the difference of UV absorption properties between DOC <strong>and</strong> NO3- - N, we developed a<br />
NO3 - -N determination method.<br />
Methods<br />
Fourteen surface <strong>soil</strong> samples were collected from the forests in Mt. Tsukuba <strong>and</strong> Mt. Kaba, Ibaraki<br />
prefecture, Japan (Table 1). DOC was extracted from each <strong>soil</strong> by 100 ml of water added to 20g of Soil. NO3 -<br />
-N in the extracts was removed with ion ex<strong>change</strong> resins (the mixture of Amberlite IR120 <strong>and</strong> Amberlite<br />
IRA410). We measured absorption spectra of each extract within 200 nm to 300 nm by a spectrophotometer<br />
(Shimadzu UVmini-1240). We calculated the ratio of the absorbance at 220nm to that at 260nm in each<br />
extract <strong>and</strong> used the mean value of the ratio in the following nitrate estimations. NO3 - -N was extracted with<br />
2M KCl solution from thirty-nine <strong>soil</strong> samples collected from a Japanese cedar forest <strong>and</strong> a Japanese cypress<br />
forest in Mt. Tsukuba. We measured the absorbance at 220nm <strong>and</strong> 260nm in each 2M KCl extracts. We also<br />
measured the absorbance at 220nm <strong>and</strong> 260nm of 2M KCl extracts from seventeen <strong>soil</strong> samples that were<br />
collected in forests in Kobe, Ehime <strong>and</strong> Kagoshima in western Japan. Then, the 220nm absorbance<br />
originated from NO3 - -N ([UV220]NO3) was estimated by the following formula.<br />
[UV220]NO3 = [UV220] - [UV260]* K220/260<br />
Here, [UV220] is an absorbance value at 220nm in the extracts. [UV260] is an absorbance value at 260nm in<br />
the extracts. K220/260 is the ratio of the absorbance at 220nm to that at 260nm originated from DOC.<br />
© 2010 19 th World Congress of Soil Science, Soil Solutions for a Changing World<br />
1 – 6 August 2010, Brisbane, Australia. Published on DVD.<br />
(1)<br />
4
Table 1. General information of <strong>soil</strong> samples <strong>and</strong> number of samples for water <strong>and</strong> KCl extraction.<br />
Location Latitude Longitude Vegetation A Soil Type B Parent Materials Water extract<br />
© 2010 19 th World Congress of Soil Science, Soil Solutions for a Changing World<br />
1 – 6 August 2010, Brisbane, Australia. Published on DVD.<br />
Number<br />
KCl extract<br />
Number<br />
Tsukuba 36°10′N 140°10′E Japanese cypress BD Volcanic Ash, Gneiss 2 20<br />
Tsukuba 36°10′N 140°10′E Japanese cedar BD Volcanic Ash, Gneiss 4 19<br />
Kaba 36°18′N 140° 9′E Deciduous <strong>Forest</strong>s BD(d) Volcanic Ash, Granite 8 --<br />
Kochi 33°28′N 133°00′E Japanese cypress BlD Volcanic Ash -- 7<br />
Kobe 34°43′N 135°10′E Japanese cedar BD Tertiary sediment -- 6<br />
Ehime 33°53′N 132°52′E Mousoutiku<br />
Bamboo forests<br />
BD(d) Hornfels -- 4<br />
A<br />
Japanese cypress: Chamaecyparis obtusa, Japanese cedar: Cryptomeria Japonica, Mousoutiku: Phyllostachys<br />
pubescens. B According to classification of forest <strong>soil</strong>s in Japan (1975), BD: Moderately moist brown forest <strong>soil</strong>s, BD(d)<br />
Moderately moist brown forest <strong>soil</strong>s (drier subtype), BlD: Moderately moist black <strong>soil</strong>s<br />
NO3 - -N concentration at the KCl extracts was determined by comparing [UV220]NO3 with the absorbancy of<br />
NO3 - -N st<strong>and</strong>ard solution. NO3 - -N concentration of each extract was also measured by the automated Cd<br />
reduction methods (Dia Instrument FI-N50). We call the former the UV method <strong>and</strong> the latter the automated<br />
Cd reduction method.<br />
Results<br />
The absorption spectra of DOC <strong>and</strong> NO3 - -N<br />
Each water extract after deionization showed UV absorption, <strong>and</strong> its optical density was least at 300nm <strong>and</strong><br />
gradually increased toward shorter wavelength (Figure 1). These extracts did not contain NO3 - -N, so the<br />
absorption curve observed was considered to be derived from DOC. On the contrary, the adsorption curve of<br />
NO3 - -N has no absorption in the range from 250nm to 300nm <strong>and</strong> abruptly increased at 240nm. The mean<br />
value of the ratio of absorbancy at 220nm to at 260nm was 1.543 in water extracts after deionization for<br />
fourteen <strong>soil</strong>/water extracts (Table 2), so we adopted 1.543 as the value of K220/260 in the equation (1).<br />
ABS<br />
3<br />
2<br />
1<br />
0<br />
200 210 220 230 240 250 260 270 280 290 300<br />
Wave len gth<br />
NO3<br />
Soil 1<br />
Soil 2<br />
Soil 3<br />
Figure 1. The absorption curves of three <strong>soil</strong>/water extracts after deionization <strong>and</strong> that of NO3 - -N solution.<br />
The comparison of the UV method with the automated Cd reduction method<br />
We compared the data by the UV method with those determined by the automated Cd reduction method for<br />
2M KCl extracts from Mt. Tsukuba <strong>soil</strong>s (Figure 2, left). There was a good relationship between the UV<br />
method <strong>and</strong> the automated Cd reduction method (Y=1.040X-0.124, R 2 =0.993). If the absorbancy at 220nm of<br />
DOC was assumed to be 0, the slope of the regression line was 0.753. This indicated that NO3 - -N<br />
concentration by the UV method was overestimated compared with the automated Cd reduction method<br />
(Figure 2, right). We also compared both methods for NO3 - -N determination in KCl extracts from Kobe,<br />
Ehime <strong>and</strong> Kochi <strong>soil</strong>s (Figure 3, left). The data for the UV method also were highly correlated with those by<br />
the automated Cd reduction method (Y=1.099X-0.421, R 2 =0.989). On the other h<strong>and</strong>, in case no<br />
compensation was carried out for the absorbancy at 220nm, NO3 - -N concentration by the UV method was<br />
overestimated (Figure 3, right).<br />
Discussion<br />
Several simple methods have been proposed for the NO3 - -N determination (Cataldo et al. 1975; Kanno et<br />
al.1968; Norman <strong>and</strong> Stucki 1981; Sakata 2000; Yang et al. 1998). These methods are simple but they need<br />
some steps such as reagent adding <strong>and</strong> heating. The UV method, we developed, is more simple. It only needs<br />
only a spectrophotometer <strong>and</strong> the measurement of absorbancy at 220nm <strong>and</strong> 260nm. It is the most simple<br />
procedure to determine NO3 - -N in KCl extracts from <strong>soil</strong>s.<br />
5
Table 2. The ratio of absorbance at 220nm to at 260nm in <strong>soil</strong>/water extracts after deionization.<br />
Location Vegetation Soil depth<br />
(cm)<br />
UV220 UV260 K220/260<br />
Tsukuba Japanese Cypress 0-5 1.054 0.637 1.655<br />
Tsukuba Japanese Cypress 0-5 0.526 0.33 1.594<br />
Tsukuba Japanese Cedar 0-5 0.681 0.446 1.527<br />
Tsukuba Japanese Cedar 0-5 0.645 0.443 1.456<br />
Tsukuba Japanese Cedar 0-5 0.569 0.375 1.517<br />
Tsukuba Japanese Cedar 20-25 0.309 0.179 1.726<br />
Tsukuba deciduous <strong>Forest</strong>s 0-5 2.382 1.551 1.536<br />
Kaba deciduous <strong>Forest</strong>s 5-15 2.901 1.953 1.485<br />
Kaba deciduous <strong>Forest</strong>s 15-30 0.457 0.287 1.592<br />
Kaba deciduous <strong>Forest</strong>s 0-5 2.868 1.938 1.48<br />
Kaba deciduous <strong>Forest</strong>s 5-15 0.31 0.204 1.52<br />
Kaba deciduous <strong>Forest</strong>s 15-30 0.409 0.261 1.567<br />
Kaba deciduous <strong>Forest</strong>s 0-10 1.059 0.717 1.477<br />
Kaba deciduous <strong>Forest</strong>s 20-30 0.912 0.62 1.471<br />
mean 1.543<br />
Max. 1.726<br />
Min. 1.456<br />
S.D. 0.077<br />
Th e common meth od<br />
8<br />
6<br />
4<br />
2<br />
0<br />
y = 1.040 x - 0.124<br />
R 2 = 0.993<br />
0 2 4 6 8<br />
Th is method<br />
The common meth od<br />
© 2010 19 th World Congress of Soil Science, Soil Solutions for a Changing World<br />
1 – 6 August 2010, Brisbane, Australia. Published on DVD.<br />
8<br />
6<br />
4<br />
2<br />
0<br />
y = 0.753 x + 0.033<br />
R 2 = 0.859<br />
0 2 4 6 8<br />
Th is meth od (no compen sation )<br />
Figure 2. Comparison of NO3 - -N concentrations by the UV method (this method) with those by the automated<br />
Cd reduction method (the common method) for KCl extracts from Tsukuba <strong>soil</strong>s (Unit is mg N/L). K220/260 =<br />
1.543 in the left figure. K220/260=0 in the right figure.<br />
The common meth od<br />
15<br />
10<br />
5<br />
0<br />
y = 1.099 x - 0.421<br />
R 2 = 0.996<br />
0 5 10 15<br />
Th is method<br />
Th e common meth od<br />
15<br />
10<br />
5<br />
0<br />
y = 1.044 x - 1.593<br />
R 2 = 0.950<br />
0 5 10 15<br />
This method (no compen sation )<br />
Figure 3. Comparison of NO3 - -N concentrations by the UV method (this method) with those by the automated<br />
Cd reduction method (the common method) for KCl extracts from Kobe, Ehime <strong>and</strong> Kagoshima <strong>soil</strong>s (Unit is mg<br />
N/L). K220/260 = 1.543 in the left figure. K220/260=0 in the right figure.<br />
6
The accuracy of the UV method depends on the value of K220/260 in the equation(1). K220/260 varied from<br />
1.456 to 1.726 in the fourteen <strong>soil</strong>/water extracts. In the case of K220/260 =1.456, the slope, the y-intercept<br />
<strong>and</strong> the R 2 of the regression line, are calculated to be as 1.064, 0.106 <strong>and</strong> 0.996 for the KCl extracts from<br />
Tsukuba <strong>soil</strong>s, respectively. In the case of K220/260 =1.726, the slope, the y-intercept <strong>and</strong> the R 2 are 1.027,<br />
0.128 <strong>and</strong> 0.991, respectively. Each parameter is almost same in the case of K220/260 =1.543 (Figure 2, left).<br />
This result suggests that the value of NO3 - -N estimation would be almost constant even if the value of K220/260<br />
varied to some extent. The NO3 - -N estimated by the UV method is highly correlated with values for the<br />
automated Cd reduction method for KCl extracts from forest <strong>soil</strong>s in western Japan (Figure 3, left). However,<br />
as for the slope <strong>and</strong> the y-intercept of the regression line, the correspondence of two methods is somewhat<br />
low compared with the case of Tsukuba <strong>soil</strong>s. The <strong>soil</strong> type of the Kochi <strong>soil</strong>s is different from that of<br />
Tsukuba <strong>soil</strong>s <strong>and</strong> vegetation for Ehime <strong>soil</strong>s is different from that of Tsukuba <strong>soil</strong>s (Table 1). We assumed<br />
that the K220/260 of DOC is constant in KCl extracts from <strong>soil</strong>s but the low correspondence suggests that the<br />
K220/260 of DOC may vary with <strong>soil</strong> type <strong>and</strong> vegetation type. We need more information about K220/260 of<br />
DOC extracted from <strong>soil</strong>s under different environments.<br />
Conclusion<br />
The method that we developed to determine NO3 - -N in KCl extracts, only needs a spectrophotometer <strong>and</strong> the<br />
measurement of absorbance at 220nm <strong>and</strong> 260nm. We conclude that it is the simplest procedure to determine<br />
NO3 - -N in KCl extracts from forest <strong>soil</strong>s.<br />
References<br />
Cataldo DA, Haroon LE, Schrader LE, Youngs VL (1975) Rapid colorimetric determination of nitrate in<br />
plant tissue by nitration of salicylic acid. Communications in Soil Science <strong>and</strong> Plant Analysis 6, 71–80.<br />
Kanno S, Fukui S, Kaneko M (1968) Hygienic chemical studies on public water. VI. Determination of nitrate<br />
nitrogen in water sodium salicylic acid method. Eisei Kagaku 14, 14-29 (In Japanese).<br />
Norman RJ, Stucki JW(1981) The determination of nitrate <strong>and</strong> nitrite in <strong>soil</strong> extracts by ultraviolet<br />
spectrophotometry. Soil Sci. Soc. Am. J. 45, 347-353.<br />
Yang JE, Skogley EO, Schaff BE, Kim JJ (1998) A simple spectrophotometric determination of nitrate in<br />
water. Soil Science Society of American Journal 62, 1108-1115.<br />
© 2010 19 th World Congress of Soil Science, Soil Solutions for a Changing World<br />
1 – 6 August 2010, Brisbane, Australia. Published on DVD.<br />
7
An equation for yield prediction for Pinus taeda L. as a function of <strong>soil</strong><br />
properties<br />
Itamar A. Bognola A ; Osmir J. Lavoranti A , Antonio Rioyei Higa B , João Bosco V. Gomes A , Shizuo Maeda A<br />
<strong>and</strong> Carla M. Camargo Corrêa B<br />
A<br />
Embrapa <strong>Forest</strong>ry, Colombo, PR, Brazil, Email iabog@cnpf.embrapa.br, osmir@cnpf.embrapa.br, jbvgomes@cnpf.embrapa.br,<br />
maeda@cnpf.embrapa.br<br />
B<br />
<strong>Forest</strong>ry Department, University of Federal Paraná, Curitiba, PR, Brazil, Email higa@ufpr.br; camargocorrea@ufpr.br<br />
Abstract<br />
This study was developed in order to obtain an equation for yield prediction as a function of <strong>soil</strong> properties,<br />
for plantations established with Pinus taeda L. in the plateau located in the northern part of the State of Santa<br />
Catarina, Brazil. As a case study, one of the farms of Battistella Florestal Ltd. was chosen. Data were<br />
obtained from permanent sample plots from a Continuous <strong>Forest</strong> Inventory as well as from a detailed <strong>soil</strong><br />
map of a 2,252 ha forest estate. Soil properties <strong>and</strong> yield of P. taeda were analysed with stepwise multiple<br />
linear regression. By these means an equation was developed for site index prediction with 93.97 %<br />
precision. It was also found that <strong>soil</strong>s with well developed surface drainage <strong>and</strong> high levels of organic matter<br />
are more suitably for growth of P. taeda under local environmental conditions.<br />
Key Words<br />
Multivariate statistical methods, <strong>soil</strong> survey, forest planning.<br />
Introduction<br />
<strong>Forest</strong> owners need low cost <strong>and</strong> precise information about st<strong>and</strong> yield before harvesting operations are<br />
implemented in order to improve planning of the supply to log yards as well as for planning purposes <strong>and</strong><br />
forest inventory. Growth <strong>and</strong> yield of planted forests depend on physiological responses to the interactions<br />
between biotic <strong>and</strong> abiotic environmental factors. Climate, physiographic <strong>and</strong> <strong>soil</strong>s factors are the most<br />
important environmental elements influencing productive capacity in a given location, these represent site<br />
quality (Carmo <strong>and</strong> Resende 1990). Soil class incorporates important information such as depth, texture,<br />
nutrient <strong>and</strong> organic matter, chemical activity of the coloyd fraction <strong>and</strong> compacted layers that could restrict<br />
root growth <strong>and</strong> water movement (Rigatto et al. 2005). On the other h<strong>and</strong>, there are few studies about the<br />
joint analysis of such factors <strong>and</strong> their correlation with different ecosystems, site quality <strong>and</strong> pine species.<br />
Evaluation of potential <strong>and</strong> limiting factors affecting environmental quality for productive capacity of forest<br />
site evaluation cannot be based on isolated attributes, but on a syntesis of qualities <strong>and</strong> limitations of the<br />
ecosystem from an integrated perspective. Hence, it can be observed that when physical, chemical <strong>and</strong><br />
physical-hydric <strong>soil</strong> characteristics, geology, terrain <strong>and</strong> climate are jointly examined <strong>and</strong> correlated to the<br />
different scenarios, the overall ranking of the influences is easier (Van Den Berg 1995; Rigatto et al. 2005).<br />
On the other h<strong>and</strong>, underst<strong>and</strong>ing the behavior of ecosystems is difficult due to the complex interactions <strong>and</strong><br />
quite frequently dem<strong>and</strong>s predictive models. For this reason, when a detailed analysis is needed in order to<br />
underst<strong>and</strong> the relations between quantitative attributes of the trees <strong>and</strong> physical environment the choice of a<br />
statistical method that optimizes resources without reducing precision of the estimation process is of<br />
fundamental importance (Mello et al. 2005). In this context, <strong>and</strong> according to Bognola (2007), this research<br />
was conceived in order to study physical environmental factors affecting growth of Pinus taeda L. in a<br />
commercial plantation as well as to develop an equation for yield prediction using multivariate techniques<br />
<strong>and</strong> regression analysis.<br />
Material <strong>and</strong> methods<br />
<strong>Working</strong> area<br />
The study was developed in one of the forest farms belonging to Battistella Florestal, <strong>and</strong> located on the<br />
plateau of the northern part of the state of Santa Catarina, Brazil, in Rio Negrinho e Doutor Pedrinho<br />
counties (Figure 1). Climate type is Cfa according to Köppen's classification (tropical climate, with warm<br />
Summer, without any dry season, average temperatures of the coldest month under 18°C <strong>and</strong> above -3°C).<br />
The rainfall of the region is high (1,700 mm/y) <strong>and</strong> well distributed over the year.<br />
© 2010 19 th World Congress of Soil Science, Soil Solutions for a Changing World<br />
1 – 6 August 2010, Brisbane, Australia. Published on DVD.<br />
8
Data collection<br />
Data were collected in 500 m 2 permanent sample plots of a Continuous <strong>Forest</strong> Inventory. In addition to<br />
DBH <strong>and</strong> height of individual trees, the following information was also obtained: a) physical, chemical <strong>and</strong><br />
physical-hydric <strong>soil</strong> characteristics at 0–20 cm <strong>and</strong> 30–50 cm depth for all sample plots considered; b)<br />
aspect, geology <strong>and</strong> physiographic descriptive information obtained from a detailed <strong>soil</strong> survey (scale<br />
1:10,000) of the area. Statistical analysis was performed using SAS® - Statistical Analysis System (SAS<br />
Institute Inc. 1993), licensed for Embrapa Florestas.<br />
Figure 1. <strong>Working</strong> area location.<br />
Regression Equation<br />
A multiple regression analysis was performed using the following general linear model:<br />
Yi = β0 + β 1X1i + β 2X2i + ... + β pXpi + εi<br />
where: Yi is the observed value for the response variable (dependent) at the level i of the predictive<br />
(independent) variables Xi´s;<br />
β0 : regression constant (intercept of the regression equation with axis y);<br />
β1 : regression coefficient (variation of Y as a function of the variation of one unit of X1);<br />
β2 : regression coefficient (variation of Y as a function of the variation of one unit of X2);<br />
βp : regression coefficient (variation of Y as a function of the variation of one unit of Xp);<br />
X1i : value of variable X1, at the level i;<br />
X2i : value of variable X2, at the level i;<br />
Xpi : value of variable Xp, at the level i;<br />
εi : error or deviation associated with the distance of the observed value Yi <strong>and</strong> the corresponding<br />
estimated value Ŷi based on the regression equation.<br />
As the coefficient of determination always increases with the inclusion of new a independent variable in the<br />
equation, even if it has no relation with the dependent variable, the corrected coefficient of determination<br />
was used for the degrees of freedom as defined by Ribeiro Júnior (2001):<br />
2<br />
2<br />
2 p<br />
2<br />
R adjusted = R = R − ( 1−<br />
R )<br />
n − p −1<br />
where p sets the number of regression coefficients (not including β0).<br />
In practice there can be a large number of variables influencing the response. Hence, a stepwise regression<br />
procedure was adopted for the selection of the best regression model. This procedure determines that the first<br />
variable entering the model is the variable X with the highest correlation with the response variable Y.<br />
Subsequently, through the largest values for the partial coefficient of determination of all other variables<br />
were not included in the model. The model is adjusted with the inclusion of the last variable <strong>and</strong> the values<br />
for the partial F test are determined. By those means any variable that produces a non-significant<br />
contribution (partial F) is removed from the model. This process continues until there are no other variables<br />
being added or removed (Lavoranti 2005).<br />
© 2010 19 th World Congress of Soil Science, Soil Solutions for a Changing World<br />
1 – 6 August 2010, Brisbane, Australia. Published on DVD.<br />
9
Results<br />
In order to identify the best regression equation for P. taeda plantations, for Site Index 15 (SI_15), based on<br />
49 independent variables, related to physical environment characteristics, a principal component (PCA)<br />
multiple linear regression analysis was used. Regressive variables were selected in two stages: a) first, the<br />
most significant variables were identified by principal component <strong>and</strong> factor analysis; <strong>and</strong> b) the eleven most<br />
significant factors were identified <strong>and</strong> considered in a stepwise regression analysis. The reduction of<br />
variables through PCA has produced a 9 % loss of information on the total variance. In other words, the<br />
model developed with this procedure explained 91 % of the data variability. According to Royston (1992),<br />
an exploratory analysis has to be performed with the data in order to verify the normal distribution of the<br />
residuals for the structure of the regression model. In this context, it can be verified in Table 1 for the<br />
analysis of variance <strong>and</strong>, in Table 2, where the values for the coefficients of the regression model are<br />
defined. The variables selected are presented in equation 1.<br />
Table 1. Analysis of variance for the multiple regression in the step 19 (stepwise method), for the set of<br />
independent variables of this study.<br />
Source D.F. SQ MQ F0 Pr > F0<br />
Regression 5 4.609,03071 921,80614 162,71 < 0,0001<br />
Error 11 62,31929 5,66539<br />
Total 16 4.671,35<br />
SI_15est = b1KPA1_10 + b2KPA2_10 + b3HAL1 + b4DENSID1 + b5MO1 + ε (eq. 1)<br />
Where:<br />
SI_15est: Site Index estimated for P. taeda at age 15 years (m);<br />
KPA1_10: Water removed from the <strong>soil</strong> (cm 3 /cm 3 ), tension 10 kPa, for the surface layer (5 – 10 cm)<br />
(moisture content, at the field capacity – CC);<br />
KPA2_10: Water removed from the <strong>soil</strong> (cm 3 /cm 3 ), tension 10 kPa, for the sub-superficial layer (30 – 50 cm)<br />
(moisture content, at the field capacity – CC);<br />
HAL1: ex<strong>change</strong>able hydrogen + aluminum contents (cmolc dm -3 ), in the superficial layer (5 – 10 cm);<br />
DENSID1: Soil density (kg/dm 3 ) for the supeficial layer (5 – 10 cm);<br />
MO1: Organic matter (g/dm 3 ), in the superficial layer (5 – 10 cm);<br />
ε: Residual;<br />
b1,..., b5: Coefficients of the model.<br />
Table 2. Coefficients of the regression model.*<br />
Coefficient (βi) Estimated Parameter Error (ε) t p > t<br />
b1 -520.392 210.213 -247.555 0.03082<br />
b2 215.549 53.809 400.418 0.00207<br />
b3 0.01799 0.00768 234.109 0.03910<br />
b4 904.679 0.70485 1.283.509 < 0.0001<br />
b5 0.39932 0.06772 589.679 0.00010<br />
* Coefficient of Determination: R 2 = 0.9867.<br />
It was observed that among all variables selected for the development of the predictive model, those related<br />
to the physical-hydric <strong>soil</strong> properties were the most important in that they presented the highest values for the<br />
coefficient of correlation. The analysis of residual distribution as a function of the estimated values allowed<br />
the observation of homoscedasticy, as well as the absence of outliers. Fitting the model was adequate for all<br />
the extentions examined which justifies the used of the model for the estimation of Site Index as a function<br />
of the variables chosen.<br />
Conclusion<br />
The equation defined through multivariate regression analysis of the case study data allows site index<br />
estimates with a 93.97 % precision.<br />
It was also found that <strong>soil</strong>s with well developed surface drainage <strong>and</strong> high levels of organic matter are most<br />
suited for the growth of P. taeda under local environmental conditions.<br />
© 2010 19 th World Congress of Soil Science, Soil Solutions for a Changing World<br />
1 – 6 August 2010, Brisbane, Australia. Published on DVD.<br />
10
References<br />
Bognola IA (2007). Unidades de manejo para P. taeda L. no planalto norte catarinense, com base em<br />
características do meio físico. Curitiba, 160 f. thesis (DSc. Silviculture), Centro de Ciências Florestais,<br />
Universidade Federal do Paraná.<br />
Carmo DN, Resende M, Silva TCA (1990) Avaliação da aptidão das terras para eucalipto. (NF Barros, NF,<br />
RF Novais) pp.187-235. (Relação Solo-Eucalipto: Viçosa, Folha de Viçosa).<br />
Lavoranti OJ (2005). Análise de Regressão Linear Múltipla. Curitiba, 41f. Apostila da Discplina CE-216 do<br />
Curso de Pós-graduação - Setor de Ciências Exatas – Departamento de Estatística, Universidade Federal<br />
do Paraná (UFPR).<br />
Mello JM, Batista JLF, Ribeiro Jr PJ, Oliveira MS (2005) Ajuste e seleção de modelos espaciais de<br />
semivariograma vis<strong>and</strong>o à estimativa volumétrica de Eucalyptus gr<strong>and</strong>is. Scientia <strong>Forest</strong>alis, Piracicaba,<br />
SP, 69, 25-37.<br />
Ribeiro Júnior JI (2001) ‘Análises estatísticas no SAEG’. (Viçosa: UFV).<br />
Rigatto PA, Dedecek RA, Mattos JLM de (2005) Influência dos atributos do solo sobre a produtividade de P.<br />
taeda. Revista Árvore, Viçosa 29, 701-709.<br />
SAS - Statistical Analysis System (1993) ‘Programa de computador, ambiente VM. Cary,versão 6.08’.<br />
Van den Berg E (1995) Estudo florístico e fitossociológico de uma floresta ripária em Itutinga, MG, e análise<br />
das correlações entre variáveis ambientais e a distribuição das espécies de porte arbóreo-arbustivo.<br />
Lavras, MSc Dissertation, Federal University of Lavras.<br />
© 2010 19 th World Congress of Soil Science, Soil Solutions for a Changing World<br />
1 – 6 August 2010, Brisbane, Australia. Published on DVD.<br />
11
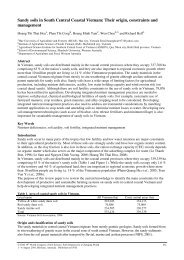
Change of forest <strong>soil</strong>s under human factors (the Komi Republic, Russia)<br />
Lapteva E.M., Dymov A.A.*, Vturin G.M., Simonov G.A., Bondarenko N.N., Rusanova G.V.<br />
Soil Science Department, Institute of Biology Komi Scientific Centre RAS, Syktyvkar, Russia, Email: dymov@ib.komisc.ru<br />
*-presenting author<br />
Abstract<br />
Timber, oil <strong>and</strong> gas industries play a dominant role in disturbances of forest <strong>soil</strong>s. The greatest <strong>change</strong>s of<br />
<strong>soil</strong>s happen in first 5-10 years after cutting. The cutting areas are characterized by different disturbances <strong>and</strong><br />
various rates of renewal. Temporary <strong>soil</strong> over-moisturing in first years after cutting <strong>and</strong> secondary succession<br />
of vegetation influence <strong>soil</strong> morphology, <strong>soil</strong> properties <strong>and</strong> humic substances at cutting areas. Changes of<br />
<strong>soil</strong> <strong>and</strong> <strong>soil</strong> cover of the Komi Republic under impact of oil <strong>and</strong> gas industry are presented.<br />
Key Words<br />
<strong>Forest</strong> <strong>soil</strong>s, anthropogenic <strong>change</strong>s of <strong>soil</strong>s, cutting, oil <strong>and</strong> gas mining impact on <strong>soil</strong>s<br />
Introduction<br />
The Komi Republic (KR) is located in the North-East of European Russia, its area is more than 40 million<br />
hectares. Bioclimatic conditions are not favorable for agriculture, but <strong>soil</strong> resources are of great importance<br />
for forestry (Zaboeva 1975). The European northeast is characterized by about 50 % forest-cover (State<br />
2009). The total area of forest resources l<strong>and</strong> is 36 million ha (or 86 % area of the KR). Soils of the podzolic<br />
type are dominant in well drained forest l<strong>and</strong>scapes: gley-podzolic <strong>soil</strong>s in northern taiga subzone, typical<br />
podzolic <strong>soil</strong>s in middle taiga <strong>and</strong> sod-podzolic <strong>soil</strong>s in the southern subzone. Soils of this groups are of great<br />
importance for forestry. Quite productive spruce <strong>and</strong> pine forests grow on such sod-podzolic <strong>soil</strong>s. More than<br />
a half of the area covered by podzolic-boggy <strong>soil</strong>s predominated on watershed sites under green-mosses <strong>and</strong><br />
sphagnum dark coniferous forests (Zaboeva 1975).<br />
Soil transformation (<strong>change</strong>s in morphological <strong>and</strong> physicochemical parameters) in the KR is connected with<br />
timber-harvesting <strong>and</strong> oil-gas industry. Agricultural l<strong>and</strong>s (tillage, greenl<strong>and</strong> <strong>and</strong> pasture) are insignificant<br />
<strong>and</strong> cover 418 thous<strong>and</strong> hectares – 1.0 % of KR total area (State 2009). In forest l<strong>and</strong>scapes the specificity of<br />
<strong>soil</strong> <strong>and</strong> <strong>soil</strong> cover formation under native forest vegetation has been studied by now (Zaboeva 1975;<br />
Rusanova 1987; Lodygin et al. 2007; Soil..2001) <strong>and</strong> also under agriculture (Zaboeva et al. 1988; Kanev <strong>and</strong><br />
Mokiev 2004). Problems linked with <strong>soil</strong> <strong>change</strong>s result from forest harvesting <strong>and</strong> oil - gas mining <strong>and</strong><br />
pipeline have been less studied. The main objectives of the present research were to study some properties<br />
of podzolic <strong>soil</strong>s in chronosequences of clear-cuttings, to evaluate the impacts of cutting on <strong>soil</strong> organic<br />
matter <strong>and</strong> the impact of oil <strong>and</strong> gas industry on properties of forest <strong>soil</strong>s.<br />
Materials <strong>and</strong> methods<br />
Human-induced <strong>change</strong>s in <strong>soil</strong>s have been studied in the northern <strong>and</strong> middle taiga subzones of the republic.<br />
Influences of harvesting operation have been estimated in middle taiga in two chronosequences: <strong>soil</strong>s of the<br />
first series formed in loamy sediments (Ust’Kulom district, Komi), the second - in lithologically<br />
discontinuous deposits (s<strong>and</strong> underlayed by morain loams at depths of 40-50 cm) (Prilyzskii district, Komi).<br />
Soils of first chronosequence in clear-cutting sites (only “felling” sites without any mechanical disturbances<br />
of ground cover <strong>and</strong> <strong>soil</strong>s as well) presented by: plot 1 – <strong>soil</strong>s under native spruce forest; plot 2 – <strong>soil</strong>s under<br />
6-year-old clear cutting; plot 3 – <strong>soil</strong>s under 38-year-old clear cutting. Soils of second chronosequence of<br />
clear-cuts presented by: plot 1 – <strong>soil</strong>s under native pine forest; plot 2 – <strong>soil</strong>s under 12-year-old clear cutting;<br />
plot 3 – <strong>soil</strong>s under 23-year-old clear cutting. Additionally mechanically disturbed <strong>soil</strong>s were investigated<br />
(tractor road <strong>and</strong> timber loading platform). Soils were described according to the Russian system of Soil<br />
Classification (Classification 2004). Analytic methods were used in accordance with the “Theory <strong>and</strong><br />
practice of <strong>soil</strong> chemical analysis” (2005).<br />
Results<br />
Influence of timber cutting<br />
Significant areas of forests (more than 20% of total KR area) were cut during the second half of the 20 th<br />
century (1930 -1990s). Nowadays about 5 - 8 million m 3 wood is harvested annually (State 2009), mostly by<br />
clear cut. Reforestation of cutting areas is by secondary birch <strong>and</strong> aspen st<strong>and</strong>s. According to Lal (2005)<br />
forest ecosystems contain a huge carbon content stored in <strong>soil</strong>s as accumulated organic carbon. It is very<br />
© 2010 19 th World Congress of Soil Science, Soil Solutions for a Changing World<br />
1 – 6 August 2010, Brisbane, Australia. Published on DVD.<br />
12
important to underst<strong>and</strong> the mechanisms of <strong>change</strong> in <strong>soil</strong> organic matter during secondary succession after<br />
forest cutting.<br />
In the cutting area <strong>soil</strong> <strong>change</strong>s <strong>and</strong> restoration rate of physicochemical properties depend on the texture of<br />
<strong>soil</strong>-forming sediments, season of cutting, quality <strong>and</strong> technological characteristics of harvesting operations.<br />
Greatest <strong>change</strong>s of <strong>soil</strong> cover are affected by heavy forestry machinery during harvesting operation<br />
(Rosnovsky, 2001). This type of disturbances is very common for tractor road <strong>and</strong> timber loading platforms<br />
covering about 30 % of the cutting area. In these sites the upper <strong>soil</strong> profile consists of piling layers which<br />
appear to be a mixture of mineral <strong>soil</strong> <strong>and</strong> logging slash (stems, branches, etc.) <strong>and</strong> the ground cover<br />
vegetation.<br />
The operation lead to conservation of dead ground vegetation <strong>and</strong> logging slash in buried at depths of 30 to<br />
100 cm. The bulk density of upper horizons increases at this sites, pH decreases by 1-3 pH units (in<br />
comparison to control sites) as does microbiological activity. During first years after cutting reforestation is<br />
suppressed at these sites.<br />
For the rest of the cutting area (without mechanical disturbance of ground <strong>and</strong> <strong>soil</strong> cover) <strong>soil</strong>s <strong>change</strong>s result<br />
in temporary paludification <strong>and</strong> reforestation of forest vegetation. More intensive paludification <strong>processes</strong><br />
develope in the <strong>soil</strong>s of young cutting areas (5-10 years old) <strong>and</strong> lead to increasing spatial variation of<br />
morphological <strong>and</strong> chemical <strong>soil</strong> properties, gley <strong>processes</strong> activation, mobilization <strong>and</strong> segregation of Fecompounds.<br />
Litter decomposition decreased under the hydromorphiс regime resulting in decreasing capacity<br />
of forest litter <strong>and</strong> nitrogen depletion (Table 1).<br />
Table 1. Changes of some characteristics of forest litter in chronosequences of clear-cuts<br />
Podzolic <strong>soil</strong>s in silty loams Podzols in lithologically discontinuous deposits<br />
Plot 1 Plot 2 Plot 3 Plot 1 Plot 2 Plot 3<br />
Thickness (cm) 5.5±0.8* 5.8±0.6 4.1±0.4 5.9±0.6 12.8±1.9 8.2±0.8<br />
Litter density (g cm 3 ) 0.11±0.02 0.10±0.01 0.15±0.02 0.11±0.01 0.08±0.01 0.10±0.02<br />
pHH2O 4.3±0.1 4.4±0.1 5.0±0.2 4.1±1.0 4. 5±0.9 4.6±1.4<br />
Сtot (%) 42.2±1.0 42.0±1.1 37.6±2.5 33.9±3.3 35.4±14.0 29.7±7.0<br />
Сtot (1000 kg/ha) 25.53 24.36 23.12 23 33.9 25.0<br />
Ntot (%) 1.64±0.09 1.45±0.05 1.61±0.08 0.86±0.23 1.04±0.6 1.1±0.4<br />
Ntot (1000 kg/ha) 0.99 0.84 0.99 0.50 0.57 1.16<br />
n 39 40 30 61 30 50<br />
* confidence interval for mean value (р=0.05)<br />
Soils of young cutting sites are also characterized by increasing chemical “aggressivity” <strong>and</strong> migratory<br />
ability of humic substances. In upper <strong>soil</strong> horizons we can observe an increase in hydrophilicity of alkalisoluble<br />
organic matter <strong>and</strong> water- <strong>and</strong> acid soluble organic compounds as well.<br />
Сhanges in upper <strong>soil</strong> horizons under secondary succession after felling (with vegetation cover renewal)<br />
depend on texture (granulometric composition) of <strong>soil</strong> forming sediments. Soils formed in homogeneous<br />
sediments are characterized by a decrease in pH of forest litter <strong>and</strong> accumulation of biofilic components. Soil<br />
formed on lithologically heterogeneous sediments appear to have stronger <strong>change</strong>s in morphological <strong>and</strong><br />
physicochemical properties.<br />
Humic <strong>and</strong> fulvic acids extracted from <strong>soil</strong>s a felling places are differentiated from substances of <strong>soil</strong>s under<br />
native forests. Main distinctions are in elemental <strong>and</strong> amino acid composition of humic materials. At cutting<br />
sites the nitrogen content in humic acids is as much as 1.3-1.7 times higher as compared to those in native<br />
forest. Probably, <strong>change</strong>s in nitrogen concentration are explained by <strong>change</strong>s in the composition of forest<br />
waste.<br />
Simplification of HA macromolecules structure in cut area <strong>soil</strong>s results from temporary <strong>soil</strong> over-moisturing.<br />
This process is indicated by increasing H:C ratio (Table 2). Hydrolyzates of HAs extracted from ELhg<br />
horizons of cut area <strong>soil</strong>s contain 154.9-145.1 g/kg amino acids which is as much as 4.5-4.8 times more<br />
compared to the same horizon of native forest <strong>soil</strong>s. HAs extracted from the O horizon have 107.8-101.6<br />
g/kg amino acids which is rather close to the values in native forest. Some residual hydromorphic the<br />
features remain even 36 years after tree logging as hardpan horizons <strong>and</strong> concretion aggregations in the<br />
upper <strong>soil</strong>.<br />
Influence of oil <strong>and</strong> gas industry<br />
Oil <strong>and</strong> gas industry impact on <strong>soil</strong> cover is connected with a considerable quantities of sites in the Komi<br />
© 2010 19 th World Congress of Soil Science, Soil Solutions for a Changing World<br />
1 – 6 August 2010, Brisbane, Australia. Published on DVD.<br />
13
Republic (State 2009). Mining <strong>and</strong> oil <strong>and</strong> gas pipeline cause single-stage or repetitive impact on <strong>soil</strong> cover<br />
(Solntseva 1998).<br />
Table 2. Elemental composition <strong>and</strong> molar ratios of humic substances (HSs) extracted from <strong>soil</strong>s at<br />
chronosequences of clear-cutting (Podzolic <strong>soil</strong>s in silty loams, Ust’Kulom district, Komi)<br />
Plot Horizon Humic substances<br />
C<br />
(g/kg)<br />
N H O<br />
Н:С О:С С:N<br />
Plot 1 О HAs* 536 28.0 40.6 396 0.90 0.55 22.32<br />
E HAs 550 28.2 43.8 378 0.95 0.52 22.77<br />
O FAs* 493 8.8 36.1 462 0.87 0.70 65.26<br />
E FAs 483 18.1 43.3 456 1.07 0.71 31.08<br />
Plot 2 O HAs 526 33.8 44.2 396 1.00 0.57 18.15<br />
Ehg HAs 566 43.4 57.1 334 1.20 0.44 15.19<br />
O FAs 514 17.5 42.2 426 0.98 0.62 34.18<br />
Ehg FAs 497 10.0 37.5 456 0.90 0.69 57.93<br />
Plot 3 O HAs 563 32.6 55.0 349 1.16 0.46 20.19<br />
E HAs 510 47.6 47.2 396 1.10 0.58 12.49<br />
O FAs 488 8.8 28.8 474 0.70 0.73 64.99<br />
E FAs 474 14.9 47.3 464 1.19 0.73 37.01<br />
* НАs – humic acids; FAs –fulvic acids.<br />
Investigations of mining impact on northern <strong>and</strong> middle taiga subzone of the KR revealed the following:<br />
1) Using of heavy tractors during first stages of construction of surface facilities for the well <strong>and</strong> pipeline<br />
routes, gasoline storage led to mechanical disturbances of native <strong>soil</strong>s, deletion of upper (organogenic)<br />
horizons or burial under filled ground <strong>and</strong> creation of an anthropogenic l<strong>and</strong>scape (Figure 1);<br />
A B<br />
Figure 1. Human affected <strong>change</strong>s in podzolic <strong>soil</strong> profile (A) <strong>and</strong> local disturbances of <strong>soil</strong> <strong>and</strong> vegetation cover<br />
near gas producer (В).<br />
2) Work of compressor station <strong>and</strong> well operation promotes hydrocarbons (mineral oil <strong>and</strong> oil products)<br />
pollution, easily soluble salts, heavy metals <strong>and</strong> other chemical components (acids, bases, surface-active<br />
substances) penetrate into <strong>soil</strong>s <strong>and</strong> other l<strong>and</strong>scape elements;<br />
3) Carbon black, polycyclic aromatic hydrocarbons (including benzapirene) <strong>and</strong> sulphurous matters can enter<br />
the atmosphere under incomplete burning of accompanying gas <strong>and</strong> accumulate in upper <strong>soil</strong> horizons;<br />
4) The Komi Republic is characterized by a humid climate with poorly-drained l<strong>and</strong>scapes <strong>and</strong> swamp l<strong>and</strong><br />
domination. Chemical substances (hydrocarbons, acids, surface-active substance) inflow under such<br />
conditions are a very important factor for <strong>change</strong>s in morphological, physicochemical <strong>and</strong> biological <strong>soil</strong><br />
properties. Consequences of this impact are determined by pollution duration, contaminant chemical<br />
characteristics <strong>and</strong> l<strong>and</strong>scape peculiarities;<br />
5) Contamination along gas <strong>and</strong> oil pipeline appears to be local <strong>and</strong> is usually registered visually as single<br />
spots.<br />
© 2010 19 th World Congress of Soil Science, Soil Solutions for a Changing World<br />
1 – 6 August 2010, Brisbane, Australia. Published on DVD.<br />
14
Nowadays in the area of different oil <strong>and</strong> gas operations in the forest zone of the KR we can separate three<br />
degrees of <strong>soil</strong> degradation under human impact:<br />
- low degree – integrity of <strong>soil</strong>s are safe but some physicochemical properties <strong>change</strong>s<br />
- middle degree – local disturbances of <strong>soil</strong> profile (upper <strong>soil</strong> horizons mainly) – mixing of <strong>soil</strong> horizons,<br />
burial some part of the <strong>soil</strong>, <strong>change</strong>s of primary <strong>soil</strong> process;<br />
- high degree – total disturbance of <strong>soil</strong> profiles, removal of organogenic horizons, outcroping <strong>soil</strong> parent<br />
material.<br />
Conclusion<br />
In this article we present main reasons for <strong>change</strong>s in forest <strong>soil</strong>s under human impact in the forest-covered<br />
area of the Komi Republic – one of Russian industrial regions. Timber industry plays a dominant role in<br />
forest <strong>soil</strong> disturbances. For middle taiga bioclimatic conditions, first years after logging are characterized<br />
by temporary <strong>soil</strong> over-moisturing. This <strong>change</strong>s not only morphological structure <strong>and</strong> physicochemical<br />
properties of cut site <strong>soil</strong>s but also HS content <strong>and</strong> composition. Traces of temporary over-moisturing remain<br />
in <strong>soil</strong> 36 years after cutting. Change in tree species (spruce for mixed birch-spruce) causes a decrease in<br />
forest litter thickness <strong>and</strong> increases its density. Slow plant waste decomposition is due to excessive moisture<br />
(mostly during first after-logging years) which produces an increasing content of water- <strong>and</strong> acid-soluble<br />
organic compounds in <strong>soil</strong> organic matter (SOM). The hydrophilic part of SOM increases which accounts for<br />
its mobility.<br />
Soils of logger-road <strong>and</strong> timber loading sites are transformed to a great extent. Physical <strong>change</strong>s in the <strong>soil</strong> of<br />
logger-roads occur down to a depth of 60 <strong>and</strong> down to 90 cm in timber loading sites. In the upper <strong>soil</strong><br />
horizons of these of <strong>soil</strong>s humus content is abruptly <strong>change</strong>d <strong>and</strong> biological activity is suppressed.<br />
Transformation <strong>soil</strong>s under the influences of oil <strong>and</strong> gas extraction <strong>and</strong> pipeline reflect the quality of work,<br />
peculiarities of l<strong>and</strong>scape <strong>and</strong> <strong>soil</strong>s properties. The three <strong>soil</strong> degradation degrees under human impact were<br />
separated. Changes in podzolic <strong>and</strong> podzolic-boggy <strong>soil</strong>s with low humus content <strong>and</strong> weak buffer value<br />
formed under middle <strong>and</strong> north taiga climatic conditions are substantial.<br />
Acknowledgements<br />
The study was financially supported by the Russian Foundation for Basic Research (project-08-04-90718<br />
mob_st) <strong>and</strong> International scientific project “OMRISK” (INCO-DC-013388) <strong>and</strong> program of Branch of<br />
biological science RAS “Biological resource of Russia: state estimate <strong>and</strong> fundamental foundations of<br />
monitoring”.<br />
References<br />
Classification <strong>and</strong> diagnostics of Russian <strong>soil</strong>s, V.V. Dokuchaev <strong>soil</strong> institute of RAAS (2004 ). 342p.<br />
(Moscow)<br />
<strong>Forest</strong>ry <strong>and</strong> forest resources of the Komi Republic (2000) (Eds GM Kozubov, AI Taskaev) 511 p.<br />
(Moscow)<br />
Kanev VV, Mokiev VV (2004) Agro sod-podzolic <strong>soil</strong> of northeast Russian plain. 228 p. (Nauka: Saint-<br />
Petersburg)<br />
Lal R (2005) <strong>Forest</strong> <strong>soil</strong>s <strong>and</strong> carbon sequestration. <strong>Forest</strong> Ecology <strong>and</strong> Management 220, 242–258.<br />
Lodygin ED, Beznosikov VA, Chykov SN (2007) Structure functional parameters of humic substances of<br />
podzolic <strong>and</strong> boggy-podzolic <strong>soil</strong>s. 145 p. (Nauka: Saint-Petersburg)<br />
Rosnovskiy IN (2001) Soil disturbance under summer lumbering in West Siberia. Lesovedenie 2, 22-26.<br />
Rusanova GV (1987) Taiga <strong>soil</strong> micromorpholodgy. 152 p. (Nauka: Leningrad)<br />
Soil <strong>and</strong> <strong>soil</strong> cover structure functional organization on the European northeast (2001) (Eds FR Zaidel’man<br />
<strong>and</strong> IV Zaboeva) 180 p. (Nauka: Saint-Petersburg)<br />
Solntseva NP (1998) Oil mining <strong>and</strong> geochemical transformation of l<strong>and</strong>scapes. 376 p (Moscow)<br />
State report (2009) Environment state of the Komi Republic in 2008. 110 p. (Syktyvkar)<br />
Theory <strong>and</strong> practice of <strong>soil</strong> chemical analysis (2005). 400 p (Moscow)<br />
Zaboeva IV (1975) Soils <strong>and</strong> l<strong>and</strong> resources of Komi ASSR. 350 p. (Syktyvkar)<br />
© 2010 19 th World Congress of Soil Science, Soil Solutions for a Changing World<br />
1 – 6 August 2010, Brisbane, Australia. Published on DVD.<br />
15
Changes in <strong>soil</strong> chemistry following a watershed-scale application of wollastonite<br />
(CaSiO3) at Hubbard Brook, New Hampshire, USA<br />
Chris E. Johnson A,B , Charles T. Driscoll A , <strong>and</strong> Youngil Cho A<br />
A Dept. of Civil <strong>and</strong> Environmental Engineering, Syracuse University, Syracuse, NY, 13244, USA.<br />
B Corresponding author. Email cejohns@syr.edu<br />
Abstract<br />
Decades of acidic deposition in the northeastern United States is believed to have caused the loss of<br />
substantial amounts of calcium from forest <strong>soil</strong>s. This process of ‘calcium depletion’ affected the chemistry<br />
of drainage waters in the region <strong>and</strong> may have impacted forest health. To study this phenomenon, we<br />
applied 45 Mg of wollastonite (1316 kg Ca ha -1 ) to watershed 1 (W1) at the Hubbard Brook Experimental<br />
<strong>Forest</strong>, in New Hampshire, USA in October, 1999. Ex<strong>change</strong>able Ca (1 M NH4Cl) <strong>and</strong> <strong>soil</strong> pH increased<br />
significantly in the Oie <strong>and</strong> Oa horizons, <strong>and</strong> in the top 10 cm of the mineral <strong>soil</strong>, in samples collected 1, 3,<br />
<strong>and</strong> 7 years after treatment. Ex<strong>change</strong>able acidity (1 M KCl) decreased significantly in the Oie <strong>and</strong> Oa<br />
horizons after treatment, but the effect in the upper mineral <strong>soil</strong> was not clear. Base saturation <strong>and</strong> effective<br />
cation ex<strong>change</strong> capacity (CECe) increased significantly after wollastonite application in all layers studied,<br />
primarily on the strength of the increased ex<strong>change</strong>able Ca. We did not observe compensatory decreases in<br />
ex<strong>change</strong>able Al, or other ex<strong>change</strong>able cations, as initially hypothesized. Therefore, while wollastonite<br />
addition has improved the base status of W1 <strong>soil</strong>s, it has not resulted in decreases in ex<strong>change</strong>able Al.<br />
Key Words<br />
Soil acidity, acid rain, base saturation, calcium, cation ex<strong>change</strong>, liming.<br />
Introduction<br />
Acidic deposition, primarily in the form of sulfuric <strong>and</strong> nitric acid, has resulted in the acidification of <strong>soil</strong>s<br />
<strong>and</strong> surface waters of the northeastern United States, <strong>and</strong> many other regions of the world. There is a<br />
growing consensus that this acidification has resulted in the depletion of available calcium from many basepoor<br />
<strong>soil</strong>s (Likens et al. 1996; Driscoll et al. 2001). Soil calcium depletion may partly explain the sluggish<br />
response of surface waters in the northeastern United States to recent decreases in acidic deposition, <strong>and</strong> may<br />
also be related to declining forest health in the region (Warby et al. 2005; Hawley et al. 2006). To study<br />
these relationships, we initiated a watershed-level experiment in which calcium was added to the <strong>soil</strong> in the<br />
form of wollastonite (CaSiO3), to replace the calcium believed to have been lost from the <strong>soil</strong> during the<br />
period of chronic acid rain. Unlike liming studies, we used calcium silicate because silicate weathering is the<br />
dominant weathering process in the base poor <strong>soil</strong>s at our study site. The use of silicates also avoids the<br />
introduction of large amounts of alkalinity that accompanies the use of calcium carbonate lime.<br />
This study is an ecosystem-level investigation of the response of vegetation, <strong>soil</strong>s, fauna, <strong>and</strong> drainage waters<br />
to the addition of wollastonite. The objective of this presentation is to report the effects of the treatment on<br />
<strong>soil</strong> chemistry, particularly the acid-base status of the <strong>soil</strong>s, as indexed by ex<strong>change</strong>able Ca, Al, cation<br />
ex<strong>change</strong> capacity, base saturation, <strong>and</strong> pH. The results presented here extend the work of Cho et al. (In<br />
Press), which may be consulted for details of experimental design, sampling, <strong>and</strong> analysis.<br />
Methods<br />
Site Description<br />
This work was done at the Hubbard Brook Experimental <strong>Forest</strong>, in the southern portion of the White<br />
Mountain National <strong>Forest</strong> in central New Hampshire, USA. The treated watershed – watershed 1 (W1) has<br />
an area of 11.8 ha <strong>and</strong> an elevation range from 488 m to 747 m. The <strong>soil</strong>s at the HBEF are predominately<br />
Spodosols (Typic Haplorthods) derived from glacial till, <strong>and</strong> the average depths of the organic <strong>and</strong> the<br />
mineral <strong>soil</strong>s are 7 cm <strong>and</strong> 50 cm, respectively. The dominant vegetation type on W1 consists of northern<br />
hardwood species (sugar maple (Acer saccharum), American beech (Fagus gr<strong>and</strong>ifolia) <strong>and</strong> yellow birch<br />
(Betula alleghaniensis)) on the lower 90 % of the watershed, <strong>and</strong> a montane boreal transition forest of red<br />
spruce (Ricea rubens), balsam fir (Abies balsamea) <strong>and</strong> white birch (Betula papyrifera) at high elevation.<br />
The climate at the HBEF is humid-continental, characterized by long, cold winters (average temperature for<br />
January is –9 o C) <strong>and</strong> short cool summers (average for July is 10 o C) with 1,400 mm of average annual<br />
© 2010 19 th World Congress of Soil Science, Soil Solutions for a Changing World<br />
1 – 6 August 2010, Brisbane, Australia. Published on DVD.<br />
16
precipitation, approximately 30% of which falls as snow.<br />
The experimental addition of wollastonite to W1 was designed to restore the base saturation of the <strong>soil</strong> to a<br />
level estimated to have existed at the advent of acidic deposition. Theoretically, the amount of Ca required to<br />
restore the overall base saturation of W1 <strong>soil</strong>s from 10% to 19% was approximately 850 kg Ca/ha, equivalent<br />
to 30.2 tons of wollastonite over the area of W1. To account for potential losses or inefficiencies in<br />
wollastonite dissolution, a “safety factor” of 50% was added to the dose, resulting in an application of 45<br />
tons of wollastonite, or 1,316 kg Ca/ha. The wollastonite was pelletized into 1.5 – 4 mm diameter pellets<br />
with a water-soluble binder, which allowed the pellets to disintegrate to individual particles (mean diameter<br />
16 ㎛) in the presence of moisture after the manipulation (Peters et al. 2004). The application was made in<br />
October of 1999, after leaf fall, by helicopter, <strong>and</strong> was determined to be remarkably uniform across the<br />
watershed (Peters et al. 2004).<br />
Soil sampling <strong>and</strong> analyses<br />
Soil samples were collected at 100 r<strong>and</strong>omly selected sites in W1 prior to (1998) <strong>and</strong> after (2000, 2002, <strong>and</strong><br />
2006) the treatment. Soil samples were collected from the Oi+Oe (Oie) <strong>and</strong> Oa layers, using 15 cm x 15 cm<br />
forest floor blocks. After the O horizon sampling, the upper mineral <strong>soil</strong> was sampled using a 5-cm diameter<br />
stainless steel corer. The depth of the cores was a maximum of 10 cm, but often less due to refusal of the<br />
corer by rocks.<br />
The <strong>soil</strong> samples from the Oie horizons were oven dried at 80 o C to a constant weight, <strong>and</strong> ground in a Wiley<br />
mill. Samples from the Oa <strong>and</strong> upper mineral horizon were air dried, weighed, <strong>and</strong> sieved through 5-mm <strong>and</strong><br />
2-mm stainless steel screens, respectively. All <strong>soil</strong> samples were analyzed for pHs (0.01 M CaCl2).<br />
Ex<strong>change</strong>able cations (Ca, Mg, K, Na, Al) were extracted with 1 M NH4Cl. Ex<strong>change</strong>able acidity was<br />
determined by titration of 1 M KCl extracts to a phenolphthalein end-point. Effective cation ex<strong>change</strong><br />
capacity (CECe) was calculated as the sum of ex<strong>change</strong>able acidity <strong>and</strong> ex<strong>change</strong>able Ca, K, <strong>and</strong> Mg (Na<br />
was negligible in the extracts). Effective base saturation (BSe) was computed as the sum of ex<strong>change</strong>able<br />
bases, divided by the CECe <strong>and</strong> multiplied by 100.<br />
Table 1. Changes in <strong>soil</strong> chemistry after wollastonite (CaSiO3) addition to watershed 1 at the Hubbard Brook<br />
Experimental <strong>Forest</strong>, New Hampshire, USA.<br />
Property Horizon Pre-Treatment Post-Treatment<br />
1998 2000 2002 2006<br />
Oie 5.62 24.4 34.7 33.9<br />
Exch. Ca (cmolc /kg) Oa 4.44 4.94 11.1 14.2<br />
Mineral 0.58 0.65 0.85 1.74<br />
Oie 1.13 0.84 0.87 0.86<br />
Exch. Al (cmolc /kg) Oa 6.90 7.07 5.29 3.89<br />
Mineral 6.19 5.26 6.02 5.22<br />
Oie 8.41 5.69 5.11 5.83<br />
Exch. Acidity (cmolc /kg) Oa 11.9 11.6 8.48 6.58<br />
Mineral 7.79 6.68 7.71 6.43<br />
Oie 16.2 32.7 43.6 44.4<br />
CECe (cmolc /kg) Oa 18.0 18.2 21.4 22.7<br />
Mineral 8.80 7.68 8.96 8.67<br />
Oie 48.7 78.6 86.1 86.9<br />
BSe (%) Oa 32.9 35.8 56.0 71.0<br />
Mineral 12.1 13.1 14.3 25.8<br />
Oie <strong>3.2</strong>6 4.21 4.34 4.23<br />
pHs Oa 3.03 <strong>3.2</strong>4 3.48 3.62<br />
Mineral 3.35 3.47 3.44 3.50<br />
Results<br />
After wollastonite addition to W1, the pH <strong>and</strong> ex<strong>change</strong>able Ca concentration in the <strong>soil</strong>s increased<br />
significantly (Table 1). Ex<strong>change</strong>able acidity <strong>and</strong> ex<strong>change</strong>able Al decreased significantly, though the<br />
magnitudes of these decreases were less than the increase in ex<strong>change</strong>able Ca. Consequently, wollastonite<br />
addition resulted in significant increases in both CECe <strong>and</strong> BSe. Soil pH increased by nearly a whole pH unit<br />
in the Oie horizon, <strong>and</strong> 0.6 pH units in the Oa horizon.<br />
The magnitude <strong>and</strong> timing of the <strong>change</strong>s in <strong>soil</strong> chemistry were strongly related to <strong>soil</strong> horizon. For<br />
© 2010 19 th World Congress of Soil Science, Soil Solutions for a Changing World<br />
1 – 6 August 2010, Brisbane, Australia. Published on DVD.<br />
17
example, seven years after treatment, ex<strong>change</strong>able Ca had increased by a factor of 6 in the Oie horizon,<br />
compared to a factor of 3 in the Oa <strong>and</strong> mineral horizons. Most of the increase in ex<strong>change</strong>able Ca in the Oie<br />
horizon occurred in the first year after treatment, whereas in the Oa <strong>and</strong> mineral horizons, it took 3 <strong>and</strong> 7<br />
years, respectively, for the <strong>change</strong>s to be apparent (Table 1).<br />
Discussion<br />
The <strong>soil</strong> chemistry data suggest that the dissolution of the wollastonite added to W1 has resulted in an<br />
increase in the base status of <strong>soil</strong>s which is progressive in time <strong>and</strong> space. Large increases in ex<strong>change</strong>able<br />
Ca <strong>and</strong> base saturation occurred almost immediately in the Oie horizon, whereas increases in the Oa <strong>and</strong><br />
mineral horizons occurred progressively later. These results are consistent with continuing dissolution of the<br />
added wollastonite <strong>and</strong> downward migration of the weathering products.<br />
We had initially hypothesized that Ca released by the weathering of the wollastonite would displace Al <strong>and</strong><br />
H from <strong>soil</strong> ex<strong>change</strong> sites. Our data indicate that this did occur to an extent. Ex<strong>change</strong>able Al <strong>and</strong> acidity<br />
both decreased significantly after wollastonite addition. However, the magnitude of these decreases was<br />
much smaller than increases in ex<strong>change</strong>able Ca. For example, in the Oa horizon, ex<strong>change</strong>able Ca increased<br />
from 4.44 cmolc /kg prior to wollastonite, to 14.2 cmolc /kg seven years later (Table 1). In contrast,<br />
ex<strong>change</strong>able acidity decreased by only half that amount, from 11.9 to 6.58 cmolc /kg. Because of this nonstoichiometric<br />
ex<strong>change</strong>, wollastonite addition resulted in a significant increase in the effective CEC in the <strong>soil</strong>.<br />
The increase in CECe that we observed is consistent with increase in pH observed in W1 <strong>soil</strong>s. Organic<br />
matter provides nearly all of the cation ex<strong>change</strong> capacity in <strong>soil</strong>s at Hubbard Brook, <strong>and</strong> elsewhere in the<br />
region (Johnson 2002).<br />
Conclusions<br />
Wollastonite addition resulted in persistent increases in the base status of <strong>soil</strong>s at Hubbard Brook. Our results<br />
suggest that wollastonite may be a good alternative to traditional lime as a potential amendment for acidified<br />
<strong>soil</strong>s in the northeastern United States. Wollastonite appears to offer a long-lasting release of Ca without the<br />
alkalinity ‘shock’ produced by lime.<br />
References<br />
Cho Y, Driscoll CT, Johnson CE, Siccama TG (In press) Chemical <strong>change</strong>s in <strong>soil</strong> <strong>and</strong> <strong>soil</strong> solution after<br />
calcium silicate addition to a northern hardwood forest. Biogeochemistry<br />
Driscoll CT, Lawrence GB, Bulger AA, Butler TJ, Cronan CS, Eagar C, Fallon Lambert K, Likens GE,<br />
Stoddard JL, Weathers KC (2001) Acidic deposition in the northeastern United States: sources <strong>and</strong> inputs,<br />
ecosystem effects, <strong>and</strong> management strategies. BioScience 51, 180-198<br />
Hawley GJ, Schaberg PG, Eagar C, Borer CH (2006) Calcium addition at the Hubbard Brook Experimental<br />
<strong>Forest</strong> reduced winter injury to red spruce in a high-injury year. Canadian Journal of <strong>Forest</strong> Research 36,<br />
2544-2549<br />
Johnson CE (2002) Cation ex<strong>change</strong> properties of acid forest <strong>soil</strong>s of the northeastern USA. European<br />
Journal of Soil Science 53, 241-282<br />
Likens GE, Driscoll CT, Buso DC (1996) Long-term effects of acid rain: response <strong>and</strong> recovery of a forest<br />
ecosystem. Science 272, 244-246<br />
Peters SC, Blum JD, Driscoll CT, Likens GE (2004) Dissolution of wollastonite during the experimental<br />
manipulation of Hubbard Brook Watershed 1. Biogeochemistry 67, 309-329<br />
Warby RAF, Driscoll CT, Johnson CE (2005) Chemical recovery of surface waters across the Northeastern<br />
United States from reduced inputs of acidic deposition: 1984-2001. Environmental Science <strong>and</strong><br />
Technology 39, 6548-6554<br />
© 2010 19 th World Congress of Soil Science, Soil Solutions for a Changing World<br />
1 – 6 August 2010, Brisbane, Australia. Published on DVD.<br />
18
Changes in <strong>soil</strong> chemistry in the surroundings of wood ant (Formica polyctena)<br />
nests<br />
Veronika Jilkova A, C <strong>and</strong> Jan Frouz A,B<br />
A Institute of Soil Biology, Biological Centre ASCR, Ceske Budejovice, Czech Republic.<br />
B Institute of Environmental Studies, Charles University, Prague, Czech Republic, Email frouz@natur.cuni.cz<br />
C Corresponding author. Email jilkova.veronika@gmail.com<br />
Abstract<br />
Several previous studies reported on how the chemistry of the wood ant nest differs from the chemistry of<br />
the surrounding <strong>soil</strong>. In this contribution, we focused on <strong>change</strong>s in <strong>soil</strong> chemistry with distance from the<br />
nest. Soil samples 0-5cm deep were taken in a grid pattern at 1-19m from eight Formica polyctena nests in a<br />
spruce forest in the Czech Republic. Soil pH decreased with distance; pH decreased rapidly between 1 to<br />
about 8m <strong>and</strong> then decreased more slowly. The decrease in pH corresponded with the increase in organic<br />
matter content with distance from the nest because pH was negatively correlated with organic matter content.<br />
Organic matter content was significantly <strong>and</strong> positively correlated with available Ca <strong>and</strong> K, i.e., available Ca<br />
<strong>and</strong> K increased with distance from the nest. The <strong>change</strong>s in organic matter content, pH, <strong>and</strong> available Ca<br />
<strong>and</strong> K were apparently caused by ants collecting <strong>and</strong> using needles as building material.<br />
Key Words<br />
Biogeochemistry, basic cations, litter, nutrients.<br />
Introduction<br />
The group of wood ants includes dominant species of ants in boreal forest ecosystem (Dlusskij 1967). They<br />
are known for their large <strong>and</strong> long-lived colonies that may count several millions of individuals (Seifert<br />
1996). Although the material used for nest building comes from the nest surroundings, <strong>soil</strong> properties of the<br />
nest are rather distinct from surrounding litter <strong>and</strong> <strong>soil</strong> (Dlusskij 1967; Frouz <strong>and</strong> Jilkova 2008; Jurgensen et<br />
al. 2008).<br />
Through their activities, ants <strong>change</strong> physical, chemical <strong>and</strong> also biological properties of the <strong>soil</strong> (Boulton et<br />
al. 2003; Dlusskij 1967; Petal 1980). One of the <strong>change</strong>d <strong>soil</strong> properties is pH. pH affects nutrient<br />
availability to plants, compound solubility <strong>and</strong> also activity of microorganisms (Brady <strong>and</strong> Weil 2001).<br />
However, the range <strong>and</strong> cause of variation in pH between ant nests <strong>and</strong> their surroundings has not been<br />
completely revealed yet. In this study we tested the variance in pH <strong>and</strong> also other <strong>soil</strong> properties with the<br />
distance from the ant nests <strong>and</strong> we focused on influence of organic matter content <strong>and</strong> content of basic<br />
cations on pH.<br />
Methods<br />
Study site <strong>and</strong> sampling design<br />
This study was conducted in a spruce forest (Picea abies) near Tabor (Czech Republic). Soil samples 0-5 cm<br />
deep were taken in a regular grid pattern (2 x 2m) in a rectangular area (4m wide <strong>and</strong> 20m long) in the close<br />
vicinity of the eight Formica polyctena nests. 33 <strong>soil</strong> samples were taken in each grid, 264 in total.<br />
Quantifying of <strong>soil</strong> properties<br />
Soil pH, organic matter content, available Ca, K, Mg <strong>and</strong> Na <strong>and</strong> humic acid composition were studied. Soil<br />
pH was measured in a 1:5 <strong>soil</strong>: water suspension by glass electrode. Basic cations (Ca 2+ , Mg 2+ , Na + , <strong>and</strong> K + )<br />
were extracted in 1:4 <strong>soil</strong>:Mehlich I solution (Mehlich 1953) <strong>and</strong> quantified by atomic absorption<br />
spectrophotometry with use of SpectrAA 640 at 420.7 nm (Varian, Inc. USA). Organic matter content was<br />
determined based on ignition loss after 5 hours in 600°C. Humic <strong>and</strong> fulvic acids were extracted for 12 h in 1<br />
N NaOH (1:20 <strong>soil</strong>:NaOH); the samples then were diluted with deionized water (1:1), <strong>and</strong> humic <strong>and</strong> fulvic<br />
acid were measured using ELISA (Multi-Detection Microplate Reader, Synergy TM 2, BioTek) at 474 <strong>and</strong> 666<br />
nm, respectively, <strong>and</strong> with NaOH diluted in deionized water (1:1) as a blank.<br />
© 2010 19 th World Congress of Soil Science, Soil Solutions for a Changing World<br />
1 – 6 August 2010, Brisbane, Australia. Published on DVD.<br />
19
Statistics<br />
For correlation of individual chemical parameters with distance from the nest, 2-D Euclidean distance<br />
between the nest centre (at ground level) <strong>and</strong> individual sampling points was calculated. Correlations were<br />
also calculated between individual chemical parameters measured <strong>and</strong> between residuals of the regression<br />
between pH <strong>and</strong> organic matter content.<br />
Results<br />
Soil pH decreases significantly with increasing distance from the ant nest (Figure 1a). This tendency is<br />
pronounced up to circa 8 m from the nest. Soil pH is significantly negatively correlated with <strong>soil</strong> organic<br />
matter content (Figure 1b), which shows significant positive correlation with distance from the nest (Figure<br />
1c). This dependence is rather logaritmic, the distance the organic matter content most increases to is also<br />
circa 8 m from the nest. There are also other <strong>soil</strong> properties which have the influence on pH. If we take the<br />
residuals of correlation between pH <strong>and</strong> organic matter content, there is a negative correlation of these<br />
residuals with distance from the nest <strong>and</strong> content of humic <strong>and</strong> fulvic acids, while available Ca <strong>and</strong> K content<br />
show positive correlation with residuals (Table 1). With the distance from the nest <strong>change</strong> not only pH <strong>and</strong><br />
organic matter content but also other <strong>soil</strong> properties, such as available Ca <strong>and</strong> K content <strong>and</strong> content of<br />
humic <strong>and</strong> fulvic acids (Table 1). Organic matter also influences contents of many other <strong>soil</strong> properties.<br />
There is a positive correlation between organic matter content <strong>and</strong> content of available Ca, Mg, Na <strong>and</strong> K<br />
<strong>and</strong> also content of humic <strong>and</strong> fulvic acids (Table 1).<br />
Table 1. Correlation between individual parameters measured in <strong>soil</strong> surrounding eight F. polyctena nests. For<br />
each nest, 33 <strong>soil</strong> samples located 1 to 19 m from the nest were collected. The correlations are based on 264<br />
samples. Correlation coefficients are shown only for significant correlations (p
Discussion<br />
It seems that pH <strong>change</strong>s are connected with <strong>change</strong>s in organic matter content. pH is strongly negatively<br />
correlated with organic matter content <strong>and</strong> so decrease in pH with distance from the nest seems to be caused<br />
by increasing organic matter content. Similar results shows Frouz et al. (2003). Although organic matter<br />
content explains a large portion of data variability, a significant portion of data variability remains<br />
unexplained. This portion correlates negatively with both humic <strong>and</strong> fulvic acid content <strong>and</strong> positively with<br />
basic cation (Ca <strong>and</strong> K) content. The negative correlation with humic acid is not surprising given that humus<br />
in coniferous <strong>soil</strong> is typically highly acidic (Brady <strong>and</strong> Weil 2001). Similarly, the positive correlation with<br />
basic cations is not surprising because such cations act in the cation ex<strong>change</strong> complex <strong>and</strong> thereby tend to<br />
increase <strong>soil</strong> pH (Brady <strong>and</strong> Weil 2001).<br />
Content of basic cations strongly correlates with organic matter content <strong>and</strong> increases with increasing<br />
distance from the nest. Based on this study <strong>and</strong> previous literature data (Domisch et al. 2009; Frouz et al.<br />
1997), we expect that cation enrichment in the nest <strong>and</strong> depletion in surroundings are given by two different<br />
mechanisms. We expect that nutrient enrichment in the nest is mostly caused by accumulation of food<br />
residues <strong>and</strong> excreta. Enrichment of the nest in close surroundings by basic cations can be the reason why<br />
these cations significantly explain residuals of pH after the effect of organic matter was removed. Depletion<br />
of nutrients in nest surroundings is connected with removal of needles, small branches <strong>and</strong> other litter particles<br />
which are used for nest building. Similarly these two mechanisms seem to affect pH around the nest.<br />
Conclusion<br />
Changes in pH seem to be caused by <strong>change</strong>s in organic matter content <strong>and</strong> content of basic cations <strong>and</strong><br />
humic <strong>and</strong> fulvic acids. Ants are most probably responsible for these <strong>change</strong>s through their activities.<br />
Acknowledgements<br />
This study was supported by research plan of Institute of <strong>soil</strong> biology BC ASCR AV0Z60660521.<br />
References<br />
Boulton AM, Jaffee BA, Scow KM (2003) Effects of a common harvester ant (Messor <strong>and</strong>rei) on richness<br />
<strong>and</strong> abundance of <strong>soil</strong> biota. Applied Soil Ecology 23, 257-265.<br />
Brady NC, Weil RR (2001) ‘The Nature <strong>and</strong> Properties of Soils.’ (Prentice-Hall: New York).<br />
Dlusskij GM (1967) ‘Muravji Roda Formica.’ (Nauka: Moskva).<br />
Domisch T, Finer L, Neuvonen S, Niemela P, Risch AC, Kilpelainen J, Ohashi M, Jurgensen MF (2009)<br />
Foraging activity <strong>and</strong> dietary spectrum of wood ants (Formica rufa group) <strong>and</strong> their role in nutrient fluxes<br />
in boreal forests. Ecological Entomology 34, 369-377.<br />
Frouz J, Jilkova V (2008) The effect of ants on <strong>soil</strong> properties <strong>and</strong> <strong>processes</strong> (Hymenoptera: Formicidae).<br />
Myrmecological News 11, 191-199.<br />
Frouz J, Santruckova H, Kalcik J (1997) The effect of wood ants (Formica polyctena Foerst.) on the<br />
transformation of phosphorus in a spruce plantation. Pedobiologia 41, 437-447.<br />
Jurgensen MF, Finer L, Domisch T, Kilpelainen J, Punttila P, Ohashi M, Niemela P, Sundstrom L,<br />
Neuvonen S, Risch AC (2008) Organic mound-building ants: their impact on <strong>soil</strong> properties in temperate<br />
<strong>and</strong> boreal forest. Journal of Applied Entomology 132, 266-275.<br />
Petal J (1980) Ant populations, their regulation <strong>and</strong> effect on <strong>soil</strong> in meadows. Ekologia Polska – Polish<br />
Journal of Ecology 28, 297-326.<br />
Seifert B (1996) ‘Ameisen: Beobachten, Bestimmen.’ (Naturbuch-Verlag: Ausburg).<br />
© 2010 19 th World Congress of Soil Science, Soil Solutions for a Changing World<br />
1 – 6 August 2010, Brisbane, Australia. Published on DVD.<br />
21
Comparison of <strong>soil</strong> microbial biomass C, N <strong>and</strong> P between natural secondary<br />
forests <strong>and</strong> Larix olgensis plantations under temperate climate<br />
Jiaojun Zhu, Kai Yang, QiaolingYan <strong>and</strong> Changjie Jin<br />
Institute of Applied Ecology, Chinese Academy of Sciences, China, Emails: jiaojunzhu@iae.ac.cn; yk@dlnu.edu.cn;<br />
yanqiaoling1978@126.com; cjjin@iae.ac.cn<br />
Abstract<br />
Conversion of natural secondary forests (NSF) to mono-cultural Larix olgensis plantations (LOP) is a<br />
common forest management driven by an increasing dem<strong>and</strong> for timber. To assess the impact of conversion<br />
of NSFs to LOPs on <strong>soil</strong> microbial properties under temperate climate, the microbial biomass carbon (MBC),<br />
microbial biomass nitrogen (MBN) <strong>and</strong> microbial biomass phosphorus (MBP) were compared between NSF<br />
st<strong>and</strong>s <strong>and</strong> LOP st<strong>and</strong>s in Northeast China. The results indicated that the MBC, MBN <strong>and</strong> MBP were<br />
significantly lower in LOP st<strong>and</strong>s than in NSF st<strong>and</strong>s for both 0-15 cm <strong>and</strong> 15-30 cm <strong>soil</strong> layers. The<br />
percentage ratios of MBC, MBN, <strong>and</strong> MBP to <strong>soil</strong> organic C, total N or total P were significantly reduced in<br />
LOP st<strong>and</strong>s; <strong>and</strong> they varied with time during the growing season significantly. The increase of microbial<br />
biomass in summer may be an important retention mechanism for conserving <strong>soil</strong> nutrients in the studied<br />
area. The above mentioned results suggest that NSF st<strong>and</strong>s are better in conserving <strong>soil</strong> microbial biomass<br />
<strong>and</strong> nutrient than those of LOP st<strong>and</strong>s.<br />
Key Words<br />
Microbial biomass carbon, nitrogen, P, Natural secondary forest, Larch plantation forest.<br />
Introduction<br />
Soil microbial biomass, both a source <strong>and</strong> sink of available nutrients for plants, plays a critical role in<br />
nutrient transformation in terrestrial ecosystems (Singh et al. 1989). Any <strong>change</strong>s in the microbial biomass<br />
may affect the cycling of <strong>soil</strong> organic matter. Thus, the <strong>soil</strong> microbial activity has a direct influence on<br />
ecosystem stability <strong>and</strong> fertility (Smith et al. 1993). Generally, microbial biomass can offer a means in<br />
assessing the <strong>soil</strong> quality in different vegetation types (Groffman et al. 2001).<br />
Mixed broadleaved-Korean pine forest is one of the most important regional climax forest types in Northeast<br />
China, of which more than 70% have become natural secondary forest (NSF) after a century of timber<br />
exploitation (Zhu et al. 2007). To meet the growing dem<strong>and</strong>s for timber, many of the NSFs have been<br />
replaced by larch plantations (LOP) with fast-growing <strong>and</strong> high-yield reputation. Given the extensive<br />
coverage <strong>and</strong> economic value, the LOPs have in recent years attracted much attention in their role for<br />
contributing to ecosystem service as well as timber production (Zhu et al. 2007). However, decline in yield<br />
<strong>and</strong> <strong>soil</strong> fertility occurs in the LOPs. Generally, <strong>soil</strong> microbial biomass has been considered as the major<br />
indicator in the evaluation of <strong>soil</strong> restoration (Ross et al. 1982). Some researchers have found that <strong>soil</strong><br />
microbial biomass decreased in the plantations in comparison with the natural forests in tropical <strong>and</strong><br />
subtropical forest ecosystems (Behera <strong>and</strong> Sahani 2003). However, little information is available about the<br />
impacts NSFs <strong>and</strong> LOPs on <strong>soil</strong> microbial properties in the temperate forest ecosystems. In order to<br />
underst<strong>and</strong> the mechanism of the yield <strong>and</strong> <strong>soil</strong> fertility decline in LOPs, <strong>and</strong> to maintain the long-term<br />
productivity of these forest <strong>soil</strong>s, the impacts of forest conversion from NSF to LOP on <strong>soil</strong> microbial<br />
biomass under temperate climate were tested because the microbiological indicators have been applied by<br />
researchers in number studies of <strong>soil</strong> restoration in forest ecosystems (Wang <strong>and</strong> Wang 2007).<br />
Methods<br />
Site description <strong>and</strong> experimental design<br />
The study was conducted at the Qingyuan Experimental Station of <strong>Forest</strong> Ecology, Institute of Applied<br />
Ecology, Chinese Academy of Sciences. The station is located in a mountainous region in the eastern<br />
Liaoning Province, Northeast China (41º51' N, 124º54' E, 500-1100 m a.s.l.). It is a continental monsoon<br />
type with a humid <strong>and</strong> rainy summer, <strong>and</strong> a cold <strong>and</strong> dry winter. The monthly mean temperature <strong>and</strong><br />
precipitation in the growing season of 2008 are shown in Table 1. The brown forest <strong>soil</strong> belongs to Udalfs<br />
according to U.S. Soil Taxonomy.<br />
The study site was originally occupied by primary mixed broadleaved-Korean pine forests until 1930s <strong>and</strong><br />
subsequently subjected to decades of unregulated timber removal. A large fire that occurred in the early<br />
1950s completely cleared off the original forests <strong>and</strong> the site was replaced by a mixture of naturally<br />
© 2010 19 th World Congress of Soil Science, Soil Solutions for a Changing World<br />
1 – 6 August 2010, Brisbane, Australia. Published on DVD.<br />
22
egenerating broadleaved native tree species (secondary forests). Since 1960s, patches of the NSFs were<br />
cleared for larch plantations. The sample plots were set up on three NSF st<strong>and</strong>s <strong>and</strong> three LOP st<strong>and</strong>s with<br />
ages 16- 44 years. The six st<strong>and</strong>s have the same topographical features <strong>and</strong> are on <strong>soil</strong>s developed from the<br />
same parental materials. In each of the st<strong>and</strong>s, three 20 × 20 m plots were laid out in September 2006. The<br />
NSF plots consisted of Juglans m<strong>and</strong>shurica, Quercus mongolica, Acer mono <strong>and</strong> Fraxinus rhynchophylla in<br />
the tree layer, A. triflorun, A. tegmentosum <strong>and</strong> Syringa amurensis in the understory component. The LOP<br />
plots contain Acer tegmentosum, A. pseudo-sieboldianum <strong>and</strong> Schis<strong>and</strong>ra chinensis in the shrub layer.<br />
Table 1. Monthly mean air temperature <strong>and</strong> precipitation in the study area in 2008<br />
Month Apr May Jun Jul Aug Sep Oct<br />
Temperature (Celsius degree) 9.90 13.04 16.38 20.27 18.07 16.09 11.55<br />
Precipitation (mm) 58.6 161.3 158.3 264.4 185.1 31.8 19.2<br />
Soil sampling <strong>and</strong> analyses<br />
Soil samples were collected from the plots in April, July <strong>and</strong> September 2008, representing spring, summer<br />
<strong>and</strong> autumn seasons respectively. Litter was removed before sampling. Nine <strong>soil</strong> samples were r<strong>and</strong>omly<br />
collected from 0 to 15 cm <strong>and</strong> 15-30 cm depths at each plot <strong>and</strong> mixed thoroughly to obtain a homogeneous<br />
sample for each <strong>soil</strong> depth. The mixed <strong>soil</strong> sample was divided into two parts. One was sieved through a 2-<br />
mm mesh immediately <strong>and</strong> stored at 4 ℃ until analysis for the estimation of microbial biomass C (MBC),<br />
microbial biomass N (MBN) <strong>and</strong> microbial biomass P (MBP). The other was air-dried <strong>and</strong> passed through a<br />
0.25 mm sieve for the analyses of <strong>soil</strong> organic C (SOC), total N (TN) <strong>and</strong> total P (TP). SOC <strong>and</strong> TN were<br />
analyzed by dry combustion on a Vario EL Ⅲ elemental analyzer (Germany). The TP was determined<br />
following H2SO4-HClO4 digestion (Olsen <strong>and</strong> Sommers 1982). MBC, MBN <strong>and</strong> MBP were determined by<br />
fumigation-extraction method (Vance et al. 1987).<br />
Statistical analyses<br />
All observed data are expressed on air-dry <strong>soil</strong> weight basis. Statistical analyses were performed by using the<br />
SPSS 11.5 for Windows. One-way ANOVA was performed by <strong>soil</strong> layers, <strong>and</strong> LSD’s (least significant<br />
difference) test was applied post hoc to distinguish the differences of <strong>soil</strong> chemical properties between NSF<br />
<strong>and</strong> LOP. The three-way analyses of variance (three-way ANOVA) was used to compare the general effects<br />
of forest types, sampling seasons <strong>and</strong> <strong>soil</strong> layers on microbial biomass C, N <strong>and</strong> P.<br />
Results<br />
Soil chemical properties<br />
SOC concentration was higher in the NSF than in the LOP for 0-15 cm <strong>soil</strong> layer (P
st<strong>and</strong>s (Figure 2). These ratios showed significant variations in sampling seasons both in NSF <strong>and</strong> LOP<br />
st<strong>and</strong>s, which were higher in summer than those in spring <strong>and</strong> autumn (Figure 2).<br />
MBC concentration<br />
(mg kg -1 )<br />
A 900<br />
600<br />
300<br />
0<br />
spring summer autumn<br />
Season<br />
© 2010 19 th World Congress of Soil Science, Soil Solutions for a Changing World<br />
1 – 6 August 2010, Brisbane, Australia. Published on DVD.<br />
B<br />
MBN concentration<br />
(mg kg -1 )<br />
80<br />
60<br />
40<br />
20<br />
0<br />
spring summer autumn<br />
Season<br />
60<br />
40<br />
20<br />
0<br />
spring summer autumn<br />
Season<br />
Figure 1. Microbial biomass C, N <strong>and</strong> P in <strong>soil</strong>s of natural secondary forests (NSF) <strong>and</strong> Larix olgensis<br />
plantations (LOP) at different seasons. A: MBC, B: MBN, C: MBP (Vertical bars indicated the st<strong>and</strong>ard errors)<br />
A<br />
MBC/ TOC (%)<br />
3.00<br />
2.00<br />
1.00<br />
0.00<br />
spring summer autumn<br />
Season<br />
B<br />
MBN/ TN (%)<br />
2.50<br />
2.00<br />
1.50<br />
1.00<br />
0.50<br />
0.00<br />
spring summer autumn<br />
Season<br />
C<br />
MBP concentration<br />
(mg kg -1 )<br />
8.00<br />
6.00<br />
4.00<br />
2.00<br />
0.00<br />
spring summer autumn<br />
Season<br />
Figure 2. The ratios of MBC/SOC (A), MBN/TN (B) <strong>and</strong> MBP/TP (C) in the <strong>soil</strong>s of natural secondary forest<br />
(NSF) <strong>and</strong> Larix olgensis plantation (LOP) at different seasons (Vertical bars indicated the st<strong>and</strong>ard errors)<br />
Results from three-way ANOVA demonstrated that both forest types <strong>and</strong> sampling seasons had significant<br />
effects on MBC concentrations <strong>and</strong> the ratios of MBC/SOC, MBN/TN <strong>and</strong> MBP/TP. The <strong>soil</strong> MBN <strong>and</strong><br />
MBP were significantly affected by forest types as well; but they were not significantly influenced by the<br />
sampling seasons (Table 3). The concentrations of MBC, MBN <strong>and</strong> MBP were all varied with the <strong>soil</strong> depth.<br />
There was a significant interaction between forest type <strong>and</strong> <strong>soil</strong> depth for MBC, MBN <strong>and</strong> MBP (Table 3).<br />
Table 3. Results of three-factors ANOVA (<strong>soil</strong> depth, forest type <strong>and</strong> season) for microbial biomass <strong>and</strong> the<br />
ratio of microbial biomass to <strong>soil</strong> nutrients (*P
The MBC/SOC ratio or microbial quotient has been widely used as an indicator of the <strong>change</strong>s in organic<br />
matter status due to alterations of <strong>soil</strong> conditions (Sparling 1992). In our study, the ratio of MBC/SOC was<br />
lower in LOP than in NSF st<strong>and</strong>s for both 0-15 cm <strong>and</strong> 15-30 cm <strong>soil</strong> depths, suggesting the decreases of<br />
organic matter in LOP st<strong>and</strong>s (Table 2). The lower MBN/TN <strong>and</strong> MBP/TP in LOP st<strong>and</strong>s supported the<br />
conclusion obtained by Joergensen <strong>and</strong> Scheu (1999), i.e., the decline of MBC/SOC meant the decrease of<br />
available organic matter in <strong>soil</strong>s. These results are consistent with the conclusion of Wang <strong>and</strong> Wang (2007)<br />
who reported that microbial quotient decreased in pure coniferous plantation in the subtropical forest<br />
ecosystem.<br />
The two forest types investigated exhibited significant seasonal variation in <strong>soil</strong> MBC, but not in <strong>soil</strong> MBN<br />
<strong>and</strong> MBP in Northeast China. In both NSF <strong>and</strong> LOP st<strong>and</strong>s, MBC concentration was higher in summer,<br />
indicating the more immobilization of nutrients by the microbial biomass from the decomposing litters.<br />
Furthermore, the <strong>soil</strong> temperature <strong>and</strong> moisture were favourable for the microbial growth during the summer<br />
(Table 1). This result was similar to the previous studies in temperate forests (Bohlen et al. 2001). The result<br />
of less sensitive to seasonal <strong>change</strong>s in MBN <strong>and</strong> MBP obtained in our study was consistent with Chen et al.<br />
(2006) who reported that the seasonal patterns were less obvious in Mongolian pine plantations at the<br />
Keerqin s<strong>and</strong> l<strong>and</strong>s (42º43' N, 122º22' E), China. This is because the potential for N <strong>and</strong> P immobilizationmineralization<br />
by microbial biomass is stable during the growing season in temperate forests.<br />
In summary, the concentrations of MBC, MBN <strong>and</strong> MBP, <strong>and</strong> the ratios of MBC/SOC, MBN/TN <strong>and</strong><br />
MBP/TP reduced significantly in LOP st<strong>and</strong>s; which suggested that the NSF was better to conserve<br />
microbial activity than the LOP in Northeast China.<br />
References<br />
Behera N, Sahani U (2003) Soil microbial biomass <strong>and</strong> activity in response to Eucalyptus plantation <strong>and</strong><br />
natural regeneration on tropical <strong>soil</strong>. <strong>Forest</strong> Ecology <strong>and</strong> Management 174, 1-11.<br />
Bohlen PJ, Groffman PM, Driscoll CT, Fahey TJ, Siccama TG (2001) Plant-<strong>soil</strong>-microbial interactions in a<br />
northern hardwood forest. Ecology 82, 965-978.<br />
Chen FS, Zeng DH, Zhou B, Singh AN, Fan ZP (2006) Seasonal variation in <strong>soil</strong> nitrogen availability under<br />
Mongolian pine plantations at the Keerqin S<strong>and</strong> L<strong>and</strong>s, China. Journal of Arid Environments 67, 226-<br />
239.<br />
Chen TH, Chiu CY, Tian GL (2005) Seasonal dynamics of <strong>soil</strong> microbial biomass in coastal s<strong>and</strong> dune<br />
forest. Pedobiologia 49, 645-653.<br />
Groffman PM, McDowell WH, Myers JC, Merriam JL (2001) Soil microbial biomass <strong>and</strong> activity in tropical<br />
riparian forests. Soil Biology & Biochemistry 33, 1339-1348.<br />
Joergensen RG, Scheu S (1999) Depth gradients of microbial <strong>and</strong> chemical properties in moder <strong>soil</strong>s under<br />
beech <strong>and</strong> spruce. Pedobiologia 43, 134-144.<br />
Leckie SE, Prescott CE, Grayston SJ (2004) <strong>Forest</strong> floor microbial community response to tree species <strong>and</strong><br />
fertilization of regenerating coniferous forests. Canadian Journal of <strong>Forest</strong> Research 34, 1426-1435.<br />
Liu SR, Li XM, Niu LM (1998) The degradation of <strong>soil</strong> fertility in pure larch plantations in the northeastern<br />
of China. Ecological Engineering 10, 75-86.<br />
Olsen SR, Sommers LE (1982) Phosphorus. In ‘Methods of Soil Analysis - Part 2. Chemical <strong>and</strong><br />
Microbiological Properties’. (Eds AL Page, RH Miller, DR Keeney) pp. 403-410.<br />
Ross DJ, Speir TW, Tate KR, Cairns A, Meyrich KF, Pansier EA (1982) Restoration of pasture after top<strong>soil</strong><br />
removal: effect of <strong>soil</strong> carbon <strong>and</strong> nitrogen mineralization, microbial biomass <strong>and</strong> enzyme activities.<br />
Soil Biology & Biochemistry 14, 575-81.<br />
Singh JS, Raghubanshi AS, Singh RS, Srivastava SC (1989) Microbial biomass acts as a source of plant<br />
nutrients in dry tropical forest <strong>and</strong> savanna. Nature 338, 499-500.<br />
Smith JL, Papendick RI, Bezdicek DF, Lynch JM (1993) Soil organic matter dynamics <strong>and</strong> crop residue<br />
management. Soil Microbial Ecology. (Ed FB Jr) pp. 65-94.<br />
Sparling GP (1992) Ratio of microbial biomass carbon to <strong>soil</strong> organic carbon as a sensitive indicator of<br />
<strong>change</strong>s in <strong>soil</strong> organic matter. Australian Journal of Soil Research 30, 195-207.<br />
Vance ED, Brookes PC, Jenkinson DS (1987) An extraction method for measuring <strong>soil</strong> microbial biomass C.<br />
Soil Biology & Biochemistry 19, 703-707.<br />
Wang QK, Wang SL (2007) Soil organic matter under different forest types in Southern China. Geoderma<br />
142, 349-356.<br />
Zhu JJ, Mao ZH, Hu LL, Zhang JX (2007) Plant diversity of secondary forests in response to anthropogenic<br />
disturbance levels in montane regions of northeastern China. Journal of <strong>Forest</strong> Research 12, 403-416.<br />
© 2010 19 th World Congress of Soil Science, Soil Solutions for a Changing World<br />
1 – 6 August 2010, Brisbane, Australia. Published on DVD.<br />
25
Comparison of <strong>soil</strong> water repellency <strong>and</strong> sorptivity between an Acacia caven<br />
(highly-perturbed) <strong>and</strong> Cryptocarya alba (slightly-perturbed) dominated<br />
ecosystem<br />
Juan Pablo Fuentes A , Victor Bustamante A <strong>and</strong> Horacio Bown A<br />
A Faculty of <strong>Forest</strong>ry Sciences <strong>and</strong> Nature Conservation, University of Chile, Santiago. Email jufuente@uchile.cl,<br />
vpbustamante@um.uchile.cl, hbown@uchile.cl<br />
Abstract<br />
Schlerophyll ecosystems are the predominant vegetation type in Central Chile having a long history of<br />
degradation by fire, cultivation, firewood extraction <strong>and</strong> grazing, among others. In order to test <strong>soil</strong> organic<br />
carbon (SOC) mediated reductions in water repellency from a slightly-disturbed Cryptocarya alba to a<br />
highly-disturbed Acacia caven site, we compared intact <strong>soil</strong> aggregates <strong>and</strong> sieved <strong>soil</strong> samples from both<br />
situations using a micro-infiltrometer. We found a significantly greater concentration of SOC <strong>and</strong> repellency<br />
index (R) under the slightly-disturbed C. alba compared to the highly-disturbed A. caven site. We also found<br />
a significant correlation between these two parameters for intact <strong>soil</strong> aggregates. It seems that SOC rather<br />
than disturbance per se, could be the main factor mediating water repellency. Water repellency did not<br />
significantly decrease in sieved- compared to intact-samples, suggesting that water repellency is independent<br />
of <strong>soil</strong> structure.<br />
Key Words<br />
Water repellency, sorptivity, disturbance, schlerophyll ecosystems.<br />
Introduction<br />
Schlerophyll ecosystems cover around 345 thous<strong>and</strong>s (2.6%) of the 13.4 million ha of native forests in Chile,<br />
being the predominant vegetation type in Central Chile where, the greatest proportion of the population lives,<br />
emphasizing the need for its conservation. The development of the rural settlements has had a negative effect<br />
on Mediterranean ecosystems, as a result of using fire before cropping, firewood extraction <strong>and</strong> overgrazing<br />
practices. These practices have resulted in <strong>soil</strong> erosion <strong>and</strong> <strong>soil</strong> degradation. Protection of previously overexploited<br />
areas has permitted the recovery of some vegetation <strong>and</strong> <strong>soil</strong> <strong>processes</strong>. Here arises the question<br />
whether or not <strong>soil</strong> recovery is taking place <strong>and</strong> at what extent. The aim of this study was to compare water<br />
repellency <strong>and</strong> sorptivity (S) from intact <strong>and</strong> sieved <strong>soil</strong> samples from an Acacia caven (highly-perturbed)<br />
<strong>and</strong> Cryptocarya alba (slightly-perturbed) dominated ecosystem. We hypothesize that <strong>soil</strong> repellency is<br />
driven by <strong>soil</strong> organic carbon, so that, the slightly-perturbed site would exhibit greater repellency than the<br />
highly-perturbed site for both intact <strong>and</strong> sieved <strong>soil</strong> samples.<br />
Material<br />
The study was carried out in the National Reserve “Roblería del Cobre de Loncha”, located in Alhué, Central<br />
Chile (Figure 1). The climate is calid-template (Cs) with a prolonged dry season from 6 to 8 months<br />
according to the classification of Koeppen <strong>and</strong> Fuenzalida (U. de Chile 2007). Rainfall is concentrated<br />
during the winter months (June to August) with an annual average of 503 mm (Santibañez <strong>and</strong> Uribe 1993).<br />
Two sites were selected, representing two conditions with contrasting disturbance levels:<br />
Ab<strong>and</strong>oned agriculture: these sites are characterized by historical extraction of firewood followed by<br />
agricultural crops (mainly wheat). After disturbance ending around thirty years ago, a perennial cover of<br />
around 10% was gradually established with the legume tree Acacia caven <strong>and</strong> some schlerophyll species<br />
such as Quillaja Saponaria <strong>and</strong> Lithraea caustica. Common annual grasses from the genus Melica, Nasella<br />
<strong>and</strong> Bromus sp, among others, are the dominant cover during winter, <strong>and</strong> dying by the end of spring.<br />
Slightly-disturbed schlerophyll forest: These sites are dominated by the schlerophyll species Cryptocarya<br />
alba (Peumo), Lithraea caustica (Litre), Quillaja saponaria (Quillay), <strong>and</strong> Peumus boldus (Boldo). These<br />
are second growth-coppices brought about by fire <strong>and</strong> firewood extraction 30 o more years ago. Nowadays<br />
these are slightly disturbed by occasional cattle grazing.<br />
© 2010 19 th World Congress of Soil Science, Soil Solutions for a Changing World<br />
1 – 6 August 2010, Brisbane, Australia. Published on DVD.<br />
26
CHILE<br />
SOUTH AMERICA<br />
33°20'S<br />
34°0'S<br />
65°20'W<br />
Metropolitan Region<br />
65°20'W<br />
Study Area<br />
© 2010 19 th World Congress of Soil Science, Soil Solutions for a Changing World<br />
1 – 6 August 2010, Brisbane, Australia. Published on DVD.<br />
64°40'W<br />
64°40'W<br />
Santiago<br />
64°0'W<br />
64°0'W<br />
33°20'S<br />
Figure 1. Location of the National Reserve “Roblería del Cobre de Loncha”, Alhue, Central Chile.<br />
Methods<br />
In each of the two sites, <strong>soil</strong> samples of about 700 g were r<strong>and</strong>omly extracted from five points, at <strong>soil</strong> depths<br />
of 0-10 <strong>and</strong> 10-20 cm. Samples were air-dried <strong>and</strong> kept in HD polyethylene boxes until water repellency<br />
measurements were taken. Repellency was measured following Hallet <strong>and</strong> Young (1999), over <strong>soil</strong><br />
aggregates <strong>and</strong> sieved <strong>soil</strong> samples. Basically, water repellency <strong>and</strong> sorptivity are determined by the Leeds-<br />
Harrison et al. (1994) infiltrometer, which compares curves of infiltration versus time for water <strong>and</strong> ethanol.<br />
Soil organic C was determined by wet combustion <strong>and</strong> colorimetry. Bulk density of <strong>soil</strong> aggregates was<br />
determined by volume displacement of previously sealed aggregates. Soil porosity was calculated as a<br />
function of <strong>soil</strong> bulk density <strong>and</strong> assuming a particle density of 2.65 g cm 3 .<br />
All analyses were undertaken at the three level using the R language (R Foundation for Statistical<br />
Computing, Vienna, Austria). Variables were tested for normality <strong>and</strong> homogeneity of variance <strong>and</strong><br />
transformations were made as necessary to meet the underlying statistical assumptions of the models used.<br />
The main effects of disturbance on <strong>soil</strong> repellency <strong>and</strong> sorptivity variables were examined by analysis of<br />
variance. Tukey’s least significant difference test was used to distinguish among individual means where<br />
applicable with a confidence level of P ≤ 0.05. Differences in the slopes <strong>and</strong> the intercepts in the<br />
relationships between <strong>soil</strong> repellency <strong>and</strong> SOC were tested for significance between A. caven (highlydisturbed)<br />
<strong>and</strong> C. alba (slightly disturbed) using analysis of covariance.<br />
Results<br />
Highly-disturbed (Acacia caven) <strong>and</strong> slightly-disturbed (Cryptocarya alba) sites were compared for <strong>soil</strong><br />
porosity, <strong>soil</strong> organic carbon, water sorptivity, ethanol sorptivity, <strong>and</strong> the repellency index (Table 1).<br />
Porosity, organic carbon, ethanol sorptivity, <strong>and</strong> the repellency index significantly decreased from the<br />
slightly- to the highly-disturbed site (P < 0.05). In other words disturbance brought about drastic reductions<br />
in all these characteristics. Water sorptivity was not significantly different between the highly-disturbed <strong>and</strong><br />
the slightly-disturbed sites except for the sieved samples taken from 10-20 cm depth. Soil porosity <strong>and</strong> SOC<br />
consistently decreased with <strong>soil</strong> depth for both intact <strong>and</strong> sieved samples. The same trend was observed for<br />
the repellency index. Water <strong>and</strong> ethanol sorptivity were much greater for the sieved than for the intact <strong>soil</strong><br />
samples.<br />
34°0'S<br />
27
Table 1. Comparison of physical <strong>and</strong> chemical properties between an Acacia caven (highly-disturbed) <strong>and</strong><br />
Cryptocarya alba (slightly-disturbed) dominated ecosystem. Different lower-case letters indicate significant<br />
differences at P < 0.05 between the highly- <strong>and</strong> the slightly-disturbed site.<br />
Soil<br />
depth<br />
(cm)<br />
Porosity<br />
Organic<br />
carbon (%)<br />
© 2010 19 th World Congress of Soil Science, Soil Solutions for a Changing World<br />
1 – 6 August 2010, Brisbane, Australia. Published on DVD.<br />
Water<br />
sorptivity<br />
(mm/s 1/2 )<br />
Ethanol<br />
sorptivity<br />
(mm/s 1/2 )<br />
Repellency<br />
index, R<br />
C. alba 0.57 ±0.02 a 6,80 ±0,71 a 0,96 ±0,31 a 1,67 ±0,06 a 4,48 ±1,18 a<br />
Soil 0-10<br />
A. caven 0.38 ±0.03 b 1,76 ±0,25 b 1,25 ±0,50 a 0,78 ±0,17 b 1,61 ±0,46 b<br />
aggregat<br />
es C. alba 0.53 ±0.04 a 3,90 ±0,76 a 1,26 ±0,18 a 1,70 ±0,13 a 2,73 ±0,27 a<br />
10-20<br />
A. caven 0.34 ±0.03 b 0,91 ±0,06 b 1,03 ±0,37 a 0,65 ±0,12 b 1,42 ±0,15 b<br />
C. alba 0.68 ±0.01 a 6,80 ±0,71 a 1,80 ±0,19 a 2,58 ±0,14 a 2,86 ±0,22 a<br />
Sieved 0-10<br />
A. caven 0.60 ±0.01 b 1,76 ±0,25 b 2,06 ±0,09 a 1,58 ±0,13 b 1,50 ±0,12 b<br />
<strong>soil</strong><br />
samples C. alba 0.63 ±0.01 a 3,90 ±0,76 a 2,76 ±0,09 a 2,48 ±0,05 a 1,77 ±0,08 a<br />
10-20<br />
A. caven 0.58 ±0.01 b 0,91 ±0,06 b 1,69 ±0,16 b 1,85 ±0,15 b 2,24 ±0,34 a<br />
We found a significant linear correlation between R <strong>and</strong> SOC (P < 0.001) for intact samples but not for<br />
sieved samples (P = 0.11) (Figure 2). Slopes <strong>and</strong> intercepts of these linear relationships for intact samples<br />
were not influenced by disturbance, suggesting that differences in repellency between the A. caven <strong>and</strong> C.<br />
alba sites were well explained by their differences in <strong>soil</strong> organic C for intact <strong>soil</strong> aggregates.<br />
Repellency Index (R)<br />
8<br />
7<br />
6<br />
5<br />
4<br />
3<br />
2<br />
1<br />
y = 0.9084 + 0.4912 x<br />
r 2 = 0.54, P < 0.001<br />
0<br />
0 2 4 6 8 10<br />
Organic C (% by weight)<br />
8<br />
intact sample sieved sample<br />
Repellency Index (R)<br />
7<br />
6<br />
5<br />
4<br />
3<br />
2<br />
1<br />
y = 1.7319 + 0.1013 x<br />
r 2 = 0.14, P = 0.11<br />
0<br />
0 2 4 6 8 10<br />
Organic C (% by weight)<br />
Figure 2. Relationship between measured <strong>soil</strong> organic C <strong>and</strong> repellency index for intact <strong>and</strong> sieved samples.<br />
Conclusions<br />
Water sorptivity did not exhibit significant differences between the A. caven (highly-disturbed) <strong>and</strong> the C.<br />
alba (slightly-disturbed) sites, although differences were found for ethanol sorptivity. Such difference<br />
suggests that there is a limiting factor to water infiltration in the slightly-disturbed site of C. alba. Sieved<br />
samples showed greater sorptivity which might be explained by the greater porosity in the sieved- compared<br />
to the intact-sample.<br />
We found a significantly greater concentration of <strong>soil</strong> organic carbon <strong>and</strong> repellency index in the slightlydisturbed<br />
(C. alba) compared to the highly-disturbed (A. caven) site. We also found a significant correlation<br />
between these two variables for intact samples (but not for sieved samples). Therefore <strong>soil</strong> organic carbon,<br />
rather than disturbance per se, may be the main factor mediating water repellency.<br />
Water repellency did not significantly decrease in sieved- compared to intact-samples, suggesting that water<br />
repellency is independent of <strong>soil</strong> structure.<br />
Acknowledgements<br />
During this work the senior author was supported by the National Science <strong>and</strong> Technology Commission<br />
(CONICYT) through the project FONDECYT No 1090283. We thank Codelco-Chile División El Teniente<br />
<strong>and</strong> the National Corporation of <strong>Forest</strong>ry (Conaf Sexta Región) for their support. We also thank Cristina<br />
Sáez for their kind advice <strong>and</strong> valuable technical skills. The experiments <strong>and</strong> measurements undertaken for<br />
this paper comply with the current laws of Chile.<br />
28
References<br />
Santibañez F, Uribe J (1993) Atlas agroclimático de Chile. Regiones Sexta, Séptima, Octava y Novena.<br />
Universidad de Chile, Santiago, Chile. 99p.<br />
U. de Chile (2007) Profundización de la línea de base ambiental y ecológica del sector de mayor valor<br />
ecológico del cordón de Cantillana. (CONAMA-GEF-PNUD. Proyecto “Conservación de la<br />
Biodiversidad en los Altos de Cantillana, Chile”) 257p.<br />
Hallet P, Young I (1999) Changes to water repellence of <strong>soil</strong>s aggregates caused by substrate-induced<br />
microbial activity. European Journal of Soil Science 50, 35-40.<br />
Leeds-Harrison P, Youngs E, Uddin B (1994) A device for determining the sorptivity of <strong>soil</strong> aggregates.<br />
European Journal of Soil Science 45, 269-272.<br />
© 2010 19 th World Congress of Soil Science, Soil Solutions for a Changing World<br />
1 – 6 August 2010, Brisbane, Australia. Published on DVD.<br />
29
Current organic carbon stock in top<strong>soil</strong> of forest l<strong>and</strong> in Japan<br />
Kazuhito Morisada A , Shin Ugawa B , Shinji Kaneko B <strong>and</strong> Masamichi Takahashi B<br />
A Bureau of Climate Change, <strong>Forest</strong>ry <strong>and</strong> <strong>Forest</strong> Products Research Institute, Tsukuba, Japan, Email morisada@ffpri.affrc.go.jp<br />
B Department of <strong>Forest</strong> Site Environment, <strong>Forest</strong>ry <strong>and</strong> <strong>Forest</strong> Products Research Institute, Tsukuba, Japan<br />
Abstract<br />
To evaluate the current organic carbon stock in forest top<strong>soil</strong> in Japan, a systematic survey has been carried<br />
out since 2006. As of the end of 2008, organic carbon densities in the first 0.3 m of <strong>soil</strong> had been measured at<br />
1,200 forest sites. Organic carbon density ranged from 0.34 to 19.51 kg/m 2 for mineral <strong>soil</strong>s. The<br />
combination of wide variation in temperate conditions reflected by mean annual temperature, the<br />
unstableness of <strong>soil</strong> material implied by slope angles, <strong>and</strong> the widespread distribution of volcanic ejecta are<br />
supposed to create the complicated distribution of <strong>soil</strong> organic carbon stock in Japanese forests. The mean<br />
organic carbon density was 7.05 ± 3.03 kg/m 2 (mean ± SD) for all samples including organic <strong>soil</strong>. This value<br />
is lower than a previous estimate, possibly due to differences in the method of estimating the coarse fragment<br />
volume in the <strong>soil</strong> mass <strong>and</strong> the method of dry bulk density measurement.<br />
Key Words<br />
<strong>Forest</strong> <strong>soil</strong>, Japan, organic carbon stock, systematic sampling.<br />
Introduction<br />
A strategic survey to obtain a <strong>soil</strong> carbon inventory of Japan’s forest sector <strong>and</strong> evaluate the current <strong>soil</strong><br />
carbon stock was launched in 2006. The goal was to obtain a comprehensive survey of all forestl<strong>and</strong>s in<br />
Japan over 5 years, from 2006 to 2011 (Takahashi <strong>and</strong> Morisada 2008). The layout of the survey sites <strong>and</strong><br />
<strong>soil</strong> sampling method were established considering the effect of <strong>soil</strong> variability on organic carbon stock<br />
evaluation, as <strong>soil</strong> variability can cause wide differences in estimations of <strong>soil</strong> carbon stock (Swift 2001).<br />
To avoid sample bias, survey sites were systematically selected from the plots of the <strong>Forest</strong> Resources<br />
Monitoring Survey conducted by the <strong>Forest</strong>ry Agency, Government of Japan (Takahashi <strong>and</strong> Morisada<br />
2008). The Monitoring Survey plots were set up at 4 × 4-km grid intervals to cover the whole forested area<br />
of Japan, <strong>and</strong> every fifth plot was designated as a special plot (Hirata et al. 2009). The survey sites for the<br />
current project correspond to the special plots of the Monitoring Survey <strong>and</strong> represent one-fifth of the<br />
Monitoring Survey plots. The current project will survey approximately 3,000 sites located about every 80<br />
km 2 throughout the forestl<strong>and</strong> of Japan. The project is expected to advance underst<strong>and</strong>ing of <strong>soil</strong> variability<br />
at the national scale. Systematic <strong>soil</strong> sampling has been performed to avoid sampling bias (Takahashi <strong>and</strong><br />
Morisada 2008). By the end of 2008, measurement of organic carbon densities in top<strong>soil</strong> had been<br />
completed at half of the planned survey sites. The surveyed sites appear to evenly cover forested l<strong>and</strong>, <strong>and</strong><br />
the results obtained to date can offer insight into the distribution of organic carbon stocks in forest <strong>soil</strong>s in<br />
Japan. In this paper, we present interim results from the first 3 years of the survey.<br />
Methods<br />
Measurement of <strong>soil</strong> organic carbon density<br />
Briefly, the field sampling method (<strong>Forest</strong> Sinks <strong>Working</strong> <strong>Group</strong> 2007a) was as follows. Soil was sampled<br />
at four systematically designated points at a Monitoring Survey plot. The depth interval of sampling was<br />
fixed to 0.3 m. Soil samples for carbon content measurement were taken from <strong>soil</strong> depths of 0–0.05, 0.05–<br />
0.10, <strong>and</strong> 0.15–0.30 m after collecting litter samples from the <strong>soil</strong> surface. Undisturbed <strong>soil</strong> samples for<br />
bulk density measurement were taken from the same depth intervals using a 400-mL <strong>soil</strong>-sampling cylinder<br />
(100 cm 2 × 4 cm). In the case that a cylinder could not be used, an excavating method was applied. The<br />
volume ratio of coarse fragments (>2 mm) was estimated by eye using a chart (Oyama <strong>and</strong> Takehara 1967)<br />
for comparison.<br />
The methods of sample analysis (<strong>Forest</strong> Sinks <strong>Working</strong> <strong>Group</strong> 2007b) <strong>and</strong> calculation of <strong>soil</strong> organic<br />
carbon density in each plot were as follows.<br />
The bulk density of fine earth (BD) was calculated by<br />
BD = (Sw – Gw – Rw) / V,<br />
where Sw is the oven-dry weight of the sample, Gw is oven-dry weight of coarse fragments in the sample,<br />
© 2010 19 th World Congress of Soil Science, Soil Solutions for a Changing World<br />
1 – 6 August 2010, Brisbane, Australia. Published on DVD.<br />
30
Rw is oven-dry weight of roots in the sample, <strong>and</strong> V is the sample volume.<br />
The carbon concentration of fine earth was determined by a dry combustion method.<br />
The <strong>soil</strong> organic carbon density for a sampling point (SOC, C kg/m 2 ) was estimated as<br />
SOC = Σ OCi × BDi × Di × (1 - Si),<br />
where OCi is the concentration of organic carbon in layer i, BDi is the bulk density of layer i, Di is the<br />
thickness of layer i, <strong>and</strong> Si is the volume ratio of coarse fragments in layer i. The mean density of sampling<br />
points in the plot was used as the representative value of <strong>soil</strong> organic carbon density in each plot.<br />
Examination of the distribution of organic carbon stocks<br />
Correlations of organic carbon density by plot with the temperature condition, slope condition, <strong>and</strong> parent<br />
material were examined considering major characteristics of the pedogenesis of Japanese <strong>soil</strong>s (Kyuma<br />
1990). Mean annual temperature estimated from digital climate data (Japan Meteorological Agency 2002)<br />
represented the temperature condition of a plot. The slope condition was given by slope data for each plot<br />
derived from the site description of the Monitoring Survey report (<strong>Forest</strong>ry Agency unpublished). The<br />
surface geology estimated from digital geology data (Wakamatsu et al. 2005) was used to identify the<br />
parent material. Data from 1,203 sites at which the <strong>soil</strong> organic carbon density was plotted in three or four<br />
of the four sampling points were used for this study.<br />
Results<br />
The <strong>soil</strong> organic carbon density of plots ranged from 0.34 to 19.51 kg/m 2 for mineral <strong>soil</strong>s. The organic<br />
carbon density of organic <strong>soil</strong> was 25.0 kg/m 2 (n = 1). Regional differences were found in the distribution<br />
of organic carbon density. In general, the organic carbon density of forest top<strong>soil</strong> was high in the eastern<br />
region <strong>and</strong> low in the western region. This regional difference in carbon density corresponded to the<br />
relationship between carbon density <strong>and</strong> the temperature condition. Soil carbon density tended to increase<br />
with the decrease in mean annual temperature, but the correlation between carbon density <strong>and</strong> mean annual<br />
temperature was not strong (Figure 1). Soil carbon density tended to be low in steeply sloped areas (Figure 2).<br />
Considering the influence of slope will provide better evaluations of the organic carbon stock in Japanese<br />
forestl<strong>and</strong> because about 30% of forests are located on slopes steeper than 30 degrees (<strong>Forest</strong>ry Agency<br />
1968). The carbon density also differed according to the geologic age of the l<strong>and</strong> surface (Figure 3). The<br />
widely distributed volcanic ejecta in Japan clearly influence the organic carbon stock in top<strong>soil</strong>. However,<br />
given the present limited knowledge of the areal <strong>and</strong> depth extent of volcanic ejecta, it is difficult to<br />
distinguish the influence of volcanic ejecta on organic carbon stock at the nationwide scale.<br />
The combination of wide variation in temperate conditions shown by mean annual temperature, the<br />
unstableness of <strong>soil</strong> material implied by slope degrees, <strong>and</strong> the wide distribution of volcanic ejecta are<br />
supposed to create the complicated distribution of <strong>soil</strong> organic carbon stock in Japan’s forests.<br />
The present organic carbon density was estimated to be 7.05 ± 3.03 kg/m 2 (mean ± SD) for all samples<br />
including organic <strong>soil</strong>. This estimate is lower than a previous estimate by Morisada et al. (2004). The<br />
difference between the two estimates may be attributable to differences in the method of estimating the<br />
volume of coarse fragments. Volume of coarse fragments was estimated in the field for the present survey,<br />
but volume of coarse fragments in the previous estimate was estimated from the abundance of stone in field<br />
descriptions (Morisada et al. 2004). Differences in the method of dry bulk density measurement may also<br />
have contributed to the difference between the estimates. Sampling strategy also might effect on the<br />
estimation of <strong>soil</strong> organic carbon stock. Systematic sampling was performed in the present survey, whereas<br />
samples in the previous estimate were judgement sampling (Petersen <strong>and</strong> Calvin 1965).<br />
Figure 1. Relationship between mean annual<br />
temperature <strong>and</strong> organic carbon density.<br />
© 2010 19 th World Congress of Soil Science, Soil Solutions for a Changing World<br />
1 – 6 August 2010, Brisbane, Australia. Published on DVD.<br />
Figure 2. Relationship between slope degree <strong>and</strong><br />
organic carbon density.<br />
31
Figure 3. Carbon density by the geological conditions of the plots.<br />
Conclusion<br />
The present organic carbon stock in forest top<strong>soil</strong> in Japan was estimated from the results of a systematic<br />
<strong>soil</strong> survey. Wide variation in temperature, unstable <strong>soil</strong> materials, <strong>and</strong> widespread distribution of volcanic<br />
ejecta are supposed to create the complicated distribution of <strong>soil</strong> organic carbon stock in Japanese forests.<br />
References<br />
<strong>Forest</strong>ry Agency (1968) ‘<strong>Forest</strong> Resources of Japan’. (Rinya-Kyosai-Kai: Tokyo) (in Japanese).<br />
<strong>Forest</strong> Sinks <strong>Working</strong> <strong>Group</strong> (2007a) ‘Manuals for inventory of <strong>soil</strong> carbon stock in Japanese forest (1) Field<br />
Survey’. (<strong>Forest</strong>ry <strong>and</strong> <strong>Forest</strong> Products Research Institute: Tsukuba) (in Japanese).<br />
www.ffpri.affrc.go.jp/labs/fsinvent/manural/manualdown.<br />
<strong>Forest</strong> Sinks <strong>Working</strong> <strong>Group</strong> (2007b) ‘Manuals for inventory of <strong>soil</strong> carbon stock in Japanese forest (2)<br />
Analytical Methods’. (<strong>Forest</strong>ry <strong>and</strong> <strong>Forest</strong> Products Research Institute: Tsukuba) (in Japanese).<br />
www.ffpri.affrc.go.jp/labs/fsinvent/manural/manualdown.<br />
Hirata Y, Imaizumi Y, Masuyama T, Matsumoto Y, Miyazono H, Goto T (2009) In ‘National <strong>Forest</strong><br />
Inventories’. (Eds E Tomppo, T Gschwanter, M Lawrence, RE McRoberts) pp. 333-340 (Springer:<br />
Heidelberg Dordrecht London New York).<br />
Japan Meteorological Agency (2002) ‘Mesh Climatic Data of Japan’ (CD-ROM).<br />
Kyuma K (1990) Outline of the pedogenesis of Japanese <strong>soil</strong>s. In ‘Explanatory book for <strong>soil</strong> map of Japan<br />
1:1,000,000'. (Eds The Committee for Soil Classification <strong>and</strong> Nomenclature, The <strong>Group</strong> of Japanese<br />
Pedologists) pp.3-6 (The <strong>Group</strong> of Japanese Pedologists: Tsukuba).<br />
Morisada K, Ono K, Kanomata H (2004) Organic carbon stock in forest <strong>soil</strong>s in Japan. Geoderma 119, 21-<br />
32.<br />
Oyama M, Takehara H (1967) Revised St<strong>and</strong>ard Soil Color Charts. (Fujihira Industry Co.: Tokyo).<br />
Petersen RG, Calvin LD (1965) Sampling. In ‘Methods of Soil Analysis, Part 1’ (Ed CA Black) pp.54-72<br />
(American Society of Agronomy: Madison).<br />
Swift RS (2001) Sequestration of carbon by <strong>soil</strong>. Soil Science 166, 858-871.<br />
Takahashi M, Morisada K (2008) Nation-wide survey of carbon stock in forest <strong>soil</strong>s in Japan. Japanese<br />
Journal of Soil Science <strong>and</strong> Plant Nutrition 79, 109-111. (In Japanese).<br />
Wakamatsu K, Kubo S, Matsuoka M, Hasegawa K, Sugiura M (2005) ‘Japan Engineering Geomorphologic<br />
Classification Map’. (CD-ROM, University of Tokyo Press: Tokyo, product serial number JEGM0431).<br />
© 2010 19 th World Congress of Soil Science, Soil Solutions for a Changing World<br />
1 – 6 August 2010, Brisbane, Australia. Published on DVD.<br />
32
Determinants of <strong>soil</strong> organic matter chemistry in maritime temperate forest<br />
ecosystems<br />
Karen Vancampenhout A,B , Bruno De Vos C , Katinka Wouters A , Hans Van Calster D , Rudy Swennen A , Peter<br />
Buurman E <strong>and</strong> Jozef Deckers A<br />
A E<br />
Department of Earth <strong>and</strong> Environmental Sciences, K.U.Leuven, Celestijnenlaan 200 , B-3001 Leuven, Belgium, Email<br />
karen.vancampenhout@ees.kuleuven.be<br />
B<br />
Department of Biosciences <strong>and</strong> Technology, K.H.Kempen University College, Kleinhoefstraat 4, B-2440 Geel, Belgium.<br />
C<br />
Research Institute for Nature <strong>and</strong> <strong>Forest</strong>, Gaverstraat 4, B-9500 Geraardsbergen, Belgium.<br />
D<br />
Flemish Heritage Institute, Koning Albert II-laan 19 bus 5, B-1210 Brussels, Belgium.<br />
E<br />
Earth System Science, Department of Environmental Sciences, Wageningen University, P.O. Box 47, NL 6700 AA Wageningen,<br />
The Netherl<strong>and</strong>s.<br />
Abstract<br />
The influences of ecosystem properties on the chemical complexity of <strong>soil</strong> organic matter (SOM) remain<br />
poorly understood. This study addresses the composition of NaOH-extracted SOM from maritime temperate<br />
forest sites in Fl<strong>and</strong>ers (Belgium) by pyrolysis-GC/MS. Pyrolysis-products were correlated to site variables<br />
including dominant tree species, management of the woody biomass, site history, <strong>soil</strong> properties, total carbon<br />
stocks <strong>and</strong> indicators for microbial activity. Despite a typical high inter-correlation between these site<br />
variables, the influence of the dominant tree species is prominent, as is a strong correlation to available<br />
nutrients. In nutrient-poor forests with low litter quality, the decomposition of relatively recalcitrant<br />
compounds appears hampered. Former heathl<strong>and</strong> vegetation still had a profound influence on extractable-<br />
SOM chemistry of young pine forests.<br />
Key Words<br />
Soil organic matter composition, temperate forest <strong>soil</strong>s, pyrolysis-GC/MS, environmental factors.<br />
Introduction<br />
While the influence of climate, vegetation, management <strong>and</strong> abiotic site factors on total C budgets <strong>and</strong> turnover<br />
is intensively assessed, high-resolution studies that elaborate on the general relations between these<br />
ecosystem properties <strong>and</strong> the chemical composition SOM are much more scarce. Determining factors of<br />
SOM chemistry remain poorly understood (von Lützow et al. 2006). This knowledge however is vital in<br />
underst<strong>and</strong>ing SOM stability under different <strong>soil</strong> conditions <strong>and</strong> global C sequestration. This work aims to<br />
establish a reconnaissance study in relating environmental factors to differences in NaOH-extractable SOM<br />
composition within a similar climatic context, i.e. maritime temperate forests in Belgium.<br />
Methods<br />
Nineteen forest sites were considered dominated by common European tree species, i.e. Scots pine (Pinus<br />
sylvestris L.), European beech (Fagus sylvatica L.), Pedunculate oak (Quercus robur L.) <strong>and</strong> hybrid poplar<br />
(Populus spp.). Two young pine forests on historical heathl<strong>and</strong> <strong>and</strong> a recently forested heathl<strong>and</strong> were also<br />
included. Samples were taken over the entire depth of the A-horizon <strong>and</strong> were given a code reflecting the<br />
dominant tree species of the sampling site (i.e. Pi, Fa, Qu or Po <strong>and</strong> FH for <strong>Forest</strong>ed Heathl<strong>and</strong>), the <strong>soil</strong>texture<br />
class (C for s<strong>and</strong>y loam <strong>and</strong> coarser or F for silt loam <strong>and</strong> finer) <strong>and</strong> the <strong>soil</strong>-moisture-regime class<br />
(depth of the highest ground water level being either deeper than 50 cm (D) or shallower (W)). Site variables<br />
included vegetation <strong>and</strong> st<strong>and</strong>ing biomass management, litter layer characteristics, total <strong>soil</strong> C <strong>and</strong> basic <strong>soil</strong><br />
properties (Table 1). The hot water carbon (HWC) fraction <strong>and</strong> <strong>soil</strong> CO2 respiration were evaluated as an<br />
indication for microbial contribution to the SOM. SOM was extracted by NaOH (0.1 M), yielding between<br />
41 <strong>and</strong> 92% of the total Corg. The extract was acidified, dialyzed <strong>and</strong> freeze dried (Kaal et al. 2008). Freezedried<br />
samples were pyrolysed using a Curie-point pyrolyser GC-MS. Spectra were semi-quantified according<br />
to Buurman et al. (2009) <strong>and</strong> analysed by factor analysis. Spearman ρ correlation coefficients <strong>and</strong> ANOVA<br />
F-values were calculated between the factor scores <strong>and</strong> the environmental variables.<br />
Results<br />
Pyrolysis compounds included a range of alkenes (n:1) <strong>and</strong> alkanes (n); pristene (Pr); fatty acids (Fn);<br />
methylketones (Kn); an alcohol (Al); a terpene (T); aromatic compounds (A) containing benzene <strong>and</strong> indene<br />
related structures, toluene <strong>and</strong> styrene; four polyaromatic compounds (Pa); (poly)saccharide-derived<br />
© 2010 19 th World Congress of Soil Science, Soil Solutions for a Changing World<br />
1 – 6 August 2010, Brisbane, Australia. Published on DVD.<br />
33
pyrolysis products (Ps) including furans, furaldehydes <strong>and</strong> monomeric sugars; lignin compounds derived<br />
from plant lignins of the guaiacol (G) <strong>and</strong> the syringol (S) types; nine phenol products (Ph) with various<br />
substituents; <strong>and</strong> twelve nitrogen-containing compounds (N, Figure 1). The first two factors explain 37.7%<br />
<strong>and</strong>17.6% of the observed variation. Factor loadings of the variables (i.e. the pyrolysis compounds) <strong>and</strong><br />
scores of the cases (i.e. the samples) are shown in Figure 1. F1 is significantly correlated with tree species,<br />
litter layer characteristics, <strong>soil</strong> properties <strong>and</strong> HWC (Table 1). Pine st<strong>and</strong>s on dry, s<strong>and</strong>y <strong>soil</strong>s with<br />
considerable litter accumulation in the litter layer <strong>and</strong> mor-type humus are correlated with negative values on<br />
F1. These st<strong>and</strong>s have low <strong>soil</strong> pH, low <strong>soil</strong> N content <strong>and</strong> low HWC content. Broadleaved st<strong>and</strong>s with mullhumus<br />
types on rich <strong>soil</strong>s with high microbial contribution (HWC) are positively correlated with F1. F2 is<br />
negatively correlated with the mass of the litter layer alone.<br />
Figure 1. Factor analysis: factor loadings of the pyrolysis compounds (left) <strong>and</strong> factor scores of the samples<br />
(right) on the first two ordination axes. F1 opposes aromatics <strong>and</strong> short <strong>and</strong> mid-chain aliphatics (relatively<br />
recalcitrant) to lignin (especially syringols) <strong>and</strong> N-compounds. A gradient in dominant tree species can be<br />
observed along F1.<br />
Discussion<br />
Interpretation of pyrolysis-compounds<br />
Short <strong>and</strong> mid-chain aliphatic compounds in pyrograms of <strong>soil</strong>s mainly originate from aliphatic<br />
biopolyesters, derived from plant lipid precursors or microbial lipids. Aromatic pyrolysis products originate<br />
from SOM compounds derived from proteins (toluene), tannins <strong>and</strong> other (poly)-phenols including black<br />
carbon. As for the short <strong>and</strong> mid-chain aliphatics, aromatics are considered relatively recalcitrant to (further)<br />
microbial decay. Polysaccharide-derived pyrolysis-products relate to SOM molecules with both vegetal <strong>and</strong><br />
microbial precursors. Ps9, Ps11 <strong>and</strong> Ps15-22 (<strong>and</strong> particularily the levosugars, Figure 1) are commonly<br />
related to biopolymers with cellulose-type precursors, referring to relatively weakly-decomposed, plantderived<br />
SOM. Smaller polysaccharide pyrolysis products are mostly associated with microbial material (Ps1,<br />
Ps2, Ps4-6). Syringols <strong>and</strong> guaiacols are lignin-derived compounds. SOM found under coniferous vegetation<br />
typically shows a clear dominance of lignin compounds related to guaiacol, while broadleaved forests have<br />
SOM with both guaiacol <strong>and</strong> syringol compounds. Phenols in pyrolysis can have a variety of origins<br />
including lignins, carbohydrates, proteins or polyphenols. N-containing compounds in SOM may originate<br />
from vegetal or microbial precursors, or may be formed by chemical interactions. Abundance of Ncompounds<br />
in SOM in non-fertilized <strong>soil</strong>s is linked to high microbial influence (Vancampenhout et al. 2009<br />
<strong>and</strong> references therein).<br />
Interpretation of the factor analysis<br />
Samples with strongly negative scores on the first factor F1 contain (i) a relative accumulation of aromatics<br />
<strong>and</strong> short <strong>and</strong> mid-chain aliphatics, which are fairly recalcitrant <strong>and</strong> indicative of degraded plant material; (ii)<br />
a relative absence of lignin (especially syringols) <strong>and</strong> (iii) a relative absence of N compounds. Strongly<br />
positive loadings on this axis on the other h<strong>and</strong> denote (i) the abundance of N-compounds, most likely linked<br />
to high microbial influence, <strong>and</strong> (ii) abundance of lignins <strong>and</strong> most of the polysaccharide compounds.<br />
Strongly negative loadings on F2 in combination with negative loadings on F1 indicate a relative abundance<br />
of possible markers of charring (benzofurans, benzonitrille, polyaromatics), while the lower right quadrant of<br />
the F1-F2 space represents a high abundance of lignin fragments, partly in combination with N-compounds.<br />
© 2010 19 th World Congress of Soil Science, Soil Solutions for a Changing World<br />
1 – 6 August 2010, Brisbane, Australia. Published on DVD.<br />
34
Table 1. Spearman ρ correlation coefficients (r) <strong>and</strong> ANOVA F-values (F) relating site variables to the results of<br />
the factor analysis in Figure 1. Correlations are significant at 0.01(**) or 0.05 (*) level.<br />
Factor 1 Factor 2<br />
F r F r<br />
<strong>Forest</strong> management<br />
Dominant tree species 16.56** 1.67<br />
Basal area -0.08 -0.23<br />
Stem number -0.34 0.24<br />
Cover herb layer 0.25 0.15<br />
<strong>Forest</strong> age class<br />
Litter layer<br />
2.50 0.20<br />
Humus index A<br />
-0.69** -0.08<br />
Dry mass of litter layer<br />
Soil properties<br />
-0.69** -0.50*<br />
Moisture class 0.55* -0.13<br />
Clay percentage 0.65** 0.02<br />
Silt percentage 0.69** 0.00<br />
S<strong>and</strong> percentage -0.73** -0.04<br />
pH (H2O) 0.59* 0.44<br />
N (%) 0.67** 0.04<br />
N (Mg/ha)<br />
Soil carbon<br />
0.55* -0.02<br />
C (%) 0.47 -0.07<br />
C (Mg/ha) 0.36 -0.08<br />
C/N ratio<br />
Microbial activity<br />
-0.41 -0.35<br />
CO2 respiration 0.35 0.15<br />
Hot Water Carbon B<br />
0.77** 0.24<br />
A B<br />
Ponge <strong>and</strong> Chevalier (2006), Ghani et al. 2003<br />
The top centre of the F1-F2 space in Figure 4.3 represents compounds both indicative for relatively fresh<br />
(Ph8, alkanes 28-31 <strong>and</strong> possibly Ps22 <strong>and</strong> N12) <strong>and</strong> microbial (Ps3, alkane 15 <strong>and</strong> possibly Ps22 <strong>and</strong> N12)<br />
material, suggesting an admixture of both. Factor scores in Figure 1 emphasize a strong effect of dominant<br />
tree species on extractable-SOM chemistry (F1). Former heathl<strong>and</strong> st<strong>and</strong>s are still clearly distinguishable.<br />
The second factor F2 stresses the deviating composition of sample QuFD compared to samples taken under<br />
oak on light textured <strong>soil</strong>s <strong>and</strong> under beech. This site has a complex site history, which could explain its<br />
unusual composition.<br />
Influence of environmental factors<br />
Despite the high inter-correlation between the environmental factors, the influence of dominant tree species<br />
on F1 is striking (Figure 1). Moreover, species are arranged along F1 according to their litter quality<br />
(Cornelissen 1996), indicating that input quality is an important determinant of the extractable-SOM<br />
composition in maritime temperate forests. An important accumulation of degraded, fairly recalcitrant midchain<br />
alkenes/alkanes <strong>and</strong> aromatics is observed in the extractable SOM under pine <strong>and</strong> former heathl<strong>and</strong><br />
forests. This accumulation coincides with a strong degradation of lignin- <strong>and</strong> cellulose-derived compounds<br />
(Figure 1) <strong>and</strong> associated to ecosystems with poor litter quality, moder type humus with thick <strong>and</strong> heavy<br />
litter layers, having low <strong>soil</strong> pH, low <strong>soil</strong> N content <strong>and</strong> low HWC content (table 1). This accumulation of<br />
recalcitrants (aromatics <strong>and</strong> short <strong>and</strong> mid-chain aliphatics) appears a common feature in <strong>soil</strong>s where not all<br />
conditions for efficient decay are met (due to substrate limitations, occlusion, acidity, toxic ions,<br />
complexation, sorption, low fertility or oxygen deprivation; e.g. Buurman <strong>and</strong> Roscoe 2009; Ferreira et al.<br />
2009). Soils under forested heathl<strong>and</strong> <strong>and</strong> pine moreover have very low relative amounts of N-compounds<br />
(Figure 1). Oppositely, no accumulation of recalcitrants is present in the extractable SOM under poplar,<br />
which coincides with high abundance of N compounds, polysaccharides <strong>and</strong> syringols, generally linked to<br />
broadleaved forests with high microbial influence.<br />
This is further evidenced by the high positive correlation of F1 to microbial proxies (HWC) <strong>and</strong> to<br />
ecosystems with high litter quality, mull-type humus <strong>and</strong> thin litter layers (table 1). Remarkably, the <strong>soil</strong>’s<br />
nutrient status shows stronger correlation to the decomposition of recalcitrants than oxygen deprivation. No<br />
general relation of extractable-SOM chemistry with time under forest was found, yet forested heathl<strong>and</strong> <strong>and</strong><br />
© 2010 19 th World Congress of Soil Science, Soil Solutions for a Changing World<br />
1 – 6 August 2010, Brisbane, Australia. Published on DVD.<br />
35
the younger pine forests (forested since 1940 or longer) clearly have more negative scores on F1, as<br />
compared to PiC(W) <strong>and</strong> PiCD (permanently forested at least since 1775 <strong>and</strong> 1850, respectively). This<br />
indicates that the former heathl<strong>and</strong> vegetation still has a detectable influence on the extractable-SOM<br />
chemistry under pine forests established for 60 years or more. Under poplar, beech <strong>and</strong> oak however, the<br />
period under forest does not appear to have much effect on extractable-SOM chemistry.<br />
Conclusion<br />
The results of this study indicate that vegetation is a major factor determining the extractable-SOM<br />
composition in maritime temperate forests. Aliphatics <strong>and</strong> aromatics accumulate in the extractable SOM of<br />
ecosystems with poor <strong>soil</strong>s <strong>and</strong> low litter quality. Their decomposition seems hampered in such conditions,<br />
whereas all carbon sources seem effectively used if conditions for decomposition are favorable (i.e.<br />
eutrophic ecosystems with high litter quality, which show no accumulation of recalcitrants yet high amounts<br />
of N-compounds). Correlations between extractable-SOM chemistry, litter layer properties <strong>and</strong> Hot-Water-<br />
Carbon content further support this hypothesis. The long lasting influence of former heathl<strong>and</strong> on the<br />
accumulation of recalcitrants in the extractable-SOM composition of pine forests indicates that chemical<br />
recalcitrance is relevant in certain ecosystems for several decades.<br />
Acknowledgements<br />
This study was funded by K.U.Leuven <strong>and</strong> FWO. The authors wish to thank Prof. R. Langohr, Prof. R.<br />
Merckx, Prof. P. Jacobs, Prof. E. Smolders, L. Vancampenhout, Dr. A. Temme , M. Broekhuijsen <strong>and</strong> E. J.<br />
Velthorst.<br />
References<br />
Buurman P, Nierop KGJ, Kaal J, Senesi N (2009) Analytical pyrolysis <strong>and</strong> thermally assisted hydrolysis <strong>and</strong><br />
methylation of EUROSOIL humic acid samples - A key to their source. Geoderma 150, 10-22.<br />
Buurman P, Roscoe R (2009) Different decomposition paths of free light <strong>and</strong> occluded light SOM fractions<br />
in <strong>soil</strong>s of cerrado, tilled <strong>and</strong> untilled fields, Minas Gerais, Brazil - a pyrolysis-GC/MS study. (In<br />
Preparation).<br />
Cornelissen JHC (1996) An experimental comparison of leaf decomposition rates in a wide range of<br />
temperate plant species . Journal of Ecology 84, 573-582.<br />
Ferreira FP, Vidal-Torrado P, Buurman P, Macias F, Otero Perez XL, Boluda R (2008) Pyrolysis-gas<br />
chromatography/mass spectrometry of <strong>soil</strong> organic matter from a Brazilian mangrove <strong>and</strong> Spanish salt<br />
marches. (In Preparation).<br />
Ghani A, Dexter M, Perrott KW (2003) Hot-water extractable carbon in <strong>soil</strong>s: a sensitive measurement for<br />
determining impacts of fertilisation, grazing <strong>and</strong> cultivation. Soil Biology <strong>and</strong> Biochemistry 35, 1231-<br />
1243.<br />
Kaal J, Martinez-Cortizas A, Nierop KGJ, Buurman P (2008) A detailed pyrolysis-GC/MS analysis of a<br />
black carbon-rich acidic colluvial <strong>soil</strong> (Atlantic ranker) from NW Spain. Applied Geochemistry 23, 2395-<br />
2405.<br />
Ponge JF, Chevalier R (2006) Humus Index as an indicator of forest st<strong>and</strong> <strong>and</strong> <strong>soil</strong> properties. <strong>Forest</strong><br />
Ecology <strong>and</strong> Management 233, 165-175.<br />
Vancampenhout K, Wouters K, De Vos B, Buurman P, Swennen R, Deckers J (2009) Differences in<br />
chemical composition of <strong>soil</strong> organic matter in natural ecosystems from different climatic regions - A<br />
pyrolysis-GC/MS study. Soil Biology <strong>and</strong> Biochemistry 41, 568–579<br />
von Lützow M, Kögel-Knabner I, Ekschmitt K, Matzner E, Guggenberger G, Marschner B, Flessa H (2006)<br />
Stabilization of organic matter in temperate <strong>soil</strong>s: mechanisms <strong>and</strong> their relevance under different <strong>soil</strong><br />
conditions - a review. European Journal of Soil Science 57, 426-445.<br />
© 2010 19 th World Congress of Soil Science, Soil Solutions for a Changing World<br />
1 – 6 August 2010, Brisbane, Australia. Published on DVD.<br />
36
Development of <strong>soil</strong> quality indices for natural forest habitats of lowl<strong>and</strong>s <strong>and</strong><br />
upl<strong>and</strong>s in Pol<strong>and</strong> <strong>and</strong> its application in silviculture: project description.<br />
Stanisław BroŜek A , Jan Mulder B , Piotr Gruba A , Paulien Mulder B , Ewa Błońska A , Jarosław Lasota A , Piotr<br />
Pacanowski A , Tomasz Wanic A , Maciej Zwydak A<br />
A Department of <strong>Forest</strong> Soil Science, University of Agriculture, Al. 29 Listopada 46; 31-425 Krakow, Pol<strong>and</strong>, rlgruba@cyf-kr.edu.pl<br />
B Department of Plant <strong>and</strong> Environmental Sciences, Norwegian University of Life Science; P.O. Box 5003; N-1432 Aas, Norway<br />
Abstract<br />
The project involves a <strong>soil</strong> study for natural forest plant communities as a model for sustainable development<br />
of forest resources in Pol<strong>and</strong>. The objective of this project is to describe the features of <strong>soil</strong>s typical for<br />
specific forests types, to prepare them in a classical format <strong>and</strong> in the numerical <strong>soil</strong> quality index (SQI) <strong>and</strong><br />
to implement this knowledge in forestry practice. Application of this index in forest site cartography is an<br />
innovation <strong>and</strong> constitutes significant progress in the research on natural <strong>soil</strong>/plants relations, which<br />
facilitates planning the plant composition for a renewed forest. The scope of work covers defining around<br />
200 research plots within Pol<strong>and</strong>’s lowl<strong>and</strong>s <strong>and</strong> highl<strong>and</strong>s. The <strong>soil</strong> biogeochemical analyses will be held<br />
along with plant composition description <strong>and</strong> work on tree taxonomy. The research also covers the impact of<br />
individual species on <strong>soil</strong> properties, which allows description of its variability in time <strong>and</strong> space as well as<br />
its effects for SQI. The research covered by this project provides for a better use <strong>and</strong> management of forest<br />
<strong>soil</strong> resources. Sustainable forest growth as the main purpose of its management, which means integrating<br />
the production of timber, energy, clean water, carbon storage <strong>and</strong> biodiversity with the tourist <strong>and</strong> curative<br />
values of forests, is of high importance to the society. It is directed at improving the biological diversity in<br />
silviculture, as well as in farml<strong>and</strong>s designed for afforestation.<br />
Key Words:<br />
Pine, oak, spruce, beech, hornbeam.<br />
Introduction<br />
Throughout the last couple of decades, there has been a growing concern about the condition of <strong>soil</strong> quality<br />
as a measure of its capacity for performing such functions as producing plant biomass, maintaining animal<br />
health, recycling of nutrients, storing carbon, separating <strong>and</strong> distributing rainfall, buffering acidity (from<br />
anthropogenic sources), degradation <strong>and</strong> remediation of organic waste <strong>and</strong> regulating energy<br />
transformations.(Schoenholtz et al. 2000). Soil quality has been defined as the capacity of a specific kind of<br />
<strong>soil</strong> to function, within natural or managed ecosystem boundaries, to sustain plant <strong>and</strong> animal productivity,<br />
maintain or enhance water <strong>and</strong> air quality, <strong>and</strong> support human health <strong>and</strong> habitation (Karlen et al. 1997).<br />
Monitoring both agriculture <strong>and</strong> forest management requires looking at the overall quality of the <strong>soil</strong> to<br />
foresee possible <strong>change</strong>s in productivity. Productivity is a product of different factors, <strong>and</strong> in silviculture<br />
various measures of productivity have been used over the years. A site index (e.g. canopy height of a tree of<br />
a given age) is the most commonly used measure of productivity, <strong>and</strong> is influenced by factors such as<br />
climate, slope <strong>and</strong> other l<strong>and</strong>scape features (geologic <strong>and</strong> topographic features), combined with <strong>soil</strong> quality.<br />
However, if the impact on productivity of various management practices in silviculture needs to be<br />
evaluated, it is more convenient to use a <strong>soil</strong> quality index (SQI). Management practices may influence the<br />
<strong>soil</strong>’s chemical, physical <strong>and</strong> biological attributes, but usually they do not affect other aspects of site quality,<br />
such as the geologic <strong>and</strong> topographic features. A <strong>soil</strong> quality index is based on the assumption that there is a<br />
direct relationship between the below-ground <strong>processes</strong> (including root growth) <strong>and</strong> the aboveground<br />
productivity, <strong>and</strong> hence a particular <strong>soil</strong> attribute that restricts root growth may result in decreased<br />
aboveground productivity (Burger <strong>and</strong> Kelting 1999)<br />
In the case of Polish forests, this st<strong>and</strong>ard environment management practice starts with mapping of a<br />
habitat. This work is performed for small forest areas. A proper <strong>soil</strong> survey makes the basis for a proper<br />
expertise regarding habitat <strong>and</strong> forest species composition. The classic approach to <strong>soil</strong>s within habitat<br />
mapping is based on <strong>soil</strong> types, sub-types <strong>and</strong> kinds, which until now did not produce satisfying results, in<br />
particular regarding the relationship with a forest tree species composition. Soil types <strong>and</strong> subtypes are<br />
relatively large units <strong>and</strong> it is difficult to establish their clear relation to forest tree species composition. The<br />
most valuable knowledge of <strong>soil</strong>, in particular with reference to the relationship between <strong>soil</strong> <strong>and</strong> flora, is<br />
© 2010 19 th World Congress of Soil Science, Soil Solutions for a Changing World<br />
1 – 6 August 2010, Brisbane, Australia. Published on DVD.<br />
37
elated to its properties. Laboratories provide a huge amount of data that is difficult to interpret. In the recent<br />
years there have been attempts to develop <strong>soil</strong> numerical indices that would be simple indices covering<br />
numerous properties (Andrews 2003, Huber 2005, Schoenholtz et al. 2000).<br />
The first objective of this project is to specify the <strong>soil</strong> characteristics typical of forests of various<br />
composition, presenting them in the classical format <strong>and</strong> as a relatively robust, numerical quality index, <strong>and</strong><br />
then implementing this knowledge in forestry practice. The second objective is to recognize the potential<br />
<strong>change</strong>s in <strong>soil</strong> quality indices caused by <strong>change</strong>s in forest species composition.<br />
Methods<br />
One part of this project is focused on finding the relationship between <strong>soil</strong> quality indices <strong>and</strong> natural forest<br />
plant communities. The work includes plant composition description, tree measurements (height, breast<br />
diameter, increment, age), <strong>soil</strong> profile characteristic <strong>and</strong> sampling. The laboratory work includes an analysis<br />
of 1,200 samples taken to cover the texture, bulk density, total nitrogen (N) <strong>and</strong> organic carbon (C) contents,<br />
<strong>soil</strong> pH in H2O <strong>and</strong> in 1M KCl, ex<strong>change</strong>able acidity (TE), total acidity (TA) <strong>and</strong> ex<strong>change</strong>able Ca 2+ , K + ,<br />
Mg 2+ <strong>and</strong> Na + .<br />
The other part of the project deals with the influence of forest species on the values of <strong>soil</strong> quality indices.<br />
Research is carried out on 12 plots. For this purpose, the following pairs of plots were selected: Pine/Oak (3<br />
pairs), Pine/Beech, Pine/Hornbeam, Pine/Spruce. The paired plots are relatively close to each other <strong>and</strong> st<strong>and</strong><br />
on the same <strong>soil</strong> type. The plots are 20m x 20m in size. During field work, the plots were mapped (ground<br />
surface variability, location of stems <strong>and</strong> tree crown range). Soil sampling is performed on a 1x1m grid (441<br />
per plot), samples are taken from the top 10cm, mineral-only layer of <strong>soil</strong>. These samples are being analyzed<br />
for pH in 0,01 M CaCl2 solution, <strong>and</strong> for moisture content. Additionally, 16 samples from each plot are taken<br />
on a 4x4 m grid <strong>and</strong> analyzed for: pH, base cations content, total <strong>and</strong> ex<strong>change</strong>able acidity, aluminium<br />
extracted in 1 M KCI <strong>and</strong> 0,5 M CuCl2, total C <strong>and</strong> N. On some of tested plots a set of lysimeters are<br />
installed for <strong>soil</strong> solutions sampling at the depth of about 10 <strong>and</strong> 20cm. Soil solution analysis includes the<br />
following factors: pH, H + , Ca 2+ , Mg 2+ , K + , Na + , Al (total <strong>and</strong> Al (3-n) ), Fe 2+,3+ , Cl - , SO4 2- , NH4 + , NO3 - contents.<br />
Preliminary results<br />
On the basis of previous research (BroŜek et al. 2006) <strong>and</strong> statistical analysis of the data (BroŜek 2007), four<br />
groups of <strong>soil</strong> properties were selected as indicators for calculating the <strong>soil</strong> quality index. The selected<br />
indicators, calculated for 1x1x1.5m <strong>soil</strong> volume, comprised:<br />
• the content of the
At present, the investigations are being carried out, all fieldwork have been performed. Sampling on trial<br />
plots are also finished, <strong>and</strong> the results of the laboratory analysis are soon expected. In order to obtain the<br />
preliminary information on the impact of forest species composition on the investigated <strong>soil</strong> quality indices,<br />
we used data from the <strong>soil</strong>s of homogeneous spruce forest <strong>and</strong> mixed forest predominated by European<br />
beech. Some of <strong>soil</strong> properties (e.g. texture) are dependent primarily on the parent material <strong>and</strong> considered<br />
stable, whereas others could be affected by forest type. However, both these indices <strong>and</strong> the <strong>soil</strong> quality<br />
index were developed for lowl<strong>and</strong>s, <strong>and</strong> we tested their applicability to mountain forest <strong>soil</strong>s.<br />
Not surprisingly, the content of the
Effects of manganese concentration on beech leaf litter decomposition: results<br />
from field <strong>and</strong> laboratory experiments<br />
Florence Trum A , Hugues Titeux A <strong>and</strong> Bruno Delvaux A<br />
A Unité des Sciences du Sol, Earth <strong>and</strong> Life Institute, Université catholique de Louvain, Belgium, Email florence.trum@uclouvain.be<br />
Abstract<br />
Lignin degradation is considered to be the rate limiting step of litter decomposition, a vital process in forest<br />
biogeochemical cycles. Mn concentration may play a key role in lignin degradation as it is essential for the<br />
activity of manganese peroxydase (MnP), a central enzyme of the lignin degrading system. We investigated<br />
the impact of Mn on litter decomposition by incubating for one year beech leaf litter of different Mn<br />
concentrations (40, 45, 60 <strong>and</strong> 120 mmol/kgDM) in laboratory <strong>and</strong> in the field (litterbags). We determined<br />
carbon <strong>and</strong> nitrogen releases as well as the variation of leaf litter composition over time. With Mn<br />
concentration, leaf litters exhibited an increase in total CO2 release, a decrease in total DOC release, along<br />
with a decrease in NO3 - /(NH4 + + NO3 - ) ratio <strong>and</strong> in carbon content <strong>and</strong> C/N ratio. In the light of our results,<br />
we hypothesize that higher Mn concentration (i) could improve biological activity <strong>and</strong>/or (ii) could promote<br />
ligninolysis. To support <strong>and</strong> confirm these hypotheses, we completed our study by considering the evolution<br />
of the content <strong>and</strong> the oxidation state of leaf litter lignin.<br />
Key Words<br />
<strong>Forest</strong> organic matter, lignin degradation, carbon <strong>and</strong> nitrogen releases, laboratory incubation, litterbags.<br />
Introduction<br />
Litter decomposition is of crucial importance for sustainable production in forest ecosystems, because it is<br />
responsible for carbon <strong>and</strong> nutrient cycling. Due to its complex <strong>and</strong> heterogeneous structure, lignin<br />
degradation is slow <strong>and</strong> exerts a major control on organic residues decomposition. Therefore, lignin<br />
concentration is generally considered to be an indicator of substrate quality (Melillo <strong>and</strong> Aber 1982).<br />
Among the factors affecting the degradation of lignin, Mn concentration may play a key role since Mn is<br />
essential for the activity of manganese peroxydase (MnP), the most wide-spread enzyme of the lignin<br />
degrading system secreted by the white-rot fungi (Hofrichter 2002). Kerem <strong>and</strong> Hadar (1995) demonstrated a<br />
positive effect of Mn on lignin degradation during the solid-state fermentation of a cotton fibre. Correlation<br />
between Mn concentration <strong>and</strong> litter carbon mineralization was also observed (Berg et al. 2007);<br />
nevertheless the role of Mn on litter decomposition has not yet been experimentally tested.<br />
This study aims to assess the impact of Mn concentration in beech (Fagus sylvatica L.) leaf litter on carbon<br />
<strong>and</strong> nitrogen release (laboratory incubation) <strong>and</strong> on leaf litter chemical composition (field experiment) during<br />
the decomposition process.<br />
Methods<br />
Manganese concentrations in beech leaf litter<br />
Leaf litters with identical composition, except Mn concentration, were obtained by dipping branches in Mn<br />
solutions (0 to 2.5 mM) for 10 days (Table 1). Manganese was transported through the transpiration stream<br />
<strong>and</strong> accumulated in leaves. Branches were sampled from beech trees from Bois de Lauzelle (Table 2) at the<br />
beginning of spring. We also examined beech leaf litter from the Transinne site (Table 2). Beech leaf litters<br />
from Bois de Lauzelle (Mn0 treatment) <strong>and</strong> from Transinne were identically concentrated in Mn but<br />
Transinne leaf litter exhibited a greater decomposition capacity (data not shown).<br />
Laboratory experiment<br />
Beech leaf litters were incubated in triplicate in columns hermetically closed for 350 days at 20°C. Carbon<br />
<strong>and</strong> nitrogen releases were determined during the incubation period. CO2 was measured by back titration of a<br />
NaOH solution. Leachates were obtained by water extraction from beech leaf litter subsamples. On these<br />
leachates, dissolved organic carbon (DOC) was quantified using a carbon analyzer (Dohrman DC-180),<br />
absorbance (280 nm) was measured using a UV/VIS spectrometer UNICAM8625 <strong>and</strong> inorganic nitrogen<br />
(NH4 + <strong>and</strong> NO3 - ) determined using a HPLC (Dionex LC20 with IONPAC AS 11 column).<br />
© 2010 19 th World Congress of Soil Science, Soil Solutions for a Changing World<br />
1 – 6 August 2010, Brisbane, Australia. Published on DVD.<br />
40
Table 1. Mn concentrations in beech leaf litters subjected to different treatments [mmol/kgDM].<br />
---------------- Bois de Lauzelle ---------------<br />
Treatment abbreviation<br />
Transinne Mn0 Mn1 Mn2 Mn3<br />
Mn concentration in dipping solution [mM] 0 0 0.5 1 2.5<br />
Leaf Mn concentration [mmol/kgDM] 40 40 45 60 120<br />
Field experiment (litterbags)<br />
For each type of litter, the samples of about 2.5 g each were enclosed in separate litterbags (18 x 18 cm)<br />
made of polyester net with an upper mesh size of 2.4 mm <strong>and</strong> a lower mesh size of 0.5 mm. In November<br />
2008, in the Forêt de Soignes (Table 2), litterbags were placed below the L layer in a r<strong>and</strong>omized design.<br />
The procedure was replicated 4 times by leaving the litterbags in 3 different location to avoid<br />
pseudoreplication; the bags were then collected 5 (150 days, t1), 10 (300 days, t2) <strong>and</strong> 15 months later. Plant<br />
remains such as mosses <strong>and</strong> roots were removed. Then, the mass loss was determined by drying the sample<br />
at a constant temperature of 60°C. We quantified carbon <strong>and</strong> nitrogen contents using a NC-<strong>soil</strong> analyzer.<br />
Table 2. Sites used in this study, their geographic location (Belgium), climate, <strong>soil</strong> <strong>and</strong> forest floor type.<br />
Bois de Lauzelle Transinne Forêt de Soignes<br />
Location Louvain-la-Neuve, Belgian Ardenne, Brussels,<br />
49°59’03”N, 5°11’31”E 50°48’24”N, 4°28’04”E 50°40’44”N, 4°36’15”E<br />
Mean annual temperature 9.4 °C 8.7 °C 9.4°C<br />
Mean annual precipitation 816 mm 1035 mm 835 mm<br />
Soil Cambisol Dystric cambisol Podzol<br />
<strong>Forest</strong> floor Mor Moder Mor<br />
Statistics<br />
The differences between means were compared with Fisher’s least significant difference (LSD) test. Using<br />
the laboratory results, the test was carried out by one-way variance analysis (Anova1), treatment being the<br />
factor. Then, using the field experiment results, the LSD-test was performed by two-ways variance analysis<br />
(Anova2), allowing us to take into account the variability introduced by the location factor <strong>and</strong> by its<br />
interaction with the treatment factor. All the statistical analyses were performed with the SAS software (SAS<br />
Institute 1999) with a significance level of 0.05.<br />
Results<br />
From laboratory experiment<br />
At the end of the incubation period, the Mn3 leaf litter exhibited a significant a larger total CO2 release than<br />
Mn0 <strong>and</strong> Transinne leaf litters (p-value of 0.0148). Except for Transinne leaf litter, leaf litter Mn<br />
concentration was higher while the total DOC release (p-value of 0.0001) was lower (Figure 1).<br />
Nevertheless, DOC in water extracts exhibited no significant difference of molar absorptivity (absorbance at<br />
280 nm/DOC concentration) between the treatments.<br />
Figure 1. Cumulative release of carbon (CO2 <strong>and</strong> DOC) over the incubation period (left Y-axis) <strong>and</strong> DOC/(CO2 +<br />
DOC) ratio (right Y-axis).<br />
© 2010 19 th World Congress of Soil Science, Soil Solutions for a Changing World<br />
1 – 6 August 2010, Brisbane, Australia. Published on DVD.<br />
41
Ammonium release was highest in Mn3 leaf litter water extract <strong>and</strong> the lowest in Transinne leaf litter extract<br />
(p-value of 0.0006). Nitrate releases were twice as low in Mn2 <strong>and</strong> Mn3 leaf litter extracts than in the water<br />
extracts of the other treatments (p-value of 0.0154). The nitrification degree (NO3 - /NH4 + + NO3 - ) was<br />
significantly greater for nitrogen release from the Transinne leaf litter. For the other treatments, nitrification<br />
degree decreased with Mn concentration in leaf litter (Table 3).<br />
Table 3. Cumulative release of nitrogen (NH4 + <strong>and</strong> NO3 - ) over the incubation period <strong>and</strong> nitrification degree<br />
(NO3 - /NH4 + + NO3 - ). Means <strong>and</strong> their st<strong>and</strong>ard deviations are presented (n=3). Means with different associated<br />
letters are statistically different (α = 0.05).<br />
Treatment Transinne Mn0 Mn1 Mn2 Mn3<br />
NH4 + [N-mg/N-g] 0.012 ± 0.007 0.037 ± 0.001 0.030 ± 0.001 0.046 ± 0.005 0.078 ± 0.019<br />
c b bc b a<br />
NO3 - [N-mg/N-g] 0.014 ± 0.004 0.012 ± 0.004 0.012 ± 0.001 0.007 ± 0.001 0.005 ± 0.001<br />
a ab ab bc c<br />
Nitrification degree - % 56.4 ± 7.4 24.7 ± 5.7 30.7 ± 11.4 13.5 ± 2.7 6.5 ± 1.6<br />
a bc b cd d<br />
From field experiment<br />
After 150 days in the field, we observed no significant difference in mass loss between leaf litters subjected<br />
to different treatments in litterbags the mass loss ranged between 10 <strong>and</strong> 20%. After 300 days, Transinne leaf<br />
litter exhibited a significant larger mass loss (30%) than the other leaf litters (20 – 25%) (p-value of 0.0383).<br />
After 300 days in the field, the leaf litter with the largest Mn concentration (Mn3) exhibited a decrease of<br />
carbon content significantly larger than the other leaf litters (p-value of 0.05) (Figure 2a). The leaf litter with<br />
the lowest Mn concentration (Mn0) exhibited the lowest increase of nitrogen content, already after 150 days<br />
(p-value of 0.0020 (t1) <strong>and</strong> 0.0037 (t2)) (Figure 2b). Over time, the decrease of C/N ratio in leaf litter material<br />
was lowest for Mn0 leaf litter <strong>and</strong> highest for Mn3 leaf litter (p-value of 0.0001 (t1) <strong>and</strong> 0.0002 (t2)) (Figure 2c).<br />
Figure 2. Difference in C-, N-content <strong>and</strong> C/N ratio between leaf litters sampled after 150 (t1) or 300 days (t2) <strong>and</strong><br />
corresponding initial leaf litters (t0).<br />
Discussion<br />
Carbon release<br />
Our results suggest that Mn concentration affects carbon release. Total carbon (CO2 + DOC) released by the<br />
leaf litters treated stayed constant. However, the form of released carbon evolved in favor of the mineralized<br />
form (CO2) with Mn concentration in leaf litters. The DOC composition is complex <strong>and</strong> heterogeneous. The<br />
main sources of DOC are C-labile <strong>and</strong> ligninolysis products (hydrophobic components) (Guggenberger<br />
1994). Our study suggests there was no variation in the composition of DOC released by the leaf litters<br />
treated, just as there was no variation in molar absorptivity. In fact, molar absorptivity estimates DOC<br />
aromaticity <strong>and</strong> indicates the quantity of hydrophobic components (Simonsson et al. 2005). In the field, leaf<br />
litter with the most Mn concentrated (Mn3) had the largest carbon loss. Field conditions (more moisture,<br />
involvement of micro- <strong>and</strong> macrofauna because of the litterbags design) could enhance biological <strong>processes</strong>.<br />
We could hypothesize that Mn concentration (i) improves biological activity <strong>and</strong>/or (ii) promotes<br />
ligninolysis. In the first hypothesis, microorganisms could consume more C-labile (decrease of DOC release)<br />
<strong>and</strong> could produce more respiration (increase of CO2 release). In the second hypothesis, lignin degradation<br />
could be more complete. Thus, microorganisms could have easier access to ligninolysis products.<br />
© 2010 19 th World Congress of Soil Science, Soil Solutions for a Changing World<br />
1 – 6 August 2010, Brisbane, Australia. Published on DVD.<br />
42
Nitrogen release<br />
Our results also suggest that the level of Mn concentration affects nitrogen release. According to the first<br />
hypothesis, the decrease in NO3 - release could be explained by a larger consumption of microorganisms. In<br />
the second hypothesis, the decrease in NO3 - /NH4 + +NO3 - ratio in leaf litters with large Mn concentration<br />
could be explained by depression in the nitrification process. Dissolved polyphenolic compounds produced<br />
by ligninolysis could inhibit nitrification (allelopathy) (Killham 1990).<br />
Conclusions <strong>and</strong> perspectives<br />
By reducing the C/N ratio, a classic indicator of litter decomposition (Figure 2c), Mn concentration impacts<br />
litter decomposition by improving biological activity or/<strong>and</strong> by promoting ligninolysis. To support <strong>and</strong><br />
confirm these hypotheses, we will consider the evolution of the content <strong>and</strong> the oxidation state of leaf litter<br />
lignin in our laboratory <strong>and</strong> field samples. Moreover, we await results from the last collection of litterbags in<br />
order to study the temporal evolution of leaf litter composition.<br />
References<br />
Berg B, Steffen KT, McClaugherty C (2007) Litter decomposition rate is dependent on litter Mn<br />
concentration. Biogeochemistry 82, 29-39.<br />
Guggenberger G (1994) Acidification effects on dissolved organic matter mobility in spruce forest<br />
ecosystems. Environmental international 20, 31-41.<br />
Hofrichter M (2002) Review: lignin conversion by manganese peroxydase (MnP). Enzyme <strong>and</strong> Microbial<br />
technology 30, 545-566.<br />
Kerem Z, Hadar Y (1995) Effect of Mn on preferential degradation of Lignin by Pleurotus ostreatus during<br />
solid-state fermentation. Applied <strong>and</strong> Environmental Microbiology 61, 3057-3062.<br />
Killham K (1990) Nitrification in coniferous forest <strong>soil</strong>s. Plant <strong>and</strong> <strong>soil</strong> 128, 31-44.<br />
Melillo JM, Aber JF (1982) Nitrogen <strong>and</strong> lignin control of hardwood leaf litter decomposition dynamics.<br />
Ecology 63, 621-626.<br />
SAS Institute (1999) ‘SAS/STAT User’s guide, version 8 for window’. (SAS Institute, Inc.: Cary, North<br />
Caroline, USA).<br />
Simonsson M, Kaiser K, Danielsson R, Andreux F, Ranger J (2005) Estimating nitrate, DOM <strong>and</strong> DOC<br />
fractions in forest floors leachates using ultraviolet absorbance spectra <strong>and</strong> multivariate analysis.<br />
Geoderma 124, 157-168.<br />
© 2010 19 th World Congress of Soil Science, Soil Solutions for a Changing World<br />
1 – 6 August 2010, Brisbane, Australia. Published on DVD.<br />
43
Effects of balanced fertilization on bamboo’s quality<br />
Xiaomin Guo A* Shunbao Lu A,B Dekui Niu A Guoshi Zhang C Fang Chen C Zhijian Luo D<br />
A College of L<strong>and</strong>scape <strong>and</strong> Art Jiangxi Agricultural University, Nanchang China 330045, gxmjxau@163.com<br />
B College of Life Science Jiangxi Normal University, Nanchang, China 330022, luxunbao8012@126.com<br />
C Wuhan Botanical Garden, The Chinese Academy of Sciences, Wuhan, China 430074<br />
D Hubei Academy of <strong>Forest</strong>ry, Wuhan, China 430079<br />
* corresponding author<br />
Abstract<br />
Moso bamboo forest is an important forest resource in southern China. The results of balanced fertilizing in<br />
Jiangxi <strong>and</strong> Hubei bamboo forests showed that: balanced fertilization can increase the bamboo diameter,<br />
improve the quality of bamboo shoots <strong>and</strong> increase economic efficiency <strong>and</strong> yields. The influence on<br />
mechanical properties of bamboo is not obvious. Balanced fertilization can also reduce fertilizer waste <strong>and</strong><br />
pollution. Balanced fertilization of bamboo forest <strong>and</strong> good management guarantees of improved<br />
productivity <strong>and</strong> quality, increased economic <strong>and</strong> ecological benefits in South China.<br />
Key Words<br />
Moso bamboo, balance fertilization, quality.<br />
Introduction<br />
Moso bamboo is the most widely distributed species occupying the largest area of cultivation, the largest<br />
reserves, has the highest economic value wood <strong>and</strong> bamboo shoots in China's bamboo forests. It occupies a<br />
very important position in forestry production in China. Bamboo with its fast growth, early useful wood, the<br />
wide use, the wide receipts, <strong>and</strong> other major characteristics are an important forest resource of the South in<br />
China. The recent 10 years, the area of bamboo increased at a rate of 51,000 hm 2 each year in China. Among<br />
them, Moso bamboo increased 76,000 hm 2 within the recent 5 years. Bamboo plays an important role in<br />
human life <strong>and</strong> production. It receives wide attention in world forest production. It not only provides<br />
industrial <strong>and</strong> agricultural production <strong>and</strong> people's lives are affected by the bamboo through bamboo shoots<br />
<strong>and</strong> bamboo by-products of raw materials, but bamboo also affects water <strong>and</strong> <strong>soil</strong> <strong>and</strong> water conservation,<br />
regulation of climate, l<strong>and</strong>scape environment <strong>and</strong> other effects. Moso bamboo will have an irreplaceable role<br />
to meet the country’s "bamboo instead of wood" <strong>and</strong> "bamboo instead of plastic".<br />
Methods<br />
The main producing areas are in Fengxin, Jing'an, Chibi, <strong>and</strong> other cities <strong>and</strong> counties in Jiangxi Province,<br />
Hubei Province. South Bamboo main production types <strong>and</strong> site conditions, the same basic rotation of<br />
bamboo-bamboo with balanced fertilization of pilot sites are represented by Fengxin, Jing'an <strong>and</strong> Chibi in the<br />
humid subtropical monsoon climate. The mean annual temperature is 17.4 ℃ with a frost-free period of 280<br />
d, a mean annual rainfall ranging from 1612.5 to 1955.7 mm, the sunshine hours 1802.5 h, the total radiation<br />
is 106 kcal/cm 2 .<br />
Fengxin, Jing'an District uses on completely r<strong>and</strong>omized design group designed trial, Hubei Chibi a<br />
incompletely r<strong>and</strong>om group. Analyses include bamboo shoot nutritional quality (protein hydrolysis amino<br />
acid method, Kjeldahl, residual method, detergent, anthrone color, burning method, atomic absorption<br />
spectrophotometry, sodium tungstate colorimetric method, 2,4-Dinitrophenylhydrazine Colorimetry)<br />
Results<br />
Fertilization on the impact of bamboo DBH<br />
Fertilization <strong>and</strong> reclamation measures improve the average diameter at breast high (DBH). In the data about<br />
the average DBH in Fertilization, 1-3 year new bamboo, the average annual increase is 2.46 percent. The<br />
average fertilized DBH, 3-5 year new bamboo, the average increase is 7.93 percent. With fertilizer<br />
increasing, average DBH between fertilization treatment <strong>and</strong> CK (reclamation tending) has significant<br />
differences. It indicates that it is very important of fertilizer inputs to the maintenance of average diameter.<br />
Balanced fertilization on the impact the nutritional quality of bamboo shoots<br />
The difference N, P, K ratio in six treatments for the six treatments. But compared to CK (reclamation), the<br />
nutritional content of bamboo shoots improves with respect to protein, sugar, fat, VC, fibre etc., which show<br />
© 2010 19 th World Congress of Soil Science, Soil Solutions for a Changing World<br />
1 – 6 August 2010, Brisbane, Australia. Published on DVD.<br />
44
higher values than those in non-fertilized treatments. In particular, the sugar content increases 38.7 percent.<br />
Balanced fertilization impacts on Moso bamboo wood properties<br />
To test Moso bamboo wood properties after four years continuous fertilization wiyh different N <strong>and</strong> P rates<br />
in Hubei Chibi. In general, string bending strength was slightly lower than the control, radial bending<br />
strength, along the grain compressive strength <strong>and</strong> tensile strength of slightly higher than those in control.<br />
Conclusion<br />
The DBH increment relationship with fertilization treatment is larger than for CK (reclamation). The largest<br />
growth reached 11.2 percent in N2P2K2, followed by N1P1K2, relatively increment 10.3 percent. The next<br />
highest growth response is 9.9% in N2P1K2 treatment, which is more than four-fold that for CK<br />
(reclamation). It is very important that fertilizer inputs improve the quality of bamboo.<br />
Fertilization improve the protein, sugar, fat, VC, fibre <strong>and</strong> nutrient contents of bamboo shoots, in particular,<br />
the sugar content increased 38.7 percent. From the perspective of using bamboo shoots, the highest yield of<br />
bamboo shoots with N2P1K1 reached 4363 kg/hm 2 , an increase of 90.72 percent over Control. The other<br />
treatments in order of the relative production of bamboo shoots: N1P1K2 (162.7%)> N2P2K2 (160.6%)><br />
N2P1K2 (159.4%)> N1P1K1 (135.5%)> N1P1 (126.0%)> CK (reclamation) (100%). Fertilizers N, P <strong>and</strong> K<br />
nutrients play a vital role in the growth of bamboo shoots. Fertilization has a certain impact on bamboo culm<br />
properties. Different fertilizer ratios have different impacts on bamboo mechanical properties. Their mutual<br />
relations are more complicated. At the same low-N, P level, more K fertilization can improve bamboo<br />
mechanical properties. Excessive fertilization may decrease timber. Based on the utilities of the Moso<br />
bamboo, we need to choose suitable fertilizer ratios to maximize economic efficiency.<br />
Acknowledgement<br />
The work reported here has been funded by IPNI ; Projects from National Natural Science Foundation of<br />
China Number: 30860226 (Moso bamboo); Agricultural Scientific <strong>and</strong> Technological Production Funds<br />
Project of Ministry of Science <strong>and</strong> Technology Number: 2008C50040562; National Science <strong>and</strong> Technology<br />
Support Project Number: 2008BADA9B0802 (Moso bamboo); Excellent funded projects for returnee of<br />
ministry of personnel Number: (2007)170 (watershed ecology); Projects for academic leader of Jiangxi<br />
province Number:030008 (Moso bamboo) .The authors want to take this opportunity to thank all of the<br />
supporters.<br />
References<br />
Bai XJ (2000) China's crop balanced fertilization technology strategic thinking in the beginning of the<br />
century. Agricultural Technical <strong>and</strong> Economic,<br />
Chen H,Hong W, Lan B (1998) Study on Moso bamboo forest biomass <strong>and</strong> productivity of Northern Fujian<br />
Province. <strong>Forest</strong>ry Science 34 (1), 60-64.<br />
Chen JH, Li QY, Yang DC (1998) China's forest fertilization <strong>and</strong> nutrition diagnosis. World <strong>Forest</strong>ry<br />
Research.3, 58-65.<br />
© 2010 19 th World Congress of Soil Science, Soil Solutions for a Changing World<br />
1 – 6 August 2010, Brisbane, Australia. Published on DVD.<br />
45
Effects of ecological succession on chemical characteristics of humic <strong>and</strong> fulvic<br />
acids in a Japanese volcanic ash <strong>soil</strong>.<br />
Yasuo Iimura A , Mitsuru Hirota B , Kenji Tamura B , Teruo Higashi B , Nobuhide Fujitake A<br />
A Graduate School of Agricultural Science, Kobe University, Kobe, Japan, Email fujitake@kobe-u.ac.jp<br />
B Graduate School of Life <strong>and</strong> Environmental Science, University of Tsukuba, Tsukuba, Japan.<br />
Abstract<br />
To obtain further details regarding effects of ecological succession on chemical characteristics of humic <strong>and</strong><br />
fulvic acids in a Japanese volcanic ash <strong>soil</strong>, humus quantitative analysis, HPSEC, <strong>and</strong> liquid-state 13 C NMR<br />
analysis were performed with surface mineral <strong>soil</strong>s (0–20 cm). Grassl<strong>and</strong> at site 1 has been maintained by<br />
mowing, while the maintenance of sites 2 (pine forest) <strong>and</strong> 3 (broad-leaved forest) was discontinued<br />
approximately 30 <strong>and</strong> more than 100 years ago, respectively. The concentration of humic acids decreased<br />
from 60.4 to 47.4 C g/kg in only 30 years (site 1 vs. site 2), <strong>and</strong> then decreased from 47.4 to 30.2 C g/kg after<br />
100 years (site 2 vs. site 3). Simultaneously, the concentration of fulvic acids decreased only slightly<br />
throughout the series (site 1 to site 3). Physicochemical properties appeared to be affected by succession only<br />
in humic acids. In particular, the proportion of aryl C moieties in the humic acid of site 2 decreased from<br />
49.6 to 31.4%, a level similar to that of site 3. The findings of this study clearly demonstrate that humic<br />
acids, but not fulvic acids, significantly <strong>change</strong>d with decreasing aryl C content, over the first 30 years <strong>and</strong><br />
then remained fairly constant.<br />
Key Words<br />
Secondary succession; Black <strong>soil</strong>; Stability of <strong>soil</strong> organic matter; Carbon sequestration.<br />
Introduction<br />
Japanese volcanic ash <strong>soil</strong>s have very thick <strong>and</strong> dark-colored A horizons with large amounts of humic acids<br />
(Wada 1986) which are characterized by their highly aromatic structures <strong>and</strong> stabilities such as black carbon<br />
(Shindo <strong>and</strong> Honma 2001). Nevertheless, the disappearance of the melanic epipedon with a decreasing<br />
aromatic C <strong>and</strong> increasing alkyl C proportion of humic acids was observed in ecological succession over<br />
only 20−30 years in the grassl<strong>and</strong>/forest ecotone of volcanic ash <strong>soil</strong> in Japan (Golchin et al. 1997).<br />
However, there is no clear information on how such quantitative <strong>change</strong>s in each carbon species affect<br />
chemical properties of humic substances. To obtain clearer information about this, we therefore aimed: (1) to<br />
quantify the time series variation of humic <strong>and</strong> fulvic acid, dominant portions of <strong>soil</strong> organic matter; (2) to<br />
determine the chemical properties of humic <strong>and</strong> fulvic acids quantitatively. We investigated the<br />
concentration of humic <strong>and</strong> fulvic acids extracted from volcanic ash <strong>soil</strong> at the same study site as that of<br />
Golchin et al. (1997). To obtain the quantitative variations in each carbon species <strong>and</strong> their effects on the<br />
chemical properties of humic <strong>and</strong> fulvic acids, we performed liquid-state 13 C nuclear magnetic resonance<br />
( 13 C NMR) spectroscopy with the humus quantitative analysis. We also determined the relative molecular<br />
weight of each humic <strong>and</strong> fulvic acids by high-performance size exclusion chromatography (HPSEC).<br />
Materials <strong>and</strong> Methods<br />
Study area<br />
The study area is situated in the campus of the Sugadaira Montane Research Center (SMRC) of Tsukuba<br />
University, Nagano Prefecture, Japan (36°30′N, 128°20′E), at 1320 m above sea level. The mean annual<br />
temperature is 6.5°C <strong>and</strong> the mean annual precipitation is 1190 mm. The initial <strong>soil</strong> is derived from volcanic<br />
ash, classified as Typic Melanud<strong>and</strong> (USDA Soil Taxonomy). The study sites were managed as grassl<strong>and</strong> for<br />
several hundred years. At the site 1, regular mowing has been practiced to maintain the grassl<strong>and</strong> (site area: 6<br />
ha); however, at the site 2, mowing of the grassl<strong>and</strong>s ceased approximately 30 years ago (site area: 8.5 ha),<br />
<strong>and</strong> at the site 3, grassl<strong>and</strong> was invaded by forest at least more than 100 years ago (site area: 14 ha). The<br />
dominant vegetative cover was Japanese pampas grass, Miscanthus sinensis, at the site 1, Pinus densiflora<br />
with an understory of Sasa spp. at the site 2 <strong>and</strong> Quercus crispula with an understory of Sasa spp. at the site<br />
3. Location <strong>and</strong> present site sketch of the study area are shown in Figure 1.<br />
© 2010 19 th World Congress of Soil Science, Soil Solutions for a Changing World<br />
1 – 6 August 2010, Brisbane, Australia. Published on DVD.<br />
46
Figure 1. Location <strong>and</strong> site sketch of the study area.<br />
Preparation of humic <strong>and</strong> fulvic acids<br />
Soil samples were collected from 0−20 cm surface mineral <strong>soil</strong>. The amounts of humic <strong>and</strong> fulvic acids were<br />
determined according to the method described by Ikeya <strong>and</strong> Watanabe (2003). For chemical characteristics,<br />
humic <strong>and</strong> fulvic acids were isolated using st<strong>and</strong>ard methods of the international humic substances society<br />
(IHSS) with some modifications (Swift 1996; Fujitake <strong>and</strong> Kawahigashi 1999).<br />
Analysis of humic <strong>and</strong> fulvic acids<br />
The relative molecular weight of humic <strong>and</strong> fulvic acids was estimated according to the method of Asakawa<br />
et al. (2008). Liquid-state 13 C NMR spectra were obtained using a Bruker Avance 500 spectrometer with 5<br />
mm diameter sample tubes. Approximately 30−50 mg of the sample was dissolved in 0.4 mL of 0.5 mol/L<br />
NaOD in D2O. Chemical shifts were referenced to sodium 3-trimethylsilylpropionate-2,2,3,3 D4. To obtain<br />
quantitative conditions for the integration of the 13 C NMR spectra, 13 C signals were proton-decoupled using<br />
the inverse-gated decoupling technique as follows: spectrometer frequency, 125.76 MHz; pulse width, 45°;<br />
acquisition time, 0.839 s. A total repetition time of 2.5 s was used to permit complete relation of all the spins.<br />
To improve the signal-to-noise ratio, a line broadening of 50 Hz was used. Scans numbering 10,000 to<br />
20,000 were accumulated. Resonance areas were calculated using electronic integration. To obtain<br />
quantitative information, the spectra were divided into the following six regions (Fujitake <strong>and</strong> Kawahigashi<br />
1999): alkyl C (5−50 ppm), O-alkyl C (50−110 ppm), aryl C (110−145 ppm), O-aryl C (145−165 ppm),<br />
carboxylic C (165−190 pp) <strong>and</strong> carbonyl C (190−220 ppm). Aromaticity proposed by Hatcher et al. (1981)<br />
was calculated by expressing the aryl <strong>and</strong> O-aryl C (110−165 ppm) as a percentage of the alkyl, O-alkyl, aryl<br />
<strong>and</strong> O-aryl C (5−165 ppm).<br />
Results <strong>and</strong> Discussion<br />
Concentration of humic <strong>and</strong> fulvic acids<br />
The concentration of humic acids in each surface horizon decreased with succession from 60.4 to 30.2 C<br />
g/kg throughout the series. The concentration of fulvic acids also decreased from 21.5 to 16.2 C g/kg, but<br />
seemed almost un<strong>change</strong>d with succession compared to humic acid concentrations. The distribution of humic<br />
<strong>and</strong> fulvic acids is shown in Figure 2. The size of pie charts indicates the relative amount of humic <strong>and</strong> fulvic<br />
acids.<br />
26<br />
74<br />
Site 1 Site 2 Site 3<br />
Figure 2. Distribution of humic <strong>and</strong> fulvic acid of each site.<br />
© 2010 19 th World Congress of Soil Science, Soil Solutions for a Changing World<br />
1 – 6 August 2010, Brisbane, Australia. Published on DVD.<br />
30<br />
70<br />
35<br />
65<br />
Humic acid<br />
Fulvic acid<br />
47
Table 2. Distribution of carbon species in all humic <strong>and</strong> fulvic acids determined using liquid-state 13 C nuclear<br />
magnetic resonance spectroscopy.<br />
Carbonyl Carboxyl O-Aryl Aryl O-Alkyl Alkyl Aromaticity<br />
(220-190) (190-165) (165-145) (145-110) (110-45) (45-10)<br />
Humic acids<br />
site 1 5.30 19.2 6.90 49.6 13.0 6.00 0.72<br />
site 2 1.36 17.3 6.46 31.4 26.3 17.2 0.42<br />
site 3 2.90 17.9 6.80 35.0 17.9 19.4 0.48<br />
Fulvic acids<br />
site 1 5.15 18.8 5.54 23.8 29.3 17.4 0.34<br />
site 2 5.62 19.1 6.72 21.1 25.5 21.9 0.31<br />
site 3 5.37 23.3 6.74 21.6 20.5 22.5 0.33<br />
Characteristics of humic <strong>and</strong> fulvic acids<br />
The weight average molecular weight (Mw) <strong>and</strong> peak average molecular weight (Mp) of humic acids clearly<br />
increased with succession from 5.4 to 12.9 kDa <strong>and</strong> from 2.9 to 3.6 kDa, respectively. However, the number<br />
average molecular weight (Mn) of each humic acid did not parallel the Mw <strong>and</strong> Mp. In contrast, the Mw <strong>and</strong><br />
Mp of each fulvic acid did not appear to be correlated with succession. The 13 C NMR spectra of all samples<br />
showed almost the same peaks in the general chemical shift regions, but the magnitude of the peaks varied<br />
especially in humic acids. The distributions of the carbon species of all humic <strong>and</strong> fulvic acids are shown in<br />
Table 2. The proportion of aryl C notably decreased (from 49.6 to 31.4) while O-alkyl C <strong>and</strong> alkyl C<br />
proportion increased (from 13.0 to 26.3 <strong>and</strong> from 6.0 to 17.2, respectively) from site 1 to 2. There was only a<br />
slight difference not only in the aryl C proportion but also aromaticity of humic acids between sites 2 <strong>and</strong> 3<br />
(from 31.4 to 35.0 <strong>and</strong> from 0.42 to 0.48, respectively). The <strong>change</strong>s in the composition of fulvic acids were<br />
extremely small compared to humic acids.<br />
Conclusion<br />
In the present study, we obtained important insights into the <strong>change</strong>s in terms of quantity <strong>and</strong> quality of<br />
humic substances in surface mineral <strong>soil</strong>s (0−20 cm) in the grassl<strong>and</strong>/forest ecotone of volcanic ash <strong>soil</strong> in<br />
Japan, by applying humus quantitative analysis, HPSEC analysis, <strong>and</strong> liquid-state 13 C NMR spectroscopy.<br />
The findings of this study clearly demonstrated that the chemical properties of humic acids, but not fulvic<br />
acids, significantly <strong>change</strong>d with decreasing aryl C content during the first 30 years of succession (site 1 vs.<br />
site 2) <strong>and</strong> then showed a continuous, though less dramatic, decrease after 100 years (site 2 vs. site 3).<br />
References<br />
Asakawa D, Kiyota T, Yanagi Y, Fujitake N (2008) Development <strong>and</strong> validation of method of High-<br />
Performance Size-Exclusion Chromatography (HPSEC) for various <strong>soil</strong> humic acids. Anal Sci. 24 (5),<br />
607−613.<br />
Fujitake N, Kawahigashi M (1999) 13 C NMR spectra <strong>and</strong> elemental composition of fractions with different<br />
particle size from an <strong>and</strong>osol humic acid, Soil Sci. Plant Nutr. 45, 359−366.<br />
Golchin A, Clark P, Baldock JA, Higashi T, Skjemstad JO, Oades JM (1997) The effect of vegetation <strong>and</strong><br />
burning on the chemical composition of <strong>soil</strong> organic matter in a volcanic ash <strong>soil</strong> as shown by 13 C NMR<br />
spectroscopy. I. Whole <strong>soil</strong> <strong>and</strong> humic acid fraction. Geoderma 76, 155−174.<br />
Hatcher PG, Schnitzer M, Dennis LW, Maciel GE (1981) Aromaticity of humic substances in <strong>soil</strong>s. Soil Sci.<br />
Soc. Am. J. 45, 1089–1094.<br />
Ikeya K, Watanabe A (2003) Direct expression of an index for degree of humification of humic acids using<br />
organic carbon concentration. Soil Sci. Plant Nutr. 49 (1), 47−53.<br />
Shindo H, Honma H (2001) Significance of burning vegetation in the formation of black humic acids in<br />
Japanese volcanic ash <strong>soil</strong>s. In ‘humic substances, structures, Models <strong>and</strong> Function’. (Ed EA Ghabbour,<br />
G Davies) pp. 297−306. (Royal society of chemistry, Cambridge).<br />
Swift RS (1996) Organic matter characterization. In ‘Methods of Soil Analysis, Part 3: Chemical Method’.<br />
(Ed D Sparks, A Page, P Helmke, R Leoppert, P Soltanpour, M Tbatabai, C Johnson, M Summer) pp.<br />
1011−1069. (Soil Sci. Soc. Am. Book Series, Soil Sci. Soc. Am., Madison).<br />
Wada K (1986) Ando <strong>soil</strong>s in Japan. Kyusyu Univ. Press, Fukuoka. 276 pp.<br />
© 2010 19 th World Congress of Soil Science, Soil Solutions for a Changing World<br />
1 – 6 August 2010, Brisbane, Australia. Published on DVD.<br />
48
Effects of plantation forest species on <strong>soil</strong> properties<br />
Ivan Chirino A , Leo Condron A , Roger McLenaghen A <strong>and</strong> Murray Davis B<br />
A<br />
Faculty of Agriculture <strong>and</strong> Life Sciences, PO Box 84, Lincoln University, Lincoln, 7647, New Zeal<strong>and</strong>, Email<br />
Ivan.ChirinoValle@lincoln.ac.nz<br />
B<br />
SCION, PO Box 29237, Fendalton, Christchurch, New Zeal<strong>and</strong>.<br />
Abstract<br />
Large scale afforestation of grassl<strong>and</strong>s has occurred in New Zeal<strong>and</strong>. Detailed investigation of <strong>change</strong>s in<br />
<strong>soil</strong> properties over time following establishment of different tree species is necessary to underst<strong>and</strong> the<br />
impacts of this l<strong>and</strong>-use <strong>change</strong> on <strong>soil</strong> nutrient dynamics <strong>and</strong> availability. A field trial was established in<br />
1999 comprising 4 replicate plots of three commercial tree species (Pinus radiata, Eucalyptus nitens,<br />
Cupressus macrocarpa). Soil samples were taken from each plot prior to tree planting <strong>and</strong> after 5 years<br />
growth (2004). Analyses of samples taken in 1999 showed that the top<strong>soil</strong> (0-5 cm) had a low pH (5.1), with<br />
low to medium levels of total carbon (5.01%), nitrogen (0.43%), phosphorus (630 mg/kg), sulphur (510<br />
mg/kg) <strong>and</strong> ex<strong>change</strong>able base cations (7.52 cmolc/kg). Results for comparison between samples taken in<br />
1999 <strong>and</strong> 2004 revealed a decrease in total C, N, P, S <strong>and</strong> ex<strong>change</strong>able Ca <strong>and</strong> Mg confined to the 0-5 cm<br />
<strong>soil</strong> depth. The reductions were generally greater under P. radiata than E. nitens <strong>and</strong> C. macrocarpa. In<br />
contrast, inorganic <strong>and</strong> plant available Olsen P levels increased under all species. These findings confirm that<br />
afforestation of grassl<strong>and</strong> has a major short-term impact on <strong>soil</strong> properties <strong>and</strong> <strong>processes</strong>.<br />
Key Words<br />
Grassl<strong>and</strong> afforestation, <strong>soil</strong> fertility.<br />
Introduction<br />
Recent large-scale afforestation of pastoral farml<strong>and</strong>s represents a major l<strong>and</strong>-use <strong>change</strong> in New Zeal<strong>and</strong>.<br />
The area under short-rotation plantation forestry (mainly radiata pine (Pinus radiata)) doubled from 0.9 to<br />
1.8 million ha (c. 7% total l<strong>and</strong> area) between 1985 <strong>and</strong> 2005. Most of the established forests were planted<br />
on hill country areas developed under pastoral farming, where significant accumulation of organic matter <strong>and</strong><br />
associated nutrients (nitrogen [N], phosphorus [P], sulphur [S]) occurred in these <strong>soil</strong>s as a consequence of<br />
fertiliser inputs. This <strong>change</strong> in l<strong>and</strong>-use was attributed to a combination of declining returns from pastoral<br />
farming <strong>and</strong> the expectation of increased future returns from forestry. In addition to the potential economic<br />
benefits associated with the establishment of conifer plantations, development of forestry in grassl<strong>and</strong> areas<br />
may help to restore degraded l<strong>and</strong>s <strong>and</strong> control <strong>soil</strong> erosion, especially in hill <strong>and</strong> high country areas (Davis<br />
1998). It is commonly believed that conifers degrade <strong>soil</strong> fertility in various ways, although there has been<br />
little consistent scientific evidence for this (Binkley 1995). However, there is evidence from studies<br />
conducted in New Zeal<strong>and</strong> that there may be some short term beneficial effects associated with the <strong>change</strong> in<br />
l<strong>and</strong> use from grassl<strong>and</strong> to forest such as increased phosphorus availability (Davis <strong>and</strong> Lang 1991; Belton et<br />
al. 1995; Chen et al. 2003). Most afforestation studies carried out to date in New Zeal<strong>and</strong> have focused on<br />
the influence of radiata pine on <strong>soil</strong> properties <strong>and</strong> <strong>processes</strong>, <strong>and</strong> have involved paired site comparisons at<br />
one point in time, commonly 15-20 years after forest establishment (Chen et al. 2000; Chen et al. 2003).<br />
Closer examination of <strong>change</strong>s in <strong>soil</strong> properties over time following establishment of different tree species<br />
is necessary to underst<strong>and</strong> the mechanisms responsible for <strong>change</strong>s in the <strong>soil</strong> organic matter <strong>and</strong> nutrient<br />
availability (Binkley <strong>and</strong> Högberg 1997) which in turn will assist in the development of effective long term<br />
strategies to maintain <strong>soil</strong> quality <strong>and</strong> fertility. The specific objective of this project was to quantify the<br />
effects of the different tree species on selected <strong>soil</strong> properties 5 years after planting.<br />
Methods<br />
Site description<br />
Orton Bradley Park is located near Charteris Bay on Banks Peninsula, Canterbury, New Zeal<strong>and</strong>. The<br />
afforestation trial was planted in pasture on lower north-east aspect slopes on Takahe silt loam (Fragic Pallic)<br />
<strong>soil</strong> formed in greywacke loess. The altitude is 40 m <strong>and</strong> mean annual rainfall is approximately 1000 mm.<br />
The trial area consists of 900m 2 plots comprising four replicates of three species (Pinus radiata, Eucalyptus<br />
nitens <strong>and</strong> Cupressus. macrocarpa) arranged in a r<strong>and</strong>omized block design of twelve plots each measuring<br />
30 m x 30 m.<br />
© 2010 19 th World Congress of Soil Science, Soil Solutions for a Changing World<br />
1 – 6 August 2010, Brisbane, Australia. Published on DVD.<br />
49
Soil sampling <strong>and</strong> analysis<br />
Soil samples were taken by <strong>soil</strong> corer (6 cm diameter) at 4 depths (0-5, 5-10, 10-20, 20-30 cm) from each<br />
replicate plot immediately prior to tree planting in September 1999 <strong>and</strong> again in September 2004. Soil samples<br />
were air-dried <strong>and</strong> sieved
Binkley D, Högberg P (1997) Does atmospheric deposition of nitrogen threaten Swedish forests?. <strong>Forest</strong><br />
Ecology <strong>and</strong> Management 92, 119-152.<br />
Chen CR, Condron LM, Davis MR, Sherlock RR (2000) Effects of afforestation on phosphorus dynamics<br />
<strong>and</strong> biological properties in a New Zeal<strong>and</strong> grassl<strong>and</strong> <strong>soil</strong>. Plant <strong>and</strong> Soil 220, 151-163.<br />
Chen CR, Condron LM, Davis MR, Sherlock RR (2003) Seasonal <strong>change</strong>s in <strong>soil</strong> phosphorus <strong>and</strong> associated<br />
microbial properties under adjacent grassl<strong>and</strong> <strong>and</strong> forest in New Zeal<strong>and</strong>. <strong>Forest</strong> Ecology <strong>and</strong><br />
Management 177, 539-557.<br />
Davis MR (1998) Soil impacts of afforestation in the high country. New Zeal<strong>and</strong> <strong>Forest</strong>ry 42, 34-38.<br />
Davis MR, Lang LH (1991) Increased nutrient availability in top<strong>soil</strong>s under conifers in the South Isl<strong>and</strong> high<br />
country. New Zeal<strong>and</strong> Journal of <strong>Forest</strong> Science 21, 165-179.<br />
Glass BP (1997) A survey of afforestation intentions in New Zeal<strong>and</strong> between 1996 <strong>and</strong> 2010. New Zeal<strong>and</strong><br />
<strong>Forest</strong>ry 42, 34-37.<br />
© 2010 19 th World Congress of Soil Science, Soil Solutions for a Changing World<br />
1 – 6 August 2010, Brisbane, Australia. Published on DVD.<br />
51
Estimation of annual <strong>soil</strong> respiration rate in a larch forest in Central Siberia<br />
Tomoaki Morishita A , Yojiro Matsuura A , Yuichiro Nakai A , Takuya Kajimoto A , Akira Osawa B <strong>and</strong> Olga A.<br />
Zyryanova C<br />
A <strong>Forest</strong>ry <strong>and</strong> <strong>Forest</strong> Products Research Institute, Tsukuba, Japan, Email morisita@affrc.go.jp<br />
B Graduate School of Agriculture, Kyoto university, Kyoto, Japan, Email aosawa@kais.kyoto-u.ac.jp<br />
C V.N. Sukachev Institute of <strong>Forest</strong>, Siberian Branch, Krasnoyarsk, 660036, Russia, Email zyryanova-o@y<strong>and</strong>ex.ru<br />
Abstract<br />
Soil respiration is an important component process of carbon cycle in terrestrial ecosystems. The forested<br />
area of the continuous permafrost zone of Central <strong>and</strong> Northeastern Siberia exceeds that of boreal forests in<br />
other regions of the world. However, <strong>soil</strong> respiration has rarely been studied in Siberia. We conducted <strong>soil</strong><br />
respiration rate (SR) measurement during the three growing seasons (2005–2007) <strong>and</strong> in a mid-winter by<br />
using a closed-chamber technique in a typical mature Larix gmelinii forest in Central Siberia. We examined<br />
micro-scale variations of SR by comparing the three dominant types of forest floor vegetation (lichen <strong>and</strong><br />
mosses); patches of Cladina stellaris, Pleurozium schreberi, <strong>and</strong> Aulacomnium palustre. The daily mean SR<br />
at each period differed among the types: the values throughout the observation period (mg C/m 2 /h) was the<br />
highest in Pleurozium (21–110), followed by Cladina (17–85) <strong>and</strong> Aulacomnium (9–68). The SR was<br />
positively correlated with <strong>soil</strong> temperature. The lowest SR in the Aulacomnium patch was related to higher<br />
<strong>soil</strong> moisture <strong>and</strong> lower <strong>soil</strong> temperature than the other two patches. Estimated annual SR was apparently<br />
smaller in the larch forest of Siberia than those reported for any other boreal forests.<br />
Key Words<br />
CO2 flux, global warming, Russia, Gelisol, hummock, hollow.<br />
Introduction<br />
Soil is the major carbon pool in terrestrial ecosystems (Schlesinger <strong>and</strong> Andrews 2000). Soil respiration (SR)<br />
is an important component process (Schlesinger <strong>and</strong> Andrews 2000) of carbon cycle. SR is positively related<br />
to <strong>soil</strong> temperature in northern hemisphere temperate ecosystems (eg. Hibbard et al. 2005). SR is also<br />
affected by <strong>soil</strong> moisture; very high <strong>soil</strong> moisture can block <strong>soil</strong> pores (Bouma <strong>and</strong> Bryla 2000) <strong>and</strong> very low<br />
<strong>soil</strong> moisture limits microbial <strong>and</strong> root respiration (Yuste et al. 2003). But, in some cases, SR is not related to<br />
<strong>soil</strong> moisture (eg. Palmroth et al. 2005). Boreal forest in Russia plays an important role in carbon storage<br />
(Rozhkov et al. 1996). Larch forest in Central Siberia was characterized by low temperature <strong>and</strong><br />
precipitation, <strong>and</strong> the presence of permafrost. Furthermore, the ground surface was characterized by low<br />
earth hummock microtopography with various lichens <strong>and</strong> mosses. So, it is considered that both <strong>soil</strong><br />
temperature <strong>and</strong> <strong>soil</strong> moisture are very important controller of <strong>soil</strong> respiration in the region. The purpose of<br />
this study was to elucidate the effect of <strong>soil</strong> temperature <strong>and</strong> moisture on the SR related to the difference of<br />
forest floor vegetation in a larch forest in Central Siberia.<br />
Methods<br />
Study site<br />
The study was conducted in Tura (64 o 12’ N, 100 o 27’ E), Central Siberia at the beginning of June in2005<br />
<strong>and</strong> 2007, middle of July in 2005 <strong>and</strong> 2007, beginning of August in 2006, beginning of September in 2005,<br />
2006 <strong>and</strong> 2007, <strong>and</strong> middle of February in 2007. The annual mean temperature <strong>and</strong> precipitation are –9.2 o C<br />
<strong>and</strong> 334 mm, respectively (Robert 1997). Soil type is Gelisol with permafrost below the depth of 70 to 100<br />
cm from the surface <strong>and</strong> poor drainage. The <strong>soil</strong> is frozen from mid– October to the end of May. The forest<br />
consists mainly of Larch (Larix gmelinii) trees about 100 years old. Patches of lichens <strong>and</strong> mosses, mainly<br />
Cladina sp., Pleurozium sp., <strong>and</strong> Aulacomnium sp., cover the forest floor with depth of 10 to 20 cm.<br />
Measurements of <strong>soil</strong> respiration rate (SR)<br />
SR was measured by using a closed chamber technique according to the method of Sawamoto et al. (2000).<br />
Six stainless steel chambers, 25 cm height <strong>and</strong> 20 cm in diameter, were used. Each two chambers were set on<br />
patches of Cladina stellaris, Pleurozium shreberi, <strong>and</strong> Aulacomnium palustre. Before the measurement of<br />
SR, green parts of plants on the forest floor were cut carefully in order to exclude plant respiration. And then,<br />
the chamber collars were installed at 5 cm depth into the <strong>soil</strong> <strong>and</strong> kept overnight to eliminate the disturbance.<br />
In the following day, each 500–mL gas sample was taken into a Tedlar ® bag before the chamber lid was set<br />
© 2010 19 th World Congress of Soil Science, Soil Solutions for a Changing World<br />
1 – 6 August 2010, Brisbane, Australia. Published on DVD.<br />
52
up <strong>and</strong> at 6 minutes after the lid was set up. The SR was measured three times in June, <strong>and</strong> nine times in July<br />
<strong>and</strong> September in a day. Soil temperature <strong>and</strong> moisture as a volumetric water content moisture by TDR<br />
(Hydorosense TM , Campbel Scientific Australia Phy. Ltd.) were measured at a depth of 10 cm <strong>and</strong> 0–12 cm<br />
below the surface near the chambers, respectively. CO2 concentrations in the bags were analysed by portable<br />
gas analyser (LI–820, LICOR). The SR was calculated according to the <strong>change</strong> in CO2 concentrations in the<br />
chamber with time by using a linear regression law.<br />
Statistical analysis<br />
Mean temperatures, <strong>soil</strong> moistures, <strong>and</strong> SR in each patch were calculated from 6 to 18 measurements. Two–<br />
way analysis of variance followed by Fisher’s test was used to compare the means. Multiple regression<br />
analysis was conducted to explain the SR using <strong>soil</strong> temperature <strong>and</strong> moisture. The stepwise method was<br />
used for the calculation. Excel Toukei (SSRI, Japan) was used for all statistical analysis.<br />
Results <strong>and</strong> discussion<br />
Seasonal <strong>change</strong>s of <strong>soil</strong> respiration<br />
As for an example, daily <strong>change</strong> of <strong>soil</strong> temperature, moisture, <strong>and</strong> <strong>soil</strong> respiration in 2005 are shown in<br />
Figure 1. Soil temperatures in each patch were highest in July (max: 13.6 o C at Pleurozium patch), but the<br />
<strong>soil</strong> temperature in night time decreased almost equal to that in June <strong>and</strong> September. Soil temperature in the<br />
Aulacomnium patch was significantly lower than that in other patches in July (6.4 o C) <strong>and</strong> September (4.4<br />
o C). Soil moistures in each patch were higher in September than that in July (Figure 1). Soil moisture in the<br />
Aulacomnium patch was significantly higher than that in other patches in both July (0.31 m 3 /m 3 ) <strong>and</strong><br />
September (0.38 m 3 /m 3 ). Highest SR was observed in Pleurozium patch in July (181 mg C/m 2 /h). Similar<br />
tendency of the daily <strong>change</strong> was observed in other measurements (not shown). There were significant<br />
differences among the mean SR of different patches (Table 1). SR (mg C/m 2 /h) for each patch was in the<br />
following order: Pleurozium (44 ± 28) > Cladina (34 ± 21) > Aulacomnium (26 ± 18). SR in winter was<br />
negligible small, but was observed (max: 1.0 mg C/m 2 /h). Because air (–45 - –25 o C) <strong>and</strong> <strong>soil</strong> (–18.5 o C)<br />
temperature were low extremely, it is considered that CO2 emission was occurred due to leak from deep<br />
layer, not decomposition in winter.<br />
Figure 1. Daily <strong>change</strong>s in <strong>soil</strong> respiration, <strong>soil</strong> temperature, <strong>and</strong> <strong>soil</strong> moisture in the L. gmelinii forest for the<br />
measurement period in June, July, <strong>and</strong> September 2005. Values are means (+SD).<br />
Relationship between SR <strong>and</strong> <strong>soil</strong> temperature <strong>and</strong> moisture<br />
The relationship between the SR <strong>and</strong> <strong>soil</strong> temperature or <strong>soil</strong> moisture is shown in Figure 2. SR was<br />
positively correlated with <strong>soil</strong> temperature (r = 0.71 P < 0.01) (Figure 2a) <strong>and</strong> negatively correlated with <strong>soil</strong><br />
moisture (r = –0.57 P < 0.01) (Figure 2b). It is considered that SR in Aulacomnium patch was smaller than<br />
© 2010 19 th World Congress of Soil Science, Soil Solutions for a Changing World<br />
1 – 6 August 2010, Brisbane, Australia. Published on DVD.<br />
53
other patches due to low <strong>soil</strong> temperature <strong>and</strong> high <strong>soil</strong> moisture (Table 1). Aulacomnium patches were<br />
relatively lower microtpography. So that, rain <strong>and</strong> melted water could be gathered in the patch <strong>and</strong> prevented<br />
to gas diffusion <strong>and</strong> to increase <strong>soil</strong> temperature. The relationship between the SR <strong>and</strong> <strong>soil</strong> temperature was<br />
somewhat different depending on the month (Figure 2a). SR in June was lower than that in any other months<br />
even if the respiration rates were compared at a similar level of <strong>soil</strong> temperature (Figure 2a). The difference<br />
suggests that yearly difference in permafrost thawing would affect the <strong>soil</strong> respiration: the organic horizon<br />
had started to thaw, but the mineral horizon was still frozen in early June. Furthermore, SR includes <strong>soil</strong><br />
microbial respiration <strong>and</strong> plant respiration (Raich <strong>and</strong> Schlesinger 1992). Jiang et al. (2005) reported that<br />
root respiration was relatively higher in summer than that in spring <strong>and</strong> autumn, <strong>and</strong> Q10 values of SR <strong>and</strong><br />
root respiration were different in a larch forest in north-eastern China. So that, the SR in this study might<br />
relatively lower in September than that in July due to a decrease in root respiration (Figure 3).<br />
Table 1. Summary of <strong>soil</strong> temperature, <strong>soil</strong> moisture, <strong>and</strong> <strong>soil</strong> respiration in each patch.<br />
SR Temp. Moist.<br />
mg C/m 2 /h<br />
o<br />
C<br />
3 3<br />
m /m<br />
Cladina 34±21 b 4.3±2.4 a 0.36±0.14 b<br />
Pleurozium 44±28 a 5.0±2.6 a 0.35±0.13 b<br />
Aulacomnium 26±18 c 4.1±2.0 a 0.44±0.14 a<br />
different letters show a significant difference among the vegetation at 5% level<br />
Figure 2. Relationship between <strong>soil</strong> respiration rate <strong>and</strong> <strong>soil</strong> temperature <strong>and</strong> moisture in the L. gmelinii forest.<br />
Annual <strong>soil</strong> respiration rate<br />
As mentioned in the method, <strong>soil</strong> was frozen from October to May. So that, growing season was assumed<br />
from June to September, <strong>and</strong> SR in growing season (113 g C/m 2 ) <strong>and</strong> winter season (11.9 g C/m 2 ) was<br />
calculated separately from each relationship between SR <strong>and</strong> <strong>soil</strong> temperature. The contribution of SR in<br />
winter season to annual SR estimated 9.5%. Annual SR of 125 g C/m 2 was smaller than review value of 322<br />
± 31 g C/m 2 (Raich <strong>and</strong> Schlesinger 1992). The value in this study was similar to that of 94 ± 16 g C/m 2 in<br />
Northern bogs <strong>and</strong> mires (Raich <strong>and</strong> Schlesinger 1992). We could not clarify the reason why, but small<br />
biomass <strong>and</strong> peculiar permafrost <strong>soil</strong> environment in our study site might be related the fact that SR is very<br />
low compared with that in other boreal forests.<br />
Conclusion<br />
The <strong>soil</strong> respiration rate was positively correlated with <strong>soil</strong> temperature <strong>and</strong> negatively correlated with <strong>soil</strong><br />
moisture. The <strong>soil</strong> respiration rate was the lowest in the Aulacomnium patch among the patches examined.<br />
This was due to the high <strong>soil</strong> moisture <strong>and</strong> low <strong>soil</strong> temperature. The estimation of annual <strong>soil</strong> respiration<br />
rate was smaller than those previously reported in other permafrost-free boreal forests. Accumulating<br />
knowledge of the <strong>soil</strong> respiration in boreal forests in the regions of the continuous permafrost appears<br />
necessary for obtaining better estimates.<br />
© 2010 19 th World Congress of Soil Science, Soil Solutions for a Changing World<br />
1 – 6 August 2010, Brisbane, Australia. Published on DVD.<br />
54
References<br />
Bouma TJ, Bryla DR (2000) On the assessment of root <strong>and</strong> <strong>soil</strong> respiration for <strong>soil</strong>s of different textures:<br />
interactions with <strong>soil</strong> moisture contents <strong>and</strong> <strong>soil</strong> CO2 concentrations. Plant <strong>and</strong> Soil 227, 215–221.<br />
Hibbard KA, Law BE, Reichstein M et al. (2005) An analysis of <strong>soil</strong> respiration across northern hemisphere<br />
temperate ecosystems. Biogeochem. 73, 29–70.<br />
Jiang L, Shi F, Li B et al. (2005) Separating rhizosphere respiration from total respiration in two larch<br />
plantations in northeastern China. Tree Physiol. 25, 1187–1195.<br />
Palmroth S, Maier CA, McCarthy HR et al. (2005) Contrasting responses to drought of forest floor CO2<br />
efflux in a Loblolly pine plantation <strong>and</strong> a nearby Oak-Hickory forest. Global Change Biol 11, 421–434.<br />
Raich JW, Schlesinger WH (1992) The global carbon dioxide flux in <strong>soil</strong> respiration <strong>and</strong> its relationship to<br />
vegetation <strong>and</strong> climate. Tellus 44B, 81–99.<br />
Rozhkov VA, Wagner VB, Kogut BM et al. (1996) Soil carbon estimates <strong>and</strong> <strong>soil</strong> carbon map for Russia.<br />
IIASA, WP–96–60<br />
Sawamoto T, Hatano R, Yajima T et al. (2000) Soil respiration in Siberian taiga ecosystems with different<br />
histories of forest fire. Soil Sci. Plant Nutr. 46, 31–42.<br />
Schlesinger WH, Andrews JA (2000) Soil respiration <strong>and</strong> the global carbon cycle. Biogeochem. 48, 7–20.<br />
Yuste JC, Janssens IA, Carrara A et al. (2003) Interactive effects of temperature <strong>and</strong> precipitation on <strong>soil</strong><br />
respiration in a temperate maritime pine forest. Tree Physiol. 23, 1263–1270.<br />
© 2010 19 th World Congress of Soil Science, Soil Solutions for a Changing World<br />
1 – 6 August 2010, Brisbane, Australia. Published on DVD.<br />
55
Evaluation of growth of paricá (Schizolobium amazonicum Huber (Duck)) in<br />
differents agroforestry systems in northeast of Pará, Brazil<br />
Maria de Lourdes Pinheiro Ruivo A ; Maria de Lourdes Soares Oliveira B ; Iracema Maria C. C. Cordeiro C ;<br />
Kátia Paiva Monteiro D , Dirse Clara Kern A <strong>and</strong> Cristine Bastos do Amarante A<br />
A<br />
Museu Paraense Emílio Goeldi, Coordenação de Ciências da Terra e Ecologia, Campus de Pesquisa, Belém, Pará, Brazil,<br />
Email ruivo@museu-goeldi.com.br<br />
B<br />
Universidade do Estado do Pará, Belém, Pará, Brazil, Email moliveira10@yahoo.com.br<br />
C<br />
Empresa Tramontina, Distrito Industrial de Icoaraci, Belém, Pará, Brazil, Email mgti@amazon.com.br<br />
D<br />
Universidade Rural da Amazônia , Belém, Pará, Brazil, Email kpgarcez@amazon.com.br<br />
Abstract<br />
Paricá (Schizolobium amazonicum Huber (Ducke)), typical of Amazon, is a important tree in reforestation<br />
due to good conditions of adaptation to associations with other species <strong>and</strong> it possesses great wood industry<br />
potential, mainly for the recovery of degraded areas. In this work, different systems of h<strong>and</strong>ling have been<br />
compared as a function of environmental breeding, located on experimental farms northeastern of the Pará<br />
State, Brazil: Tailândia do Pará (areas with <strong>and</strong> without addition of wood residues) <strong>and</strong> Aurora do Pará<br />
(association of Paricá with Curauá (Ananas erectifolius)). The methodology was visits to the field to observe<br />
the Paricá development through the collection of data (height <strong>and</strong> diameter) <strong>and</strong> collection of <strong>soil</strong> samples<br />
under the cultures for determination of fertility. In Tailândia do Pará, the culture of Paricá with addition of<br />
wood residue presented trees with bigger height (12,00 m) <strong>and</strong> diameter at breast height (24,00 cm), after 4<br />
years of plantation, in relation to the area without addition (10,3 m <strong>and</strong> 20,00 cm, respectively). In Aurora do<br />
Pará, the culture of Paricá in association with Curauá, also presented trees with bigger height (11,5 m) <strong>and</strong><br />
diameter (25,74 cm) in relation to the culture without this association (9,5 m <strong>and</strong> 20,36 cm, respectively).<br />
Key Words<br />
Rrecuperation of degraded areas, reforestation of native species, Brazilian Amazon, <strong>soil</strong> management,<br />
associations with other species, wood industry potential.<br />
Introduction<br />
The Amazon region represents a very important part in the environmental area to the worldwide level, due to<br />
its large tropical nature reserve, <strong>and</strong> because of deforestation for commercial purposes, contributing to the<br />
destruction of natural resources (Kato 2003). Studies on the use of agroforestry systems in conservation of<br />
the environment are being conducted in several localities in the region (Cordeiro 1999; Rodrigues 2006)<br />
showing the major social <strong>and</strong> environmental benefits from reforestation with native species <strong>and</strong> management<br />
of secondary forest to maintain productivity without any <strong>change</strong> of the ecosystem. Among the species most<br />
studied in these systems is the forestry species Paricá (Schizolobium amazonicum Huber (Ducke)), typical of<br />
the Brazilian Amazon, with good conditions to adapt to associations with other species, <strong>and</strong> furthermore it is<br />
a species with great wood industry potential, mainly by the recuperation of degraded areas, so it is an<br />
important tree for use in reforestation (Cordeiro 1999; Monteiro 2004). Thus, this paper focuses on studies<br />
involving the development of the species Paricá (Schizolobium amazonicum) in different systems of <strong>soil</strong><br />
management <strong>and</strong> its correlation with <strong>soil</strong> quality in the areas of study.<br />
Methodology<br />
The main data were collected in two experimental farms, in two locations in northeastern of Pará: Tailândia<br />
do Pará (planting Paricá (Schizolobium amazonicum) in areas with <strong>and</strong> without addition of wood waste),<br />
where the planting began in 1999, so that in the beginning of the present research the reforestation was<br />
already over 4 years old, <strong>and</strong> Aurora do Pará (association of Paricá with Curauá (Ananás erectifolius)),<br />
reforestation accounts also for more than 4 years of implementation, but under a management, more<br />
specialized, with technical assistance, rotation <strong>and</strong> association of forestry species. In order to compare the<br />
different managements in terms of environmental improvement, field visits were made with relevant<br />
environmental observations in both areas, by observing the development of Paricá (visually evaluated with<br />
measurement of height with graduated scale <strong>and</strong> diameter with a caliper) <strong>and</strong> collecting samples of <strong>soil</strong> under<br />
crops for determination of <strong>soil</strong> fertility.<br />
© 2010 19 th World Congress of Soil Science, Soil Solutions for a Changing World<br />
1 – 6 August 2010, Brisbane, Australia. Published on DVD.<br />
56
Results<br />
In Tailândia for the <strong>soil</strong> recovered with waste wood, the s<strong>and</strong> fraction which is the main component (440 <strong>and</strong><br />
500 g/kg of <strong>soil</strong>) decreased with depth (200 g/kg of <strong>soil</strong>), a content that characterize these <strong>soil</strong>s of s<strong>and</strong>y clay<br />
loam texture. The <strong>soil</strong> with waste has a lower density than those without waste, ranging from 1.19 g/cm 3 <strong>and</strong><br />
1.51 g/cm 3 , respectively, in the horizon A. The total porosity is significantly higher in the <strong>soil</strong> with waste,<br />
ranging from 49% in the horizon A of Paricá (Schizolobium amazonicum) with residue to 39% in the A<br />
horizon of the Paricá without waste. In planting of Paricá with residue also has higher level of C <strong>and</strong> sum of<br />
bases. In the field, we can observe that the area that received the material had an extraordinary development<br />
in relation to the growth of the paricá, visible even to the naked eye, compared with the area where not was<br />
covered with wood waste. With regard to plant growth in the culture of Paricá, we observed that in the area<br />
where cover of sawmill residue was placed the trees had larger diameter at breast height 4 years after<br />
planting, furthermore a greater percentage (20%) of trees survived. When comparing the distribution of<br />
diameter classes in the area where sawmill residue was not applied there was a predominance of two classes<br />
(15-20 cm <strong>and</strong> 20-25 cm, with more of the latter). Moreover, in the planting without residue application there<br />
is a major variation in the diameter class of trees (10-15 cm, 15- 20 cm , 20-25 cm) (Monteiro 2004). The<br />
addition of organic material to the <strong>soil</strong> by the slow decomposition of wood favored the development of the<br />
species Paricá (Schizolobium amazonicum), which through the addition <strong>and</strong> incorporation into the <strong>soil</strong> of<br />
new organic material, through the fall of leaves, twigs residues <strong>and</strong> of the root system of plants (light organic<br />
material) led to the creation of an favorable environment for better vegetal development, in relation to the<br />
area that was not recovered with of wood (Table 1).<br />
Table 1. Values of h <strong>and</strong> DAP of the Schizolobium parahyba var amazonicum (Huber ex Ducke) Barneby (Paricá)<br />
in differents planting systems.<br />
Site Time<br />
planting systems h(m) DAP(cm) Increment<br />
(months)<br />
(average) (average) h(m) Dap(cm)<br />
Aurora 48 Paricá with curauá 11.5 25.74 2.05 3.0<br />
Aurora 48 Paricá without curauá 9.5 20.36 1. 8 2.22<br />
Tailândia 48 Paricá with addition of wood waste 12.0 24.0 2.0 2.5<br />
Tailândia 48 Paricá without addition of wood waste 10.3 20.0 1.5 1.0<br />
In Aurora do Pará, the area presents differents planting systems, in association with the agricultural <strong>and</strong><br />
forestry species that investigated for recovery of degraded areas (Table 1). Those systems are agroforestry<br />
by the association between Paricá (Schizolobium amazonicum Huber ex Ducke), Curauá (Ananás erectifolius<br />
L.B. Smith), Freijó (Cordia goeldiana Huber), Mogno (Swietenia macrophylla King), among others;<br />
presenting better development of Schizolobium amazonicum. Here, the <strong>soil</strong>s are of the Yellow Lato<strong>soil</strong> type<br />
with s<strong>and</strong>y clay texture, low organic matter content <strong>and</strong> high leaching. Low values of pH <strong>and</strong> levels of N <strong>and</strong> P.<br />
As a method of investigation of the recuperation <strong>processes</strong>, indicators were used the <strong>change</strong>s in the<br />
morphostructural conditions of the <strong>soil</strong> profiles. In relation to the results of the company Tailaminas Plac,<br />
Tailândia do Pará, it was observed that the <strong>soil</strong>s covered with wood waste presented profiles with better<br />
features such as color was darker, <strong>soil</strong> was s<strong>and</strong>y, <strong>and</strong> with good drainage, compared with <strong>soil</strong>s without<br />
waste application.<br />
It was observed that the two systems have differences due to management, because the Tramontina Farm<br />
have better results despite the system has less time of implementation that in Tailândia. Since Tailândia uses<br />
waste of litter empirically in monoculture using fertilization in cultures of Paricá (Schizolobium<br />
amazonicum), eucalyptus (Eucalyptus spp) <strong>and</strong> pupunha (Bactris gasipaes). The physical conditions are the<br />
same; both types of <strong>soil</strong>s have low organic matter <strong>and</strong> nutrients, Yellow Latosols (Monteiro 2004; Cordeiro<br />
2005). Even so Tailândia has a good development because the trees planted in the area under coverage of<br />
waste present major growth compared to plants in the original <strong>soil</strong>. Tramontina has a management, that is<br />
more specialized, <strong>and</strong> has also technical assistance, the difference in this system is that the fertilization was<br />
made in the beginning, but now they do not use fertilizer on their crops, only doing cleaning, rotation <strong>and</strong><br />
association of species, since it is an agroforestry system, affecting of course the economic factor, Tailândia<br />
does not yet have the economic resources necessary for technological development of the system.<br />
The Paricá (Schizolobium amazonicum Huber (Ducke)) is a viable native species for recuperation of<br />
disturbed areas <strong>and</strong> with a place in the wood market, nationally <strong>and</strong> internationally. Its rapid growth <strong>and</strong><br />
adaptation to areas with low nutrient levels allows it to be optimum in agroforestry systems (Cordeiro 1999),<br />
being the second plant species used in reforestation in the state of Para (Cometti 2005). The species<br />
© 2010 19 th World Congress of Soil Science, Soil Solutions for a Changing World<br />
1 – 6 August 2010, Brisbane, Australia. Published on DVD.<br />
57
Schizolobium amazonicum shows better results due to the influence of <strong>soil</strong> preparation, in this case the<br />
Tramontina farm, furthermore, by use of agroforestry practice <strong>and</strong> technical assistance. It presents an<br />
improvement of physical <strong>and</strong> chemical properties of <strong>soil</strong> <strong>and</strong> major response of trees in those areas with<br />
wood waste that shows that the Paricá responds to good management practices.<br />
Conclusions<br />
The Paricá (Schizolobium amazonicum Huber (Ducke)) is a viable native species for recuperation of<br />
disturbed areas <strong>and</strong> with a role in the wood market, nationally <strong>and</strong> internationally. Its rapid growth <strong>and</strong><br />
adaptation to areas with low nutrient levels allow it to be optimum in agroforestry systems, being the second<br />
plant species used in reforestation in the state of Para. The species Schizolobium amazonicum shows better<br />
results in the treatments where influence <strong>soil</strong> preparation, in this case the Tramontina farm, furthermore, by<br />
agroforestry practice <strong>and</strong> technical assistance present. It presents an improvement of physical <strong>and</strong> chemical<br />
properties of <strong>soil</strong> <strong>and</strong> major development of the trees in those areas with wood waste that shows that the<br />
Paricá responds to good management practices.<br />
References<br />
Cordeiro IMCC (1999) ‘Performance diferencial de crescimento da espécie Schizolobium amazonicum<br />
Huber (Ducker) em sítios degradados sob diferentes regimes de Preparação de área na microregião do<br />
Guamá, Aurora do Pará, Pará’. (UFPA: Núcleo de Altos Estudos Amazônicos, Belém, Pará, Brasil).<br />
Cordeiro IMCC (2005) ‘Comportamento das espécies Paricá (Schizolobium amazonicum Huber ex Ducke) e<br />
Curauá (Ananas erectifolius L.B Smith) em diferentes sistemas de cultivo, Aurora do Pará, Pará.’ (UFRA:<br />
Belém, Pará, Brasil).<br />
Cometti JL (2005) ‘Gestão de Resíduos de madeira como cobertura orgânica do solo em culturais florestais,<br />
Tailândia do Pará, Pará’. (UEPA: Belém, Pará, Brasil).<br />
Monteiro KFG (2004) ‘Utilização de resíduos de madeira como cobertura no solo: o estudo de caso de um<br />
sistema agroflorestal no estado do Pará’. (UFRA: Belém, Pará, Brasil).<br />
Rodrigues RC (2006) ‘Biomassa Microbiana e Acúmulo de Liteira em SAF´s a formação com Meliáceas.’<br />
(UFRA: Belém, Pará, Brasil).<br />
Kato MSA (2003) ‘Tecnologias para melhoria dos sistemas de produção da agricultura familiara com base<br />
no manejo de capoeiras na amazônia, com ênfase em alternativas ao uso de fogo’. (EMBRAPA-CPATU:<br />
Belém, Pará, Brasil).<br />
© 2010 19 th World Congress of Soil Science, Soil Solutions for a Changing World<br />
1 – 6 August 2010, Brisbane, Australia. Published on DVD.<br />
58
How an advanced combination of <strong>soil</strong> science, biogeochemistry, <strong>and</strong> paleoecology<br />
helps Ecuadorian cloud forest management<br />
Boris Jansen A , Femke Tonneijck B , Henry Hooghiemstra C , Emiel van Loon D <strong>and</strong> Koos Verstraten E<br />
A<br />
Institute for Biodiversity <strong>and</strong> Ecosystem Dynamics - Earth Surface Sciences, Universiteit van Amsterdam, Amsterdam, The<br />
Netherl<strong>and</strong>s - President of the Dutch Soil Science Society, Email B.Jansen@uva.nl<br />
B<br />
IUCN National Committee of The Netherl<strong>and</strong>s, Amsterdam, The Netherl<strong>and</strong>s, Email Femke.Tonneijck@iucn.nl<br />
C<br />
Institute for Biodiversity <strong>and</strong> Ecosystem Dynamics - Paleo-ecology <strong>and</strong> L<strong>and</strong>scape Ecology, Universiteit van Amsterdam,<br />
Amsterdam, The Netherl<strong>and</strong>s, Email H.Hooghiemstra@uva.nl<br />
D<br />
Institute for Biodiversity <strong>and</strong> Ecosystem Dynamics - Computational Geo-Ecology, Universiteit van Amsterdam, Amsterdam, The<br />
Netherl<strong>and</strong>s, Email E.E.vanLoon@uva.nl<br />
E<br />
Institute for Biodiversity <strong>and</strong> Ecosystem Dynamics - Earth Surface Sciences, Universiteit van Amsterdam, Amsterdam, The<br />
Netherl<strong>and</strong>s, Email J.M.Verstraten@uva.nl<br />
Abstract<br />
Montane forest composition <strong>and</strong> specifically the position of the upper forest line (UFL) is very sensitive to<br />
climate <strong>change</strong> <strong>and</strong> human interference. As a consequence, reconstructions of past altitudinal UFL dynamics<br />
<strong>and</strong> forest species composition are instrumental to infer relationships between climate <strong>change</strong> <strong>and</strong> vegetation<br />
dynamics, <strong>and</strong> assess the impact of (pre)historic human settlement. We developed an innovative combination<br />
of techniques derived from <strong>soil</strong> science, molecular organic geochemistry, palynology, <strong>and</strong> vegetation<br />
ecology to reconstruct past forest dynamics from fossil pollen <strong>and</strong> biomarkers preserved in <strong>soil</strong>s <strong>and</strong> peat<br />
deposits. Here we present the results of the first application of the new approach to reconstruct the natural<br />
position of the UFL in a biodiversity hotspot of montane rainforest in the Ecuadorian Andes where its<br />
location is highly disputed. Our results show that the current páramo vegetation above 3600 m in the area is a<br />
natural ecosystem rather than the product of deforestation. As a consequence, Kyoto Protocol triggered<br />
reforestation activities in this part of the Ecuadorian Andes should be limited to maximally 3600 m elevation.<br />
Aforestation at higher elevations will disturb the natural páramo ecosystem <strong>and</strong> affect the carbon storage<br />
potential of the <strong>soil</strong>.<br />
Key Words<br />
Reforestation, upper forest line dynamics, biomarker analysis, pollen analysis, pedogenesis.<br />
Introduction<br />
The highest parts of the tropical Andes in Ecuador consist of fragile ecosystems characterized by a high<br />
biodiversity. They are mainly inhabited by indigenous populations that entirely rely on subsistence use of the<br />
natural resources. The ecosystems in these high montane areas include páramo grassl<strong>and</strong>s <strong>and</strong> humid<br />
montane rain (<strong>and</strong> cloud) forests, which originally covered large tracts from Venezuela to Peru. These<br />
ecosystems fulfill important environmental functions e.g. supply of drinking <strong>and</strong> irrigation water,<br />
biodiversity conservation, carbon storage, agricultural production <strong>and</strong> tourism. Over the past decades,<br />
population pressure on the systems in question has rapidly increased <strong>and</strong> agricultural l<strong>and</strong> use has strongly<br />
exp<strong>and</strong>ed, often using inappropriate techniques <strong>and</strong> leading to rampant degradation. Natural upper montane<br />
forests have been widely replaced by either potato cultivation or tree plantations (Hofstede et al. 2002), <strong>and</strong><br />
native páramo grassl<strong>and</strong>s are over-exploited by grazing <strong>and</strong> burning. In many situations the intense l<strong>and</strong> use<br />
is believed to have lead to a downward push of the upper forest line (UFL: defined as the elevation with the<br />
highest occurrence of continuous forest). However, upward movements of montane forest have also been<br />
attributed to global warming, particularly affecting mountain ecosystems (Price 1999). Contradictory results<br />
from fossil pollen analysis on the one h<strong>and</strong> <strong>and</strong> vegetation analysis on the other have resulted in scientific<br />
debate about the natural position of the UFL in the Ecuadorian Central Valley. In the Gu<strong>and</strong>era Biological<br />
Station that protects one of the last remaining stretches of cloud forest in the Inter-Andean Central Valley,<br />
scientific estimates of the natural position of the UFL ranged from the present day position of approximately<br />
3600 m a.s.l. (above sea level) to a hypothesized 4000 m a.s.l. (Laegaard 1992; Wille et al. 2002). Such<br />
uncertainty is severely hindering sustainable management of the remaining stretches of cloud forest,<br />
including reforestation projects under Kyoto Protocol CO2 emission trade schemes. The main aim of the five<br />
year program “Reconstruction of the Upper <strong>Forest</strong> Line in Ecuador (RUFLE)” that was concluded in 2009,<br />
was to obtain better insight into forest dynamics in the Ecuadorian Andes in general under biotic <strong>and</strong> a-biotic<br />
pressures, <strong>and</strong> in particular to reconstruct the most likely natural position of the UFL in the northern Andes.<br />
To overcome the scientific uncertainty an interdisciplinary multi-proxy approach was chosen. In this<br />
© 2010 19 th World Congress of Soil Science, Soil Solutions for a Changing World<br />
1 – 6 August 2010, Brisbane, Australia. Published on DVD.<br />
59
approach an innovative combination of techniques derived from <strong>soil</strong> science, molecular organic<br />
geochemistry, palynology, <strong>and</strong> vegetation ecology was set up to identify the spatio-temporal vegetation<br />
dynamics along series of altitudinal transects that cross current <strong>and</strong> past forest-páramo transitions.<br />
Methods<br />
The study area<br />
The study area is part of the Gu<strong>and</strong>era Biological Reserve in El Carchi province in northern Ecuador. The<br />
Reserve is located approximately 11 km from the town of San Gabriel in the Eastern Cordillera. It protects<br />
approximately 10 km 2 of high altitude páramo grassl<strong>and</strong> as well as extensive areas of relatively undisturbed<br />
montane cloud forest. Most of the Andean forest is left between 3300 <strong>and</strong> 3640 m elevation. Above an<br />
altitude of 3640 m grass páramo dominates the l<strong>and</strong>scape but some forest patches occur up to 3700 m<br />
altitude. The <strong>soil</strong>s in the study area were formed in three distinct tephra deposits of Holocene age (Tonneijck<br />
et al. 2008). They consist of Histosols with <strong>and</strong>ic properties at sites currently covered by continuous forest,<br />
Andic Cambisols in forest patches above the UFL <strong>and</strong> Andosols at the sites currently covered by páramo<br />
vegetation (Tonneijck et al. 2009). In addition to <strong>soil</strong>s, two peat deposits in the area were sampled <strong>and</strong><br />
analysed. Vegetation in the study area was thoroughly analysed <strong>and</strong> described as part of the project (Moscol<br />
Olivera <strong>and</strong> Cleef 2008a,b).<br />
Soil analysis<br />
All <strong>soil</strong>s sampled were extensively described, chemically <strong>and</strong> physically analysed <strong>and</strong> 14 C dated (Tonneijck<br />
et al. 2008; Tonneijck <strong>and</strong> Jongmans 2008; Tonneijck et al. 2006). A micro-morphological assessment of<br />
bioturbation features formed an important part of the analyses with an aim of obtaining the<br />
chronostratigraphy of the <strong>soil</strong>s (Tonneijck <strong>and</strong> Jongmans 2008). For this, thin sections were analysed using a<br />
Leitz M420 makrozoom microscope <strong>and</strong> a Leitz Wetzlar petrographic microscope. Thin sections were<br />
described following the micro-morphological terminology of Stoops (Stoops 2003). Abundance classes were<br />
as follows: very few (< 5%), few (5 – 15%), common (15 – 30%), frequent (30 – 50%), dominant (50 – 70%)<br />
<strong>and</strong> very dominant (> 70%).<br />
Analysis of molecular biomarkers<br />
In the biomarker approach, plant species typical for specific vegetation zones are examined for the presence<br />
of biomarkers, defined as plant-specific (combinations of) molecular components. The most likely<br />
c<strong>and</strong>idates for application as biomarker to distinguish forest from non-forest vegetation were n-alkanes, nalcohols<br />
<strong>and</strong> n-fatty acids in the carbon number range of C20-C36 that uniquely occur in the wax layers of<br />
leaves <strong>and</strong> in roots of higher plants in varying combinations. Along the altitudinal transect the plant species<br />
responsible for the dominant biomass input in <strong>soil</strong>s were sampled <strong>and</strong> several intact <strong>soil</strong> monoliths collected.<br />
The lipids from the plant <strong>and</strong> <strong>soil</strong> samples were extracted <strong>and</strong> analyzed with a combination of Accelerated<br />
Solvent Extraction (ASE) <strong>and</strong> gas chromatography-mass spectrometry (GC/MS) optimized for this purpose<br />
(Jansen et al. 2006a). Plant lipids were tested for unique combinations of n-alkanes, n-alcohols <strong>and</strong> n-fatty<br />
acids through cluster analysis using Ward’s method (Jansen et al. 2006b). To unravel the mixed <strong>soil</strong> lipid<br />
signal with depth, a discrete linear model (VERHIB) was developed that describes the accumulation of lipids<br />
in the <strong>soil</strong>. By inversion the most likely vegetation composition leading to the mixed biomarker signal in the<br />
<strong>soil</strong> was derived (Jansen et al. 2009).<br />
Fossil pollen analysis<br />
From the same <strong>soil</strong> samples used to establish the biomarker signal, fossil pollen were extracted <strong>and</strong> analysed.<br />
In addition, the modern pollen rain in the area was sampled. All samples were processed using the st<strong>and</strong>ard<br />
pre-treatment including sodium pyrophosphate, acetolysis, <strong>and</strong> heavy liquid (bromoform) separation (Faegri<br />
<strong>and</strong> Iversen 1989). To calculate pollen concentration values, one tablet of exotic Lycopodium spores was<br />
added to each sample prior to processing. Pollen samples were mounted in glycerin gelatin <strong>and</strong> counted with<br />
a Zeiss microscope at 500x magnification. For identification, pollen morphological descriptions published by<br />
Bogotá et al. (1996) <strong>and</strong> Hooghiemstra (1984), <strong>and</strong> the modern pollen reference collection at Amsterdam<br />
laboratory were used. A minimum of 400 pollen grains from terrestrial taxa was counted for all samples. The<br />
data were plotted <strong>and</strong> cluster analysis was carried out with TILIA, TILIAGRAPH, CONISS <strong>and</strong> TG-view<br />
(Bakker et al. 2008).<br />
© 2010 19 th World Congress of Soil Science, Soil Solutions for a Changing World<br />
1 – 6 August 2010, Brisbane, Australia. Published on DVD.<br />
60
Results<br />
Figure 1 provides an example of the percentage forest cover (all forest species grouped together) as<br />
reconstructed from biomarkers <strong>and</strong> fossil pollen from a <strong>soil</strong> monolith at 3480 m a.s.l. in a site currently part<br />
of the continuous forest. From Figure 1 it is clear that fossil pollen <strong>and</strong> molecular biomarkers both point to<br />
the same trends in forest cover with time. However, important differences are also visible as for instance at<br />
55 cm depth where the biomarkers indicate a much more pronounced shift in percentage forest cover that<br />
also peaks slightly earlier than indicated in the pollen record. The reason is that as a result of the wind blown<br />
dispersal of pollen, the pollen record yields a regional image of shifts in vegetation patterns. In contrast, due<br />
to their leaf origin, biomarkers provide a much more local picture. Most likely, the peak at 55 cm indicates a<br />
local phenomenon such as nearby páramo patches within the integral forest that also occur at present day<br />
(Moscol Olivera <strong>and</strong> Cleef 2008b) <strong>and</strong> are predominantly reflected in the local biomarker record. The steady<br />
<strong>and</strong> concurrent decline in percentage forest cover from 20 cm upward might be interpreted as a decline in<br />
UFL position, but given the distance of the site from the current UFL <strong>and</strong> the local nature of the biomarker<br />
record, it more likely reflects deforestation coupled with encroaching agricultural fields from the valley<br />
below the current forest. These results illustrate how the multi-proxy approach when we subsequently<br />
applied it in the complete sequence of <strong>soil</strong>s <strong>and</strong> peat deposits, allowed for a reconstruction of past dynamics<br />
of forest vegetation patterns with unprecedented detail. A reconstruction where the regional scale vegetation<br />
dynamics obtained from fossil pollen <strong>and</strong> present day vegetation patterns e.g. (Bakker et al. 2008; Moscol<br />
Olivera <strong>and</strong> Cleef 2008a; Moscol Olivera <strong>and</strong> Cleef 2008b) was complemented with the local scale<br />
information yielded by biomarker analysis (Jansen et al. 2008; Jansen et al. 2009). Not only did this allow us<br />
to reconstruct the altitudinal shifts of the UFL over time, the combined data also provided detailed<br />
information about <strong>change</strong>s in forest composition over time, often at species level. The study of pedogenetic<br />
<strong>processes</strong> allowed for an assessment of the maximum attainable resolution of the fossil pollen <strong>and</strong><br />
biomarkers preserved in <strong>soil</strong>s. In addition, it provided the time frame for the vegetation reconstructions <strong>and</strong><br />
served as proxy to distinguish between forest <strong>and</strong> páramo vegetation through its organic matter composition<br />
(Tonneijck <strong>and</strong> Jongmans 2008). From our combined results we infer that during the last 10,000 years the<br />
UFL in the study area did not reach altitudes above 3700 m.<br />
Figure 1. The percentage forest cover over time reconstructed from biomarkers (solid line) <strong>and</strong> fossil pollen<br />
(dotted line) from a <strong>soil</strong> monolith at 3480 m a.s.l. within the current integral forest at the Gu<strong>and</strong>era research site.<br />
© 2010 19 th World Congress of Soil Science, Soil Solutions for a Changing World<br />
1 – 6 August 2010, Brisbane, Australia. Published on DVD.<br />
61
Conclusion<br />
We conclude that the multi-proxy approach developed offers a valuable new tool to reconstruct past forest<br />
dynamics in general <strong>and</strong> in particular UFL positions within areas with volcanic ash <strong>soil</strong>s where its natural<br />
location is uncertain due to human interference, climate <strong>change</strong> or both. With respect to the uncertainty<br />
whether the present-day páramo vegetation in the Gu<strong>and</strong>era Biological Station has a natural background or is<br />
the result of human induced deforestation, we conclude that the natural undisturbed UFL was below 3700 m<br />
<strong>and</strong> páramo vegetation above 3600 m is a natural ecosystem. As a consequence, Kyoto Protocol triggered<br />
reforestation activities in this part of the Ecuadorian Andes should be limited to maximally 3600 m elevation.<br />
Afforestation above 3600 m, in particular with exotic trees such as Eucalyptus <strong>and</strong> Mexican pine (mainly<br />
Pinus patula <strong>and</strong> P. radiata), should be strongly discouraged. Not only from a conservational point of view,<br />
but also because it will affect the carbon storage potential of the <strong>soil</strong>.<br />
References<br />
Bakker J, Moscol M, Hooghiemstra H (2008) Holocene environmental <strong>change</strong> at the upper forest line in<br />
northern Ecuador. The Holocene 18, 877-893.<br />
Bogotá RG, Lamprea SJ, Rangel JO (1996) Atlas palinológico de la clase Magnoliopsida en el páramo de<br />
Monserrate. El Páramo Ecosistema a Proteger 2, 131-191.<br />
Faegri K, Iversen J (1989) Textbook of pollen analysis. (Wiley: Chichester)<br />
Hofstede RGM, Groenendijk JP, Coppus R, Fehse JC, Sevink J (2002) Impact of pine plantations on <strong>soil</strong>s<br />
<strong>and</strong> vegetation in the Ecuadorian High Andes. Mountain Research <strong>and</strong> Development 22, 159-167.<br />
Hooghiemstra H (1984) Vegetational <strong>and</strong> climatic history of the High plain of Bogotá, Colombia. (J.<br />
Cramer: Vaduz)<br />
Jansen B, Haussmann NS, Tonneijck FH, Verstraten JM. De Voogt P (2008) Characteristic straight-chain<br />
lipid ratios as a quick method to assess past forest - páramo transitions in the Ecuadorian Andes.<br />
Palaeogeography Palaeoclimatology Palaeoecology 262, 129-139.<br />
Jansen B, Nierop KGJ, Kotte MC, De Voogt P, Verstraten JM (2006a) The application of Accelerated<br />
Solvent Extraction (ASE) to extract lipid biomarkers from <strong>soil</strong>s. Applied Geochemistry 21, 1006-1015.<br />
Jansen B, Nierop KGJ, Hageman JA, Cleef A, Verstraten JM (2006b) The straight-chain lipid biomarker<br />
composition of plant species responsible for the dominant biomass production along two altitudinal<br />
transects in the Ecuadorian Andes. Organic Geochemistry 37, 1514-1536.<br />
Jansen B, Van Loon EE, Hooghiemstra H, Verstraten JM (2009) Analysis of plant biomarkers greatly<br />
improves reconstruction of palaeo-environments. Palaeogeography Palaeoclimatology Palaeoecology<br />
(accepted).<br />
Laegaard S (1992) Influence of fire in the grass páramo vegetation of Ecuador. In 'Páramo, an Andean<br />
ecosystem under human influence'. (Eds H Balslev, JL Luteyn) pp 151-170. (Academic Press: London)<br />
Moscol Olivera MC, Cleef AM (2008a) A phytosociological study of the páramo along two altitudinal<br />
transects in northern Ecuador. Phytocoenologia 39, 79-107.<br />
Moscol Olivera, MC, Cleef AM (2008b) Vegetation composition <strong>and</strong> altitudinal distribution of montane rain<br />
forests in northern Ecuador. Phytocoenologia 39, 175-204.<br />
Price M (1999) Global Change in the Mountains. (Parthenon: New York)<br />
Stoops G (2003) Guidelines for analysis <strong>and</strong> description of <strong>soil</strong> <strong>and</strong> regolith thin sections. (Soil Science<br />
Society of America Inc: Madison, WI)<br />
Tonneijck FH, Hageman JA, Sevink J, Verstraten JM (2008) Tephra stratification of volcanic ash <strong>soil</strong>s in<br />
Northern Ecuador. Geoderma 144, 231-247.<br />
Tonneijck FH et al. (2009) Carbon stocks <strong>and</strong> stabilization mechanisms in volcanic ash <strong>soil</strong>s under natural<br />
upper montane forest <strong>and</strong> grassl<strong>and</strong> in northern Ecuador. European Journal of Soil Science (accepted).<br />
Tonneijck FH, Jongmans AG (2008) The influence of bioturbation on the vertical distribution of <strong>soil</strong> organic<br />
matter in volcanic ash <strong>soil</strong>s: a case study in northern Ecuador. European Journal of Soil Science 59,<br />
1063-1075.<br />
Tonneijck FH, Van der Plicht J, Jansen B, Verstraten JM, Hooghiemstra H (2006) Radiocarbon dating of <strong>soil</strong><br />
organic matter fractions in Andosols in Northern Ecuador. Radiocarbon 48, 337-353.<br />
Wille M, Hooghiemstra H, Hofstede R, Fehse J, Sevink J (2002) Upper forest line reconstruction in a<br />
deforested area in northern Ecuador based on pollen <strong>and</strong> vegetation analysis. Journal of Tropical<br />
Ecology 18, 409-440.<br />
© 2010 19 th World Congress of Soil Science, Soil Solutions for a Changing World<br />
1 – 6 August 2010, Brisbane, Australia. Published on DVD.<br />
62
Impact of forest <strong>soil</strong> compaction on <strong>soil</strong> atmosphere composition<br />
N. Goutal A , P. Renault B , I. Cousin C , P. Bonnaud A , D. Gelhaye A , G. Nourisson A <strong>and</strong> J. Ranger A<br />
A Biogeochemistry of forest ecosystem, INRA Centre de Nancy, France.<br />
B EMMAH (<strong>soil</strong> gas), INRA Avignon, France.<br />
C SOLS (hydraulic properties), INRA Orléans, France.<br />
Abstract<br />
Soil compaction has become an important issue for forest <strong>soil</strong> sustainability because the increasing timber<br />
dem<strong>and</strong> <strong>and</strong> the mechanization of all silvicultural operations have led to a higher traffic level. Soil<br />
compaction causes a physical degradation which in turn disrupts many other functions e.g. wood production,<br />
biodiversity, greenhouse gas emission, surface water quality. Two experimental sites were designed in the<br />
North-East of France to study the <strong>change</strong>s of <strong>soil</strong>s subject to heavy traffic by forest machinery, on the short<br />
<strong>and</strong> the long-term. These sites are representative of highly <strong>soil</strong>s sensitive to compaction. They present the<br />
same general functioning (neoluvisol), but they differ on some physical (strength, bulk density, clay content)<br />
<strong>and</strong> chemical properties (pH, chemical saturation). The <strong>soil</strong> atmosphere composition is directly impacted by<br />
<strong>soil</strong> compaction (<strong>change</strong> of voids volume, size <strong>and</strong> connection) but also indirectly by <strong>change</strong> of other <strong>soil</strong><br />
properties like water content, temperature <strong>and</strong> biological activity. On the two sites, we observed a decrease in<br />
O2 concentration <strong>and</strong> an increase in CO2 concentration due to traffic, especially during wet periods. The<br />
<strong>change</strong> of <strong>soil</strong> atmosphere composition will probably impact root growth, gas emissions, microbial <strong>and</strong><br />
faunal activity <strong>and</strong> probably have a negative feedback on <strong>soil</strong> recovery dynamic.<br />
Key Words<br />
Soil compaction, <strong>soil</strong> gases.<br />
Introduction<br />
The general mechanization of forest operations <strong>and</strong> the increase of wood dem<strong>and</strong> has resulted in an increase<br />
in physical damages to <strong>soil</strong>s. Soils subject to heavy traffic will deform until equilibrium between external<br />
forces <strong>and</strong> the counter-forces of the <strong>soil</strong> is reached which mainly depends on <strong>soil</strong> intrinsic characteristics<br />
determining the <strong>soil</strong> sensitivity <strong>and</strong> on <strong>soil</strong> moisture. Therefore, <strong>soil</strong> compaction induces <strong>change</strong>s in the<br />
volume, the size <strong>and</strong> the continuity of voids (Soane <strong>and</strong> Van Ouwerkerk 1994, Roh<strong>and</strong> et al. 2004; Shestak<br />
<strong>and</strong> Busse 2005; Lam<strong>and</strong>é et al. 2005). These physical modifications will more or less impact transfer<br />
<strong>processes</strong> (water, gas, heat) <strong>and</strong> consequently <strong>soil</strong> oxygenation <strong>and</strong> flooding. Soil flora, fauna <strong>and</strong> microbial<br />
activity will be constrained with a negative feedback on the dynamics of <strong>soil</strong> restoration. The consequences<br />
of heavy traffic on <strong>soil</strong> are often interdependent <strong>and</strong> few studies have tackled the issue of the <strong>change</strong>s of a<br />
compacted forest <strong>soil</strong> on the long-term considering all the functions impacted.<br />
As <strong>soil</strong> deformation under wheel tracks damages the pore system <strong>and</strong> increases the volume of <strong>soil</strong> occupied<br />
by water (Shestak <strong>and</strong> Busse 2005), the aeration status of the <strong>soil</strong> will be disturbed (Von Wilpert <strong>and</strong><br />
Schäffer 2005) <strong>and</strong> <strong>soil</strong> respiration rate will <strong>change</strong>. Consequently the composition of its atmosphere may<br />
<strong>change</strong> significantly (Soane <strong>and</strong> Van Ouwerkerk 1994). Simojoki et al. (1991) cited by Soane <strong>and</strong> Van<br />
Ouwerkerk (1994) <strong>and</strong> Mac Afee et al. (1989) cited by Soane <strong>and</strong> Van Ouwerkerk (1994) observed a<br />
significant diminution in O2 concentration due to <strong>soil</strong> compaction. The presence of gas like CH4, N2O, H2S<br />
or H2, even in low concentration, is an indicator of restricted <strong>soil</strong> aeration <strong>and</strong> its oxygenation status (Soane<br />
<strong>and</strong> Van Ouwerkerk 1994). For example, Teepe et al. (2004) recorded enhanced N2O emissions from<br />
compacted <strong>soil</strong>s. The aims of this study were to monitor <strong>change</strong>s in <strong>soil</strong> atmosphere composition following<br />
the traffic of forest machinery on the short <strong>and</strong> long-term <strong>and</strong> to determine the relation between the<br />
succession of restricted / well-aerated periods with the other parameters influenced by heavy traffic (<strong>soil</strong><br />
structure, water content, temperature). The underlying questions were –i- how <strong>and</strong> how much are the<br />
functions <strong>and</strong> functioning of forest <strong>soil</strong>s affected by compaction? <strong>and</strong> –ii-how long does it take to restore <strong>soil</strong><br />
functions <strong>and</strong> functioning after heavy traffic?<br />
Methods<br />
Two experimental sites have been set up in Lorraine (NE part of France). They are located in the “Hauts-<br />
Bois” forest - Azerailles (48° 29′ 19″ N, 6° 41′ 43″ E), Meurthe et Moselle, <strong>and</strong> in the “Gr<strong>and</strong> Pays” forest -<br />
Clermont en Argonne (49° 06′ 23″ N, 5° 04′ 18″ E), Meuse. Each site was clear-cut <strong>and</strong> timber (Fagus<br />
© 2010 19 th World Congress of Soil Science, Soil Solutions for a Changing World<br />
1 – 6 August 2010, Brisbane, Australia. Published on DVD.<br />
63
sylvatica, Quercus petraea mainly) were extracted with a cable yarding system to avoid damaging the <strong>soil</strong>.<br />
Afterwards a forwarder drove on the <strong>soil</strong> only for an equivalent of two travels in spring 2007 in Azerailles<br />
(AZ) <strong>and</strong> in spring 2008 in Clermont en Argonne (CA). The tyres of the forwarder measured 600/55 * 26,5<br />
<strong>and</strong> were inflated to a pressure of 350 kPa. Its total weight was 21 to 25 tonnes. The sites of Clermont en<br />
Argonne <strong>and</strong> Azerailles have an elevation of 270m <strong>and</strong> 300m respectively. The climate of the region is<br />
characterised by a 30-year mean annual temperature of 9°C (Azerailles) to 9,5 °C (Clermont en Argonne)<br />
<strong>and</strong> a 30-year annual precipitation of 900 mm (Azerailles) to 1000mm (Clermont en Argonne).<br />
The <strong>soil</strong> of both sites is classified as a neoluvisol (WRB 1990) <strong>and</strong> is developed on a silt layer of<br />
approximately 40-50 cm based on a clayey layer (textural breaking causing a temporary water logging). The<br />
<strong>soil</strong> of both sites is hence considered as highly sensitive to compaction <strong>and</strong> some chemical <strong>and</strong> physical<br />
differences between the two sites may influence the behaviour <strong>and</strong> restoration after compaction allowing to<br />
identify their main causes. The <strong>soil</strong> of the Azerailles site has a pH varying between 4.6 <strong>and</strong> 5.2 along the<br />
profile with 22, 56 <strong>and</strong> 22 % of clay, silt <strong>and</strong> s<strong>and</strong> respectively from the surface to a depth of 30-40 cm <strong>and</strong><br />
with 30 to 60, 32 to 50 <strong>and</strong> 8 to 18 % of clay, silt <strong>and</strong> s<strong>and</strong> from 30-40 cm to 1m depth. Whereas the <strong>soil</strong> pH<br />
of the Clermont en Argonne site varies between 4.4 <strong>and</strong> 5.1 along the profile, with 13, 72 <strong>and</strong> 15 % of clay,<br />
silt <strong>and</strong> s<strong>and</strong> respectively from the surface to a depth of 30-40 cm <strong>and</strong> with 21 to 33, 54 to 65 <strong>and</strong> 13 to 14 %<br />
of clay, silt <strong>and</strong> s<strong>and</strong> from 30-40 cm to 1m depth.<br />
The whole site area (about 5 ha) was split in three blocks to control site variability. The sites were<br />
instrumented to monitor numerous parameters, measured at different time <strong>and</strong> spatial scales to underst<strong>and</strong><br />
how the <strong>soil</strong> is degraded <strong>and</strong> how theses parameters interact. One block was equipped for investigations in i-<br />
climate (rainfall, air temperature, air saturation index), ii <strong>soil</strong> climate e.g. Soil moisture using TDR system<br />
(Time Domain Reflectometry) <strong>and</strong> <strong>soil</strong> temperature using sensors inserted at different <strong>soil</strong> depth (15, 30 <strong>and</strong><br />
60 cm in the undisturbed plot, 10, 25 <strong>and</strong> 55 cm in the compacted plot, 5 replicates per depth * treatment).<br />
The sites were also equipped with piezometers distributed on the whole site area with some of them (10 in<br />
CA <strong>and</strong> 12 in AZ) fitted with sensors recording every 4 hours the water table level <strong>and</strong> the others being<br />
measured once a month. The <strong>soil</strong> gases were collected once a month in Azerailles from 42 gas collectors (5<br />
depths * 3 blocks * 2 treatments + 2 * 1 depth * 1 treatment * 2 blocks + 5 * 1 depth * 1 block * 2 treatment)<br />
<strong>and</strong> in Clermont en Argonne from 32 gas collectors (5 depths * 3 blocks * 2 treatments + 2 * 1 depth * 1<br />
treatment * 2 blocks). Each collector is composed of a tube that connects a subsurface <strong>soil</strong> air equilibration<br />
port <strong>and</strong> a sampling port at the <strong>soil</strong> surface. The gas collectors were inserted into the <strong>soil</strong> at different depths<br />
(10, 25, 35, 50 <strong>and</strong> 70 cm for the undisturbed plots; 7, 15, 25, 40 <strong>and</strong> 60 cm for the compacted plots), in the<br />
control plot (C) the depth of the gas collector is roughly always 10 cm above the depth of the equivalent one<br />
in the compacted plot (T), to account for the volume loss in the compacted one.<br />
Results<br />
The forwarder traffic led to an increase in bulk density of 26% <strong>and</strong> 17% compared to the initial values in the<br />
first 10 cm in AZ <strong>and</strong> in CA respectively. This impact decreased with <strong>soil</strong> depth but was still significant at 60<br />
cm depth. The <strong>change</strong>s in water content <strong>and</strong> temperature through the year differed also between treatments,<br />
but the effect of compaction on <strong>soil</strong> moisture <strong>and</strong> temperature depended on the season, the depth <strong>and</strong> the site<br />
considered.<br />
The composition of <strong>soil</strong> atmosphere was highly variable within the same plot (1 site * 1 block * 1 treatment)<br />
probably due the high site variability of water table level, water content <strong>and</strong> physical parameters (bulk<br />
density, hydraulic properties, air permeability). Nevertheless some general patterns could be drawn:<br />
-During wet periods, O2 concentration in the compacted plots was lower than in the undisturbed plots <strong>and</strong><br />
CO2 concentration was higher in the compacted plots than in the undisturbed ones.<br />
-In CA CO2 concentration was always more important in the compacted plots than in the undisturbed ones,<br />
even during dry periods. Besides, the amplitude of the impact of <strong>soil</strong> compaction on O2 <strong>and</strong> CO2<br />
concentrations varied among sites, but as they weren’t compacted at the same date, it is too early to draw<br />
some conclusions from these different amplitudes.<br />
-In AZ no CH4 could be found in the <strong>soil</strong> atmosphere whereas in CA some CH4 occurred at least during the<br />
first year after compaction (in AZ the gas collector were installed one year after compaction, in CA they<br />
were installed 2 months after compaction).<br />
© 2010 19 th World Congress of Soil Science, Soil Solutions for a Changing World<br />
1 – 6 August 2010, Brisbane, Australia. Published on DVD.<br />
64
-In AZ the atmosphere of the undisturbed <strong>soil</strong> had a higher N2O concentration than the one of the compacted<br />
<strong>soil</strong>. In CA it was exactly the opposite situation.<br />
In AZ the 5 gas collectors per treatment inserted at the same depth <strong>and</strong> near the moisture <strong>and</strong> temperature<br />
sensors, allowed investigations on the relations between <strong>soil</strong> physical properties affected by compaction <strong>and</strong><br />
<strong>soil</strong> atmosphere composition. For example, the two following figures display the data collected from these 10<br />
gas collector. They show that CO2 concentration was lower in the C-treatment only from December 2008 to<br />
April 2009, period where the air-filled porosity was far lower in the compacted T-treatment than in the Ctreatment.<br />
However, even if the air-filled porosity remained more or less lower in the T-treatment from April<br />
2009 to October 2009, the CO2 concentration of the C-treatment became higher than in the T-treatment in<br />
that period. Two hypothesis can be made to explain these observations; -i- the respiration was more<br />
important in the C-treatment than in the T-treatment where the biological activity was probably most of the<br />
year anaerobic <strong>and</strong> –ii- when the compacted <strong>soil</strong> dries it cracks more than the undisturbed <strong>soil</strong> allowing faster<br />
gas ex<strong>change</strong> between the <strong>soil</strong> <strong>and</strong> the atmosphere (phenomenon observed when measuring the air<br />
permeability of the <strong>soil</strong> as a function of <strong>soil</strong> water content, data not shown).<br />
air-filled porosity (%vol.), temperature (°C)<br />
air-filled porosity (%vol), temperature<br />
(°C)<br />
30<br />
25<br />
20<br />
15<br />
10<br />
5<br />
0<br />
01/11/2008<br />
30<br />
25<br />
20<br />
15<br />
10<br />
5<br />
0<br />
01/11/2008<br />
16/11/2008<br />
16/11/2008<br />
01/12/2008<br />
01/12/2008<br />
16/12/2008<br />
31/12/2008<br />
15/01/2009<br />
30/01/2009<br />
14/02/2009<br />
01/03/2009<br />
16/03/2009<br />
Azerailles, T 25cm depth<br />
air filled porosity temperature CO2 concentration (mean + std error)<br />
31/03/2009<br />
15/04/2009<br />
30/04/2009<br />
15/05/2009<br />
Azerailles, C 30cm depth<br />
air-filled porosity temperature CO2 concentration (mean + std error)<br />
16/12/2008<br />
31/12/2008<br />
15/01/2009<br />
30/01/2009<br />
14/02/2009<br />
01/03/2009<br />
16/03/2009<br />
31/03/2009<br />
15/04/2009<br />
30/04/2009<br />
15/05/2009<br />
Conclusions<br />
The traffic of forest machinery has an impact on <strong>soil</strong> atmosphere composition which depends on many other<br />
factors also affected by <strong>soil</strong> compaction. Consequently it is important to monitor on the long term all the <strong>soil</strong><br />
properties impacted by <strong>soil</strong> compaction to underst<strong>and</strong> how <strong>soil</strong> functions <strong>change</strong> <strong>and</strong> interact. For example,<br />
in Azerailles CO2 emissions were measured at the same time as the sampling of <strong>soil</strong> gas <strong>and</strong> near the gas<br />
collectors (F.Parent <strong>and</strong> D.Epron, EEF, Nancy University). The results show that CO2 emissions throughout<br />
the year were lower in the compacted plots than in the control plots although <strong>soil</strong> atmosphere displayed<br />
higher CO2 concentrations in the compacted plots during wet periods <strong>and</strong> in the undisturbed plots during dry<br />
periods.<br />
References<br />
Lam<strong>and</strong>é M, Ranger J, Lefevre Y (2005) ‘Effets de l'exploitation forestière sur la qualité des sols’. (Les<br />
dossiers forestiers: 15, O.N.F., Paris).<br />
Roh<strong>and</strong> K, Al Kalb A, Herbauts J, Verbrugge JC (2004) Changes in some mechanical properties of a loamy<br />
<strong>soil</strong> under the influence of mechanized forest exploitation in a beech forest of central Belgium. Journal of<br />
Terramechanics 40, 235-253.<br />
Shestak CJ, Busse MD (2005) Compaction alters physical but not biological indices of <strong>soil</strong> health. Soil<br />
30/05/2009<br />
30/05/2009<br />
© 2010 19 th World Congress of Soil Science, Soil Solutions for a Changing World<br />
1 – 6 August 2010, Brisbane, Australia. Published on DVD.<br />
14/06/2009<br />
14/06/2009<br />
29/06/2009<br />
29/06/2009<br />
14/07/2009<br />
14/07/2009<br />
29/07/2009<br />
29/07/2009<br />
13/08/2009<br />
13/08/2009<br />
28/08/2009<br />
28/08/2009<br />
12/09/2009<br />
12/09/2009<br />
27/09/2009<br />
27/09/2009<br />
12/10/2009<br />
12/10/2009<br />
1<br />
0<br />
2,5<br />
2<br />
1,5<br />
1<br />
0,5<br />
0<br />
2,5<br />
2<br />
1,5<br />
0,5<br />
CO2 concentration (%)<br />
CO2 concentration (%)<br />
65
Science Society of America Journal 69, 236-246.<br />
Soane BD, Van Ouwerkerk C (1994) ‘Soil Compaction in Crop Production’. (Amsterdam: Elsevier science:<br />
BV).<br />
Teepe R, Brumme R, Beese F, Ludwig B (2004) Nitrous oxide emission <strong>and</strong> methane consumption<br />
following compaction of forest <strong>soil</strong>s. Soil Science Society of America Journal 68, 605-<br />
611.<br />
Von Wilpert K, Schäffer J (2006) Ecological effects of <strong>soil</strong> compaction <strong>and</strong> initial recovery dynamics: a<br />
preliminary study. European Journal of <strong>Forest</strong> Research 125, 129-138.<br />
© 2010 19 th World Congress of Soil Science, Soil Solutions for a Changing World<br />
1 – 6 August 2010, Brisbane, Australia. Published on DVD.<br />
66
Impact of tree species on the distribution of amorphous silica in an acid brown<br />
<strong>soil</strong><br />
Jean-Thomas Cornelis A , Hugues Titeux A , Jacques Ranger B <strong>and</strong> Bruno Delvaux A<br />
A Earth <strong>and</strong> Life Institute, Soil Science, Université Catholique de Louvain, Belgium, E-mail : jean-thomas.cornelis@uclouvain.be<br />
B Biogeochemistry of forest ecosystem, INRA Centre de Nancy, France<br />
Abstract<br />
Biogenic silica (BSi) precipitates in leaves <strong>and</strong> needles of trees <strong>and</strong> contributes to the amorphous silica<br />
fraction (ASi) in <strong>soil</strong> through litterfall. In forest ecosystem, the ubiquitous <strong>and</strong> significant ASi pool could<br />
influence the Si mass-balance at watershed scale, which plays a major in the global biogeochemical<br />
<strong>processes</strong>. Thus, an accurate quantification of the ASi pool in forest <strong>soil</strong>s is a m<strong>and</strong>atory step. Here, we<br />
examined the distribution of the ASi in an acid brown <strong>soil</strong> under various tree species (Douglas fir, Black pine<br />
<strong>and</strong> European beech) established in identical <strong>soil</strong> <strong>and</strong> climate conditions. We quantified the ASi<br />
concentration in <strong>soil</strong> with alkaline extraction (Na2CO3 0.1M). The mean content of ASi in humus layer<br />
significantly decreases in the sequence (mg ASi / g): Douglas fir (14.5) > European beech (11.8) > Black<br />
pine (5.4). Tree species impacts the ASi pool in the humus layer through different uptakes of H4SiO4 0 <strong>and</strong><br />
accumulation of BSi in leaves <strong>and</strong> needles. In mineral layers, pedogenic <strong>processes</strong> could hide tree species<br />
impact on ASi concentration, which decreases from the humus layer to 15 cm depth <strong>and</strong> then progressively<br />
increases from 15 to 75 cm depth under each three species. In <strong>soil</strong>, the distribution of the ASi content seems<br />
rather influenced by translocation-dissolution, pedogenic opal formation <strong>and</strong> ASi sorption onto Fe oxides.<br />
Our data imply that forest ecosystem type impacts the stock of BSi in a <strong>soil</strong>-tree system.<br />
Key Words<br />
Silicon cycle, phytoliths, pedogenesis, temperate forest.<br />
Introduction<br />
Silicon (Si), the second mass abundant element of the crustal Earth (Wedepohl 1995), plays a major role in<br />
global biogeochemical <strong>processes</strong>. The continental cycle of Si strongly impacts the oceanic biogeochemical<br />
cycle of Si, as l<strong>and</strong>-ocean fluxes contributes to more than 80% of the input of dissolved Si (DSi) in the<br />
oceans (Tréguer et al. 1995). Terrestrial plants largely contribute to the DSi pool since their annual biogenic<br />
silica (BSi) production ranges from 60 to 200 Tmol year -1 (Conley 2002), which rivals BSi production of<br />
diatoms in oceans (240 Tmol year -1 ) (Tréguer et al. 1995). Besides the primary crystalline silicates <strong>and</strong> the<br />
secondary clay minerals, <strong>soil</strong> also contains an amorphous silica (ASi) fraction having both pedogenic (Wada<br />
et al. 1989) <strong>and</strong> biogenic (BSi) origins (Drees et al. 1989). As the solubility of ASi is an order of magnitude<br />
higher than the one of the crystalline silicate minerals (Fraysse et al. 2009), amount of ASi in <strong>soil</strong>s could<br />
influence the release of DSi in <strong>soil</strong> solutions <strong>and</strong> the export to the hydrosphere. An accurate quantification of<br />
the ASi pool in <strong>soil</strong>s is a m<strong>and</strong>atory step to better underst<strong>and</strong> the Si mass-balance at watershed scale. ASi<br />
pool in forest <strong>soil</strong> is likely impacted by tree species, because Si uptake by vegetation <strong>and</strong> return of BSi to <strong>soil</strong><br />
are tree species-dependent (Cornelis et al. 2010). However, the influence of tree species on ASi pool has not<br />
been measured yet. There is a variety of methodology used for extracting ASi from <strong>soil</strong>s (Sauer et al. 2006).<br />
Among them, Saccone et al. (2007) prove that alkaline methods are adequate to dissolve ASi fraction in<br />
<strong>soil</strong>s. Here, we isolate the impact of tree species on the distribution of ASi since <strong>soil</strong> physical <strong>and</strong> chemical<br />
properties were identical between tree plots when the experimental site was set up. Then, our study aims to<br />
evaluate the relative impact of Si recycling by forest tree species on the ASi concentration in a temperate<br />
forest <strong>soil</strong>.<br />
Methods<br />
The experimental site is located at Breuil-Chenue (Nièvre-Morvan, France). Over the period 2001-2006, the<br />
mean annual rainfall is 1212 mm <strong>and</strong> the mean annual temperature is 9 °C. The acid brown <strong>soil</strong> is classified<br />
as an Alumnic Cambisol (IUSS 2006) <strong>and</strong> is developed from granite very poor in major cations (0.5% MgO,<br />
0.6% CaO <strong>and</strong> 4.4% K2O). The native mixed forest (oak <strong>and</strong> European beech) was clear-cutted in 1976 <strong>and</strong><br />
replaced by monospecific plots of Douglas fir, Black pine <strong>and</strong> European beech.<br />
Phytoliths was extracted form leaves <strong>and</strong> needles through digestion at 120 °C in a concentrated HNO3 (70 %)<br />
/ H2O2 (30 %) mixture.<br />
© 2010 19 th World Congress of Soil Science, Soil Solutions for a Changing World<br />
1 – 6 August 2010, Brisbane, Australia. Published on DVD.<br />
67
In this study, the alkaline solution (Na2CO3 0.1 mol l -1 , pH = 11.2) was applied to extract ASi in forest <strong>soil</strong><br />
samples. The wet alkaline method is based on the fact that the solubility of ASi is strongly enhanced at pH<br />
above 9. Corrections for the simultaneous amorphous <strong>and</strong> crystallize dissolution of Si have been made using<br />
time course extractions (DeMaster 1981; Saccone et al. 2007). Here, approximately 30 mg of dried <strong>soil</strong> (< 2<br />
mm) was mixed in 40 ml of alkaline solution <strong>and</strong> digested at 85 °C during 5 hours. One milliliter was<br />
removed from the extraction solution after 15, 60, 120, 180, 240 <strong>and</strong> 300 minutes <strong>and</strong> was neutralized with 9<br />
ml of 0.022 mol l -1 HCl. DSi was determined by ICP-AES. Under the extraction conditions, we assume that<br />
(i) most ASi dissolved completely within the first 2 hours of the extraction <strong>and</strong> (ii) alumino-silicates released<br />
Si at a constant rate over the whole extraction time. Extracted SiO2 (mg g -1 ) was plotted versus time <strong>and</strong> ASi<br />
concentration was estimated extrapolating the linear part to zero time (intercept value on Y-axis) following<br />
the theoretical curve to correct for continuous crystalline silicates dissolution (DeMaster 1981; Saccone et al.<br />
2007).<br />
Results<br />
Figure 1 shows that the ASi content in the humus layer was affected by tree species. The mean content of<br />
ASi (mg SiO2 g -1 ) in humus layer significantly decreased in the sequence: Douglas fir (14.5±0.65) ><br />
European beech (11.8±0.30) > Black pine (5.4±0.31). Between 0 <strong>and</strong> 7.5 cm <strong>soil</strong> depth, the content of ASi<br />
was significantly higher under European beech than under Douglas fir <strong>and</strong> Black pine. At the other <strong>soil</strong><br />
depth, there was no significantly difference between tree species. The ASi distribution with depth shows very<br />
similar trend under each tree species: a decrease of the ASi pool from the humus layer to 15 cm depth <strong>and</strong> a<br />
slight increase from 15 to 75 cm depth.<br />
Oh<br />
0-7.5cm<br />
7.5-15cm<br />
15-30cm<br />
30-45cm<br />
45-60cm<br />
60-75cm<br />
ASi/mg SiO 2 g -1<br />
0 2 4 6 8 10 12 14 16<br />
Figure 1. Mean ASi concentration in humus (Oh) <strong>and</strong> <strong>soil</strong> layers, expressed as mg SiO2 g -1 of dry matter.The ASi<br />
content is evaluated by wet alkaline dissolution (Na2CO3 0.1 mol l -1 ) under European beech (black), Douglas fir<br />
(grey) <strong>and</strong> Black pine (white). The error bar (n = 3) represents the st<strong>and</strong>ard error.<br />
In our sample, we assume that ASi pool includes biogenic <strong>and</strong> pedogenic opal as well as ASi sorption onto<br />
Fe oxides but not short-range ordered silicates such as allophane <strong>and</strong> imogolite because the acidic conditions<br />
in the humus layer (pH (H2O) = 4 - 4.76) <strong>and</strong> the aqueous speciation of Al <strong>and</strong> Si.<br />
Conclusion<br />
In identical <strong>soil</strong> <strong>and</strong> climate conditions, Cornelis et al. (2010) prove that the annual Si uptake is clearly<br />
dependent on tree species, decreasing in the sequence: Douglas fir (30.6±8.0 kg ha -1 yr -1 ) > European beech<br />
(23.3±6.5 kg ha -1 yr -1 ) > Black pine (2.3±0.9 kg ha -1 yr -1 ). This study also reveals that, at least, 83% of the Si<br />
uptake is annually recycled on top<strong>soil</strong> through litterfall. Thus, tree species impacts the ASi pool in organic<br />
horizons through various Si uptake <strong>and</strong> restitution on top<strong>soil</strong>. The decrease of the ASi content between<br />
humus layer <strong>and</strong> 15 cm depth, may be due to the translocation <strong>and</strong> dissolution of phytoliths followed by rootuptake<br />
<strong>and</strong>/or leaching. Between 15 <strong>and</strong> 75 cm depth, the slight increase of the ASi content is probably due<br />
to the translocation-accumulation of stable phytoliths, precipitation of pedogenic opal <strong>and</strong> ASi sorption onto<br />
Fe oxides.<br />
© 2010 19 th World Congress of Soil Science, Soil Solutions for a Changing World<br />
1 – 6 August 2010, Brisbane, Australia. Published on DVD.<br />
68
Thus, we demonstrate that tree species impacts the ASi stock in the humus layer through various Si<br />
recycling. The tree’s root uptake influences the Si <strong>soil</strong>-solution equilibrium <strong>and</strong> subsequently dissolution of<br />
poorly crystalline <strong>and</strong> non crystalline inorganic <strong>soil</strong> components. Trees act both as a source (BSi restitution)<br />
<strong>and</strong> a sink (Si uptake) of dissolved Si in <strong>soil</strong> solution. More than 30 years after plantation, the ASi<br />
concentration in <strong>soil</strong> is influenced by the Si recycling but also by pedogenic <strong>processes</strong>. In our temperate <strong>and</strong><br />
granitic environment, the study of the relative contribution of small ASi pool <strong>and</strong> large crystalline silicates<br />
pool on the dissolved Si need more consideration.<br />
References<br />
Conley DJ (2002) Terrestrial ecosystems <strong>and</strong> the global biogeochemical silica cycle. Global Biogeochemical<br />
Cycles 16 (4), GB1121, doi:10.1029/2002GB001894.<br />
Cornelis JT, Ranger J, Iserentant A, Delvaux B (2010) Tree species impact the terrestrial cycle of silicon<br />
through various uptakes. Biogeochemistry 97, 231-245.<br />
DeMaster DJ (1981) The supply <strong>and</strong> accumulation of silica in the marine environments. Geochimica et<br />
Cosmochimica Acta 45, 1715–1732.<br />
Drees LR, Wilding LP, Smeck NE, Sankayi AL (1989) Silica in <strong>soil</strong>s: quartz <strong>and</strong> disordered silica<br />
polymorphs. In ‘Minerals in Soil Environments’ (Eds JB Dixon, SB Weed) pp. 913-974. (Soil Science<br />
Society of America Book Series No. 1, Madison, WI).<br />
Fraysse F, Pokrovsky OS, Schott J, Meunier JD (2009) Surface chemistry <strong>and</strong> reactivity of plant phytoliths<br />
in aqueous solutions. Chemical Geology 258, 197-206.<br />
Sauer D, Saccone L, Conley DJ, Herrmann L, Sommer M (2006) Review of methodologies for extracting<br />
plant-available <strong>and</strong> amorphous Si from <strong>soil</strong>s <strong>and</strong> aquatic sediments. Biogeochemistry 80, 89–108.<br />
Saccone L, Conley DJ, Koning E, Sauer D, Sommer M, Kaczorek D, Blecker SW, Kelly EF (2007)<br />
Assessing the extraction <strong>and</strong> quantification of amorphous silica in <strong>soil</strong>s of forest <strong>and</strong> grassl<strong>and</strong><br />
ecosystems. European Journal of Soil Science 58, 1446–1459.<br />
Tréguer P, Nelson DM, Van Bennekom AJ, De Master DJ, Leynaert A, Quéguiner, B (1995) The silica<br />
balance in the world ocean: a reestimate. Science 268, 375-379<br />
Wada K (1982) Allophane <strong>and</strong> imogolite. In ‘Minerals in Soil Environments’ (Eds JB Dixon, SB Weed) pp.<br />
1051-1087. (Soil Science Society of America Book Series No. 1, Madison, WI).<br />
Wedepohl KH (1995) The composition of the continental crust. Geochimica et Cosmochimica Acta 59,<br />
1217-1232.<br />
© 2010 19 th World Congress of Soil Science, Soil Solutions for a Changing World<br />
1 – 6 August 2010, Brisbane, Australia. Published on DVD.<br />
69
Impacts of nitrogen additions <strong>and</strong> harvest residue management on chemical<br />
composition of <strong>soil</strong> carbon in a plantation forest<br />
Zhiqun Huang A,B , Peter Clinton A <strong>and</strong> Murray Davis A<br />
A Scion, P. O. Box 29237, Fendalton, Christchurch, New Zeal<strong>and</strong>.<br />
B Corresponding author. Email zhiqun.huang@scionresearch.com<br />
Abstract<br />
Soils are the major pool of terrestrial C globally that, if carefully managed, can be used to offset rising<br />
atmospheric CO2. An important consideration for the forestry sector is how forest management practices<br />
might impact on the forest <strong>soil</strong> C stock. An experiment has been set up to determine how long-term<br />
fertilisation <strong>and</strong> harvest residue management will affect <strong>soil</strong> C stocks <strong>and</strong> the relative abundance of<br />
biochemically resistant compounds in <strong>soil</strong> organic C. The early results suggested that <strong>soil</strong> C concentration<br />
has not been affected by fertilisation <strong>and</strong> harvesting methods. The following results were achieved in the<br />
light fraction of <strong>soil</strong> organic matter (SOM): long-term fertilisation increased alkyl C <strong>and</strong> alkyl-to-O-alkyl<br />
ratio; the abundance of cutin-derived compounds was greater in fertilised <strong>soil</strong> C than in non-fertilised <strong>soil</strong> C;<br />
major carbohydrates (mannose, glucose <strong>and</strong> sucrose) decreased in the fertilised plot despite greater forest<br />
litter inputs. Also, in the light fraction of SOM, the stem only harvesting treatment had a greater amount of<br />
cutin-derived compounds <strong>and</strong> carbohydrates, compared with whole tree harvest treatment. The project will<br />
eventually lead to a better underst<strong>and</strong>ing of forest management impacts on both quantity <strong>and</strong> quality of <strong>soil</strong> C<br />
in New Zeal<strong>and</strong> forests.<br />
Key Words<br />
Soil organic matter, carbon chemical composition, NMR, forest plantation.<br />
Introduction<br />
Soils are the major pool of terrestrial C globally that, if carefully managed, can be used to offset rising<br />
atmospheric CO2 (Lal 2005). <strong>Forest</strong> <strong>soil</strong>s make up about 30 % of <strong>soil</strong> organic C in terrestrial ecosystems<br />
(J<strong>and</strong>l et al. 2007). In New Zeal<strong>and</strong>, an important consideration for the forestry sector is how forest<br />
management practices might impact on forest <strong>soil</strong> C stock to meet Kyoto Protocol requirements. An increase<br />
in nitrogen (N) due to long-term fertilisation is predicted to increase forest productivity (Smith et al. 1994;<br />
Smith et al. 2000), whereas whole tree harvesting can generally reduce second rotation forest productivity<br />
(Walmsley et al. 2009). However, on average, <strong>soil</strong>s contain three times as much C as terrestrial vegetation.<br />
Thus if <strong>change</strong>s in N availability or forest harvesting methods alter <strong>soil</strong> C turnover, net C sinks or sources<br />
from increased or decreased forest growth could be significantly enhanced or reduced, depending on the<br />
direction of the <strong>soil</strong> responses. Soil organic compounds are made up of different pools which vary in their<br />
turnover time or rate of decomposition. The labile <strong>soil</strong> organic compounds, such as proteins <strong>and</strong><br />
carbohydrates, turn over relatively rapidly (< five years), whereas biochemically resistant compounds, such<br />
as lipids from leaf cuticles <strong>and</strong> roots <strong>and</strong> lignin from woody tissues, are expected to remain stable throughout<br />
10- to 100-yearl timescales. Unfortunately, considerable uncertainty remains concerning which <strong>soil</strong> organic<br />
matter (SOM) structures are likely to be accumulated or degraded in forest ecosystems under the increased N<br />
availability or from the <strong>change</strong>d inputs of harvesting slash <strong>and</strong> litter. The sensitivities of SOM decomposition<br />
to <strong>soil</strong> N availability or <strong>change</strong> in litter input in forest ecosystems are critical for modelling <strong>change</strong>s in <strong>soil</strong> C<br />
stock.<br />
Methods<br />
The trial site is located in Berwick forest, Dunedin of New Zeal<strong>and</strong> <strong>and</strong> is part of an intensive harvesting<br />
long-term <strong>soil</strong> productivity research program. A second rotation Pinus radiata D. Don plantation was planted<br />
in 1990. Sixteen 400 m 2 plots were established with each treatment plot surrounded by a 10-metre buffer<br />
zone. Half of the treatment plots received regular N applications (urea) between 1990 <strong>and</strong> 1999 with total N<br />
addition of 95 g/m 2 . Two different organic matter removal treatments were also established by using<br />
different harvesting techniques (stem only <strong>and</strong> whole tree harvesting) during the first rotation harvest. These<br />
two treatments, combined with the presence or absence of fertiliser, produced four different treatment<br />
combinations, replicated four times. All treatment plots were weeded manually at establishment, <strong>and</strong><br />
herbicide was applied to suppress weed growth until canopy closure.<br />
© 2010 19 th World Congress of Soil Science, Soil Solutions for a Changing World<br />
1 – 6 August 2010, Brisbane, Australia. Published on DVD.<br />
70
Soils were sampled at 15 r<strong>and</strong>om points within each plot in March 2009 using a 25 mm diameter corer at<br />
three depth intervals (0-5, 5-15 <strong>and</strong> 15-25 cm). The 15 <strong>soil</strong> cores collected from each treatment plot were<br />
thoroughly mixed, air-dried <strong>and</strong> sieved (2 mm mesh) to remove stones, roots <strong>and</strong> other extraneous material.<br />
Soil moisture content was determined from a sub-sample dried at 100 °C. Another sub-sample was ground<br />
thoroughly into a fine powder before chemical analyses. For most analyses, the <strong>soil</strong>s were separated into<br />
light <strong>and</strong> heavy fractions by floating <strong>soil</strong>s in NaI (density < 1. 65 g/cm 3 ). The concentrations of C <strong>and</strong> N<br />
were determined with a Leco Corporation CNS-2000 Elemental Analyser. The chemical composition of<br />
SOC was analysed by CPMAS 13 C NMR. Carbohydrates, cutin <strong>and</strong> suberin compounds <strong>and</strong> lignin monomers<br />
were extracted by solvent extraction, base hydrolysis <strong>and</strong> copper oxidation, respectively, <strong>and</strong> analysed by gas<br />
chromatography/mass spectrometry.<br />
Table 1. Mean C <strong>and</strong> N concentrations <strong>and</strong> C:N ratio in mineral <strong>soil</strong> (< 2 mm) under different treatments in a<br />
second-rotation Pinus radiata plantation, Berwick, New Zeal<strong>and</strong>. Means were based on four replicate values per<br />
treatment. F: long-term N-fertilised; NF: not fertilised; SO: stem only harvesting plots <strong>and</strong> WH: whole tree<br />
harvesting plots.<br />
Total C (%) Total N (%) C:N ratio<br />
0-5 cm 5-15 cm 15-25 m 0-5 cm 5-15 cm 15-25 cm 0-5 cm 5-15 cm 15-25 cm<br />
NF+SO 5.65 2.70 1.83 0.27 0.15 0.11 20.67 18.04 16.63<br />
NF+WH 5.05 2.78 1.70 0.24 0.14 0.10 20.42 19.88 17.00<br />
F+SO 5.19 2.74 1.84 0.28 0.15 0.11 19.22 17.85 16.22<br />
F+WH 5.30 2.53 1.97 0.27 0.14 0.13 19.63 17.68 15.53<br />
Soil C in the light fraction<br />
(% of total C)<br />
40<br />
30<br />
20<br />
10<br />
0<br />
a<br />
b<br />
0-5 5-15 15-25<br />
© 2010 19 th World Congress of Soil Science, Soil Solutions for a Changing World<br />
1 – 6 August 2010, Brisbane, Australia. Published on DVD.<br />
a<br />
b<br />
NF+SO NF+WH F+SO F+WH<br />
a<br />
b<br />
a<br />
b a<br />
a<br />
a a<br />
Figure 1. Soil C in the light fraction (density < 1.65 g/cm 3 ) in mineral <strong>soil</strong> (< 2 mm) under different treatments in<br />
second-rotation Pinus radiata plantation forest, Berwick, New Zeal<strong>and</strong>. For the same <strong>soil</strong> depth, means followed<br />
by the same letter are not significantly different (P < 0.05).<br />
Results <strong>and</strong> discussion<br />
Early results suggested that fertilisation <strong>and</strong> harvest residue management had no significant effect on the C<br />
<strong>and</strong> N concentrations in 0-25 cm mineral <strong>soil</strong>s. It is evident that addition of N to <strong>soil</strong>s had a tendency to<br />
decrease <strong>soil</strong> C:N ratio, however, the difference in <strong>soil</strong> C:N ratio between fertilisation <strong>and</strong> non-fertilisation<br />
treatments was only marginally significant at P < 0.1. Harvest residue management did not significantly<br />
impact <strong>soil</strong> C:N ratios in 0-25 cm mineral <strong>soil</strong>s (Table 1).<br />
Although C concentrations in the mineral <strong>soil</strong>s were not significantly affected by fertilisation <strong>and</strong> harvest<br />
residue management, the percentage of light fraction in <strong>soil</strong> C of the 0-15 cm depth was significantly altered<br />
by harvest residue management, however not by fertilisation (Figure 1). The chemical composition of light<br />
fraction C in different <strong>soil</strong>s as revealed by CPMAS 13 C NMR was generally similar. The largest compound<br />
class in the light fraction <strong>soil</strong>s was O-alkyls, ranging between 33.3% <strong>and</strong> 36.6%. Aromatics represented the<br />
next largest group. Long-term fertilisation increased the relative enrichment of alkyl C <strong>and</strong> alkyl-to-O-alkyl<br />
ratio in the light fraction of <strong>soil</strong> organic matter, which may suggest an increased decomposition of light<br />
fraction (Mendham et al. 2002; Mathers et al. 2003; Huang et al. 2008) <strong>and</strong>, as a result, an increased relative<br />
resistance of <strong>soil</strong> C due to fertilisation (Table 2). Compared with whole tree harvest plots, stem only harvest<br />
plots also showed a greater alkyl-to- O-alkyl ratio in the light fraction of <strong>soil</strong> organic matter, however the<br />
difference due to harvest residue management was smaller than that from fertilisation.<br />
71
Table 2. Relative signal distributions (%) in the solid-state CPMAS 13 CNMR spectra of light fraction of mineral<br />
<strong>soil</strong>s (0-5 cm) under different treatments in a second-rotation Pinus radiate plantation forest. Values are single<br />
determinations of composite samples from four replicate plots, each of 12 replicate cores.<br />
Alkyls N-alkyls O-alkyls Aromatics Phenolic Carboxyl C A/O ratio<br />
NF+SO 16.9 9.1 35.6 26.4 5.8 6.3 0.47<br />
NF+WH 14.6 8.2 36.6 26.7 6.5 7.4 0.40<br />
F+SO 19.5 10.1 34.6 24.8 5.3 5.8 0.57<br />
F+WH 17.8 9.8 33.3 25.1 6.0 8.2 0.53<br />
Relative abundancee<br />
6<br />
5<br />
4<br />
3<br />
2<br />
1<br />
0<br />
Carbohydrates Cutin-derived<br />
compounds<br />
NF+SO NF+WT F+SO F+WT<br />
Suberin-derived<br />
compounds<br />
© 2010 19 th World Congress of Soil Science, Soil Solutions for a Changing World<br />
1 – 6 August 2010, Brisbane, Australia. Published on DVD.<br />
Lignin-derived<br />
compounds<br />
Figure 2. Relative abundance (mg/100mg OC) of major SOM components in 0-5 cm mineral <strong>soil</strong>s subjected to<br />
different treatments.<br />
The abundance of cutin-derived compounds was greater in the light fraction of fertilised <strong>soil</strong> C than in that of<br />
non-fertilised which may indicate the reduced decomposition of cutin-derived compounds after fertilisation.<br />
Alternatively, increased growth of trees due to N fertilisation may increase leaf litter production that<br />
contributes to increased cutin inputs into the light fraction of <strong>soil</strong> (Smaill et al. 2008b). Cutin-derived<br />
compounds originate from the waxy coating of leaves <strong>and</strong> are believed to be recalcitrant. The result from<br />
GC/MS is consistent with that from 13 C-NMR (Figure <strong>and</strong> Table 2). The stem only treatment had a greater<br />
amount of cutin-derived compounds in the light fraction of <strong>soil</strong>, compared with whole tree harvest treatment.<br />
This may also be attributable to the increased leaf litter. Major carbohydrates (mannose, glucose <strong>and</strong> sucrose)<br />
in the light fraction of <strong>soil</strong> decreased in the fertilised plot despite greater inputs from forest litter. This<br />
observation is consistent with the studies of Neff et al. (2002), in which carbohydrates are considered to be<br />
among the most labile constituents of the light fraction of SOM <strong>and</strong> their decomposition is accelerated by<br />
fertilisation. The carbohydrate abundance in the light fraction of SOM was lower in whole tree harvest plots<br />
than in the log only plots. This may be due to the decreased input from plant litter (Figure 2).<br />
Conclusion<br />
In the first step of the research, the chemical compositions of <strong>soil</strong> C in light fraction were identified. The<br />
results suggest long-term fertilisation may lead to an increased decomposition of light fraction <strong>and</strong> an<br />
increase in percentage of aliphatic C.<br />
Acknowledgements<br />
We would like to thank Alan Leckie for assistance in <strong>soil</strong> sampling, <strong>and</strong> Stefan Hill <strong>and</strong> Hank Crose for help<br />
in NMR <strong>and</strong> GC /MS analyses.<br />
References<br />
Huang Z, Xu Z, Chen C, Boyd S (2008) Changes in <strong>soil</strong> carbon during the establishment of a hardwood<br />
plantation in subtropical Australia. For. Ecol. Manage. 254, 46-55.<br />
J<strong>and</strong>l R, Lindner M, Vesterdal L, Bauwens B, Baritz R, Hagedorn F, Johnson DW, Minkkinen K, Byrne KA<br />
(2007) How strongly can forest management influence <strong>soil</strong> carbon sequestration? Geoderma 137, 253-268.<br />
Lal R (2005) <strong>Forest</strong> <strong>soil</strong>s <strong>and</strong> carbon sequestration. For. Ecol. Manage. 220, 242-258.<br />
Lorenz K, Lal R, Preston CM, Nierop KGJ (2007) Strengthening the <strong>soil</strong> organic carbon pool by increasing<br />
contributions from recalcitrant aliphatic bio(macro)molecules. Geoderma 142, 1-10.<br />
72
Mathers NJ, Xu ZH (2003) Solid-state C-13 NMR spectroscopy: characterisation of <strong>soil</strong> organic matter<br />
under two contrasting residue management regimes in a 2-year-old pine plantation of subtropical<br />
Australia. Geoderma 114, 19-31.<br />
Mendham DS, Mathers NJ, O'Connell AM, Grove TS, Saffigna PG (2002) Impact of l<strong>and</strong>-use on <strong>soil</strong><br />
organic matter quality in south-western Australia - characterisation with C-13 CP/MAS NMR<br />
spectroscopy. Soil Biol. Biochem. 34, 1669-1673.<br />
Neff J, Townsend A, Gleixner G, Lehman S, Turnbull J, Bowman W (2002) Variable effects of nitrogen<br />
additions on the stability <strong>and</strong> turnover of <strong>soil</strong> carbon. Nature 419, 915-917.<br />
Smaill S, Clinton P, Greenfield L (2008a) Postharvest organic matter removal effects on FH layer <strong>and</strong><br />
mineral <strong>soil</strong> characteristics in four New Zeal<strong>and</strong> Pinus radiata plantations. For. Ecol. Manage. 256, 558-<br />
563.<br />
Smaill S, Clinton P, Greenfield L (2008b) Nitrogen fertiliser effects on litter fall, FH layer <strong>and</strong> mineral <strong>soil</strong><br />
characteristics in New Zeal<strong>and</strong> Pinus radiata plantations. For. Ecol. Manage. 256, 564-569.<br />
Smith CT, Dyck WJ, Beets PN, Hodgkiss PD, Lowe AT (1994) Nutrition <strong>and</strong> productivity of Pinus Radiata<br />
following harvest disturbance <strong>and</strong> fertilisation of Coastal S<strong>and</strong> Dunes. For. Ecol. Manage. 66, 5-38.<br />
Smith CT, Lowe AT, Skinner MF, Beets PN, Schoenholtz SH, Fang SZ (2000) Response of radiata pine<br />
forests to residue management <strong>and</strong> fertilisation across a fertility gradient in New Zeal<strong>and</strong>. For. Ecol.<br />
Manage. 138, 203-223.<br />
Walmsley JD, Jones DL, Reynolds B, Price MH, Healey JR (2009) Whole tree harvesting can reduce second<br />
rotation forest productivity. For. Ecol. Manage. 257, 1104-1111.<br />
© 2010 19 th World Congress of Soil Science, Soil Solutions for a Changing World<br />
1 – 6 August 2010, Brisbane, Australia. Published on DVD.<br />
73
Lignin phenols <strong>and</strong> cutin- <strong>and</strong> suberin-derived aliphatic monomers as<br />
biomarkers for st<strong>and</strong> history, SOM source, <strong>and</strong> turnover<br />
S<strong>and</strong>ra Spielvogel, Jörg Prietzel <strong>and</strong> Ingrid Kögel-Knabner<br />
Lehrstuhl für Bodenkunde, Technische Universität München, 85350 Freising, Germany, Email spielvogel@wzw.tum.de<br />
Abstract<br />
Each tree species has a unique chemical composition, <strong>and</strong> also various tree tissues differ in their chemistry.<br />
Analysis of lignin phenols <strong>and</strong> cutin- <strong>and</strong> suberin-derived aliphatic monomers was employed to investigate<br />
wheter their composition can be traced back after decay <strong>and</strong> transformation into <strong>soil</strong> organic matter (SOM)<br />
to study SOM source, degradation, <strong>and</strong> st<strong>and</strong> history.<br />
The composition of bound lipids <strong>and</strong> lignin compounds in leaves/needles <strong>and</strong> root material of different tree<br />
species <strong>and</strong> of grasses was analyzed using copper (II) oxide (CuO) oxidation, saponification <strong>and</strong> subsequent<br />
analysis by gas chromatography/mass spectrometry (GC/ MS). The aim was to examine the applicability of<br />
these compounds in <strong>soil</strong>s <strong>and</strong> different density <strong>and</strong> particle size fractions as biomarkers for the respective<br />
tree species <strong>and</strong> the grass. In contrast to lignin, aliphatic molecules derived from suberins <strong>and</strong> cutins were<br />
preferentially preserved in horizons <strong>and</strong> <strong>soil</strong> fractions with mean residence times > 250 years. The pattern of<br />
cutin <strong>and</strong> suberin monomers in the <strong>soil</strong>s <strong>and</strong> fractions <strong>change</strong>d with increasing 14 C age, but alteration of these<br />
aliphatic macromolecules resulted in less degradable structures which are still indicative for the respective<br />
plant species.<br />
Key Words<br />
Saponification, CuO oxidation, lipids, forest trees, gas chromatography/mass spectrometry.<br />
Introduction<br />
The composition of lignin components is different for angiosperm, gymnosperm <strong>and</strong> grass lignin. Leaf cutins<br />
<strong>and</strong> suberin found in barks <strong>and</strong> roots of different plants are known to exhibit plant specific chemical<br />
compositions (Goñi <strong>and</strong> Hedges 1990). Moreover, laboratory <strong>and</strong> field degradation studies indicated that<br />
degradation <strong>processes</strong> are not uniform for all lignin, suberin <strong>and</strong> cutin monomers, but that some constituents<br />
are preferentially degraded (Kögel-Knabner et al. 1989; Otto <strong>and</strong> Simpson 2006).<br />
In the present study, the amount <strong>and</strong> composition of lignin, cutin <strong>and</strong> suberin in grassl<strong>and</strong> <strong>and</strong> forest <strong>soil</strong>s<br />
stocked with different tree species <strong>and</strong> selected density <strong>and</strong> particle size fractions were investigated. The<br />
objectives were to analyze, if (i) cutin <strong>and</strong> suberin monomers are useful biomarkers for the contribution of<br />
root-vs. shoot derived OC to SOM in different <strong>soil</strong> horizons <strong>and</strong> fractions, (ii) if monomer-specific turnover<br />
kinetics during decay <strong>and</strong> transformation into SOM hinders the identification of plant- <strong>and</strong> tissue-specific<br />
lignin, cutin <strong>and</strong> suberin signatures or offers additional information about the degradation status of the SOM<br />
<strong>and</strong> (iii) if lignin, cutin <strong>and</strong> suberin are useful biomarker for vegetation history.<br />
Methods<br />
Study sites, <strong>soil</strong>s <strong>and</strong> <strong>soil</strong> sampling<br />
We sampled nine sites at two different study areas in Germany: The National Park Bayerischer Wald, an area<br />
with granite, gneiss <strong>and</strong> quarternary deposits (mainly gneiss debris) parent material, <strong>and</strong> a pre alpine loess<br />
region. A more detailed description of the sites is given in Table 1. Soils were classified according to IUSS<br />
<strong>Working</strong> <strong>Group</strong> Reference Base 2006. At every site we sampled three r<strong>and</strong>omly distributed <strong>soil</strong> pits <strong>and</strong><br />
analyzed the samples from the replicates separately. At each site, leaves or needles, roots, bark <strong>and</strong> fresh<br />
litter were sampled. The forest floor <strong>and</strong> mineral top<strong>soil</strong> horizons of all <strong>soil</strong> profiles <strong>and</strong> selected sub<strong>soil</strong><br />
horizons were collected for chemical analyses.<br />
© 2010 19 th World Congress of Soil Science, Soil Solutions for a Changing World<br />
1 – 6 August 2010, Brisbane, Australia. Published on DVD.<br />
74
Table 1. Parent material, <strong>soil</strong> types, recent <strong>and</strong> former vegetation of the nine study sites.<br />
Region <strong>and</strong> Parent<br />
material<br />
Soil type Former vegetation Recent vegetation<br />
National Park Bayerischer Wald<br />
Granite Leptic Entic Podzols (Skeletic) Norway spruce Norway spruce<br />
Granite Leptic Entic Podzols (Skeletic) Norway spruce Grass (approx. 25 yr.)<br />
Quarternary deposits Leptic Cambisols (Dystric, Skeletic) Norway spruce Norway spruce<br />
Quarternary deposits Leptic Cambisols (Dystric, Skeletic) Norway spruce Grass (approx. 25 yr.)<br />
Quarternary deposits<br />
Pre alpine loess region<br />
Leptic Cambisols (Dystric, Skeletic) European beech European beech<br />
Loess Cutanic Alisols (Humic, Siltic) Norway spruce Norway spruce<br />
Loess Cutanic Alisols (Humic, Siltic) Norway spruce European beech (approx. 80 yr.)<br />
Loess Cutanic Alisols (Humic, Siltic) Norway spruce Douglas fir (approx. 80 yr.)<br />
Loess Cutanic Alisols (Humic, Siltic) Norway spruce Sessile oak (approx. 80 yr.)<br />
Density <strong>and</strong> particle size fractionation<br />
Selected A <strong>and</strong> B horizons were subjected to a two-step density fractionation with Na polytungstate solution<br />
with a density of 1.6 g/cm 3 <strong>and</strong> subsequent particle size fractionation to obtain the free light fraction (fLF)<br />
<strong>and</strong> the occluded light fraction (oLF). After complete dispersion by ultrasonication (450 J/ml), the fractions 2<br />
to 20 µm (silt), <strong>and</strong> 0.5 <strong>and</strong> similar information in order to reduce<br />
the amount of model variables.<br />
Results<br />
Cutin <strong>and</strong> suberin monomers as biomarkers for the contribution of aboveground vs. belowground OC input<br />
The base hydrolysis of <strong>soil</strong> <strong>and</strong> vegetation samples yielded a series of aliphatic <strong>and</strong> phenolic compounds<br />
corresponding to previously reported compositions of hydrolysates from grassl<strong>and</strong> <strong>and</strong> forest <strong>soil</strong>s (Kögel-<br />
Knabner et al. 1989; Otto <strong>and</strong> Simpson 2007). The sources of some compounds, which are found in animal,<br />
plant, <strong>and</strong> fungal membranes are unspecific (Otto <strong>and</strong> Simpson 2007). Nevertheless, our statistical analysis<br />
identified eight variables which discriminated significantly between cutin <strong>and</strong> suberin based on their<br />
structural units (Table 2). The eight variables where subsequently subjected to a factor analysis which<br />
resulted in two factors with an eigenvalue >1 (Figure 1). High loadings for factor a are indicative for<br />
cutin/aboveground input, whereas high loadings for factor b are indicative for suberin/belowground input.<br />
© 2010 19 th World Congress of Soil Science, Soil Solutions for a Changing World<br />
1 – 6 August 2010, Brisbane, Australia. Published on DVD.<br />
75
Table 2. Variables with discriminant coefficients > 0.5 for discrimination between cutin (aboveground plant<br />
input) <strong>and</strong> suberin (belowground plant input).<br />
Variable Discrimination<br />
coefficient<br />
Occurrence in<br />
suberin<br />
Σ hydrolysable phenols 0.63 Common -<br />
Σ n-alkan-1-ols 0.64 Common -<br />
Σ n-alkanoic acids 0.57 Common -<br />
Σ Long-chain ω-hydroxyalkanoic acids 0.77 Common -<br />
Σ Long-chain α,ω-diacids 0.63 Common -<br />
9,10-epoxy-C18 α,ω dioic acid 0.56 Common Rare<br />
Σ Mid-chain hydroxy C14, C15, C17 acids 0.77 - Common<br />
Σ C16 Mono- <strong>and</strong> dihydroxy acids <strong>and</strong> diacids 0.53 Rare Common<br />
© 2010 19 th World Congress of Soil Science, Soil Solutions for a Changing World<br />
1 – 6 August 2010, Brisbane, Australia. Published on DVD.<br />
Occurrence in<br />
cutin<br />
Figure 1. Factor space between factor a (grouping variables indicative for cutin) <strong>and</strong> factor b (grouping<br />
variables indicative for suberin).<br />
Lignin, cutin <strong>and</strong> suberin monomers as biomarkers for SOC degradation status<br />
Discrimination analysis identified seven variables which discriminated significantly between groups of<br />
samples with different degradation status of the OM (Table 3). Most of them are ratios, indicating a<br />
preferential degradation of some lignin, cutin <strong>and</strong> suberin constituents compared to other compounds. High<br />
discrimination coefficients of the ω-C16/ΣC16 ratio <strong>and</strong> the ω-C18/ΣC18 ratio are consistent with findings of<br />
Goñi <strong>and</strong> Hedges (1990), which reported that cutin acids containing double bonds or more than one hydroxyl<br />
group are preferentially degraded compared to ω-hydroxyacids in marine sediments. The ratio between midchain-substituted<br />
acids to total cutin <strong>and</strong> suberin acids (ΣMID/ΣSC) generally decreases with increasing<br />
degradation status of the SOM, from plant samples to the forest floor horizons.<br />
Increasing lignin degradation is reflected by larger acid/aldehyde ratios for both vanillyl <strong>and</strong> syringyl units.<br />
The faster turnover of syringyl-type compared to vanillyl-type lignin is reflected by the lower discrimination<br />
coefficient of the Ac/AlS ratio compared to the Ac/AlV ratio.<br />
Table 3. Variables with discriminant coefficients > 0.5 for discrimination between groups of samples with<br />
different degradation status<br />
Variable Discrimination<br />
coefficient<br />
Change during degradation<br />
ω-C18/ΣC18 0.76 Increases with degradation<br />
ω-C16/ΣC16 0.72 Increases with degradation<br />
ΣMID/ΣSC 0.64 Decreases with degradation<br />
Ac/AlV 0.82 Increases with degradation<br />
Ac/AlS 0.60 Increases with degradation<br />
S/V 0.64 Decreases with degradation<br />
9,10,18-trihydroxy octadecanoic acid 0.79 Increases with degradation<br />
Lignin, cutin <strong>and</strong> suberin monomers as biomarkers for recent vegetation <strong>and</strong> vegetation history<br />
Twelve variables were initially selected by discriminant analysis for the discrimination among the four<br />
different tree species <strong>and</strong> the grass vegetation. However, the first training set, which was applied to choose<br />
those variables which significantly contribute to a vegetation-specific signature, only consisted of fresh plant<br />
material, top<strong>soil</strong> horizons <strong>and</strong> light fractions with recent 14 C ages. Then the twelve variables were subjected<br />
to a factor analysis which resulted in three factors with an eigenvalue >1 (Figure 2a). The factor space<br />
between factors a <strong>and</strong> b significantly differentiated between <strong>soil</strong> samples from sites which are stocked with<br />
76
different angiosperm species, whereas the factor space between factors b <strong>and</strong> c differentiated between<br />
samples from sites with different gymnosperm species.<br />
Subsequently, we tested the established factors <strong>and</strong> the discrimination coefficients of the twelve variables for<br />
a larger data set, including sub<strong>soil</strong> horizons <strong>and</strong> heavy fractions with mean residence times > 250 years.<br />
However, only 39% of all cases of this larger test set were classified correctly. Thus, we repeated the<br />
discriminant analysis for the larger data set. This time 19 variables were selected by discriminant analysis,<br />
including also degradation products of cutin <strong>and</strong> suberin monomers. Those 19 variables were again grouped<br />
into three factors with an eigenvalue >1 (Figure 2b). Two lignin variables (S/V ratio <strong>and</strong> C/V ratio) were<br />
selected by the discriminant analysis with the first data set. In contrast no lignin variables were selected by<br />
the discriminant analysis with the second data set including the sub<strong>soil</strong> horizons <strong>and</strong> old fractions. This is<br />
probably due to the fact that lignin compounds in the sub<strong>soil</strong> are strongly degraded <strong>and</strong> have lost sourcespecific<br />
functional groups.<br />
Figure 2. (a) Factor analysis with data set consisting of fresh plant material <strong>and</strong> <strong>soil</strong> samples with recent 14 C<br />
ages; (b) factor analysis with data set including <strong>soil</strong> samples <strong>and</strong> fractions with 14 C ages > 250 years.<br />
Summary <strong>and</strong> Conclusion<br />
The analyses of bound lipids <strong>and</strong> CuO oxidation products of fresh plant material, <strong>soil</strong>s <strong>and</strong> different density<br />
<strong>and</strong> particle size fractions of sites stocked with Norway spruce, Douglas fir, European beech, Sessile oak or<br />
grasses showed that cutin <strong>and</strong> suberin are useful biomarkers to differentiate between root- vs. shoot input. In<br />
combination with lignin, cutin <strong>and</strong> suberin signatures of the <strong>soil</strong> <strong>and</strong> density/particle size fractions also<br />
provided important information about the degradation status of the SOM. Sites with different recent<br />
vegetation differed in their lignin, cutin <strong>and</strong> suberin signature of the young SOM <strong>and</strong> the light fraction; sites<br />
with similar former forest st<strong>and</strong>s showed similar cutin <strong>and</strong> suberin signatures of old SOM <strong>and</strong> the heavy<br />
fraction. In contrast to cutin <strong>and</strong> suberin, lignin phenols were inappropriate as biomarkers for vegetation<br />
history. In summary, this study was able to prove that cutin <strong>and</strong> suberin are compounds with a high<br />
diagnostic value for root- vs. shoot-derived input, recent vegetation <strong>and</strong> vegetation history.<br />
References<br />
Goñi MA, Hedges JI (1990) The diagenetic behaviour of cutin acids in buried conifer needles <strong>and</strong> sediments<br />
from a coastal marine environment. Geochimica <strong>and</strong> Cosmochimica Acta 54, 3083-3093.<br />
IUSS <strong>Working</strong> <strong>Group</strong> WRB (2006) World reference base for <strong>soil</strong> resources 2006. World Soil Resources<br />
Reports 103. FAO, Rome.<br />
Kögel-Knabner I, Ziegler F, Riederer M, Zech W (1989) Distribution <strong>and</strong> decomposition pattern of cutin <strong>and</strong><br />
suberin in forest <strong>soil</strong>s. Zeitschrift für Pflanzenernährung und Bodenkunde 152, 409-413.<br />
Otto A, Simpson MJ (2006) Sources <strong>and</strong> composition of hydrolysable aliphatic lipids <strong>and</strong> phenols in <strong>soil</strong>s<br />
from western Canada. Organic Geochemistry 37, 385-407.<br />
Otto A, Simpson MJ (2007) Analysis of <strong>soil</strong> organic matter biomarkers by sequential chemical degradation<br />
<strong>and</strong> gas chromatography – mass spectrometry. Journal of Separation Science 30, 272-282.<br />
Otto A, Shunthirasingham C, Simpson MJ (2005) A comparison of plant <strong>and</strong> microbial biomarkers in<br />
grassl<strong>and</strong> <strong>soil</strong>s from the Prairie Ecozone of Canada. Organic Geochemistry 36, 425-448.<br />
© 2010 19 th World Congress of Soil Science, Soil Solutions for a Changing World<br />
1 – 6 August 2010, Brisbane, Australia. Published on DVD.<br />
77
Long-term <strong>change</strong>s in a forested Spodosol<br />
Mark B. David A , Jenwei Tsai A , Robert G. Darmody A <strong>and</strong> George F. Vance B<br />
A<br />
Department of Natural Resources <strong>and</strong> Environmental Sciences, University of Illinois, Urbana, Illinois, USA,<br />
Email mbdavid@illinois.edu<br />
B<br />
Department of Renewable Resources, University of Wyoming, Laramie, Wyoming, USA<br />
Abstract<br />
Soil formation results from the interaction of climate, relief, parent material, organisms, <strong>and</strong> time. Most <strong>soil</strong><br />
genesis <strong>and</strong> weathering experiments are short-term <strong>and</strong> focus on addressing a single factor, with experiments<br />
to evaluate time rare. We utilized an existing long-term <strong>soil</strong>-bag experiment in central Maine, USA<br />
(Spodosols). Soil-bags containing homogeneous C horizon placed beneath the forest floor or in the middle of<br />
the B horizon for 17 years were compared with archived samples for <strong>change</strong>s in total C, N, S, <strong>and</strong> P. In<br />
addition, <strong>soil</strong> pH, ex<strong>change</strong>able cations, <strong>and</strong> characteristics of the sorbed organic C were also examined. Soil<br />
pH in the C horizon <strong>soil</strong>-bags steadily decreased (5.2 to 3.7) as the result of organic acid leaching. Nitrogen<br />
<strong>and</strong> S accumulation beneath the O horizons was strongly related to the accumulation of C whereas P was not.<br />
Phosphorus was weathered from the C horizon material, with lower <strong>soil</strong> pH <strong>and</strong> greater organic C leading to<br />
greater P loss. The intensity of organic acid leaching was examined as a possible control on the <strong>change</strong>s that<br />
were observed. These results have important l<strong>and</strong> management implications relating to forest health that can<br />
only be obtained with long-term studies.<br />
Key Words<br />
Organic matter, spruce-fir, ratios.<br />
Introduction<br />
Soil formation is a complex process that varies with climate, relief, parent material, organisms, <strong>and</strong> time.<br />
Most <strong>soil</strong> genesis <strong>and</strong> weathering experiments are short-term <strong>and</strong> focus on addressing primarily climate,<br />
relief, parent material, or organism as a single factor. Long-term <strong>soil</strong> genesis experiments are rare <strong>and</strong> are<br />
designed to evaluate the factor of time. There is a need to apply experimental designs of long-term <strong>soil</strong><br />
studies (Richter et al. 2007) to different ecosystems such as forests due to their crucial role in carbon<br />
sequestration <strong>and</strong> to maintain forest productivity.<br />
In the early 1990s, we established a long-term <strong>soil</strong> experiment to better underst<strong>and</strong> the dynamics of C, N, S,<br />
<strong>and</strong> P in nutrient poor Spodosols in central Maine, USA focusing on forest floor to mineral <strong>soil</strong> transfers.<br />
Little is known about the critical organic pools of these nutrients, particularly during long time scales. We<br />
took advantage of the existing experimental design at Howl<strong>and</strong> for this study. We revisited the sites during<br />
the summer of 2009 <strong>and</strong> retrieved one set of bags (others had been collected in 1993, 1994, <strong>and</strong> 1997).<br />
Newly obtained samples were compared with original, archived samples for <strong>change</strong>s in pH <strong>and</strong> organic<br />
matter. Both natural weathering <strong>processes</strong> <strong>and</strong> anthropogenic impacts such as acidic deposition were likely to<br />
lead to <strong>change</strong>s in our <strong>soil</strong>-bags. Underst<strong>and</strong>ing how <strong>soil</strong>s <strong>change</strong> during long time periods can have<br />
important l<strong>and</strong> management implications relating to forest health. Our objectives were to: 1) examine <strong>soil</strong><br />
formation <strong>and</strong> weathering in a spruce-fir forested Spodosol; <strong>and</strong> 2) better underst<strong>and</strong> organic leaching from<br />
the forest floor to mineral horizons.<br />
Methods<br />
A study on organic matter quantity <strong>and</strong> quality begun in 1992 was utilized for this project. The study site was<br />
a commercial spruce-fir forested plot located at Howl<strong>and</strong>, Maine. Previous work on organic matter quality<br />
had been conducted, as well as dissolved organic C leaching studies (Dai et al. 1996abc; Christ et al. 1997).<br />
These <strong>soil</strong>s have thick organic horizons (10 to 25 cm) <strong>and</strong> well developed E horizons 2 to 5 cm thick. As part<br />
of the initial work in 1992, a long-term <strong>soil</strong>s experiment was set up. Sixty <strong>soil</strong>-bags were constructed using C<br />
horizon material (loamy s<strong>and</strong>, 83% s<strong>and</strong>, 15% silt, 2% clay) from a large <strong>soil</strong> pit in the plot, <strong>and</strong> placed<br />
directly beneath the Oa horizon in groups of five at 12 locations (sampling was planned to occur five times).<br />
The <strong>soil</strong>-bags were constructed of 250-µm nylon mesh cloth sewn on three sides <strong>and</strong> stapled on the forth side<br />
(David et al. 1990). Additional bags were placed in the center of the B horizon. Another set of bags filled<br />
with acid washed s<strong>and</strong> were also installed at that time at the same locations.<br />
© 2010 19 th World Congress of Soil Science, Soil Solutions for a Changing World<br />
1 – 6 August 2010, Brisbane, Australia. Published on DVD.<br />
78
We excavated a total of 36 <strong>soil</strong>-bags from the site in June of 2009, following 17 years of incubation (Figure<br />
1). One C horizon <strong>and</strong> one s<strong>and</strong> bag were collected from each of the 12 incubation locations, as well as B<br />
horizon bags from 4 locations. All samples were immediately frozen <strong>and</strong> then freeze-dried for further<br />
analysis, <strong>and</strong> were compared with original, archived samples as well as samples collected after 1, 2, <strong>and</strong> 5<br />
years of field exposure.<br />
Figure 1. Spodosol <strong>soil</strong> pit showing excavated <strong>soil</strong>-bags.<br />
For this paper, preliminary results from <strong>soil</strong>-bags containing C horizon materials were analyzed <strong>and</strong><br />
compared to archived <strong>soil</strong>. The methods used to analyze the samples were the same as in Christ et al. (1997)<br />
<strong>and</strong> Dai et al. (1996abc).<br />
Results<br />
Soil-bags placed beneath the O horizon were enriched with C, N, <strong>and</strong> S, but depleted in P compared with the<br />
original material. P is tightly cycled in this forest, <strong>and</strong> so that the dissolved organic matter (DOM) leached<br />
from the O horizons was low in P. Mineral P was likely weathered from the <strong>soil</strong>-bags. Soil-bags buried<br />
deeper in the <strong>soil</strong> profile accumulated much less C, N, <strong>and</strong> S <strong>and</strong> had less P weathering compared to the <strong>soil</strong>bags<br />
buried directly beneath the O horizons (Table 1). Organic matter deposited on the C horizon material<br />
was enriched in N, S, <strong>and</strong> P following the 17-year leaching period as there were much lower C/N, C/S, <strong>and</strong><br />
C/P ratios in comparison with <strong>soil</strong> profile data.<br />
Table 1. Horizon characteristics (1992) along with C horizon <strong>soil</strong>-bags incubated for 17 years.<br />
Total (mg/kg)<br />
pH C N S P C/N C/S C/P<br />
Oa horizon 2.54 495,000 9,200 1,100 420 54 460 1,200<br />
E horizon <strong>3.2</strong>4 6,000 290 290 80 21 21 76<br />
2009 <strong>soil</strong>-bag C under Oa 3.75 4,100 106 30 200 39 140 21<br />
Bhs horizon 4.24 45,400 1,550 520 350 29 87 130<br />
2009 <strong>soil</strong>-bag C within Bhs 4.83 1,000 100 20 240 10 46 4<br />
C horizon 5.17 2,000 150 180 300 13 11 7<br />
Total N <strong>and</strong> S concentrations were positively correlated with total C concentrations (Figure 2a) whereas total<br />
P had an inverse pattern (Figure 2b). Phosphorus is a limiting nutrient in this spruce-fir system. Plants <strong>and</strong><br />
microbes take up most of the available P in the O horizons (Christ et al. 1997) leaving less to be leached into<br />
the <strong>soil</strong>-bags buried directly underneath the O horizon. Natural weathering of P over the past 17 years did<br />
cause substantial loss from the C horizon <strong>soil</strong>-bags from the Oa location in the <strong>soil</strong> profile.<br />
© 2010 19 th World Congress of Soil Science, Soil Solutions for a Changing World<br />
1 – 6 August 2010, Brisbane, Australia. Published on DVD.<br />
79
Total N or S (mg/kg)<br />
250<br />
200<br />
150<br />
100<br />
50<br />
Nitrogen<br />
Sulfur<br />
r 2 =0.88<br />
r<br />
0<br />
2000 3000 4000 5000 6000 7000<br />
2 =0.74<br />
Total P (mg/kg)<br />
Total C (mg/kg)<br />
Figure 2. Relationships between total C <strong>and</strong> N or S <strong>and</strong> P of individual <strong>soil</strong>-bags collected in 2009. Linear<br />
regression r 2 values also shown.<br />
© 2010 19 th World Congress of Soil Science, Soil Solutions for a Changing World<br />
1 – 6 August 2010, Brisbane, Australia. Published on DVD.<br />
220<br />
210<br />
200<br />
190<br />
180<br />
r 2 =0.16<br />
170<br />
2000 3000 4000 5000 6000 7000<br />
The pH (0.01 M CaCl2) of the <strong>soil</strong>-bags buried beneath the Oa horizon decreased from 5.30 to 3.75, with a<br />
more rapid decrease in years 1 to 5 (Figure 3a). Organic matter content (measured as loss-on-ignition)<br />
increased from an average of 0.55 to 1.2% (Figure 3b). For individual <strong>soil</strong>-bags incubated for 17 years, total<br />
C was strongly related to pH, demonstrating differential weathering <strong>and</strong> OM accumulation (Figure 4).<br />
pH<br />
5.4<br />
5.2<br />
5.0<br />
4.8<br />
4.6<br />
4.4<br />
4.2<br />
4.0<br />
3.8<br />
Loss-on-ignition (%)<br />
3.6<br />
1992 1994 1996 1998 2000 2002 2004 2006 2008 2010<br />
1.4<br />
1.2<br />
1.0<br />
0.8<br />
0.6<br />
Year<br />
0.4<br />
1992 1994 1996 1998 2000 2002 2004 2006 2008 2010<br />
Figure 3. Changes in pH <strong>and</strong> LOI of C horizon <strong>soil</strong>-bags during 17 years beneath the Oa horizon.<br />
pH<br />
4.0<br />
3.9<br />
3.8<br />
3.7<br />
3.6<br />
r 2 =0.78<br />
3.5<br />
2000 3000 4000 5000 6000 7000<br />
Total C (%)<br />
Figure 4. Relationship (linear regression r 2 shown) between total C <strong>and</strong> pH of individual <strong>soil</strong>-bags collected in<br />
2009.<br />
80
Conclusion<br />
Soil pH in the <strong>soil</strong>-bags has steadily decreased as the result of organic acid leaching. Nitrogen <strong>and</strong> S<br />
accumulation beneath the Oa horizon was strongly related to the accumulation of C whereas P was not.<br />
Phosphorus was weathered from the C horizon material, with lower <strong>soil</strong> pH <strong>and</strong> higher total C leading to<br />
greater P loss. Further analysis from these unique <strong>soil</strong>s should provide a better underst<strong>and</strong>ing of organic<br />
matter leaching in these <strong>soil</strong>s.<br />
References<br />
Christ MJ, David MB, McHale PJ, McLaughlin JW, Mitchell MJ, Rustad LE, Fern<strong>and</strong>ez IJ (1997)<br />
Microclimatic control of microbial C, N, <strong>and</strong> P pools in Spodosol Oa-horizons. Canadian Journal of<br />
<strong>Forest</strong> Research 27, 1914-1921.<br />
Dai KH, David MB, Vance GF (1996a) Characterization of solid <strong>and</strong> dissolved carbon in a spruce-fir<br />
Spodosol. Biogeochemistry 35, 339-365.<br />
Dai KH, David MB, Vance GF, Krzyszowska AJ (1996b) Characterization of phosphorus in a spruce-fir<br />
Spodosol by phosphorus-31 nuclear magnetic resonance spectroscopy. Soil Science Society of America<br />
Journal 60, 1943-1950.<br />
Dai KH, David MB, Vance GF, McLaughlin JW, Fern<strong>and</strong>ez IJ(1996c) Acidity characteristics of soluble<br />
organic substances in spruce-fir forest floor leachates. Soil Science 161, 694-704.<br />
David MB, Fuller RD, Fern<strong>and</strong>ez IJ, Mitchell MJ, Rustad LE, Vance GF, Stam AC, Nodvin SC (1990)<br />
Spodosol variability <strong>and</strong> assessment of response to acidic deposition. Soil Science Society of America<br />
Journal 54, 541-548.<br />
Richter DD, Hofmockel M, Callaham MA, Powlson DS, Smith P (2007) Long-term <strong>soil</strong> experiments: keys to<br />
managing Earth’s rapidly changing ecosystems. Soil Science Society of America Journal 71, 266-279.<br />
© 2010 19 th World Congress of Soil Science, Soil Solutions for a Changing World<br />
1 – 6 August 2010, Brisbane, Australia. Published on DVD.<br />
81
Micromorphological <strong>and</strong> chemical characteristics of placic <strong>and</strong> ortstein horizons<br />
in subtropical subalpine forests<br />
Shih-Hao Jien A , Zueng-Sang Chen B , Yoshiyuki Iizuka C <strong>and</strong> Chih-Yu Chiu D<br />
A<br />
Department of Soil <strong>and</strong> Water Conservation, National Pingtung University of Science <strong>and</strong> Technology, Pingtung 91201, Taiwan,<br />
Email shjien@mail.npust.edu.tw<br />
B<br />
Department of Agricultural Chemistry, National Taiwan University, Taipei, Taiwan, Email <strong>soil</strong>chen@ntu.edu.tw<br />
C<br />
Institute of Earth Sciences, Academia Sinica, Taipei, Taiwan, Email yiizuka@earth.sinica.edu.tw<br />
D<br />
Biodiversity Research Center, Academia Sinica, Taipei, Taiwan, Email bochiu@sinica.edu.tw<br />
Abstract<br />
Pedons with a placic or ortstein horizon are commonly occurred in the subalpine <strong>and</strong> alpine forests in<br />
Taiwan. We selected a representative pedon with well-developed placic horizon in subalpine forests in<br />
northeastern Taiwan <strong>and</strong> another with a well-developed ortstein horizon in subalpine forests in central<br />
Taiwan to compare the differences between these two horizons. Micromorphological observations indicated<br />
that the placic horizon was characterized by vughy microstructure <strong>and</strong> was composed of iron oxides, whereas<br />
ortstein horizon was characterized by granular <strong>and</strong> bridge microstructures between quartz grains. Analytical<br />
results of cementing materials between skeleton grains in these two horizons by using energy dispersive<br />
spectrometry (EDS) further indicated that Fe, O <strong>and</strong> C were predominant elements in the placic horizon,<br />
whereas Al, Si <strong>and</strong> C were major elements of the cementing materials in the ortstein horizon. The elemental<br />
mapping determining by electron probe micro-analyses (EPMA) also indicated that organically complexed-<br />
Al was the dominant material, which was present between <strong>soil</strong> aggregates <strong>and</strong> coated on quartz grains in the<br />
ortstein horizon as compared with those of the placic horizon. Chemical analytical results showed that<br />
pedogenic Fe (Fed) was the dominant Fe fraction in both placic <strong>and</strong> ortstein horizons; however, the Fed<br />
contents were much higher in the placic horizon than in the ortstein horizon. Dominant Al fractions were<br />
different between the two horizons, organically complexed-Al (Alp) was predominant in the ortstein horizon,<br />
<strong>and</strong> pedogenic Al (Ald) was dominant in the placic horizon. We concluded that different formation<br />
mechanisms occurred between these two horizons; the placic horizon was related to redox <strong>processes</strong>, <strong>and</strong> the<br />
ortstein horizons related to podzolization.<br />
Key Words<br />
Energy dispersive spectrometry (EDS), micromorphology, placic horizon, ortstein horizon.<br />
Introduction<br />
Hardened <strong>soil</strong> layers, placic or ortstein horizons common occur in the subalpine or alpine forest <strong>soil</strong>s, <strong>and</strong><br />
their genesis is not fully understood, especially in subtropical or tropical forest ecosystems in Taiwan. The<br />
definition of the placic horizon in US <strong>soil</strong> taxonomy is a thin (< 25 mm), black to dark reddish pan which<br />
cemented by iron (or iron <strong>and</strong> manganese) <strong>and</strong> organic matter (Soil Survey Staff 1975). The ortstein horizon<br />
is commonly an illuvial hardened horizon such as Bh <strong>and</strong> Bs horizons in Spodosol or Podzol, <strong>and</strong> these<br />
horizons are at least 25 mm thick (Soil Survey Staff 1975). Both of these horizons are severely influence the<br />
drainage <strong>and</strong> plant growth of forest ecosystems <strong>and</strong> their management. Several hypotheses have been<br />
proposed for the formation of the placic horizon, including translocation <strong>and</strong> precipitation of organic Fe<br />
complexes (Conry et al. 1996; Clayden et al. 1990), <strong>and</strong> mobilization of reduced Fe in the upper parts <strong>and</strong><br />
then oxidation in lower <strong>soil</strong> horizons (Lapen <strong>and</strong> Wang 1999; Pinheiro et al. 2004). With regard to the<br />
formation of the ortstein horizon; the translocation <strong>and</strong> precipitation of organic Fe <strong>and</strong>/or Al complexes is a<br />
dominant mechanism (Lee et al. 1988; Lapen <strong>and</strong> Wang 1999).<br />
Taiwan is located at the tropical <strong>and</strong> subtropical climatic regions, <strong>and</strong> more than 70% of the l<strong>and</strong>s is<br />
mountain covered by various forests. In the subalpine <strong>and</strong> alpine forest ecosystems, clear illuvial <strong>processes</strong><br />
<strong>and</strong> strong chemical weathering prevail in these <strong>soil</strong>s due to the great amount of annual rainfall (≥ 3000 mm).<br />
Podzolic <strong>soil</strong>s <strong>and</strong> <strong>soil</strong>s with placic horizon have been found by Li et al. (1998), Hseu et al. (1999) <strong>and</strong> Wu<br />
<strong>and</strong> Chen (2005) in the subalpine cloud forests of northern Taiwan. However, clearly comparison of genesis<br />
between these <strong>soil</strong>s is rare. The objectives of this study are to combine micromorphological observations,<br />
EDS analyses, electron probe micro-analyses (EPMA) <strong>and</strong> bulk <strong>soil</strong> chemical extraction to determine the<br />
geochemical characteristics of the placic <strong>and</strong> ortstein horizons <strong>and</strong> to deduce the differences of the formation<br />
<strong>processes</strong> between the placic <strong>and</strong> ortstein horizons in the subtropical subalpine ecosystem.<br />
© 2010 19 th World Congress of Soil Science, Soil Solutions for a Changing World<br />
1 – 6 August 2010, Brisbane, Australia. Published on DVD.<br />
82
Methods<br />
Environmental setting <strong>and</strong> <strong>soil</strong> characteristics<br />
The TPS site (around 24°32’ N, 121° 56’ E) is located at Mt. Taiping with altitude of 2200 m, where mean<br />
annual air temperature is 10 °C <strong>and</strong> total annual rainfall is 3200 mm, in northeastern Taiwan (Figure 1). The<br />
parent materials are comprised shale <strong>and</strong> slate (Ho 1986). Cypress forest of Taiwan red cypress<br />
(Chamaecyparis formosensis Matsum), Taiwan Chinese fir (Taiwania cryptomerioides Hay.) <strong>and</strong> Willow fir<br />
(Cryptomeria japonica Hassk.) are dominant vegetation. In addition, the placic horizon was common<br />
characteristics within the <strong>soil</strong>s at this site (Wu <strong>and</strong> Chen 2005). Based on previous investigation studies<br />
(Hseu et al. 1999; Wu <strong>and</strong> Chen 2005), we selected a representative pedon with well-developed placic<br />
horizons on the summit position, <strong>and</strong> it was classified as Typic Hapludults with placic horizon based on US<br />
Soil Taxonomy (Soil Survey Staff 2006). The SLS site is located at Mt. Fenghuang with altitude of 1700 m<br />
(around 23°38’ N, 120° 47’ E), where mean annual air temperature is 16 o C <strong>and</strong> total annual rainfall is 2600<br />
mm, in central Taiwan. The parent material of this site is mainly composed of s<strong>and</strong>stone. Based on preinvestigation<br />
of <strong>soil</strong> distribution, the <strong>soil</strong>s with distinct eluvial <strong>and</strong> ortstein horizons were commonly found<br />
on the summit position at this area. Accordingly, we selected a representative pedon with well-developed<br />
ortstein horizons on the summit position, <strong>and</strong> it was classified as Typic Haplorthod based on US Soil<br />
Taxonomy.<br />
Soil analyses<br />
Soil samples were collected from each horizon of the two pedons for physical <strong>and</strong> chemical analysis. Soil<br />
analyses included pH, total organic carbon (TOC) contents, cation ex<strong>change</strong> capacity (CEC), dithionitecitrate-bicarbonate<br />
(DCB) extracted Fe <strong>and</strong> Al (Fed <strong>and</strong> Ald), ammonium oxalate extracted Fe <strong>and</strong> Al at pH<br />
3.0 (Feo <strong>and</strong> Alo), <strong>and</strong> sodium pyrophosphate (pH 10) extracted Fe <strong>and</strong> Al (Fep <strong>and</strong> Alp).Total contents of<br />
major metal elements in <strong>soil</strong>s were determined by X-ray fluorescence spectrometry (XRF) (RIGAKU, ZSX<br />
Primus II, Japan) with Rh target <strong>and</strong> a beam voltage of 20 kV. Analytical quality of the XRF measurements<br />
was controlled by analyzing st<strong>and</strong>ard reference material (NIST-2709) certified by National Institute of<br />
St<strong>and</strong>ards <strong>and</strong> Technology (NIST), USA.<br />
Soil micromorphology<br />
Kubiena boxes were used to collect undisturbed <strong>soil</strong> blocks in the field for making thin section. Vertically<br />
oriented thin sections which 5 × 8 cm <strong>and</strong> with a thickness of 30 µm were prepared by Spectrum<br />
Petrographics, Inc., Winston, Oregon, USA. The thin sections were observed for all <strong>soil</strong> horizons using a<br />
polarized microscope (AFX-Ⅱ Type, Nikon Precision Instruments, Belmont, CA). Meanwhile, we also<br />
made the polished slides for <strong>soil</strong> placic horizon. The selected samples were mounted in cold-mounting epoxy<br />
resin (EpoFix, Struers Co.) with 1-inch diameter mold at the room temperature for over night. The mounted<br />
samples were ground by SiC <strong>and</strong> then polished by alumina paste (up to 0.3 µm) until surface exposed well.<br />
Each polished sample was initially observed by an optical microscope with the reflection light, <strong>and</strong> then, a<br />
scanning electron microscope (SEM; JEOL JSM-6360LV) was used to observe micro-scale texture. Backscattered<br />
electron image, which represents mean atomic abundance by contrast in back <strong>and</strong> white image,<br />
were observed from the surface of the polished section. Identification of mineral phases were made by an<br />
energy dispersive spectrometer (EDS; Oxford Instruments Ltd., INCA-300) which equipped with SEM,<br />
under the beam conditions of 15 kilovolt (kV), <strong>and</strong> 180 picoampere (pA) for the acceleration voltage, <strong>and</strong><br />
beam current, respectively, in the vacuum condition of 25 Pascal (Pa) without carbon coating.<br />
Results<br />
The placic horizon<br />
The placic horizon of Typic Hapludults at the TPS site exhibited hard structure <strong>and</strong> undifferentiated fabric<br />
with small voids <strong>and</strong> plane channels, which reflected dense structures of the placic horizon (Figure 2a <strong>and</strong> b).<br />
The above-mentioned micomorphological features are commonly observed in thin section. The placic<br />
horizon was characterized by high contents of Fed <strong>and</strong> Fet (≥ 330 g/kg), low contents of organically<br />
complexed-Fe (≤ 70 g/kg) <strong>and</strong> Al (≤ 5 g/kg), <strong>and</strong> low ratio of Fep/Fed (≤ 0.25) (Table 1). Additionally, high<br />
content of Fe oxides <strong>and</strong> Fe/Al ratio of the cementing materials between skeleton grains were estimated by<br />
EDS (Table 2). The results indicated that inorganic Fe was dominantly distributed in the <strong>soil</strong> matrix <strong>and</strong><br />
cementing materials between quartz grains (Figure 3a, b, c <strong>and</strong> d), which also indicated that redox <strong>processes</strong><br />
were dominant pedogenic <strong>processes</strong> in the placic horizon.<br />
The ortstein horizon<br />
© 2010 19 th World Congress of Soil Science, Soil Solutions for a Changing World<br />
1 – 6 August 2010, Brisbane, Australia. Published on DVD.<br />
83
The ortstein horizon of Typic Haplorthods at the SLS site is characterized by bridge <strong>and</strong> granular<br />
microstructures, <strong>and</strong> with high proportion of large voids such as chamber <strong>and</strong> channels (Figure 2c <strong>and</strong> d).<br />
The above-mentioned micomorphological features are commonly observed in the thin sections. The ortstein<br />
horizon also has much lower contents of Fed <strong>and</strong> Fet (≤ 80 g/kg), compared to those of placic horizon,<br />
whereas slightly higher contents of organically complexed-Al (about 10 g/kg) <strong>and</strong> high ratio of Alp/Ald (≥<br />
0.54) were present in the ortstein horizon (Table 1). Meanwhile, EDS results also showed that relatively low<br />
Fe/Al ratio in the cementing materials between <strong>soil</strong> aggregates <strong>and</strong> coatings on the quartz grains (Table 2).<br />
We conclude that aluminosilicates <strong>and</strong> pedogenic Fe were distributed in the <strong>soil</strong> matrix, however, the<br />
cementing materials between <strong>soil</strong> aggregates <strong>and</strong> coatings on the quartz grains of the ortstein horizon were<br />
composed of organically complexed-Al, which were further supported by the elemental mapping of EPMA<br />
(Figure 3e, f, g <strong>and</strong> h). The formation of the ortstein horizon is considered as a process related to podzolization.<br />
Table 1. DCB-, oxalate- <strong>and</strong> pyrophosphate-extractable Fe <strong>and</strong> Al in two pedons.<br />
Pedon Horizon Depth<br />
Fe d Al d Fe o Al o Fe p Al p Fe t Fe p/Fe d Al p/Al d Fe p/Fe o Al p/Al o Al o<br />
+1/2Fe o<br />
(cm) (---------------------------g/kg-----------------------)<br />
TPS O 5-0 3.73 1.16 2.02 1.06 0.85 0.81 4.37 0.23 - - - -<br />
A 0-7 5.13 2.11 2.86 1.92 2.52 1.65 5.94 0.49 0.78 0.86 0.88 0.34<br />
E 7-21 0.38 2.23 0.18 3.15 0.17 2.43 3.79 0.45 1.09 0.77 0.94 0.32<br />
Bsm 21-22.7 327 10.2 174 4.73 71.3 4.49 331 0.22 0.44 0.95 0.41 9.17<br />
Bt1 22.7-45 61.0 9.24 18.0 4.39 38.1 8.27 62.0 0.62 0.90 1.88 2.12 1.34<br />
SLS O 13-0 - - - - - - - - - - - -<br />
A 0-4 3.49 1.08 0.85 0.74 1.00 0.95 6.63 0.29 0.88 1.28 1.18 0.12<br />
2E 4-11 4.16 0.67 0.95 0.53 0.93 0.44 5.39 0.22 0.66 0.83 0.98 0.10<br />
2Bh 11-32 79.3 17.8 12.0 5.32 22.3 9.59 63.8 0.28 0.54 1.80 1.86 1.13<br />
2Bs 32-47 40.6 7.21 2.68 2.20 11.5 4.17 45.2 0.28 0.58 1.90 4.29 0.35<br />
2BC >47 28.4 9.99 1.50 2.12 1.71 2.46 - 0.06 0.25 1.16 1.14 0.29<br />
Table 2. Elemental composition of the cementing materials in the placic <strong>and</strong> ortstein horizon.<br />
Placic (Bsm) st<strong>and</strong>ard Ortstein (2Bh) st<strong>and</strong>ard<br />
value (%) deviation value (%) deviation<br />
SiO 2 19.6 1.54 21.5 6.07<br />
Al 2O 3 10.2 0.53 15.8 3.07<br />
FeO 48.3 4.56 8.62 2.57<br />
K 2O 1.15 0.10 1.02 1.18<br />
MgO - - 0.33 0.20<br />
TiO 2 - - 0.70 1.28<br />
Total 79.2 48.0<br />
Sample number 7 12<br />
SiO 2/Al 2O 3 1.92 1.36<br />
FeO/Al 2O 3 4.74 0.55<br />
Figure 1. The studied sites in Taiwan. Figure 2. The micromorphological photos of the placic horizon (a: with<br />
a plane polarized light (PPL); b: with a PPL) <strong>and</strong> ortstein horizon (c:<br />
with a PPL; d: with a cross polarized light (XPL)). (OM-Al: organically<br />
complexed-Al; Cha: chamber; Ch: channel; V: void; Q: quartz).<br />
© 2010 19 th World Congress of Soil Science, Soil Solutions for a Changing World<br />
1 – 6 August 2010, Brisbane, Australia. Published on DVD.<br />
84
Figure 3. The spatial distribution of Fe, Al <strong>and</strong> Si in the placic horizon (a, b, c <strong>and</strong> d) <strong>and</strong> ortstein horizon<br />
(e, f, g, <strong>and</strong> h); a <strong>and</strong> e are back electron image of the placic <strong>and</strong> ortstein horizon, respectively. (OM-Al:<br />
organically complexed-Al).<br />
Conclusions<br />
Significant differences were present between the placic horizon <strong>and</strong> ortstein horizon; denser microstructure<br />
<strong>and</strong> less porosity were found in the placic horizon as compared to the ortstein horizon. Predominant<br />
pedogenic Fe were found in the placic horizon <strong>and</strong> predominant organically complexed-Al was found in the<br />
ortstein horizon, which indicated that different formation <strong>processes</strong> occurred between the two horizons. The<br />
formation of placic horizon reflects the redox process, whereas the ortstein horizon is due to the<br />
podzolization. Additionally, we conclude that poor drainage of clayey pedons located in TPS subalpine<br />
forests led to saturated <strong>and</strong> reduced conditions in the surface <strong>soil</strong>s; textural difference <strong>and</strong> pH gradient<br />
enhanced the accumulation <strong>and</strong> oxidization of Fe above the B horizon <strong>and</strong> formed the placic horizon rather<br />
than an ortstein horizon. Texture is a critical factor controlly the formation of placic <strong>and</strong> ortstein horizons in<br />
the humid subalpine forests in Taiwan.<br />
References<br />
Clayden B, Daly BK, Lee R, Mew G (1990) The nature, occurrence, <strong>and</strong> genesis of placic horizons. In<br />
‘Proceedings of Fifth International Soil Correlation Meeting’ (Ed JM Kimble) pp. 88-104. (USDA-SCS,<br />
Lincoln)<br />
Conry MJ, de Coninck F, Stoops G (1996) The properties, genesis <strong>and</strong> significance of a man-made iron pan<br />
podzol near Castletownbere, Irel<strong>and</strong>. European Journal of Soil Science 47, 279-284.<br />
Ho CS (1988) ‘An introduction to the geology of Taiwan: explanatory text of the geologic map of Taiwan’.<br />
2nd edition. (Central Geologic Survey: Taiwan)<br />
Hseu ZY, Chen ZS, Wu ZD (1999) Characterization of placic horizons in two subalpine Inceptisols. Soil<br />
Science Society America Journal 63, 941-947.<br />
Lapen DR, Wang C (1999) Placic <strong>and</strong> Ortstein horizon genesis <strong>and</strong> peatl<strong>and</strong> development, southeastern<br />
Newfoundl<strong>and</strong>. Soil Science Society America Journal 63, 1472-1482.<br />
Li SY, Chen ZS, Liu JC (1998) Subalpine loamy Spodosols in Taiwan: characteristics, micromorphology,<br />
<strong>and</strong> genesis. Soil Science Society America Journal 62, 710-716.<br />
Pinheiro J, Tejidor Salguero M, Rodriguez A (2004) Genesis of placic horizons in Andisols from Terceira<br />
Isl<strong>and</strong> Azores-Portugal. Catena 56, 85-94.<br />
Soil Survey Staff (1975) ‘Soil Taxonomy’. USDA-NRCS Agricultural H<strong>and</strong>book No. 436, (U.S.<br />
Government Printing Office: Washington, D.C.)<br />
Soil Survey Staff (2006) ‘Keys to Soil Taxonomy’. USDA-NRCS, Agricultural H<strong>and</strong>book No. 436, 10th<br />
editoin. (U.S. Government Printing Office: Washington, DC)<br />
Wu SP, Chen ZS (2005) Characteristics <strong>and</strong> genesis of Inceptisols with placic horizons in the subalpine<br />
forest <strong>soil</strong>s of Taiwan. Geoderma 125, 331–341.<br />
© 2010 19 th World Congress of Soil Science, Soil Solutions for a Changing World<br />
1 – 6 August 2010, Brisbane, Australia. Published on DVD.<br />
85
Mine <strong>soil</strong> suitability for native forests in the USA<br />
James A. Burger A<br />
A Garl<strong>and</strong> Gray Professor of <strong>Forest</strong>ry, Department of <strong>Forest</strong> Resources <strong>and</strong> Environmental Conservation, Virginia Polytechnic<br />
Institute <strong>and</strong> State University, Blacksburg, VA 24061 USA, Email jaburger@vt.edu<br />
Abstract<br />
Northern red oak is a valuable, native commercial species in large areas of the eastern USA. Little is known<br />
about preferred site <strong>and</strong> <strong>soil</strong> conditions for this species on mined l<strong>and</strong>. The purpose of our field study was to<br />
test red oak survival <strong>and</strong> growth rates on a variety of top<strong>soil</strong> substitutes. The site was mined in 1979 <strong>and</strong><br />
reclaimed in 1980. In 1981, field plots were constructed with different top<strong>soil</strong> substitutes spoil mixes <strong>and</strong><br />
pitch x loblolly pines were planted in 1983. In 2001 the pines were removed <strong>and</strong> replaced with red oaks in<br />
the winter of 2001-2002. Four replicate plots of five different mine spoil mixes were planted with nine red<br />
oak seedlings each. Tree survival, height <strong>and</strong> diameter were measured each year for five years. Survival <strong>and</strong><br />
growth was best on top<strong>soil</strong> substitutes consisting of a mix of s<strong>and</strong>stone <strong>and</strong> siltstone. Trees survived <strong>and</strong><br />
grew poorly on plots constructed from either pure s<strong>and</strong>stone or siltstone. Reasons for the poor oak<br />
performance on the high s<strong>and</strong>stone plots were related to lower pH <strong>and</strong> available Ca levels. Poor oak<br />
performance on the pure siltstone plots was likely related to higher rock fragment <strong>and</strong> lower bulk water<br />
holding content.<br />
Key Words<br />
Reclamation, coal mined l<strong>and</strong>, forest management, <strong>soil</strong> quality, mine <strong>soil</strong>s.<br />
Introduction<br />
The Appalachian coalfields region is heavily forested with native temperate hardwoods. The forest has been<br />
a major economic resource since the region was settled by Europeans more than 200 years ago. In addition to<br />
wood products, the forest provides ecosystem services including watershed protection, water quality, carbon<br />
sequestration, wildlife habitat, <strong>and</strong> habitat for many understory plants <strong>and</strong> animals used for food <strong>and</strong><br />
sustenance by local communities (Braun 1950). Since the implementation of the Surface Mining Control <strong>and</strong><br />
Reclamation Act (SMCRA) in 1978, most reclaimed mines were re-vegetated with grasses <strong>and</strong> other<br />
herbaceous plants. Because there is no significant livestock industry in the steeper mountains, <strong>and</strong> because<br />
these new grassl<strong>and</strong>s are usually remote, at high elevation, <strong>and</strong> with little water, the grassl<strong>and</strong> created on<br />
mined l<strong>and</strong> is usually ab<strong>and</strong>oned to become low-value scrubl<strong>and</strong>. Restoring adequate mine <strong>soil</strong> quality for<br />
trees using suitable top<strong>soil</strong> substitutes has been an on-going issue (Bussler et al. 1984, Rodrigue <strong>and</strong> Burger<br />
2004). In 1983 we planted pines in different mixtures of s<strong>and</strong>stone <strong>and</strong> siltstone overburdens on a study site<br />
in Wise County, Virginia. The site had been a native hardwood forest on steep terrain prior to mining, <strong>and</strong><br />
after mining it was relatively level <strong>and</strong> was surrounded by a variety of post-mining l<strong>and</strong> uses ranging from<br />
pasture to pine plantations. Pines grew best in mine <strong>soil</strong>s with a high proportion of lower pH s<strong>and</strong>stone spoil<br />
despite overall lower fertility compared to that in the siltstone spoil (Torbert et al. 1990). This led to a<br />
recommendation that weathered, slightly acid s<strong>and</strong>stone spoils be used for top<strong>soil</strong> substitutes for forestry postmining<br />
l<strong>and</strong> uses. However, with increasing interest in commercially valuable native hardwoods, we revisited<br />
the issue to determine which mine <strong>soil</strong> types are most suitable for these more dem<strong>and</strong>ing hardwood species.<br />
The objective of this research was to determine the suitability of different top<strong>soil</strong> substitutes for northern red<br />
oak (Quercus rubra L.) after removing pines that had been planted in the same area immediately after<br />
reclamation <strong>and</strong> had been in place for 19 years. The top<strong>soil</strong> substitutes were made up of different proportions<br />
of s<strong>and</strong>stone <strong>and</strong> siltstone overburden. Red oak was chosen as an indicator species because of its commercial<br />
value, its sensitivity to mine <strong>soil</strong> conditions, <strong>and</strong> the fact that it shares many resource requirements with other<br />
native hardwood species (Johnson et al. 2002).<br />
Methods<br />
The study site is located in Wise County, Virginia. The study plots were constructed during the winter of<br />
1981 on a previously mined flat bench. The area around the site was mined in 1983, which left the<br />
surrounding terrain relatively flat. The treatment plots consisted of four replications of five overburden mixes<br />
that included pure s<strong>and</strong>stone (SS), pure siltstone (SiS), 2:1 SS:SiS, 1:1 SS:SiS, <strong>and</strong> 1:2 SS:SiS arranged in a<br />
© 2010 19 th World Congress of Soil Science, Soil Solutions for a Changing World<br />
1 – 6 August 2010, Brisbane, Australia. Published on DVD.<br />
86
<strong>and</strong>omized complete block design. The spoils were mixed in the required ratios <strong>and</strong> placed in the centers of<br />
adjacent 3.05 x 6.1 x 1.25 m deep plots. In the spring of 1983, each plot was planted with nine containerized<br />
1-0 pitch x loblolly pine hybrid (Pinus rigida Mill. x Pinus taeda L.) seedlings. Tree survival, height, <strong>and</strong><br />
ground line diameter of the stem were measured in the fall of each year for the 5-yr study period. The results<br />
of the study were reported by Torbert et al. (1990).<br />
Trees were removed in 2001, <strong>and</strong> in 2002 each of the 20 plots was replanted with nine 2-0 northern red oak<br />
seedlings. Survival, height, <strong>and</strong> ground line diameter of the trees were measured in the fall each year for five<br />
years. At the end of the fifth field growing season for both the pines (1987 <strong>and</strong> the oaks (2006), two 1-kg <strong>soil</strong><br />
samples were taken from each plot <strong>and</strong> combined for a single composite sample. Soil physical <strong>and</strong> chemical<br />
properties were determined using st<strong>and</strong>ard methods. Data were summarized <strong>and</strong> analyzed using ANOVA<br />
<strong>and</strong> regression statistics (SAS 2004).<br />
Results <strong>and</strong> Discussion<br />
Pine growth was greatly affected by overburden type. Tree volume in the study plots decreased<br />
proportionately with added siltstone (Torbert et al. 1990) (Figure 1). Torbert <strong>and</strong> co-workers attributed the<br />
decrease in tree production to a combination of physical <strong>and</strong> chemical properties, namely coarse fragment<br />
content, pH, <strong>and</strong> higher initial soluble salt content, all of which increased with increasing amounts of<br />
siltstone (Figure 2). Pine growth was inversely proportional to soluble salt content; growth decreased linearly<br />
as salt content increased (Figure 2). Soluble salt content ranged from 1280 to 4160 mg/kg 1987 with<br />
increasing amounts of siltstone in the first five years of the experiment. In contrast to the pines, the northern<br />
red oaks grew best in top<strong>soil</strong> substitutes consisting of 1:1 SS:SiS <strong>and</strong> 1:2 SS:SiS (Figure 1, Table 1).<br />
Average tree height on the 1:2 SS:SiS s<strong>and</strong>stone:siltstone mixture was greater than the average tree height on<br />
either of the pure rock types. The trends in ground line diameter, tree volume index (TVI = diameter 2 x<br />
height), <strong>and</strong> plot volume index (TVI x % survival / 100) were the same as that for tree height (Table 1). Tree<br />
survival was very close to 70% at age 5 for all treatments except for the pure s<strong>and</strong>stone, which was only<br />
25%. Seventy percent survival is common <strong>and</strong> considered good for mixed native hardwoods planted in good<br />
mine <strong>soil</strong>s.<br />
Figure 1. Pine <strong>and</strong> red oak production in top<strong>soil</strong><br />
substitutes consisting of different amounts of s<strong>and</strong>stone<br />
<strong>and</strong> siltstone. Tree growth is shown as an estimate of<br />
biomass volume x survival (ground line d 2 h x %<br />
survival/100) (Pine data from Torbert et al. 1990).<br />
© 2010 19 th World Congress of Soil Science, Soil Solutions for a Changing World<br />
1 – 6 August 2010, Brisbane, Australia. Published on DVD.<br />
Figure 2. Coarse fragment content, pH, <strong>and</strong> soluble salt<br />
content for increasing amounts of siltstone versus<br />
s<strong>and</strong>stone used as a top<strong>soil</strong> substitute for growing pitch x<br />
loblolly pines (1983-1987) (Torbert et al. 1990) followed<br />
by northern red oaks (2002-2006).<br />
87
By 2002, when the red oaks were planted, the mine <strong>soil</strong>s had been in place <strong>and</strong> weathering for 20 years.<br />
Furthermore, the mine <strong>soil</strong>s had been exposed to the influences of a pine cover for 19 years. When the <strong>soil</strong>s<br />
were sampled in 2006, they had been in place for 25 years. Therefore, differences in <strong>soil</strong> properties between<br />
sampling periods (1987 <strong>and</strong> 2006) are largely a function of parent material (s<strong>and</strong>stone versus siltstone), but<br />
would also be a function of time <strong>and</strong> vegetation (pines <strong>and</strong> northern red oak).<br />
Total N <strong>and</strong> C, averaging 0.2 <strong>and</strong> 3%, respectively, were comparable to levels found in non-mined, managed<br />
forest <strong>soil</strong>s of the southeastern United States (Fisher <strong>and</strong> Binkley 2000) (Table 3). The only <strong>soil</strong> property that<br />
appeared correlated with tree growth was the <strong>soil</strong> CEC corrected for fine earth content (Table 2). The CEC<br />
was lowest for the pure rock types <strong>and</strong> highest for the mixtures, which corresponded to red oak growth. An<br />
overall CEC of only 2.0 cmol + /kg is an indication of potentially low <strong>soil</strong> fertility by agricultural st<strong>and</strong>ards,<br />
but this level is common in moderately to strongly acid native forest <strong>soil</strong>s (Fisher <strong>and</strong> Binkley 2000). Of the<br />
<strong>soil</strong> properties measured for this study, low <strong>soil</strong> P <strong>and</strong> high coarse fragment content are possible factors<br />
contributing to the poor red oak growth on the pure siltstone (Showalter et al. 2005).<br />
Based on these data, the red oaks survived <strong>and</strong> grew poorly on the s<strong>and</strong>stone mine <strong>soil</strong>. This <strong>soil</strong> had the<br />
highest levels of available N <strong>and</strong> P, which were comparable to or higher than those found on an adjacent<br />
s<strong>and</strong>stone study site growing healthy 15-year-old sugar maples (Burger <strong>and</strong> Salzberg, in press). However, the<br />
s<strong>and</strong>stone pH in this study (4.7) was one unit lower than that on the sugar maple site (5.7). A combination of<br />
strong acidity <strong>and</strong> the lowest levels of ex<strong>change</strong>able bases were possible causes of the poor performance on<br />
s<strong>and</strong>stone.<br />
Table 1. Survival <strong>and</strong> growth of planted northern red oaks growing on s<strong>and</strong>stone <strong>and</strong> siltstone top<strong>soil</strong> substitutes.<br />
Survival Growth (age 5)<br />
Year 1 Year 5 Diameter 1 Height TVI 2 PVI 3<br />
(-------- % --------) (cm) (cm) (cm 3 )<br />
S<strong>and</strong>stone 64 25 b 2.8 116 b 1822 456<br />
2:1 SS:SiS 78 69 a 3.1 146 ab 1777 1226<br />
1:1 SS:SiS 75 69 a 3.1 151 ab 2869 1980<br />
1:2 SS:SiS 83 72 a 3.7 174 a 3026 3179<br />
Siltstone 75 69 a 3.0 122 b 1696 1170<br />
1 Diameter at ground line.<br />
2 Mean Tree Volume Index = (ground line diameter) 2 x (height)<br />
3 Plot Volume Index = (TVI)(% survival) / 100<br />
Table 2. Selected physical <strong>and</strong> chemical properties for s<strong>and</strong>stone <strong>and</strong> siltstone top<strong>soil</strong> substitutes under red oak.<br />
Fine Earth pH Soluble Salts Olsen 1 P Inorganic 1 N (KCl) CEC 2<br />
Mine Soil<br />
(x FE)<br />
(%) (ppm) ------- kg/ha ------- (cmol + /kg)<br />
S<strong>and</strong>stone 53 a 4.7 d 125 24.5 35.0 1.85<br />
2:1 SS:SiS 39 b 5.2 c 131 11.5 27.1 2.02<br />
1:1 SS:SiS 47 ab 5.2 c 150 16.7 35.1 2.26<br />
1:2 SS:SiS 38 bc 5.9 b 122 9.0 18.6 2.20<br />
Siltstone 28 c 6.4 a 163 7.7 13.1 1.60<br />
1<br />
kg/ha values based on Db = 1.3 g/cm 3 <strong>and</strong> <strong>soil</strong> layer = 0-20 cm (Olsen <strong>and</strong> Sommers 1982).<br />
2 CEC x fine earth (FE) fraction<br />
Table 3. Total nitrogen <strong>and</strong> carbon <strong>and</strong> ex<strong>change</strong>able cations for s<strong>and</strong>stone <strong>and</strong> siltstone top<strong>soil</strong> substitutes<br />
under red oak.<br />
Ex<strong>change</strong>able Cations 2<br />
Total N 1 Total C 1<br />
Mine Soil<br />
Ca K Mg Na<br />
(%) (kg/ha) (%) (Mg/ha) ---------- (cmol + /kg) ----------<br />
S<strong>and</strong>stone 0.16 2204 2.91 40.0 2.43 0.05 b 1.01 d 0.05<br />
2:1 SS:SiS 0.18 1920 3.55 37.6 3.11 0.07 a 1.98 bc 0.06<br />
1:1 SS:SiS 0.19 2368 3.50 43.7 2.82 0.08 a 1.88 c 0.07<br />
1:2 SS:SiS 0.17 1713 3.32 32.2 3.37 0.08 a 2.29 b 0.05<br />
Siltstone 0.22 1519 4.34 30.2 2.76 0.08 a 2.88 a 0.05<br />
1<br />
kg/ha values based on Db = 1.3 g/cm 3 <strong>and</strong> <strong>soil</strong> layer = 0-20 cm.<br />
2 Ammonium acetate extracts.<br />
© 2010 19 th World Congress of Soil Science, Soil Solutions for a Changing World<br />
1 – 6 August 2010, Brisbane, Australia. Published on DVD.<br />
88
Conclusion<br />
In contrast to the pitch x loblolly pines, which preceded the northern red oaks on the same study plots, red<br />
oaks clearly grew best in a mix of s<strong>and</strong>stone <strong>and</strong> siltstone. They survived well on all the mine <strong>soil</strong>s except<br />
pure s<strong>and</strong>stone, but grew poorly on both pure s<strong>and</strong>stone <strong>and</strong> pure siltstone. This difference in growth<br />
between the two species may show a species preference for different mine <strong>soil</strong>s; however, the reason for this<br />
preference could not be attributed to a single mine <strong>soil</strong> property. Northern red oaks, along with most other<br />
native hardwoods, are known to have a higher base nutrient requirement than pines, which may explain their<br />
better performance in the mixtures of the two rock types, while low <strong>soil</strong> P, high coarse fragment content, <strong>and</strong><br />
low water availability may have slowed their growth in the pure siltstone. In any case, these results show that<br />
trees respond very differently to different mine <strong>soil</strong>s, <strong>and</strong> they show that mine <strong>soil</strong>s suitable for tree survival<br />
<strong>and</strong> growth should be used to restore forest productivity.<br />
Acknowledgments<br />
We greatly appreciate the support from the Powell River Project <strong>and</strong> the Office of Surface Mining. Thanks<br />
go to Kathryn Holl<strong>and</strong>sworth <strong>and</strong> David Mitchem for their technical assistance.<br />
References<br />
Braun EL (1950) ‘Deciduous forests of Eastern North America.’ (The Blakiston Co.: Garden City, New<br />
York)<br />
Burger JA, Salzberg A (2009) Sugar maple response to weed control, liming <strong>and</strong> fertilization on a reclaimed<br />
mine <strong>soil</strong> in southwestern Virginia. Northern Journal of Applied <strong>Forest</strong>ry (in press).<br />
Bussler BH, Byrnes WR, Pope PE, Chaney WR (1984) Properties of mine<strong>soil</strong> reclaimed for forest use. Soil<br />
Science Society of America Journal 48, 178-184.<br />
Fisher RF, Binkley D (2000) ‘Ecology <strong>and</strong> management of forest <strong>soil</strong>s.’ (John Wiley & Sons: New York).<br />
Johnson PS, Shifley SR, Rodgers R (2002) ‘The ecology <strong>and</strong> silviculture of oaks.’ (CABI Publishing: New<br />
York).<br />
Olsen SR, Sommers LE (1982) Phosphorus. In ‘Methods of <strong>soil</strong> analysis, Pt. 2. Chemical <strong>and</strong> microbial<br />
properties.’ (Eds AL Page et al.) pp. 403-430. (American Society of Agronomy: Madison, WI).<br />
Rodrigue JA, Burger JA (2004) <strong>Forest</strong> <strong>soil</strong> productivity of mined l<strong>and</strong> in the midwestern <strong>and</strong> eastern<br />
coalfield regions. Soil Science Society of America Journal 68, 1-11.<br />
SAS Institute (2004) SAS System for Windows V8. (SAS Institute Inc.: Cary, NC).<br />
Showalter JM, Burger JA, Zipper CE, Galbraith JM (2005) Influence of physical, chemical, <strong>and</strong> biological<br />
mine <strong>soil</strong> properties on white oak seedling growth. In ‘Proceedings of the 22 nd Annual Meeting, American<br />
Society of Mining <strong>and</strong> Reclamation, Breckinridge, CO.’ (Ed RI Barnhisel) pp. 1029-1041 (ASMR:<br />
Lexington, KY)<br />
Torbert JL, Burger JA, Daniels WL (1990) Pine growth variation associated with overburden rock type on a<br />
reclaimed surface mine in Virginia. Journal of Environmental Quality 19, 88-92.<br />
© 2010 19 th World Congress of Soil Science, Soil Solutions for a Changing World<br />
1 – 6 August 2010, Brisbane, Australia. Published on DVD.<br />
89
Monitoring scheme for examining carbon–water coupling in a forested<br />
watershed<br />
Nirmala Liyanage A , Thomas Bishop A , Willem Vervoort A <strong>and</strong> Michael Nelson A<br />
A Faculty of Agriculture, Food <strong>and</strong> Natural resources, University of Sydney, Sydney, Australia.<br />
Email nirmala.liyanage@sydney.edu.au,thomas.bishop@sydney.edu.au, willem.vervoort@sydney.edu.au <strong>and</strong><br />
michael.nelson@sydney.edu.au<br />
Abstract<br />
Management of carbon <strong>and</strong> water in l<strong>and</strong>scapes is one of the key issues of our time due to increased carbon<br />
emission <strong>and</strong> its associations with climate <strong>change</strong>. Sequestration of carbon in terrestrial ecosystems is<br />
proposed to overcome these challenges; however countries such as Australia where water is a limited<br />
resource are facing difficulties in providing water for carbon sequestration. Therefore it is important to<br />
underst<strong>and</strong> the scale dependency of carbon <strong>and</strong> water <strong>and</strong> their coupling in ecosystems. The present study is<br />
the starting point of a series of experiments on carbon <strong>and</strong> water coupling in an ecosystem where sampling<br />
variance at four spatial scales was tested. A balanced nested sampling design with nine main stations, <strong>and</strong> 72<br />
sampling sites at four spatial scales (5, 30, 100 <strong>and</strong> 400m) was established in a first order Eucalyptus forest<br />
catchment <strong>and</strong> <strong>soil</strong> carbon <strong>and</strong> clay variation were estimated. The dominant spatial scales in terms of<br />
variation were 5m <strong>and</strong> 400m for both clay <strong>and</strong> carbon, each comprising about 40% of the variation.<br />
However, at the 30m <strong>and</strong> 100m scales, 5-9% variations were observed suggesting the possibility for<br />
increasing the block size for <strong>soil</strong> carbon accounting.<br />
Key Words<br />
Nested sampling design, spatial scales, clay content, <strong>soil</strong> carbon, Eucalyptus forest catchment.<br />
Introduction<br />
In tackling increased carbon emission <strong>and</strong> its associated climate <strong>change</strong>, increasing attention is being given<br />
to sequestration of carbon in terrestrial ecosystems. Carbon, nitrogen <strong>and</strong> water <strong>processes</strong> are cyclic <strong>and</strong><br />
strongly interrelated; therefore one cycle cannot be managed or disturbed without affecting the other. In<br />
order to increase carbon sequestration in ecosystems, water needs to be provided, however, countries such as<br />
Australia where water is a limited resource are facing challenges.<br />
Carbon <strong>and</strong> water <strong>processes</strong> <strong>and</strong> their coupling have been studied extensively in the past; however, the focus<br />
has generally been at one spatial scale. A series of studies by M. Lark in recent times (Lark 2005; Corstanje<br />
& Lark 2008) has explored methods to examine scale dependency in the variation of individual properties,<br />
<strong>and</strong> their co-variation with other properties. In this assessment, we adopt one approach, the nested sampling<br />
designs first proposed by Youden <strong>and</strong> Mehlich (1937), where the data is analysed in the form of a r<strong>and</strong>omeffects<br />
nested ANOVA, except the nested scales are associated with distances in space, rather than regions.<br />
Lark (2005) extended the approach to enable an analysis of covariance for both balanced <strong>and</strong> unbalanced<br />
designs, allowing the correlations between different variables at different scales to be explored.<br />
In terms of carbon <strong>and</strong> water, this scale dependency is important to underst<strong>and</strong> as it has implications for how<br />
we manage carbon <strong>and</strong> water at different scales, depending on the strength <strong>and</strong> type of relationship. For<br />
example, the dilemma we face is that some studies have stated that storing more carbon via trees in<br />
l<strong>and</strong>scapes resulting less water being available for the environment (Jackson et al. 2005). This if true would<br />
have dire consequences for the potential of storing carbon in Australia’s dry l<strong>and</strong>scapes. However, the study<br />
was based on catchment aggregated data so is limited to one scale.<br />
In this paper, we describe the monitoring design, initial results <strong>and</strong> their implications, <strong>and</strong> future work.<br />
Methods<br />
Study Area<br />
The study was conducted within a first-order forested catchment of Wollondilly River at Arthursleigh<br />
(34°33'49"S <strong>and</strong> 150°04'58"E) near Marulan, in the Southern Highl<strong>and</strong>s of New South Wales, Australia. The<br />
region has a temperate climate (based on the Köppen classification) with mean annual precipitation of<br />
800mm <strong>and</strong> mean annual temperature around 19.2°C (Bureau of Meteorology 2010). The study area is<br />
approximately 175 ha.<br />
© 2010 19 th World Congress of Soil Science, Soil Solutions for a Changing World<br />
1 – 6 August 2010, Brisbane, Australia. Published on DVD.<br />
90
There has been no detailed <strong>soil</strong> survey performed in the area, however, the <strong>soil</strong> has been identified as<br />
Tenosols in the present survey. Soils have developed over sedimentary rocks, with a s<strong>and</strong>y texture<br />
consisting of 75-80% of s<strong>and</strong>. The <strong>soil</strong> depths range between 0.3 <strong>and</strong> 0.7m while the density of the<br />
vegetation is relatively low. The tree stratum of the area is mainly formed by Eucalyptus species, which are<br />
considered a part of the remaining virgin forests of Australia. Scattered shrub vegetation is also present in<br />
the area, however, a quite distinct range of heights is observed among the species, namely 10–15m for<br />
Eucalyptus <strong>and</strong> 0.50–1.0m for others. Coarse woody debris <strong>and</strong> fine litter materials are in abundance in the<br />
area.<br />
Monitoring design, <strong>soil</strong> sampling <strong>and</strong> statistical analysis<br />
The experiment was conducted as a balanced nested design (Youden <strong>and</strong> Mehlich 1937) with nine main<br />
stations. Each station consisted of eight sampling locations covering four spatial scales, i.e. 5m, 30m, 100m<br />
<strong>and</strong> 400m (Figure 1).<br />
Figure 1. Main stations with study sites at Arthursleigh (©Contour Map -NSW Dept of L<strong>and</strong>s)<br />
Statistical analysis was performed in the form of a r<strong>and</strong>om-effect nested ANOVA, where nested scales are<br />
associated with distances in space. To quantify the variance at each scale (σ 2 5m, σ 2 30m, σ 2 400m etc.), the<br />
following variance component model is used (Eqn. 1).<br />
σ 2 5m,<br />
σ 2 5m + σ 2 30m<br />
σ 2 5m + σ 2 30m + σ 2 100m<br />
σ 2 5m + σ 2 30m + σ 2 100m + σ 2 400m = σ 2 Total (1)<br />
The analysis permits the examination of <strong>change</strong>s in parameter values when moving from tree (5m) to st<strong>and</strong><br />
(30m) to hill-slope (100m) to catchment (400m) scales. The analysis was performed in GenStat for Windows<br />
(v 12) <strong>and</strong> the models were fitted using residual maximum likelihood.<br />
Within the nested framework, two <strong>soil</strong> core samples each were collected from 72 sites, using a GPS receiver<br />
to locate sampling points. Soils were separated into horizons <strong>and</strong> air-dried in a controlled environment<br />
(45°C) <strong>and</strong> then sieved through a 2-mm mesh. Total carbon <strong>and</strong> nitrogen in <strong>soil</strong> were determined using a<br />
Vario MAX CNS analyser (Elementar Analysensysteme GmbH) <strong>and</strong> clay content was measured by the Wet<br />
Pipette Method (Gee <strong>and</strong> Bauder 1986).<br />
© 2010 19 th World Congress of Soil Science, Soil Solutions for a Changing World<br />
1 – 6 August 2010, Brisbane, Australia. Published on DVD.<br />
91
Results<br />
Stations 1, 2 <strong>and</strong> 9 had higher carbon contents in B horizon of <strong>soil</strong> compared to those of other six stations<br />
while higher clay contents were observed in stations 1,2,3 <strong>and</strong> 6 (Figure 2).<br />
1 4 6<br />
2 3<br />
Figure 2. Spatial distribution of study sites at Arthursleigh showing proportional presentation of percentage <strong>soil</strong><br />
carbon in B horizon (X <strong>and</strong> Y values are in meters - Projection GDA 1994 Zone 56)<br />
The dominant spatial scales in terms of variation were 5m <strong>and</strong> 400m for both clay <strong>and</strong> carbon, each<br />
comprising about 40% of the variation (Tables 1 <strong>and</strong> 2). There are three <strong>soil</strong> types in the study area <strong>and</strong> the<br />
relief range from 0-26% at study sites. Therefore, we believe that the 400m scale represents variation<br />
attributable to <strong>soil</strong> type <strong>and</strong> topographic <strong>change</strong>s. Variation observed at the 5m scale is probably due to the<br />
low density of vegetation, where <strong>soil</strong>s are unevenly exposed to sunlight.<br />
Table 1. Carbon variances at each spatial scale<br />
Scale Variance Var. Accumulated %Var. at scale<br />
5-m 0.234 0.234 41.3<br />
30-m 0.0306 0.2646 5.4<br />
100-m 0.0492 0.3138 8.7<br />
400-m 0.2526 0.5664 44.6<br />
Total 0.5664<br />
Table 2. Clay variances at each spatial scale<br />
Scale Variance Var. Accumulated %Var. at scale<br />
5-m 4.811 4.811 50.4<br />
30-m 1<br />
0 4.811 0<br />
100-m 0.623 5.434 6.5<br />
400-m 4.109 9.543 43.1<br />
Total 9.543<br />
1 The 30-m variance component was negative so it was constrained to a value of 0.<br />
One implication of the results in terms of monitoring carbon is that it could help inform the size of the blocks<br />
needed to bulk samples from, when measuring <strong>soil</strong> carbon. The advantage of composite sampling is the<br />
reduction of analytical costs <strong>and</strong> residual variance but this is at the cost of losing degrees of freedom, which<br />
increases the precision of our estimates of a mean <strong>and</strong>/or a <strong>change</strong> in the mean. From the results here, a good<br />
starting point for composite sampling would be sampling from 5m blocks but there is little advantage for<br />
30m or 100m blocks.<br />
© 2010 19 th World Congress of Soil Science, Soil Solutions for a Changing World<br />
1 – 6 August 2010, Brisbane, Australia. Published on DVD.<br />
9<br />
5 7 8<br />
1 4<br />
2 3<br />
9<br />
5 7 8<br />
92
Conclusion <strong>and</strong> Future work<br />
The dominant spatial scales in terms of variation were 5m <strong>and</strong> 400m for both clay <strong>and</strong> carbon, each<br />
comprising about 40% of the variation. The current study is the start of a long-term monitoring site for the<br />
Faculty of Agriculture, Food <strong>and</strong> Natural Resources in the University of Sydney. In mid-2010 probes will be<br />
installed at some sites to continuously monitor <strong>soil</strong> moisture <strong>and</strong> sap flow in trees. These will be augmented<br />
by monthly sampling campaigns where <strong>soil</strong> moisture <strong>and</strong> respiration will be measured at each site. From this<br />
we will use the method described by Lark (2005) to explore the scale-dependent nature of coupling between<br />
the carbon <strong>and</strong> water cycles.<br />
In terms of monitoring carbon, future work should explore how nested designs can be used to identify the<br />
optimal size of blocks for composite sampling.<br />
References<br />
Gee GW, Bauder JW (1986) Particle size analysis. In ‘Methods of <strong>soil</strong> analysis Part 1’. (Ed A Klute) pp.<br />
383-411. (ASA <strong>and</strong> SSSA, Madison, WI).<br />
Bureau of Meteorology (2010) http://www.bom.gov.au/jsp/ncc/climate_averages/climate-classifications<br />
Corstanje R, Lark RM (2008) On effective linearity of <strong>soil</strong> process models. European Journal of Soil Science<br />
59, 990–999,<br />
Jackson RB, Jobbagy EG, Avissar R, Roy SB, Barrett DJ, Cook CW, Farley KA, le Maitre DC, McCarl BA,<br />
Murray BC (2005) Trading Water for Carbon with Biological Carbon Sequestration. Science 310,<br />
1944-1947<br />
Lark RM (2005) Exploring scale-dependent correlation of <strong>soil</strong> properties by nested sampling. European<br />
Journal of Soil Science 56, 307–317.<br />
Youden WJ, Mehlich A (1937) Selection of efficient methods for <strong>soil</strong> sampling. Contributions of the Boyce<br />
Thompson Institute for Plant Research 9, 59–70.<br />
© 2010 19 th World Congress of Soil Science, Soil Solutions for a Changing World<br />
1 – 6 August 2010, Brisbane, Australia. Published on DVD.<br />
93
Nutrient release from Eucalyptus gr<strong>and</strong>is <strong>and</strong> Pinus taeda harvest residues<br />
A Gabriela Sánchez A ,Amabelia del Pino A,B <strong>and</strong> Jorge Hernández A<br />
A<br />
Department of Soil <strong>and</strong> Water, Facultad de Agronomía, Universidad de la República Oriental del Uruguay. Garzón 780<br />
Montevideo, Uruguay.<br />
B<br />
Corresponding author. Email amabelia@fagro.edu.uy<br />
Abstract<br />
Decomposition patterns of forest harvest residues produce the release of nutrients, which will be available<br />
for the next turn. Pine <strong>and</strong> eucalyptus harvest residues were aerobically incubated under controlled<br />
temperature (25ºC) for 300 days with the objectives: 1) to determine decomposition patterns of forest<br />
residues under controlled conditions, in relation to their physical <strong>and</strong> chemical characteristics, <strong>and</strong> 2) to<br />
evaluate nutrient release from the residues, comparing the results with those obtained in decomposition<br />
experiments in the field. The experiment consisted in six treatments <strong>and</strong> three replications. The treatments<br />
were: 1) control <strong>soil</strong>, 2) P. taeda needles, 3) P. taeda branches, 4) E. gr<strong>and</strong>is leaves, 5) E. gr<strong>and</strong>is bark, 6) E.<br />
gr<strong>and</strong>is branches. The residues were cut into pieces <strong>and</strong> placed over the <strong>soil</strong> in the incubation pots. Soils<br />
were periodically leached to recover the released cations (Ca, Mg <strong>and</strong> K). Decomposition rates were<br />
estimated from evolved C-CO2. The highest decomposition occurred in E. gr<strong>and</strong>is leaves <strong>and</strong> P. taeda<br />
needles, which could be due to their higher soluble C <strong>and</strong> low C:N ratio compared to bark <strong>and</strong> branches.<br />
Among cations, K was easily leached while the opposite occurred with Ca.<br />
Key Words<br />
<strong>Forest</strong> harvest, nutrient leaching, <strong>soil</strong> respiration, potassium, calcium, magnesium.<br />
Introduction<br />
In commercial forests of Uruguay, the nutrient export with logs represents a minor proportion of the<br />
extracted nutrients (Hernández et al. 2009). Therefore, it is crucial to study decomposition patterns of forest<br />
harvest residues, after either clear cut or thinning, to evaluate the potential nutrient release from the residues.<br />
Residue decomposition depends on the characteristics of the materials (size <strong>and</strong> chemical composition),<br />
residue management <strong>and</strong> climatic conditions. The biochemical characteristics of residues influence<br />
decomposition patterns. Lignin is likely to retard decomposition because of its stability <strong>and</strong> detrimental<br />
effect on microbial growth (Berg <strong>and</strong> McClaugherty 1989). In contrast, a high content of soluble organic<br />
compounds is likely to promote the activity of microorganisms (Girisha et al. 2003). The decomposers<br />
population depends on C availability for energy, but they also need a certain amount of several other<br />
nutrients. Total N content <strong>and</strong> C:N ratios have been extensively considered as affecting decomposition rate<br />
of plant material (Burgess et al. 2002). When nutrients are scarce, decomposition rates are lower (Mary et al.<br />
1996). Plant residues with low nutrient contents are likely to immobilize the required nutrients from the <strong>soil</strong><br />
as decomposition proceeds. The immobilization of nutrients during decomposition often results in reduction<br />
of <strong>soil</strong> nutrient availability <strong>and</strong> also lower nutrient losses (Gómez Rey et al. 2008). The objectives of this<br />
study were: 1) to determine decomposition patterns of forest residues under controlled conditions, in relation<br />
to the physical <strong>and</strong> chemical characteristics of the residues, <strong>and</strong> 2) to evaluate nutrient release from the<br />
residues, comparing the results with those obtained in decomposition experiments in the field.<br />
Methods<br />
Soil <strong>and</strong> residue characteristics<br />
For the incubation experiment, the <strong>soil</strong> from the 0-20 cm superficial layer of a thermic albic Argiudoll,<br />
Rivera (31º 22’ 51.9’’S <strong>and</strong> 55º 38’ 31.4’’W) was taken from a 12 year-old pine forest (Table 1). In this<br />
region the mean annual rainfall is 1,600 mm (evenly distributed) <strong>and</strong> the average temperatures of the coldest<br />
month (June) <strong>and</strong> the warmest month (January) are 11ºC <strong>and</strong> 24ºC, respectively. The harvest residues: P.<br />
taeda leaves <strong>and</strong> branches (diameter < 1 cm) <strong>and</strong> E. gr<strong>and</strong>is leaves, bark <strong>and</strong> branches (diameter < 1 cm)<br />
were taken at harvest of commercial plantations (Table 2).<br />
Table1. Chemical characteristics of the <strong>soil</strong>.<br />
Total C Total N pH (H2O) pH (KCl) Ca 2+ Mg 2+ K + Na +<br />
(--------- mg/g ---------) (----------cmolc/kg ----------)<br />
8.05 0.73 4.24 3.74 1.45 0.7 0.18 0.38<br />
© 2010 19 th World Congress of Soil Science, Soil Solutions for a Changing World<br />
1 – 6 August 2010, Brisbane, Australia. Published on DVD.<br />
94
Table 2. Chemical composition of harvest residues, <strong>and</strong> amounts of Ca, Mg, <strong>and</strong> K in the residues incorporated<br />
per pot.<br />
Residue Total C Total N Soluble C Lignin C/N Ca Mg K Ca Mg K<br />
(------------------- mg/g -------------------) (------ mg/g -----) (---------- mg/pot --------)<br />
Pinus needles 508.7 16.1 119.2 399.1 31 4.0 1.5 2.9 8.3 3.1 6.0<br />
Pinus branches 493.6 4.7 78.9 370.7 105 3.0 1.4 1.7 10.4 4.9 6.0<br />
Eucalyptus leaves 507.7 17.3 134.4 399.6 29 12.0 2.3 4.1 24.9 4.8 8.5<br />
Eucalyptus branches 458.1 5.7 63.8 320.3 80 14.6 2.5 3.6 61.2 10.7 17.6<br />
Eucalyptus bark 446.9 4.3 107.5 335.4 103 1<strong>3.2</strong> 2.3 3.8 51.4 8.6 12.7<br />
Incubation experiment<br />
Mineralization patterns of forest residues were determined in an aerobic incubation experiment under<br />
controlled temperature (25ºC) for 300 days. The experiment consisted in 6 treatments <strong>and</strong> three replications.<br />
The treatments were: 1) control <strong>soil</strong>, 2) Pinus taeda needles, 3) Pinus taeda branches, 4) Eucalyptus gr<strong>and</strong>is<br />
leaves, 5) Eucalyptus gr<strong>and</strong>is bark, 6) Eucalyptus gr<strong>and</strong>is branches. The <strong>soil</strong> for the incubation experiment,<br />
stored at field humidity, was crushed to pass a 5 mm mesh, <strong>and</strong> roots <strong>and</strong> litter were h<strong>and</strong>picked. The <strong>soil</strong> (25<br />
g) was placed into a 50 mL plastic pot, with 5 small holes in the bottom <strong>and</strong> a filter paper to avoid <strong>soil</strong> losses.<br />
Plant residues were cut into 0.5 to 1 cm length pieces, <strong>and</strong> placed over the <strong>soil</strong> surface without mixing. The<br />
amounts (dry basis) were 2.08 g for pine needles <strong>and</strong> eucalyptus leaves, 3.52 g for pine <strong>and</strong> eucalyptus<br />
branches, <strong>and</strong> 4.64 g for eucalyptus bark. In order to measure the C-CO2 evolved, the pots were placed into 1<br />
L jars with a 5 mL vial with 0.5 M NaOH <strong>and</strong> hermetically sealed. Two extra jars were prepared to subtract<br />
the background C-CO2. After the incubation period (1 week during the first 2 months <strong>and</strong> 2 weeks<br />
thereafter), the remaining NaOH was titrated with 0.1 M HCl, <strong>and</strong> the NaOH vials replaced. The incubation<br />
pots were leached every two weeks for the first 3 months, <strong>and</strong> once a month thereafter. For the leaching of<br />
the released nutrients, deionized water was poured over the residues in small drops for 15 minutes. The<br />
amount of water for the leaching was 80 mL at the beginning, when the incubation period was two weeks,<br />
<strong>and</strong> 160 mL for monthly samplings. The leachate was collected in 250 mL plastic flasks <strong>and</strong> stored at -4ºC.<br />
Chemical analysis<br />
Total <strong>and</strong> soluble C in residues were analyzed by oxidation with K2Cr2O7 <strong>and</strong> concentrated H2SO4 at 150ºC<br />
for 1 hour, <strong>and</strong> colorimetric determination (Nelson y Sommers 1996). For total <strong>and</strong> soluble N determination,<br />
the Kjeldahl method was used. Total Ca, Mg, <strong>and</strong> K in residues were determined after ignition of the<br />
residues at 550ºC for 5 hours, <strong>and</strong> then ashes were diluted with HCl. Lignin was determined by acid<br />
hydrolysis. Soil ex<strong>change</strong>able Ca, Mg, <strong>and</strong> K were extracted with 1 M NaH4OAc at pH 7. The contents of<br />
Ca 2+ , Mg 2+ in the extracts <strong>and</strong> the leachate were analyzed by atomic absorption spectrometry, <strong>and</strong> K + by<br />
flame emission spectrometry.<br />
Data analysis<br />
The statistical analysis (ANOVA) was made at each sampling considering a completely r<strong>and</strong>omized design<br />
with three replications. Differences among means (P < 0,05) were compared using Tukey analysis.<br />
To characterize decomposition patterns an exponential model with two pools was adjusted:<br />
w= wr + wd e (-kt) (1)<br />
where w is the remaining material at time t (percentage of initial weight), wr is the estimated proportion of<br />
the pool resistant to decomposition, wd is the proportion of decomposable material, k is the decay constant<br />
<strong>and</strong> t is the time in days.<br />
Results<br />
Carbon mineralization<br />
Soluble C in the leachate was almost negligible compared to evolved C-CO2 (data not shown). Figure 1<br />
shows the cumulative evolved C-CO2 from harvest residues, which were closely adjusted to the exponential<br />
decay model (Table 3). Decomposition rates of residues in this experiment were lower than those observed in<br />
field experiments (Hernández et al. 2009). One possible reason for this result is the effect of macrofauna in<br />
field experiments. Sunlight exposure <strong>and</strong> temperature fluctuations are also likely to contribute to higher<br />
decomposition in the field. The leaching regime, which removed the released nutrients, could also have<br />
negatively affected decomposers, because unlikely in the field situation, where rain is usually distributed<br />
along the year, the <strong>soil</strong>s received a large amount of water in a short period. In this case it is possible that the<br />
microbial population was deprieved nutrients from <strong>soil</strong> <strong>and</strong> residues.<br />
© 2010 19 th World Congress of Soil Science, Soil Solutions for a Changing World<br />
1 – 6 August 2010, Brisbane, Australia. Published on DVD.<br />
95
Mineralized C (%)<br />
100<br />
80<br />
60<br />
0<br />
P. taeda needles<br />
P.taeda branches<br />
E. gr<strong>and</strong>is leaves<br />
E. gr<strong>and</strong>is bark<br />
E. gr<strong>and</strong>is branches<br />
0 50 100 150<br />
Days<br />
Figure 1. Mineralized C from harvest residues of P. Taeda<br />
<strong>and</strong> E.gr<strong>and</strong>is.<br />
© 2010 19 th World Congress of Soil Science, Soil Solutions for a Changing World<br />
1 – 6 August 2010, Brisbane, Australia. Published on DVD.<br />
Table 3. Parameters of the adjusted model:<br />
w= wr + wd e (-kt) .<br />
Residue wr Wd k R 2<br />
P. needles 83.12 16.46 0.019 0.99<br />
P. branches 92.28 7.40 0.024 0.98<br />
E. leaves 75.91 23.48 0.015 0.99<br />
E. branches 87.45 12.06 0.013 0.99<br />
E. bark 89.76 9.91 0.013 0.99<br />
The fractions that experienced the highest decomposition were E. gr<strong>and</strong>is leaves <strong>and</strong> P. taeda needles. This<br />
fact could be due to the higher soluble C <strong>and</strong> low C:N ratio of needles <strong>and</strong> leaves compared to bark <strong>and</strong><br />
branches. Moreover, the fine sized residues (needles <strong>and</strong> leaves) could be easier to reach by decomposers<br />
than the coarse ones. Pinus taeda needles had significantly lower mineralization rates than E. gr<strong>and</strong>is leaves<br />
throughout the study. A similar situation was observed for branches; P. taeda branches were the least<br />
decomposed residue at the end of the incubation, while bark was in the middle.<br />
Release of Ca, Mg <strong>and</strong> K<br />
The amounts of cations in the leachate showed an increasing trend in the first 60 days of incubation, slowing<br />
thereafter (Figure 2). This trend is coincident with the C-CO2 evolution, <strong>and</strong> suggests that the cations were<br />
released as the material decomposed.<br />
Remaining cations<br />
(% of added with residues)<br />
100<br />
80<br />
60<br />
40<br />
20<br />
0<br />
0 50 100 150<br />
days<br />
Potassium Calcium Magnesium<br />
100<br />
100<br />
80<br />
60<br />
40<br />
20<br />
0<br />
0 50 100 150<br />
days<br />
P. needles<br />
P. branches<br />
E. leaves<br />
E. bark<br />
E. branches<br />
80<br />
60<br />
40<br />
20<br />
0<br />
0 50 100 150<br />
Figure 2. Remaining cations (K, Ca <strong>and</strong> Mg) from P. Taeda <strong>and</strong> E.gr<strong>and</strong>is harvest residues in <strong>soil</strong>s periodically<br />
leached (% of the initial amounts).<br />
Potassium release from residues was rapid, <strong>and</strong> the amounts in the leachate were higher than the control at<br />
most sampling times. This result is coincident with decomposition studies in the field, which showed a rapid<br />
disappearance of K from harvest residues, attributed to leaching rather than to residue decomposition<br />
(Ganjegunte et al. 2003; Hernández et al. 2009). Moreover, K is less likely to be retained in ex<strong>change</strong>able<br />
form by <strong>soil</strong> colloids when divalent cations (Ca <strong>and</strong> Mg) are released at the same time. Also, eucalyptus<br />
residues presented significantly higher K release than the same corresponding fraction (leaves or branches)<br />
for pine residues, which is coincident with their higher K content.<br />
Magnesium concentration in leachate from eucalyptus residues was greater than control <strong>soil</strong> at most<br />
samplings, but this was not observed in pine residues. In field experiments with eucalyptus residues<br />
Hernández et al. (2009) reported Mg losses from residues which were closely linked to decomposition rates.<br />
On the other h<strong>and</strong>, the amounts of Ca in the leachate were similar in control <strong>soil</strong>s <strong>and</strong> the <strong>soil</strong>s amended with<br />
residues, except for eucalyptus leaves, which showed higher Ca release. Calcium is a structural component<br />
of vegetal tissues; consequently the Ca concentration in residues tends to increase as decomposition proceeds<br />
<strong>and</strong> it is only released at advanced stages of decomposition (Ouro et al. 2001). Considering the lower Ca <strong>and</strong><br />
Mg content of pine residues compared to eucalyptus, it is possible that an important proportion of the divalent<br />
released cations from pine was retained in ex<strong>change</strong>able forms in the <strong>soil</strong>, <strong>and</strong> hence, was not leached.<br />
days<br />
96
Conclusions<br />
Decomposition of harvest residues followed an exponential decay trend with the highest losses<br />
corresponding to P. taeda needles <strong>and</strong> E. gr<strong>and</strong>is leaves. Cation release followed a similar trend, with the<br />
lowest supply from coarse residues. While released K was easily leached, Ca <strong>and</strong> Mg tended to remain either<br />
within the residues or as ex<strong>change</strong>able forms in the <strong>soil</strong>.<br />
References<br />
Berg B, McClaugherty C (1989) Nitrogen <strong>and</strong> phosphorus release from decomposing litter in relation to the<br />
disappearance of lignin. Can. J. Bot. 67, 1148-1155.<br />
Burgess MS, Mehuys GR, Madramootoo CA (2002) Nitrogen dynamics of decomposing corn residue<br />
components under three tillage systems. Soil Sci. Soc. Am. J. 66, 1350-1358.<br />
Gangegunte GK, Condron LM, Clinton PW, Davis MR, Mahieu N (2003) Decomposition <strong>and</strong> nutrient<br />
release from radiata pine (Pinus Radiata) coarse woody debris. For. Ecol. Manage. 187, 197-211.<br />
Gómez Rey MX, Vasconcelos E, Madeira M. (2008). Effects of eucalypt residue management on nutrient<br />
leaching <strong>and</strong> <strong>soil</strong> properties. Eur. J. <strong>Forest</strong> Res. 127, 379-386<br />
Hernández J, del Pino A, Salvo S, Arrarte G (2009) Nutrient export <strong>and</strong> harvest residue decomposition<br />
patterns of a Eucalyptus dunnii Maiden plantation in temperate climate of Uruguay. For. Ecol. Manage.<br />
258, 92-99.<br />
Mary B, Recous S, Darwis D, Robin D (1996) Interactions between decomposition of plant residues <strong>and</strong><br />
nitrogen cycling in <strong>soil</strong>. Plant Soil 181, 71-82.<br />
Nelson DW, Sommers LE (1996) Total carbon, organic carbon, <strong>and</strong> organic matter. In ´Methods of Soil<br />
Analysis. Part 3. Chemical Methods´. (Eds. DL Sparks et al.) pp. 961-1010. ASA <strong>and</strong> SSSA, Madison<br />
WI.<br />
Ouro G, Pérez Batallón P, Merino A (2001) Effect of sylvicultural practices on nutrient status in a Pinus<br />
radiata plantation: Nutrient export by tree removal <strong>and</strong> nutrient dynamics in decomposing logging<br />
residues. Ann. For. Sci. 58, 411-422.<br />
© 2010 19 th World Congress of Soil Science, Soil Solutions for a Changing World<br />
1 – 6 August 2010, Brisbane, Australia. Published on DVD.<br />
97
Short-term effects of litter extraction on <strong>soil</strong> respiration, <strong>soil</strong> temperature <strong>and</strong><br />
<strong>soil</strong> water content in a Sclerophyll forest of Central Chile<br />
Juan-Pablo Fuentes A , Horacio Bown A , Daniela Gatica A <strong>and</strong> Jorge Pérez B<br />
A Faculty of <strong>Forest</strong>ry Sciences <strong>and</strong> Nature Conservation, University of Chile, Santiago, Email jufuente@uchile.cl<br />
B Faculty of Agronomic Sciences, University of Chile, Santiago.<br />
Abstract<br />
Litter extraction is a common practice in sclerophyll forests of Central Chile. This process has caused a<br />
long-term depletion of C substrates, thereby affecting biogeochemical balances, <strong>soil</strong> microbial populations,<br />
<strong>and</strong> plant germination. Evaluation of the effects of litter removal on biophysical parameters such as <strong>soil</strong><br />
respiration, <strong>soil</strong> temperature <strong>and</strong> <strong>soil</strong> water content do not exist for this type of forest ecosystems. The aim of<br />
this study was to evaluate the short-term effect, caused by the extraction of <strong>soil</strong> organic layers in a peumoboldo-litre<br />
forest ecosystem, in these biophysical parameters. Soil respiration, <strong>soil</strong> water content <strong>and</strong> <strong>soil</strong><br />
temperatures at different depths were measured in a 24-days period. Immediate extraction of <strong>soil</strong> litter layers<br />
did not cause significant differences in <strong>soil</strong> respiration. In the consecutive sampling days, litter extraction<br />
caused significant decreases in <strong>soil</strong> respiration. Overall, the extraction of organic layers caused a decrease of<br />
about 33% in <strong>soil</strong> respiration. The extraction of <strong>soil</strong> organic layers, particularly the Oe+Oa layers might be<br />
responsible of the decrease in <strong>soil</strong> respiration. These layers contain considerable amounts of readily<br />
decomposable sources of C as well as microbial populations that could contribute to <strong>soil</strong> respiration. The<br />
decreased <strong>soil</strong> water content impeded a good correlation between <strong>soil</strong> T <strong>and</strong> <strong>soil</strong> respiration.<br />
Key Words<br />
Soil respiration, litter removal, sclerophyll forest, Chile.<br />
Introduction<br />
In the last decades, <strong>soil</strong> respiration has been considered one of the main fluxes of carbon in terrestrial<br />
ecosystems. Approximately 70% of CO2 ex<strong>change</strong> between the forest ecosystem <strong>and</strong> the atmosphere comes<br />
from the <strong>soil</strong> (Raich <strong>and</strong> Schlesinger 1992; Granier et al. 2000). The <strong>soil</strong> respiration rate is controlled by the<br />
decomposition of <strong>soil</strong> organic matter (SOM), the inputs of plant debris, root respiration (Raich 1998), <strong>and</strong><br />
<strong>soil</strong> environmental factors such as <strong>soil</strong> temperature <strong>and</strong> <strong>soil</strong> water content. Since an important fraction of<br />
<strong>soil</strong> respiration depends on litter decomposition, plant litter removal can reduce <strong>soil</strong> respiration up to 25%<br />
(Luo <strong>and</strong> Zhou 2006). In sclerophyll forests of Central Chile, litter removal is a common practice which has<br />
contributed to the degradation of these ecosystems, causing <strong>soil</strong> nutrient <strong>and</strong> SOM depletion, <strong>soil</strong> erosion <strong>and</strong><br />
germination problems of tree seeds. Effects of litter removal on biophysical parameters have not been<br />
determined for this type of forest ecosystem. The aim of this study was to evaluate the short-term effects (i.e.<br />
first 20 days) of litter extraction on <strong>soil</strong> respiration, temperature, <strong>and</strong> <strong>soil</strong> water content in a sclerophyll forest<br />
of Central Chile. We also elevated the effect of temperature <strong>and</strong> <strong>soil</strong> water content on <strong>soil</strong> respiration. We<br />
hypothesize that litter extraction will made the declination of <strong>soil</strong> respiration as a consequence of <strong>change</strong>s in<br />
environmental factors <strong>and</strong> the depletion of SOC substrate.<br />
Materials <strong>and</strong> methods<br />
Study area <strong>and</strong> site description<br />
The study area was located in Central Chile (34 o 7'36"S, 71 o 11'18"W; 247m above sea level) near the city of<br />
Santiago (Figure 1). The climate type of the zone is Mediterranean with a mean annual precipitation of 503<br />
mm, <strong>and</strong> maximum <strong>and</strong> minimum annual air temperatures of 29 <strong>and</strong> 3 o C, respectively (CONAF 2008). The<br />
study site was located in a toe-slope position <strong>and</strong> represents a typical example of the natural vegetation of the<br />
region. However, the site has less anthropogenic disturbances compared with similar ecosystems of the<br />
region (i.e. harvesting <strong>and</strong> forest fires occurred around 50 years ago). The natural flora of the site is<br />
composed by peumo (Cryptocarya alba (Molina) Looser), boldo (Peumus boldus Molina), <strong>and</strong> litre<br />
(Lithraea caustica (Molina) H. et A.). The <strong>soil</strong> has developed from alluvial granitic deposits, with the<br />
particle-size distribution dominated by the silt fraction. It has well-developed organic layers (Oi, Oe, <strong>and</strong> Oa)<br />
on the surface <strong>and</strong> an A horizon rich in humified SOM.<br />
© 2010 19 th World Congress of Soil Science, Soil Solutions for a Changing World<br />
1 – 6 August 2010, Brisbane, Australia. Published on DVD.<br />
98
CHILE<br />
SOUTH AMERICA<br />
33°20'S<br />
34°0'S<br />
65°20'W<br />
Metropolitan Region<br />
65°20'W<br />
Study Area<br />
64°40'W<br />
64°40'W<br />
Santiago<br />
© 2010 19 th World Congress of Soil Science, Soil Solutions for a Changing World<br />
1 – 6 August 2010, Brisbane, Australia. Published on DVD.<br />
64°0'W<br />
64°0'W<br />
Figure 1. Location of the study area in the Metropolitan Region of Chile.<br />
Experimental setup<br />
A total of three plots of 10 x 10 m were selected. At each plot, 12 cylinders (polyvinyl chloride, 10 cm<br />
internal diameter, 8 cm length) were r<strong>and</strong>omly installed. Cylinders were inserted manually, avoiding major<br />
<strong>soil</strong> <strong>and</strong> organic layers disturbances. One week after the insertion of the collars, <strong>soil</strong> litter layers (Oi <strong>and</strong><br />
Oe+Oa) were extracted from six cylinders per plot. The litter extraction treatment (LE) represented the<br />
manual cleaning of an area of 0.56 m 2 . The litter extracted was equivalent to 14.4 <strong>and</strong> 9.2 Mg/ha of the Oi<br />
<strong>and</strong> Oe+Oa layers, respectively. Cylinders with no litter extraction were considered as the control treatment<br />
(NLE).<br />
Measurement of biophysical parameters<br />
Soil respiration (R), volumetric <strong>soil</strong> water content (θ), <strong>and</strong> <strong>soil</strong> temperature (T) were measured immediately<br />
after the extraction of the organic layers <strong>and</strong> then, every four days for a total period of 24 days. Soil<br />
respiration (gCO2/m 2 /h) was measured with a portable infrared gas analyzer (Model EGM-4, environmental<br />
Gas Monitor System, PP Systems, USA). Volumetric <strong>soil</strong> water content in the top six-cm of <strong>soil</strong>, was<br />
determined with a time domain reflectometer connected to a datalogger (WET Sensor model WET-2, HH2<br />
moisture meter, Delta-T Devices, UK). This sensor also includes a temperature sensor that allowed <strong>soil</strong><br />
temperature determination at 6-cm <strong>soil</strong> depth. Soil temperature at 10.5- cm depth was measured using a<br />
digital thermometer (Checktemp 1, Hanna Instruments, USA). Surface <strong>soil</strong> temperature was also measured<br />
with an infrared thermometer (IR Wide Range Non-Contact Thermometer, Extech Instruments, USA) inside<br />
each cylinder, <strong>and</strong> immediately after the measurement of <strong>soil</strong> respiration.<br />
Data analysis<br />
Analysis of variance (ANOVA) was used to test for differences in R, θ, <strong>and</strong> T between treatments, <strong>and</strong><br />
during the different days of measurements. The ANOVA model considered a complete r<strong>and</strong>omized block<br />
design with one way treatment structure. Additionally, a correlation analysis was performed between T,θ,<br />
<strong>and</strong> R as the response variable.<br />
Results<br />
Immediate extraction of <strong>soil</strong> litter layers did not cause significant differences (p=0,437) in <strong>soil</strong> respiration. At<br />
day 4 however, <strong>and</strong> in the consecutive sampling days, litter extraction caused significant (p
θ (m3/ m3) R (gCO 2/ m2/ θ (m h)<br />
3/ m3) R (gCO 2/ m2/ h)<br />
1.0<br />
0.8<br />
0.6<br />
0.4<br />
0.2<br />
0.0<br />
0.30<br />
0.25<br />
0.20<br />
0.15<br />
0.10<br />
LE<br />
NLE<br />
0 4 8 12<br />
Days<br />
Days<br />
16 20 24<br />
Figure 2. Temporal variation of <strong>soil</strong> respiration <strong>and</strong> volumetric water content in the top 6.5-cm depth in the<br />
litter extracted (LE) <strong>and</strong> no litter extracted (NLE) treatments. Differences between LE <strong>and</strong> NLE at days 1 <strong>and</strong> 4<br />
are caused by a sampling artifact related to sampling depth. Error bars indicate ± one st<strong>and</strong>ard error of the mean.<br />
than 0.20 m 3 /m 3 , can distort the relationship between R <strong>and</strong> T. The extraction of organic layers caused a<br />
significant increase in <strong>soil</strong> surface temperature (from 15.1 to 20.4 o C), which can be attributed to <strong>change</strong>s in<br />
surface albedo. At lower depths, <strong>soil</strong> temperature was not significantly affected by the extraction of the<br />
organic layers (Figure 3).<br />
Temperature ( o Temperature ( C) oC) 24<br />
C<br />
20<br />
e<br />
u<br />
a 16<br />
e<br />
p<br />
m<br />
T<br />
e<br />
T<br />
e 12<br />
8<br />
0 4 8 12 16 20 24<br />
Surface 6.5-cmdepth 10-cmdepth<br />
LE<br />
© 2010 19 th World Congress of Soil Science, Soil Solutions for a Changing World<br />
1 – 6 August 2010, Brisbane, Australia. Published on DVD.<br />
0 4 8 12<br />
Days<br />
16 20 24 0 4 8 12 16 20 24<br />
Figure 3. Temporal variation of <strong>soil</strong> temperature, at different depths, in the litter extracted (LE) <strong>and</strong> no-litter<br />
extracted (NLE) treatments. Error bars indicate ± one st<strong>and</strong>ard error of the mean.<br />
Conclusions<br />
The sclerophyll forest of Central Chile is characterized by an intensive use, particularly in terms of cattle<br />
activities <strong>and</strong> the extraction of forest litter. The later process has caused the degradation of the <strong>soil</strong> <strong>and</strong> the<br />
perturbation of the C balance. The results of this study showed that <strong>soil</strong> respiration decreased in the first days<br />
after the removal of organic layers. The main factor responsible for this variation seems to be related to the<br />
depletion of the organic substrate rather than <strong>change</strong>s in temperature <strong>and</strong> <strong>soil</strong> water content. Particularly, the<br />
removal of the more humified layers (Oe+ Oa) possibly created a lack of readily-available C sources <strong>and</strong> the<br />
extraction of a substantial population of the microorganisms responsible of C degradation.<br />
Acknowledgements<br />
This work has been supported by the National Science <strong>and</strong> Technology Commision of Chile (CONICYT)<br />
through the projects FONDECYT No 1090283 <strong>and</strong> 1090259. We thank Codelco-Chile División El Teniente<br />
<strong>and</strong> the National Corporation of <strong>Forest</strong>ry (Conaf Sexta Región) for their support . We also thank Cristina<br />
Sáez for their kind advice <strong>and</strong> valuable technical skills. The experiments <strong>and</strong> measurements undertaken for<br />
this paper comply with the current laws of Chile.<br />
NLE<br />
100
References<br />
Corporación Nacional <strong>Forest</strong>al CONAF (2008) ‘Plan de Manejo Reserva Nacional Roblería del Cobre de<br />
Loncha’.<br />
Granier A, Ceschia E, Damesin C, Dufrene E, Epron D, Gross P, Lebaube S, Le Dantec V, Le Goff N,<br />
Lemoine D (2000) The carbon balance of a young beech forest. Functional Ecology 14, 312–325.<br />
Luo Y, Zhou X (2006) Soil Respiration <strong>and</strong> the Environment. 328 p. (Academic Press: USA).<br />
Ma S, Chen J, Butnor J, North M, Euskirchen E, Oakley B (2005) Biophysical controls on <strong>soil</strong> respiration in<br />
the dominant patch types of an old-growth mixed conifer forest. <strong>Forest</strong> Science 51, 221-232.<br />
Raich J (1998) Aboveground productivity <strong>and</strong> <strong>soil</strong> respiration in three Hawaiian rain forests. <strong>Forest</strong> Ecology<br />
<strong>and</strong> Management 107, 309–318.<br />
Raich J, Schlesinger W (1992). The global carbon dioxide flux in <strong>soil</strong> respiration <strong>and</strong> its relationship to<br />
vegetation <strong>and</strong> climate. Tellus 44B, 81–99.<br />
Rey A, Pegoraro E, Tedeschi V, de Parri I, Jarvis P, Valentín R (2002) Annual variation in <strong>soil</strong> respiration<br />
<strong>and</strong> its components in a coppice oak forest in Central Italy. Global Change Biology 8, 851-866.<br />
© 2010 19 th World Congress of Soil Science, Soil Solutions for a Changing World<br />
1 – 6 August 2010, Brisbane, Australia. Published on DVD.<br />
101
Soil carbon stocks estimation with reference to the degree of volcanic ash<br />
additions in Japanese forest <strong>soil</strong>s<br />
Akihiro Imaya A , Shuichiro Yoshinaga A <strong>and</strong> Seiichi Ohta B<br />
A <strong>Forest</strong>ry <strong>and</strong> <strong>Forest</strong> Products Research Institute, Tsukuba, Ibaraki, Japan, Email imaya@ffpri.affrc.go.jp<br />
B Graduate school of Agriculture, Kyoto University, Kyoto, Kyoto, Japan, Email otasei@kais.kyoto-u.ac.jp<br />
Abstract<br />
The objective of this study is to clarify the influence of volcanic ash addition on the <strong>soil</strong> carbon stocks <strong>and</strong><br />
their accumulation process in Japanese forest <strong>soil</strong>s. Volcanic ash additions to the <strong>soil</strong> were estimated based<br />
on the acid ammonium oxalate extractable aluminium (Alox) content, lithic fragment abundance <strong>and</strong> their<br />
vertical distribution patterns. The carbon in <strong>soil</strong> samples is controlled by Al-humus complex formation which<br />
is determined by the free Al generated from accumulated volcanic ash. The stratigraphical relationship of<br />
volcanic ash accumulation horizons affected the vertical distribution of carbon. In addition, successive<br />
accumulation of volcanic ash on the <strong>soil</strong> surface leads to development of the <strong>soil</strong> surface horizon <strong>and</strong> to<br />
increased <strong>soil</strong> carbon stock. These influences to <strong>soil</strong> carbon accumulation due to the degree of volcanic ash<br />
addition to <strong>soil</strong> resulted in variable <strong>soil</strong> carbon stocks among <strong>soil</strong> types reflecting the degree of volcanic ash<br />
addition. Our results suggest that volcanic ash addition controls the <strong>soil</strong> carbon stock of these Japanese forest<br />
<strong>soil</strong>s.<br />
Key Words<br />
Volcanic ash, <strong>soil</strong> carbon stock, forest <strong>soil</strong>, Al-humus complex formation, free Al.<br />
Introduction<br />
Information on <strong>soil</strong> derived from volcanic ash will be important for evaluating <strong>and</strong> predicting the <strong>soil</strong> carbon<br />
stock. However, the method of estimation of volcanic ash additions is not established for the Japanese forest<br />
<strong>soil</strong>s. The objectives of this study were to clarify the influence of volcanic ash addition on the <strong>soil</strong>s <strong>and</strong> to<br />
classify these <strong>soil</strong>s in detail based on their <strong>and</strong>ic <strong>soil</strong> properties <strong>and</strong> to clarify the influence of volcanic ash<br />
addition on <strong>soil</strong> carbon accumulation in forest <strong>soil</strong>s of Japan.<br />
Methods<br />
Soils<br />
86 sola of Japanese forest <strong>soil</strong> such as Brown <strong>Forest</strong> <strong>soil</strong>s (BFS), Black <strong>soil</strong>s (BLS), Red <strong>soil</strong>s (R) <strong>and</strong><br />
Immature <strong>soil</strong>s (Im) were used. These <strong>soil</strong>s could be classified into Andosols, Umbrisols <strong>and</strong> Cambisols<br />
according to WRB 2006. Studied <strong>soil</strong>s experience 7.5-16.2 ºC of mean annual air temperature, 1385-3641<br />
mm of annual precipitation, <strong>and</strong> 37-1300 m of altitude. Various rocks, i.e., igneous, sedimentary,<br />
metamorphic, <strong>and</strong> volcaniclastic materials underlie these <strong>soil</strong>s. These <strong>soil</strong>s are under plantation forest of<br />
Japanese cedar or Japanese cypress <strong>and</strong> secondary forest of fagus, quercus <strong>and</strong> other broad leaved trees.<br />
Chemical analysis<br />
Total <strong>soil</strong> organic carbon was analyzed using the dry combustion method (MT-600 CN Corder Yanaco,<br />
Kyoto, Japan). Dry bulk density of the fine earth (< 2 mm) was measured by the core method (Soil Survey<br />
Laboratory 1996). The volume of lithic fragments was estimated from the lithic fragment abundances in the<br />
field profile description (Food <strong>and</strong> Agriculture Organization 1990). Acid oxalate extractable Al (Alox) <strong>and</strong><br />
pyrophosphate extractable Al (Alpy) were determined using ISRIC methods (Reeuwijk 1993).<br />
Soil carbon stock analysis<br />
The <strong>soil</strong> carbon stocks were calculated for 0-30 cm depth, 0-100 cm depth <strong>and</strong> effective <strong>soil</strong> depth using the<br />
total <strong>soil</strong> organic carbon content, dry bulk density <strong>and</strong> abundance of lithic fragments.<br />
Results<br />
Volcanic ash additions to the <strong>soil</strong> were estimate based on the Alox content <strong>and</strong> lithic fragment abundance<br />
<strong>and</strong> their vertical distribution patterns. Therefore, BFS were classified in order of increasing volcanic ash<br />
additions to the <strong>soil</strong> parent material: H-Alox-NGv, H-Alox-Gv, M-Alox, <strong>and</strong> L-Alox. H-Alox-NGv BFS was<br />
characterized by an increase in the Alox content to ≥ 20 g/kg from the surface to subsurface horizons <strong>and</strong> a<br />
© 2010 19 th World Congress of Soil Science, Soil Solutions for a Changing World<br />
1 – 6 August 2010, Brisbane, Australia. Published on DVD.<br />
102
near or complete absence of lithic fragment throughout the profile. H-Alox-Gv BFS was also characterized<br />
by Alox of ≥ 20 g/kg in the subsurface horizon but many lithic fragments were present in the surface <strong>and</strong>/or<br />
subsurface horizons. In the M-Alox BFS type, the maximum Alox content was > 4 g/kg but < 20 g/kg. In the<br />
L-Alox BFS type, the Alox content in the surface <strong>and</strong> subsurface horizons was < 4 g/kg.<br />
Correlation with carbon amount, Alox amount <strong>and</strong> Alpy amount in the <strong>soil</strong> samples suggests that carbon<br />
amounts are controlled by Al-humus complex formation which is due to the free Al generated from<br />
accumulated volcanic ash (Figure 1). Comparison between vertical distribution patterns of carbon amount,<br />
Alox amount <strong>and</strong> Alpy amount show that stratigraphical relationships of volcanic ash accumulated horizons<br />
<strong>and</strong> carbon amounts. In addition, successive accumulation of volcanic ash on the <strong>soil</strong> surface which is shown<br />
by the vertical distribution pattern of Alox, leads to development of the <strong>soil</strong> surface horizon <strong>and</strong> increases the<br />
<strong>soil</strong> carbon stock. The <strong>soil</strong> carbon stocks were larger in the order BLS > H-Alox-NGv BFS, H-Alox-Gv BFS<br />
> M-Alox BFS > L-Alox BFS, R <strong>and</strong> Im (Table 1). These influences on the <strong>soil</strong> carbon accumulation process<br />
by the degree of volcanic ash additions to <strong>soil</strong> have resulted in various the <strong>soil</strong> carbon stocks among the <strong>soil</strong><br />
types reflecting the degree of volcanic ash addition.<br />
Carbon g/kg<br />
300<br />
250<br />
200<br />
150<br />
100<br />
50<br />
0<br />
0 10 20 30 40 50 60 70 80<br />
Alox g/kg<br />
300<br />
250<br />
200<br />
150<br />
100<br />
© 2010 19 th World Congress of Soil Science, Soil Solutions for a Changing World<br />
1 – 6 August 2010, Brisbane, Australia. Published on DVD.<br />
Carbon Carbon g/kg g/kg<br />
50<br />
0<br />
0 10 20 30 40<br />
Alpy g/kg<br />
Figure 1. Relationships between carbon contents <strong>and</strong> Alox, Alpy contents in the <strong>soil</strong> samples.<br />
Table 1. Soil carbon stocks in each <strong>soil</strong> type according to the advanced classification.<br />
Soil type (number of sola) Volcanic ash addition 0-30cm 0-100cm Effective <strong>soil</strong> depth<br />
(kg/m 2 ) (cm)<br />
BLS (6)<br />
Accumulated 14.8 35.6 41.8<br />
H-Alox-NGv BFS (6) Accumulated 12.2 23.8 3<strong>3.2</strong><br />
H-Alox-Gv BFS (7) Highly mixed 10.3 18.5 22.3<br />
M-Alox BFS (45) Lowly mixed<br />
7.1 10.5 11.1<br />
L-Alox BFS (17) Absent<br />
4.5 6.6<br />
6.2<br />
R (3)<br />
Absent<br />
5.1 6.7<br />
7.0<br />
Im (2)<br />
Absent<br />
2.9 3.4<br />
3.1<br />
Conclusion<br />
Degree of volcanic ash additions to the <strong>soil</strong> could be estimated using the BFS classification <strong>and</strong> based on<br />
Alox content, lithic fragment abundance <strong>and</strong> their vertical distribution patterns, as proposed in this work, <strong>and</strong><br />
can provide insight into different pedogenetic <strong>processes</strong>. We found that the volcanic ash additions control the<br />
<strong>soil</strong> carbon stocks of Japanese forest <strong>soil</strong>s.<br />
References<br />
Food <strong>and</strong> Agriculture Organization (1990) Guidelines for <strong>soil</strong> description, 3rd edn. (Food <strong>and</strong> Agriculture<br />
Organization, Rome).<br />
Reeuwijk LP (1993) Procedures for Soil Analysis. Technical paper 9. (International Soil Reference <strong>and</strong><br />
Information Centre, Wageningen).<br />
Soil Survey Laboratory (1996) Bulk density cores field moist (4A3a). In ‘Soil Survey Laboratory Methods<br />
Manual’. Soil Survey Investigations Report No. 42 ver. 3.0, pp. 137-138. (NRCS, USDA: Washington<br />
DC).<br />
103
Soil nutrients, aboveground productivity <strong>and</strong> vegetative diversity after 10 years<br />
of experimental acidification <strong>and</strong> base cation depletion<br />
Mary Beth Adams A <strong>and</strong> James A. Burger B<br />
A USDA <strong>Forest</strong> Service, Timber <strong>and</strong> Watershed Laboratory, Parsons, WV, USA, Email mbadams@fs.fed.us<br />
B Virginia Tech. University, Blacksburg, VA, USA, Email jaburger@vt,edu<br />
Abstract<br />
Soil acidification <strong>and</strong> base cation depletion are concerns for those wishing to manage central Appalachian<br />
hardwood forests sustainably. In this research, 2 experiments were established in 1996 <strong>and</strong> 1997 in two<br />
forest types common in the central Appalachian hardwood forests, to examine how these important forests<br />
respond to depletion of nutrients such as calcium <strong>and</strong> magnesium. After 10 years of treatment, relatively few<br />
effects were detected on <strong>soil</strong> nutrients or total aboveground biomass. This research will continue to monitor<br />
effects as the st<strong>and</strong>s develop <strong>and</strong> as nutrient uptake <strong>and</strong> cycling <strong>change</strong>s over time.<br />
Key Words<br />
Calcium depletion, vegetative diversity, liming, forest sustainability.<br />
Introduction<br />
Concerns have existed for many years about nutrient depletion of forest <strong>soil</strong>s, either through harvesting,<br />
acidic deposition or other causal agents. In the central Appalachians, where both acidic deposition <strong>and</strong> forest<br />
harvesting have been occurring for many decades, depletion of <strong>soil</strong> calcium <strong>and</strong> magnesium is a particular<br />
concern. The forests of the central Appalachians are generally quite productive, <strong>and</strong> highly diverse, <strong>and</strong><br />
serve many important functions including providing recreational opportunities, supporting wood-based<br />
industries <strong>and</strong> communities, providing wildlife habitat, <strong>and</strong> ensuring delivery of ecosystem services. In<br />
1996, a study was begun to assess the effects of base cation depletion on long-term productivity of <strong>soil</strong> <strong>and</strong><br />
forest vegetation in the central Appalachians. These studies are affiliated with the international Long Term<br />
Soil Productivity Study (Powers et al. 2005). Our objectives were: (1) Characterize the productivity,<br />
diversity <strong>and</strong> biogeochemistry of a forest system hypothesized to be sensitive to base cation removals. (2)<br />
Determine the response of this forest community to base cation removal, <strong>and</strong> (3) Create new <strong>and</strong> modify<br />
existing vegetation, nutrient cycling, hydrologic models to describe <strong>and</strong> simulate forest <strong>change</strong> in response to<br />
base cation removals, nitrogen <strong>and</strong> sulfur inputs <strong>and</strong> mitigating base additions. This presentation will focus<br />
on the second objective.<br />
Site descriptions<br />
Two sites were used in this study, the Fork Mountain study site, <strong>and</strong> the Middle Mountain study site, both<br />
located in West Virginia, within the central Appalachian mountains. The Fork Mountain site is also located<br />
within the Fernow Experimental <strong>Forest</strong>, a research area set aside in 1934 <strong>and</strong> dedicated to long-term forestry<br />
research (Adams et al. in press). These sites represent 2 distinct forest types (Table 1), with similar<br />
treatments <strong>and</strong> experimental designs (Adams et al. 2004).<br />
Methods<br />
To induce base cation depletion a combination of treatments was used; whole-tree harvesting was used along<br />
with removal of all down dead wood, to effect removal of aboveground nutrient pools, <strong>and</strong> minimize cycling<br />
from these pools (Whole-tree harvest, WT). Ammonium sulfate fertilizer was applied 3 times per year at 35<br />
kg N/ha/yr, <strong>and</strong> 40 kg S/ha/yr to accelerate leaching of calcium <strong>and</strong> magnesium from the <strong>soil</strong> (WT+NS).<br />
This rate was approximately twice the ambient throughfall inputs (Adams et al. 2006). In addition, dolomitic<br />
lime (WT+NS+LIME) was applied at a rate of 22.5 kg Ca/ha/yr <strong>and</strong> 11 kg Mg/ha/yr (a rate twice that of<br />
export from an untreated reference watershed (Adams et al. 1997), to evaluate whether simple replacement<br />
of these nutrients is effective. On the Middle Mountain site, a treatment of WT plus lime additions (LIME)<br />
was added.<br />
These experiments are designed to last for approximately 80 years. We report on <strong>soil</strong> <strong>and</strong> vegetation<br />
measurements collected prior to <strong>and</strong> during the first 10 years.<br />
© 2010 19 th World Congress of Soil Science, Soil Solutions for a Changing World<br />
1 – 6 August 2010, Brisbane, Australia. Published on DVD.<br />
104
Table 1. Characteristics of the Fork Mountain <strong>and</strong> Middle Mountain long term <strong>soil</strong> productivity study sites.<br />
Fork Mountain Middle Mountain<br />
<strong>Forest</strong> type Mixed hardwoods Cherry- maple , some red spruce<br />
Age of forest st<strong>and</strong> ~80 ~90<br />
(yrs)<br />
Soil type Loamy skeletal, mixed, mesic typic<br />
Dystrochrepts<br />
Elevation (m) 790-850 1100-1250<br />
Experimental<br />
treatments<br />
4 blocks of 4 treatments<br />
– Uncut control<br />
– WT only<br />
– WT+fertilizer<br />
– WT+fertilizer+lime<br />
© 2010 19 th World Congress of Soil Science, Soil Solutions for a Changing World<br />
1 – 6 August 2010, Brisbane, Australia. Published on DVD.<br />
Loamy skeletal, mixed, active, frigid typic<br />
Dystrudepts<br />
4 blocks of 5 treatments<br />
– Uncut control<br />
– WT only<br />
– WT+fertilizer<br />
– WT+fertilizer+lime<br />
– WT+lime<br />
Results<br />
Soil chemistry<br />
Ten years after the experiments began; the only detectable treatment effects on <strong>soil</strong> nutrients appear related<br />
to the liming treatment. Changes in <strong>soil</strong> pH due to the LIME treatment were noted at the more acidic the<br />
Middle Mountain study site (Figure 1). The liming treatment increased <strong>soil</strong> magnesium (Mg) levels<br />
significantly in all 3 depths studied on the Fork Mountain site (Figure 2), but there were no statistically<br />
significant treatment effects on <strong>soil</strong> ex<strong>change</strong>able calcium. Soil carbon in the upper <strong>soil</strong> horizons of the<br />
liming treatment also appear to have increased after 10 years, but the effect is not statistically significant.<br />
Vegetation<br />
Total aboveground wood biomass did not differ among treatments (Johnson et al. in press) on the Fork<br />
Mountain site after 10 years. An analysis of treatment effects at the species level suggests, however, that<br />
some tree species, notably Liriodendron tulipifera <strong>and</strong> Magnolia acuminata, demonstrated increased<br />
diameter growth <strong>and</strong> accumulated significantly greater biomass in the WT+NS+LIME treatment than in the<br />
other treatments. These tree species are known to acquire <strong>and</strong> utilize more Ca <strong>and</strong> possibly Mg in their<br />
bolewood. Species richness declined at both sites over the 10 year period, presumably due to the <strong>change</strong>s in<br />
microclimate following the whole-tree harvesting treatment, although richness also declined in the uncut<br />
control plots on the Fork Mountain site. Vegetative species richness, which included trees, shrubs <strong>and</strong><br />
herbaceous vegetation, declined from 75 to 57 species during the 10-year period on the Fork Mountain site,<br />
<strong>and</strong> from 40 to 32 species on the Middle Mountain site during the 10 years.<br />
Figure 1. Mean A horizon <strong>soil</strong> pH, Middle Mountain<br />
site. N=12. Bars represent + st<strong>and</strong>ard deviation.<br />
Figure 2. Mean <strong>soil</strong> Mg concentrations, Fork Mountain<br />
site, by <strong>soil</strong> depth <strong>and</strong> by treatment.<br />
Conclusions<br />
Ten years into these 80-year experiments, relatively few effects directly attributable to the chemical<br />
105
treatments have been detected. While there is clearly an effect of the whole tree harvesting on vegetative<br />
productivity <strong>and</strong> diversity, we cannot yet detect <strong>soil</strong> acidification from the fertilization treatments. Only the<br />
liming treatment appears to have had an effect on <strong>soil</strong> chemistry, <strong>and</strong> this effect appears to be due to the<br />
magnesium in the lime, rather than a calcium effect. Soil magnesium levels are so low, that even adding a<br />
small amount has resulted in a significant increase in available magnesium. We will continue to follow<br />
forest development <strong>and</strong> effects on <strong>soil</strong> <strong>and</strong> <strong>soil</strong> solution chemistry to better underst<strong>and</strong> how these hardwood<br />
forests respond to <strong>change</strong>s in availability of important nutrients over time.<br />
References<br />
Adams, MB, Angradi TR, Kochenderfer JN (1997). Streamwater <strong>and</strong> <strong>soil</strong> responses to five years of nitrogen<br />
<strong>and</strong> sulfur additions at the Fernow Experimental <strong>Forest</strong>, West Virginia. <strong>Forest</strong> Ecology <strong>and</strong> Management<br />
95, 79-91.<br />
Adams, MB, Burger J, Zelazny L, Baumgras, J (2004). ‘Description of the Fork Mountain long-term <strong>soil</strong><br />
productivity study: site characterization’. Gen. Tech. Rep. NE-323 (US Department of Agriculture <strong>Forest</strong><br />
Service, Northeastern Research Station: Newtown Square, PA, USA)<br />
Adams, MB, DeWalle, DR, Hom, JL (2006) ‘The Fernow Watershed Acidification Study’. (Springer:<br />
Dordrecht, The Netherl<strong>and</strong>s).<br />
Adams, MB, Edwards PJ, Ford WM, Schuler TM, Thomas-Van Gund, M, Wood, F (in press) ‘Fernow<br />
Experimental <strong>Forest</strong> – Research History <strong>and</strong> Opportunities’. (US Department of Agriculture <strong>Forest</strong><br />
Service: Washington, D.C.)<br />
Johnson, BA, Piatek KB, Adams MB, Brooks JR (in press) Does nitrogen <strong>and</strong> sulfur deposition affect forest<br />
productivity? In ‘Proceedings: Conference on the Ecology <strong>and</strong> Management of High-Elevation <strong>Forest</strong>s of<br />
the Central <strong>and</strong> Southern Appalachian Mountains’. (Eds J Rentch, TM Schuler) (US Department of<br />
Agriculture, <strong>Forest</strong> Service, Northern Research Station. Newtown Square, PA).<br />
Powers, RF, Scott DA, Sanchez FG et al. (2005) The North American long-term <strong>soil</strong> productivity<br />
experiment: Findings from the first decade of research. <strong>Forest</strong> Ecology <strong>and</strong> Management 220, 31-50.<br />
© 2010 19 th World Congress of Soil Science, Soil Solutions for a Changing World<br />
1 – 6 August 2010, Brisbane, Australia. Published on DVD.<br />
106
Spatiotemporal distribution pattern of <strong>soil</strong> temperature in forest gap in Pinus<br />
koraiensis-dominated broadleaved mixed forest in Xiao Xing’an Mountains,<br />
China<br />
Wenbiao Duan A <strong>and</strong> Lixin Chen A<br />
A College of <strong>Forest</strong>ry, Northeast <strong>Forest</strong>ry University, Harbin, China, Email dwbiao88@163.com<br />
Abstract<br />
By using regular grid <strong>and</strong> transect methods, plot <strong>and</strong> sub-plots were established in the forest gap of Pinus<br />
koraiensis-dominated broadleaved mixed forests in Xiao Xing’an Mountains, China. The surfacial,<br />
maximum <strong>and</strong> minimum temperature(Ts, Tmax, <strong>and</strong> Tmin), <strong>and</strong> the temperature at 5, 10, 15, <strong>and</strong> 20cm <strong>soil</strong><br />
depths were measured from May to September 2006 to illustrate their spatiotemporal distribution patterns.<br />
The results showed that high-value regions of daily Ts were not at the gap center, but at north-western <strong>and</strong><br />
eastern sides of the gap, with an asymmetric distribution. Their mean difference between daily Tmax <strong>and</strong> Tmin<br />
was bigger in the trees early <strong>and</strong> late growth periods, but relatively smaller in fast growth period. As for daily<br />
<strong>and</strong> monthly mean <strong>soil</strong> temperatures over <strong>soil</strong> depths, a bimodal behavior was observed in east-west<br />
direction. Daily <strong>and</strong> monthly mean temperature exhibited no apparent <strong>and</strong> single peak behavior in northsouth<br />
direction, except in May, respectively.<br />
Key Words<br />
Pinus koraiensis-dominated broadleaved mixed forest, forest gaps, <strong>soil</strong> temperature, distribution pattern.<br />
Introduction<br />
<strong>Forest</strong> gaps exist widely in forest ecosystems, are in an important phase of forest cycle regeneration.<br />
Environmental heterogeneity caused by gap formation, its impact on species distribution, population<br />
dynamics <strong>and</strong> species diversity in forest gaps, <strong>and</strong> its important roles in forest succession, regeneration <strong>and</strong><br />
growth have been widely concerned (Poulson <strong>and</strong> Platt 1989; Beckage et al. 2000; Fownes <strong>and</strong> Harrington<br />
2004; Pedersen <strong>and</strong> Howard 2004; Diaci et al. 2005). Microclimatic difference between <strong>and</strong> within canopy<br />
gaps (De Freitas <strong>and</strong> Enright 1995), light index <strong>and</strong> its application in Sweden (Dai 1996), microclimate<br />
(Carlson <strong>and</strong> Groot 1997), states of partially microclimatic factors after gap formation <strong>and</strong> <strong>soil</strong> moisture<br />
response (Canham et al. 1990; Gray et al. 2002; Clinton 2003; Raymond et al. 2006) were systematically<br />
performed. Over the past decade, our researches on forest gaps gradually increased in China (Zang RG et al.<br />
1999), but so far, those on microclimate in gaps have been not yet fully developed, particularly on<br />
spatiotemporal distribution patterns of <strong>soil</strong> temperature after gap formation is still rare. Only a fewer<br />
researchers investigated the microclimate in gaps, their researches mainly dealt with light, spatiotemporal<br />
distributions of air <strong>and</strong> <strong>soil</strong> temperature (Zang RG et al. 1999; Zhang YP et al. 2001)) as well as other<br />
microclimatic factors (Liu WJ et al. 2000a; Zhang YP et al. 2002, 2003; Zhu JJ et al. 2007), <strong>and</strong><br />
microclimatic difference (Liu WJ et al. 2000b). However, studies on spatiotemporal distribution of <strong>soil</strong><br />
temperature are still scarce (Zhang YP et al. 2001; Zhu JJ et al. 2007). In vast temperate regions, studies on<br />
the <strong>change</strong>s in <strong>soil</strong> temperature after gap formation are even rarer (Li Y et al. 2007; Zhu JJ et al. 2007).<br />
Therefore, measurement plot <strong>and</strong> sub-plots were established, spatiotemporal distribution pattern of <strong>soil</strong><br />
temperature in this forest gap was analyzed in order to provide basic data for researches on environmental<br />
heterogeneity <strong>and</strong> regeneration in canopy gaps, sustainable ecosystem management.<br />
Materials <strong>and</strong> methods<br />
Study site <strong>and</strong> experimental design<br />
Investigations were performed from May to September 2006 in a gap created naturally in Pinus koraiensisdominated<br />
broadleaved mixed forests in Xiao Xing’an Mountains, in Liangshui National Nature Reserve<br />
(47°06′49″–47°16′10″N, 128°47′8″–128°57′19″E) of Northeast <strong>Forest</strong>ry University, in Dailing District,<br />
Yichun City, Heilongjiang Province, China. For a more in-depth description of this Reserve, see Duan et al.<br />
(Duan et al. 2009). The study site is located in broad-leaved Pinus koraiensis forests at an elevation of 420<br />
m, with negative slope, a slope grade of 10–15°, a northern aspect. The plot area was 20 m×20 m. Canopy<br />
gap was irregularly shaped with about 200 m 2 area, naturally created by multiple gap-makers at unknown<br />
time in the past. The reason for gap formation is more complicated, such as breakdown, snag, <strong>and</strong> tree-fallen.<br />
Tree species surrounding the gap boundary are mainly Pinus koraiensis <strong>and</strong> Betula costata with their average<br />
© 2010 19 th World Congress of Soil Science, Soil Solutions for a Changing World<br />
1 – 6 August 2010, Brisbane, Australia. Published on DVD.<br />
107
height of 17.5 m. For the details of this site, see Duan et al. (Duan et al. 2009). Measurements done from<br />
May to September 2006 in this study area included surfacial, maximum <strong>and</strong> minimum temperature in a grid<br />
design (Figure 1), <strong>and</strong> the temperature at 5, 10, 15, <strong>and</strong> 20 cm <strong>soil</strong> depths along two perpendicular transects<br />
(Figure 2).<br />
Distance Distance from from center of gap (m)<br />
Distance from center of gap (m)<br />
Figure 1. Locations of measurement plots of Ts, Tmax<br />
<strong>and</strong> Tmin. The black line indicates the approximate<br />
contour of the gap.<br />
© 2010 19 th World Congress of Soil Science, Soil Solutions for a Changing World<br />
1 – 6 August 2010, Brisbane, Australia. Published on DVD.<br />
Distance from center of gap (m)<br />
Distance from center of gap (m)<br />
Figure 2. Locations of measurement plots of <strong>soil</strong> temperature<br />
at 5, 10, 15, <strong>and</strong> 20 cm <strong>soil</strong> depth. The black line indicates the<br />
approximate contour of the gap.<br />
Soil temperature measurements<br />
41 locations of measurement sub-plots were selected in the forest gap <strong>and</strong> around its edge by using regular<br />
grid <strong>and</strong> transect methods, surfacial, maximum <strong>and</strong> minimum thermometer were placed at each location<br />
(Figure 1). Other 13 locations of measurement sub-plots were located at gap center (GC), gap edge (GE),<br />
exp<strong>and</strong>ed gap edge (EG), understory (US) along two transects running North-South <strong>and</strong> West-East directions<br />
through gap center. Bended-tube thermometers were installed in each location to measure the temperature at<br />
5, 10, 15, <strong>and</strong> 20cm <strong>soil</strong> depths (Figure 2). Measurement was done from 6:00h to 18:00h for 6-10 days<br />
monthly, time interval was 2 hours.<br />
Data progressing<br />
Soil temperature, which was not directly measured in other locations in the gap, was assessed by estimation<br />
of spatially local Kriging interpolation from geographical statistics (Wang SP et al. 2003). SPSS 11.5 <strong>and</strong><br />
GS+For Windows 3.11 softwares were used for basically <strong>and</strong> spatially statistical analysis on the data,<br />
respectively. SURFER 7.0 software (Golden Software 1999) was used for estimation of spatially local<br />
Kriging interpolation <strong>and</strong> further mapping of <strong>soil</strong> temperature.<br />
Results<br />
Spatiotemporal distribution pattern of <strong>soil</strong> temperature in forest gap<br />
Daily spatial distribution pattern of <strong>soil</strong> surface temperature in forest gap<br />
Daily spatial distribution pattern of Ts in forest gap in July was set as an example (Figure 3). In general,<br />
within a day, the high-value region of Ts happened with the sequence of north-western, northern <strong>and</strong> eastern<br />
sides of the gap, Tmax within the high-value region was 27.0 o C (14:00h)>25.0 o C (12:00h)>23.0 o C<br />
(10:00h)>22.0 o C (16:00h).<br />
Monthly spatial distribution pattern of <strong>soil</strong> surface temperature in forest gap<br />
For the distribution of Ts, all high-value regions in months appeared in eastern side of the gap, but their Tmax<br />
was different, relatively higher from June to August; the secondary high-value regions occurred in northwestern<br />
side of the gap every month, but their gradients were all smaller. All high-value regions of Ts were not in the<br />
central gap, but in eastern <strong>and</strong> northwestern side of the gap, their distribution was asymmetric (Figure 4).<br />
Spatiotemporal distribution pattern of difference between daily Tmax <strong>and</strong> Tmin in forest gap<br />
In the early growing season (May), the diurnal range of Ts was bigger, reached 21.0 o C in northwestern side<br />
of the gap (Figure 5). That was smaller from June to August than that in May, there was a decreasing<br />
tendency; while in the late growing season, it was larger in September than in August. Comparatively higher<br />
mean difference between daily Tmax <strong>and</strong> Tmin in our study area was all located in northwestern <strong>and</strong> eastern<br />
side of the gap.<br />
108
Distance from center of gap (m)<br />
Distance from center of gap (m)<br />
Distance from center of gap (m)<br />
Figure 3. Diurnal spatial distribution pattern of <strong>soil</strong><br />
surface temperature in the gap (Ⅲ).<br />
© 2010 19 th World Congress of Soil Science, Soil Solutions for a Changing World<br />
1 – 6 August 2010, Brisbane, Australia. Published on DVD.<br />
Distance from center of gap (m)<br />
Distance from center of gap (m)<br />
May June July<br />
August September<br />
Distance from center of gap (m)<br />
Figure 4. Monthly spatial distribution pattern of <strong>soil</strong> surface<br />
temperature in the gap (Ⅲ).<br />
Soil temperature along different directions in forest gap<br />
The diurnal variation in <strong>soil</strong> temperature along different directions<br />
A bimodal behavior of <strong>soil</strong> temperature at all locations was observed in east-west direction (Figure 6), their<br />
bimodal values were respectively located in exp<strong>and</strong>ed gap edge in western side <strong>and</strong> in canopy gap edge in<br />
eastern side; An unapparent single peak behavior at all locations was found in north-south direction, the<br />
positions of their bimodal values <strong>change</strong>d weakly over time <strong>and</strong> shifted between in canopy gap edge in<br />
northern side <strong>and</strong> in the center of gap, but in general, the <strong>soil</strong> temperature in northern side was larger than<br />
that in southern side. By contrast, it was comparatively smaller under understory. The magnitude of <strong>change</strong><br />
in <strong>soil</strong> temperature at 5 cm depth was the highest (2 ~7 o C) in daytime, the lowest at 20cm depth (0 ~2 o C).<br />
The monthly variation in <strong>soil</strong> temperature along different directions<br />
Generally, a bimodal behavior was observed in east-west direction every month (Figure 7), bimodal values<br />
occurred in gap edge in eastern side <strong>and</strong> in exp<strong>and</strong>ed gap edge in western side, respectively, bimodal value in<br />
the eastern side was larger than that in western side. Monthly mean <strong>soil</strong> temperatures except in May in northsouth<br />
direction exhibited an unapparent single peak behavior, bimodal value appeared in the central gap <strong>and</strong><br />
in exp<strong>and</strong>ed gap edge in northern side over time, <strong>and</strong> meanwhile <strong>soil</strong> temperature in northern side was<br />
slightly higher than that in southern side.<br />
Distance from center of gap (m)<br />
Distance from center of gap (m)<br />
May June July<br />
August September<br />
Distance from center of gap (m)<br />
Figure 5. Spatial distribution of<br />
difference between daily Tmax <strong>and</strong><br />
Tmin in the gap.<br />
So il tem perature( o C )<br />
Figure 6. Diurnal variation of <strong>soil</strong><br />
temperature at different directions in<br />
the gap.<br />
Soil temperature( o C)<br />
May<br />
June<br />
July<br />
August<br />
September<br />
Figure 7. Monthly variation of <strong>soil</strong><br />
temperature at different directions in<br />
the gap.<br />
Conclusion<br />
For the high-value regions of Ts in the gap, there was apparent diurnal variation, with the sequence of northwestern,<br />
northern <strong>and</strong> eastern sides of the gap, those were all located in north-western <strong>and</strong> eastern side with<br />
109
an asymmetric distribution every month; Mean difference between daily Tmax-Tmin was larger in the tree’s<br />
early <strong>and</strong> late growth periods, but relatively smaller in fast growth period. Comparatively higher diurnal<br />
range was all in north-eastern <strong>and</strong> eastern side of the gap; As for daily <strong>and</strong> monthly mean <strong>soil</strong> temperatures at<br />
5, 10, 15, <strong>and</strong> 20 cm depths, a bimodal behavior was observed in east-west direction, daily bimodal values<br />
were respectively located in exp<strong>and</strong>ed gap edge in western side <strong>and</strong> canopy gap edge in eastern side,<br />
monthly bimodal values occurred in gap edge in eastern side <strong>and</strong> exp<strong>and</strong>ed gap edge in western side,<br />
respectively; Daily <strong>and</strong> monthly mean temperature exhibited no apparent <strong>and</strong> single peak behavior in northsouth<br />
direction, except in May, respectively.<br />
Acknowledgements<br />
This study was supported by National Natural Science Foundation of China (grant no. 30771708).<br />
References<br />
Beckage B, Clark JS, Clinton BD et al. (2000) A long-term study of tree seedling recruitment in southern Appalachian<br />
forests: The effects of canopy gaps <strong>and</strong> shrub understories. Canadian Journal of <strong>Forest</strong> Research 30, 1617-1631<br />
Canham CD, Denslow JS, Platt WJ et al. (1990) Light regimes beneath closed canopies <strong>and</strong> tree-fall gaps in temperate<br />
<strong>and</strong> tropical forests. Canadian Journal of <strong>Forest</strong> Research 20, 620-631<br />
Carlson DW, Groot A (1997) Microclimate of clear-cut, forest interior, <strong>and</strong> small opening in trembling aspen forest.<br />
Agricultural <strong>and</strong> <strong>Forest</strong> Meteorology 87, 313-329<br />
Clinton BD (2003) Light, temperature, <strong>and</strong> <strong>soil</strong> moisture responses to elevation, evergreen understory, <strong>and</strong> small canopy<br />
gaps in southern Appalachians. <strong>Forest</strong> Ecology <strong>and</strong> Management 186, 234-255<br />
Dai XB (1996) Influence of light condition in canopy gaps on forest regeneration: A new gap light index <strong>and</strong> its<br />
application in a boreal forest in east-central Sweden. <strong>Forest</strong> Ecology <strong>and</strong> Management 84, 187-197<br />
De Freitas CR, Enright NJ (1995) Microclimatic difference between <strong>and</strong> within canopy gaps in a temperate rainforest.<br />
International Journal of Biometeorology 38, 188-193<br />
Diaci J, Pisek R, Boncina A (2005) Regeneration in experimental gaps of subalpine Picea abies forest in the Slovenian<br />
Alps. European Journal of <strong>Forest</strong> Research 124, 29-36<br />
Duan WB, Wang J, Li Y (2009) Microenvironmental heterogeneity of physical <strong>soil</strong> properties in a broad-leaved Pinus<br />
koraiensis forest gap. Frontiers of <strong>Forest</strong>ry in China 4, 38–45<br />
Fownes JH, Harrington RA (2004) Seedling response to gaps: Separating effects of light <strong>and</strong> nitrogen. <strong>Forest</strong> Ecology<br />
<strong>and</strong> Management 203, 297-310<br />
Gray AN, Spies TA, Easter MJ (2002) Microclimatic <strong>and</strong> <strong>soil</strong> moisture response to gap formation in coastal Douglas-fir<br />
forests. Canadian Journal of <strong>Forest</strong> Research 32, 332-343<br />
Golden Software (1999) ‘Surfer 7 ® —A Program for Contouring <strong>and</strong> 3D Surface Mapping for Scientists <strong>and</strong><br />
Engineers’. (Golden, Colorado).<br />
Li Y, Duan WB, Chen LX et al. (2007) Microenvironmental variation feature of <strong>soil</strong> surface temperature in a broadleaved<br />
Korean pine forest gap. Science of Soil <strong>and</strong> Water Conservation 5, 81-85 (in Chinese)<br />
Liu WJ, Li QJ, Zhang GM et al. (2000a) Microclimatic characteristics of canopy gaps in Shorea chinensis forest in<br />
Xishuangbanna. Chinese Journal of Plant Ecology 24, 356-361 (in Chinese)<br />
Liu WJ, Li QJ, Zhang GM et al. (2000b) The microclimatic differences between <strong>and</strong> within canopy gaps in the dry-hot<br />
season in Shorea chinensis forest. Acta Ecologica Sinica 20, 932-937 (in Chinese)<br />
Pedersen BS, Howard JL (2004) The influence of canopy gaps on overstory tree <strong>and</strong> forest growth rates in a mature<br />
mixed-age, mixed-species forest. <strong>Forest</strong> Ecology <strong>and</strong> Management 196, 351-366<br />
Poulson TL, Platt WJ (1989) Gap light regimes influence canopy tree diversity. Ecology 70, 553-555<br />
Raymond P, Munson AD, Ruel JC et al. (2006) Spatial patterns of <strong>soil</strong> microclimate, light, regeneration, <strong>and</strong> growth<br />
within silvicultural gaps of mixed tolerant hardwood-white pine st<strong>and</strong>s. Canadian Journal of <strong>Forest</strong> Research 36,<br />
639-651<br />
Zang RG, Liu JY, Dong DF (1999) Gap Dynamics <strong>and</strong> <strong>Forest</strong> Biodiversity. Beijing: China <strong>Forest</strong>ry Press, (in Chinese)<br />
Zhang YP, Dou JX, Ma YX et al. (2003) Temporal-spatial distribution characteristics of microclimate in tropical<br />
secondary forest canopy gap in Xishuangbanna. Chinese Journal of Applied Ecology 14, 2129-2135 (in Chinese)<br />
Zhang YP, Ma YX, Liu YH et al. (2001) Characteristics of spatial distribution of microclimate in the gap of ever-green<br />
broad-leaved forest in the north of Ailao Mountain in Yunnan. Journal of Beijing <strong>Forest</strong>ry University 23, 80-83 (in<br />
Chinese)<br />
Zhang YP, Wang JX, Ma YX et al. (2002) The temporal-spatial distribution of temperature on the surface roughtness of<br />
the tropical secondary gap in Xishuangbanna, Yunnan Province. Scientia Silvae Sinicae 38, 1-5 (in Chinese)<br />
Zhu JJ, Tan H, Li FQ et al. (2007) Microclimate regimes following gap formation in a montane secondary forest of<br />
eastern Liaoning Province, China. Journal of <strong>Forest</strong>ry Research 18, 167-173<br />
Wang SP, Sun ZQ, Wu J et al. (2003) Spatial heterogeneity of characteristic functional parameter of <strong>soil</strong> water<br />
movement: Mathematical approaches, sampling scheme, influencing factors. Science of Soil <strong>and</strong> Water<br />
Conservation 1, 95-98 (in Chinese)<br />
© 2010 19 th World Congress of Soil Science, Soil Solutions for a Changing World<br />
1 – 6 August 2010, Brisbane, Australia. Published on DVD.<br />
110
Substrates used in SIR assays can inhibit basal respiration in rewetted <strong>soil</strong><br />
Katarzyna M. Bialkowski A,B , Robert Archibald A , Giles E. StJ. Hardy A <strong>and</strong> Treena I. Burgess A<br />
A School of Biological Sciences <strong>and</strong> Biotechnology, Murdoch University, Perth, WA, Australia.<br />
B Corresponding author. Email K.Bialkowski@murdoch.edu.au<br />
Abstract<br />
Respiration assays are routinely used for investigating microbial metabolic activity in <strong>soil</strong>, but usually after a<br />
period of “conditioning” whereby dry <strong>soil</strong> is rewetted <strong>and</strong> incubated for a period of days. We showed that<br />
rewetting <strong>and</strong> incubation of <strong>soil</strong> with or without amendments cause <strong>change</strong>s in microbial populations that are<br />
dependent on the type of amendment. As these amendments resulted in altered basal respiration levels <strong>and</strong><br />
SIR profiles, they call into question the suitability of <strong>soil</strong> conditioning as pretreatment for <strong>soil</strong> microbial<br />
analyses. When testing <strong>soil</strong>s from an experiment involving various amendments we have found that different<br />
substances can inhibit, rather than stimulate, respiration following rewetting. We suggest further<br />
investigation of “CO2 burst inhibition” for the purpose of developing a method that does not require naturally<br />
dry or air dried <strong>soil</strong> to undergo conditioning prior to a SIR assay.<br />
Key Words<br />
Soil, SIR, rewetting, amendment, conditioning.<br />
Introduction<br />
One method widely employed for monitoring <strong>soil</strong> microbial status is to quantify respiration in <strong>soil</strong> after the<br />
addition of a simple carbon source: Substrate Induced Respiration (SIR) (Anderson <strong>and</strong> Domsch 1987;<br />
Degens <strong>and</strong> Harris 1997). Miniaturisation of the assay by Campbell et al. (2003) allowed complex analyses<br />
of <strong>soil</strong> microbial “physiological profiles” at the community level (CLPP) to be performed quickly <strong>and</strong><br />
inexpensively (for review see Chapman et al. 2007). CLPP has been used to assess the effects of pollutants<br />
(Kaufmann 2006), amendments (e.g. Degens et al. 2000) <strong>and</strong> l<strong>and</strong>use <strong>change</strong> (Lalor et al. 2007) on <strong>soil</strong>s.<br />
However, while this method can contribute useful data to many areas of environmental science, agriculture<br />
<strong>and</strong> forestry; variability within <strong>and</strong> between <strong>soil</strong>s becomes an obstacle to establishing a robust <strong>and</strong> versatile<br />
protocol. Soil conditioning has been used as one means of reducing this variability. It can also prevent the<br />
dramatic but short-lived increases in <strong>soil</strong> respiration occurring upon rewetting of dry <strong>soil</strong> (the “CO2 burst”)<br />
(Fierer <strong>and</strong> Schimel 2003) that impact the SIR assay. In our investigations of <strong>soil</strong> pretreatment <strong>and</strong> optimal<br />
CLPP assay conditions, we have observed that substrate addition during assays sometimes decreased, rather<br />
than increased, <strong>soil</strong> respiration. In order to explain these surprising results we examined the effects of various<br />
<strong>soil</strong> amendments, including some of the substrates used in SIR assays, on basal <strong>and</strong> substrate-induced<br />
respiration in s<strong>and</strong>y <strong>soil</strong> from the south-west of Western Australia (WA). We hypothesised that rewetting of<br />
the <strong>soil</strong> as well as addition of <strong>soil</strong> amendments will modify respiration levels <strong>and</strong> patterns in SIR assay.<br />
Methods<br />
Experimental setup <strong>and</strong> laboratory analyses<br />
A sample of s<strong>and</strong>y forest <strong>soil</strong> (moisture content less than 5% <strong>and</strong> maximal water holding capacity approx.<br />
0.6 g/ g dry <strong>soil</strong>) was collected from the Mt. Barker area (south-west of WA) <strong>and</strong> stored at between 15 <strong>and</strong><br />
25 0 C for 8 weeks. To test the influence of <strong>soil</strong> amendments on <strong>soil</strong> respiration, 200 g portions of <strong>soil</strong> sieved<br />
through a < 2 mm mesh were mixed with different amendments <strong>and</strong> 50 ml water (where appropriate), placed<br />
in plastic containers <strong>and</strong> incubated for 4 weeks in the dark at 25 0 C. The amendments used were simple<br />
carbon sources (D-glucose <strong>and</strong> organic acids: succinic, D-galacturonic <strong>and</strong> salicylic), supplied at 24 mg C/g<br />
<strong>soil</strong>; NPK fertiliser at 2.5 g/kg <strong>soil</strong>; herbicide (Muron 600) at 220 mg/kg <strong>soil</strong>; activated charcoal at 1:10 w/w<br />
<strong>and</strong> pine shavings at 1:3 v/v. Subsamples of <strong>soil</strong> for SIR assays were taken on the day of setup two hours<br />
after amendment addition <strong>and</strong> then on the seventh day of incubation (<strong>and</strong> after four weeks, data not shown).<br />
SIR assays were carried out in microplate format drawing from MicroResp TM approach of Campbell et. al<br />
(2003). Six substrates were used at 18 mg C/g <strong>soil</strong>: thiamine, glucose, α-ketoglutaric acid, D-glacaturonic<br />
acid, imidazole <strong>and</strong> succinic acid. Due to low solubility in water, a saturated solution of cinnamic acid (the<br />
seventh substrate) was used. Control wells were amended with water only, which provided basal respiration<br />
measurement. The detection plate was prepared as recommended by Lalor (2007) except for some minor<br />
modifications. The results were expressed as µg CO2-C/g oven dry <strong>soil</strong>/hr.<br />
© 2010 19 th World Congress of Soil Science, Soil Solutions for a Changing World<br />
1 – 6 August 2010, Brisbane, Australia. Published on DVD.<br />
111
Statistical analyses<br />
T-tests <strong>and</strong> one-way ANOVA with Dunnett’s C test for multiple comparisons (Quinn <strong>and</strong> Keough 2002)<br />
were used to compare differences between treatments, which were considered significant when p
Figure 1. Basal (left panel) <strong>and</strong> substrate-induced respiration (right panel) of <strong>soil</strong> after addition of amendments;<br />
(a) 2 hrs <strong>and</strong> b) 7 days of incubation at 25 0 C. Error bars denote st<strong>and</strong>ard error of the mean. Left panel -<br />
difference from control (<strong>soil</strong> re-wetted with water); * - p
urst inhibition” is warranted for the purpose of developing a method that is suitable for SIR analysis of<br />
naturally dry or air-dried <strong>soil</strong>s: one that would not require <strong>soil</strong> conditioning.<br />
Acknowledgements<br />
This work was supported by Murdoch University Research Scholarship with top-up from the CRC for<br />
<strong>Forest</strong>ry. We thank the Western Australian State Agricultural Biotechnology Centre at Murdoch University<br />
for access to the equipment.<br />
References<br />
Anderson JPE, Domsch KH (1978) Physiological method for quantitative measurement of microbial biomass<br />
in <strong>soil</strong>s. Soil Biology <strong>and</strong> Biochemistry 10, 215-221.<br />
Campbell CD, Chapman SJ, Cameron CM (2003) A rapid microtiter plate method to measure carbon dioxide<br />
evolved from carbon substrate amendments so as to determine the physiological profiles of <strong>soil</strong> microbial<br />
communities by using whole <strong>soil</strong>. Applied <strong>and</strong> Environmental Microbiology 69, 3593-3599.<br />
Chapman SJ, Campbell CD, Artz RRE (2007) Assessing CLPPs using MicroReSp (TM) - A comparison<br />
with biolog <strong>and</strong> multi-SIR. Journal of Soils <strong>and</strong> Sediments 7, 4<br />
Degens BP, Harris JA (1997) Development of a physiological approach to measuring the catabolic diversity<br />
of <strong>soil</strong> microbial communities. Soil Biology <strong>and</strong> Biochemistry 29, 1309-1320.<br />
Degens BP (1998) Microbial functional diversity can be influenced by the addition of simple organic<br />
substrates to <strong>soil</strong>. Soil Biology <strong>and</strong> Biochemistry 30, 1981<br />
Degens BP, Schipper LA, Claydon JJ (2000) Irrigation of an allophanic <strong>soil</strong> with dairy factory effluent for 22<br />
years: responses of nutrient storage <strong>and</strong> <strong>soil</strong> biota. Aust. J. Soil Res. 38, 25-35.<br />
Fierer N, Schimel JP (2003) A proposed mechanism for the pulse in carbon dioxide production commonly<br />
observed following the rapid rewetting of a dry <strong>soil</strong>. Soil Sci. Soc. Am. J. 67, 798–805.<br />
Kaufmann K, Chapman SJ, Campbell CD, Harms H, Hohener P (2006) Miniaturized test system for <strong>soil</strong><br />
respiration induced by volatile pollutants. Environmental Pollution 140, 269-278.<br />
Lalor BM, Cookson WR, Murphy DV (2007) Comparison of two methods that assess <strong>soil</strong> community level<br />
physiological profiles in a forest ecosystem. Soil Biology <strong>and</strong> Biochemistry 39, 454-462.<br />
Quinn GP, Keough MJ (2002) 'Experimental design <strong>and</strong> data analysis for biologists' (Cambridge University<br />
Press: Cambridge, UK, New York).<br />
© 2010 19 th World Congress of Soil Science, Soil Solutions for a Changing World<br />
1 – 6 August 2010, Brisbane, Australia. Published on DVD.<br />
114
The effect of warming on the CO 2 emissions of young <strong>and</strong> old organic <strong>soil</strong> from a<br />
Sitka spruce plantation.<br />
Andrew Cross A <strong>and</strong> John Grace A<br />
A Institute of Atmospheric <strong>and</strong> Environmental Science, School of GeoSciences, Crew Building, University of Edinburgh, Edinburgh,<br />
EH9 3JN.<br />
Abstract<br />
Under strictly controlled laboratory conditions we investigated the response of <strong>soil</strong> respiration to increasing<br />
temperature. Soil fractions from a Sitka spruce (Picea sitchensis (Bong.) Carr.) plantation were sampled to<br />
represent “fresh” (i.e. shallower <strong>and</strong> containing more labile substrates) <strong>and</strong> “old” (i.e. deeper <strong>and</strong> presumed<br />
to contain more recalcitrant substrates) carbon sources. The <strong>soil</strong>s were incubated at temperatures between 5 -<br />
30 °C, with CO2 efflux measured using a tunable diode laser. “Fresh” <strong>soil</strong> showed substantially higher CO2<br />
effluxes than “old” <strong>soil</strong>, whilst respiration from “fresh” <strong>soil</strong>s was more sensitive to temperature in the range<br />
5 - 10 °C. After a prolonged (56 day) incubation at 20 °C the response of <strong>soil</strong>s to increasing temperature was<br />
re-tested over the same temperature interval. The CO2 fluxes from both “fresh” <strong>and</strong> “old” <strong>soil</strong>s were lower<br />
than the initial measurements, but the sensitivity to temperature had increased in both “fresh” <strong>and</strong> “old” <strong>soil</strong>s.<br />
Key Words<br />
Temperature sensitivity, heterotrophic respiration, labile <strong>and</strong> recalcitrant carbon.<br />
Introduction<br />
Soil organic matter plays a major role in the carbon cycle. The emission of CO2 from organic matter stored in<br />
<strong>soil</strong>s is one of the largest fluxes in the global carbon cycle, so small <strong>change</strong>s in the size of this flux can have<br />
a large effect on atmospheric CO2 concentrations (Schlesinger <strong>and</strong> Andrews 2000) <strong>and</strong> thus constitute a<br />
powerful positive feedback to the climate system. Approximately 1500 Gt of organic carbon is stored in the<br />
world’s <strong>soil</strong>s to a depth of 1 m, with a further 900 Gt between 1-2 m (Kirschbaum 2004). Of particular<br />
concern is the fact that <strong>soil</strong>s of high latitudes include many peatl<strong>and</strong>s <strong>and</strong> other organic <strong>soil</strong>s, <strong>and</strong> store<br />
approximately one third of <strong>soil</strong> carbon globally (Biasi et al. 2005), whilst global warming is expected to be<br />
more pronounced at these high latitudes (IPCC 2007). The temperature sensitivity of <strong>soil</strong> respiration has<br />
been a topic of intense debate over recent years, as summarised by Davidson <strong>and</strong> Janssens (2006). There is<br />
evidence to suggest that under higher temperatures <strong>soil</strong> carbon decomposition will increase, thus resulting in<br />
increased CO2 emissions from heterotrophic respiration (Knorr et al. 2005). However there is a contrasting<br />
opinion that <strong>soil</strong> carbon decomposition will be rather insensitive to temperature (Giardina <strong>and</strong> Ryan 2000),<br />
being mostly determined by the supply rate of substrate. Much of the debate considers the temperature<br />
sensitivity of the labile versus recalcitrant fractions of the <strong>soil</strong> carbon. As a large component of SOM is made<br />
up of such recalcitrant material, the temperature sensitivity <strong>and</strong> potential availability as a substrate for<br />
microbial respiration of this pool are of acute importance with respect to climate <strong>change</strong> (Biasi et al. 2005).<br />
Materials <strong>and</strong> methods<br />
Site description <strong>and</strong> <strong>soil</strong> sampling<br />
Samples for incubation were collected within Harwood <strong>Forest</strong>, Northumberl<strong>and</strong>, Engl<strong>and</strong> (55° 12′ 59” N, 2°<br />
1′ 28” W), a forest consisting of mainly even-aged st<strong>and</strong>s of Sitka spruce (Picea sitchensis (Bong.) Carr.).<br />
The dominant <strong>soil</strong> type found in Harwood forest is peaty gley, a <strong>soil</strong> that is seasonally waterlogged (Zerva et<br />
al. 2005). Sampled <strong>soil</strong>s were separated into shallow (“fresh”) (5 – 15 cm, OL layer) <strong>and</strong> deep (“old”) (20 –<br />
30 cm, A layer) samples <strong>and</strong> transported back to the laboratory where they were stored until preparation for<br />
incubations began. Average <strong>soil</strong> C content was 39.1 % in the “fresh” samples, <strong>and</strong> 21.7 % in the “old”<br />
samples, whilst 14 C dating of samples aged the “fresh” samples between ~0 – 200 years, <strong>and</strong> the<br />
“old”samples at ~2100 years.<br />
Incubation experiment <strong>and</strong> respiration measurements<br />
Before the incubation experiment began, all <strong>soil</strong>s were sieved to 4 mm. They were weighed <strong>and</strong> placed into<br />
modified 500 ml Erlenmeyer flasks. Each flask held approximately 500 g of <strong>soil</strong> at field moisture content.<br />
Flasks (n = 6) were then placed into a temperature-controlled waterbath. The initial incubation temperature<br />
was 5 °C, <strong>and</strong> once respiration rates had stabilised at this temperature for ~48 hours the temperature was<br />
© 2010 19 th World Congress of Soil Science, Soil Solutions for a Changing World<br />
1 – 6 August 2010, Brisbane, Australia. Published on DVD.<br />
115
increased up to a maximum of 30 °C, before the temperature was decreased back down to 5 °C. At each<br />
temperature step, respiration was measured for ~48 hours after rates had stabilised. The total time course of<br />
the initial incubation experiment was 22 days. After the initial experiment flasks containing the <strong>soil</strong>s were<br />
incubated at 20 °C for 56 days, after which the same incubation from 5 - 30 °C was repeated.<br />
Total heterotrophic <strong>soil</strong> respiration was determined using a tunable diode laser absorption spectrometer<br />
(TGA 100A, Campbell Scientific Inc., Logan, Utah, U.S.A.), using methods described in detail in Bowling et<br />
al. (2003). Respiration from each flask was calculated using the difference in CO2 concentrations measured<br />
from the reference <strong>and</strong> sample flasks (containing <strong>soil</strong>), <strong>and</strong> the total dry weight of the <strong>soil</strong> in each flask.<br />
Calculation of Q10<br />
Q10 can be defined as the factor by which respiration rate increases for a temperature interval of 10 °C. This<br />
relationship between <strong>soil</strong> respiration <strong>and</strong> temperature was defined by using the following approach from<br />
Fang et al. (2005): Mean respiration rates were first fitted with Exponential <strong>and</strong> Arrhenius models:<br />
F =ae bT (Exponential), where F is respiration rate, a <strong>and</strong> b are fitted parameters <strong>and</strong> T is the temperature.<br />
F = ae -E/(RT) (Arrhenius), where F is the respiration rate, a is a constant, E is the activation energy, R is the<br />
universal gas constant <strong>and</strong> T is the absolute temperature (K).<br />
Q 10 was then determined for the models, as well as the actual data using:<br />
Q<br />
F<br />
T+<br />
10<br />
10 = , where FT <strong>and</strong> FT+10 are respiration rates at temperatures of T <strong>and</strong> T+10.<br />
FT<br />
The relative increase in respiration rate (∆F/∆T)/FT) was calculated from the derivative of a fitted polynomial<br />
equation, using observed values of temperature (T) <strong>and</strong> respiration rate (F), as per Lloyd <strong>and</strong> Taylor (1994).<br />
Results<br />
Effect of temperature on CO2 flux from “fresh” <strong>and</strong> “old” organic matter<br />
During the initial incubation experiment, heterotrophic <strong>soil</strong> respiration from both the “fresh” <strong>and</strong> “old” <strong>soil</strong>s<br />
increased significantly as the temperature was increased from 5 - 30 °C, with the flux from the “fresh” <strong>soil</strong>s<br />
~2.4 times greater than from the “old” <strong>soil</strong>s (Figure 1). The temperature sensitivity (Q10) of <strong>soil</strong>s during the<br />
initial incubation experiment (across the entire measured temperature range) was higher in the “fresh” <strong>soil</strong>s<br />
compared to the “old” <strong>soil</strong>s (2.38 <strong>and</strong> 2.18 respectively), irrespective of the method of obtaining Q10.<br />
Figure 1. Mean respiration rates of “fresh” <strong>and</strong> “old” <strong>soil</strong> organic matter samples incubated from 5 - 30 °C.<br />
Initial incubation results <strong>and</strong> incubation results after 56 days at 20 °C are on the left <strong>and</strong> right panels<br />
respectively. Respiration rates are expressed as per mass of carbon, <strong>and</strong> error bars are one st<strong>and</strong>ard error of the<br />
mean (n = 3).<br />
Following constant incubation at 20 °C for 56 days, heterotrophic <strong>soil</strong> respiration from both “fresh” <strong>and</strong><br />
“old” <strong>soil</strong>s still responded significantly to increasing temperature, however respiration had decreased in the<br />
“fresh” <strong>and</strong> “old” <strong>soil</strong>s compared to the initial incubation experiment by factors of ~2 <strong>and</strong> ~1.5 respectively.<br />
Fluxes from the “fresh” <strong>soil</strong>s were still significantly higher than the “old” <strong>soil</strong>s although this difference was<br />
smaller than during the initial incubation experiment (Figure 1). The measured Q10 across the entire<br />
temperature range increased after incubation at 20 °C. The Q10 of the “fresh” samples was still higher than<br />
the “old” (2.77 <strong>and</strong> 2.51 respectively), however both samples had higher Q10 values than that of the initial<br />
experiment.<br />
© 2010 19 th World Congress of Soil Science, Soil Solutions for a Changing World<br />
1 – 6 August 2010, Brisbane, Australia. Published on DVD.<br />
116
Figure 2. The relative sensitivity of <strong>soil</strong> respiration to <strong>change</strong>s in <strong>soil</strong> temperature, during the initial incubation<br />
<strong>and</strong> incubation after 56 days at 20 °C, calculated using rates adjusted for percentage carbon <strong>and</strong> bulk density.<br />
Smoothed curves have been fitted to values calculated as the derivative of the polynomial fit (see methods), <strong>and</strong><br />
error bars are one st<strong>and</strong>ard error of the mean (n = 3).<br />
To explore the temperature sensitivity of respiration, it is widely acknowledged that the Q10 is not a very<br />
precise parameter as it averages across a broad range of temperatures. We therefore used the relative increase<br />
in respiration, defined by Lloyd <strong>and</strong> Taylor (1994). During the initial incubation it showed a significant<br />
difference between “fresh” <strong>and</strong> “old” samples at 5 °C (p < 0.01), <strong>and</strong> a significant response to temperature<br />
between 5 - 10 °C (p < 0.01). After the initial decrease from the “fresh” samples, both samples showed a<br />
slight increase in the relative increase in respiration rate in the range 10 - 30 °C (Figure 2). Following<br />
incubation at 20 °C for 56 days, the relative increase in respiration rate showed a significant difference<br />
between “fresh” <strong>and</strong> “old” samples at 5 °C (p < 0.01), <strong>and</strong> a significant response to temperature between 5 -<br />
10 °C (p < 0.01)(Figure 2). The relative increase in respiration however remained relatively constant for the<br />
“fresh” samples, whilst the “old” samples showed an increase with temperature.<br />
Discussion<br />
Respiration after initial <strong>and</strong> 56 day incubations<br />
The effect of temperature on <strong>soil</strong> respiration from both the “fresh” <strong>and</strong> the “old” samples was clearly<br />
apparent, with CO2 flux showing a near-exponential increase with temperature during both the initial<br />
incubation, <strong>and</strong> incubation after 56 days at 20 °C. This relationship was first described by Lundegårdh<br />
(1927) <strong>and</strong> has since been studied <strong>and</strong> quantified for various <strong>soil</strong> types from different environments<br />
(Kirschbaum 1995). Raw respiration rates measured in the present study were comparable to those from<br />
similar studies (Andrews et al. 2000; Fang et al. 2005). Respiration from the “old” samples was significantly<br />
lower than the “fresh” samples. This can be explained by the presence of a high proportion of recalcitrant<br />
carbon in the “old” samples. It has been shown that stores of carbon at depth are usually more resistant to<br />
decomposition by <strong>soil</strong> microbes due to their inherent physical properties <strong>and</strong> chemical constituents (Fierer et<br />
al. 2003), <strong>and</strong> recalcitrant <strong>soil</strong> fractions enriched with resistant alkyl carbon structures increase with <strong>soil</strong><br />
depth <strong>and</strong> age (Lorenz et al. 2007). Following incubation at 20 °C for 56 days, respiration rates had dropped<br />
in both the “fresh” <strong>and</strong> “old” samples. There was however a much more substantial drop in the “fresh”<br />
samples. This is in agreement with studies that have shown that there is a decline in <strong>soil</strong> respiration rate as<br />
incubation time increases (Winkler et al. 1996; Reichstein et al. 2000; Fang et al. 2005). It has been shown<br />
that declines such as this are due to a depletion of the most labile substrates, <strong>and</strong> are greater at higher<br />
temperatures (Grisi et al. 1998; Fang et al. 2005). Given the assumption that the “fresh” samples contained<br />
more labile carbon, mineralization of this carbon after the prolonged incubation at 20 °C appears to be<br />
responsible for the significant decline in respiration from the “fresh” samples.<br />
Temperature sensitivity of “fresh” <strong>and</strong> “old” samples<br />
The Q10 data from the incubations show that the temperature sensitivity of <strong>soil</strong> respiration was higher in the<br />
“fresh” compared to the “old” samples, using the observed as well as modelled data. After incubation for 56<br />
days at 20 °C, Q10 increased for both the “fresh” <strong>and</strong> “old” samples. Fang et al. (2005) hypothesised that Q10<br />
values should decrease after a long incubation if the recalcitrant carbon was unresponsive to temperature<br />
variations, with a more consistent Q10 suggesting that the temperature dependence of recalcitrant carbon is<br />
similar to that of labile carbon. Our results support the latter view, with the temperature sensitivity of both<br />
© 2010 19 th World Congress of Soil Science, Soil Solutions for a Changing World<br />
1 – 6 August 2010, Brisbane, Australia. Published on DVD.<br />
117
“fresh” <strong>and</strong> “young” being very similar after incubation for 56 days at 20 °C. The relative increase in<br />
respiration rate is a term first introduced by Lloyd <strong>and</strong> Taylor (1994). It expresses the decline in carbon per<br />
unit of carbon in the sample. In the present data, the term was significantly higher in the “fresh” samples<br />
compared to the “old” samples, <strong>and</strong> especially so in the range 5 - 10 °C. This has large implications for the<br />
fate of labile <strong>soil</strong> carbon from coniferous forests in temperate climates, given that 5 - 10 °C is a very frequent<br />
temperature range. However at higher temperatures the relative sensitivity of the fresh <strong>soil</strong> samples remained<br />
more or less stable, whilst the sensitivity of the old samples increased with temperature up to 30 °C. A<br />
similar pattern was evident following the 56 day incubation at 20 °C. However the relative temperature<br />
sensitivity for both the “fresh” <strong>and</strong> the “old” samples was higher than during the initial incubation. Assuming<br />
that a large proportion of the labile carbon substrates had been mineralized during the 56 day incubation, this<br />
result suggests that the recalcitrant carbon is more responsive to temperature than the labile carbon, a result<br />
supported by Fierer et al. (2003), however opposed by others (Giardina <strong>and</strong> Ryan 2000; Thornley <strong>and</strong><br />
Cannell 2001). Our results support the view that labile <strong>and</strong> recalcitrant carbon (corresponding to “fresh” <strong>and</strong><br />
“old” carbon) respond similarly to warming, but after 56 days of incubation, indications suggest that<br />
recalcitrant fractions could actually be more sensitive to mineralization, particularly at higher temperatures.<br />
The implications of this result are of great importance to the underst<strong>and</strong>ing <strong>and</strong> prediction of the carbon<br />
cycle response to climate <strong>change</strong> in coniferous forests.<br />
References<br />
Andrews JA, Matamala R, Westover KM, Schlesinger WH (2000) Temperature effects on the diversity of<br />
<strong>soil</strong> heterotrophs <strong>and</strong> the δ 13 C of <strong>soil</strong>-respired CO 2 . Soil Biology <strong>and</strong> Biochemistry 32, 699-706.<br />
Biasi C, Rusalimova O, Meyer H, Kaiser C, Wanek W, Barsukov P, Junger H, Richter A (2005)<br />
Temperature-dependant shift from labile to recalcitrant carbon sources of arctic heterotrophs. Rapid<br />
Communications in Mass Spectrometry 19, 1401-1408.<br />
Bowling DR, Sargent SD, Tanner BD, Ehleringer JR (2003) Tunable diode laser absorption spectroscopy for<br />
ecosystem–atmosphere CO 2 isotopic ex<strong>change</strong> studies. Agricultural <strong>and</strong> <strong>Forest</strong> Meteorology 118, 1-19.<br />
Davidson EA, Janssens IA (2006) Temperature sensitivity of <strong>soil</strong> carbon decomposition <strong>and</strong> feedbacks to<br />
climate <strong>change</strong>. Nature 440, 165-173.<br />
Fang C, Smith P, Moncrieff JB (2005) Similar response of labile <strong>and</strong> resistant <strong>soil</strong> organic matter pools to<br />
<strong>change</strong>s in temperature. Nature 433, 57–59.<br />
Fierer N, Allen AS, Schimel JP, Holden PA (2003) Controls on microbial CO 2 production: a comparision of<br />
surface <strong>and</strong> subsurface <strong>soil</strong> horizons. Global Change Biology 9, 1322-1332.<br />
Giardina C, Ryan M (2000) Evidence that decomposition rates of organic carbon in mineral <strong>soil</strong> do not vary<br />
with temperature. Nature 404, 858-861.<br />
Grisi B, Grace C, Brookes PC, Benedetti A, Dell’abate MT (1998) Temperature effects on organic matter<br />
<strong>and</strong> microbial biomass dynamics in temperate <strong>and</strong> tropical <strong>soil</strong>s. Soil Biology <strong>and</strong> Biochemistry 30, 1309-<br />
1315.<br />
Kirschbaum MUF (1995) The temperature dependence of <strong>soil</strong> organic matter decomposition, <strong>and</strong> the effect<br />
of global warming on <strong>soil</strong> organic C storage. Soil Biology <strong>and</strong> Biochemistry 27, 753-760.<br />
Kirschbaum MUF (2004) Soil respiration under prolonged <strong>soil</strong> warming: are rate reductions caused by<br />
acclimation or substrate loss? Global Change Biology 10, 1870-1877.<br />
Knorr W, Prentice IC, House JI, Holl<strong>and</strong> EA (2005) Long-term sensitivity of <strong>soil</strong> carbon turnover to<br />
warming. Nature 433, 298-301.<br />
Lloyd J, Taylor JA (1994) On the temperature dependence of <strong>soil</strong> respiration. Functional Ecology 8, 315 –<br />
323.<br />
Lorenz K, Lal R, Preston CM, Nierop KGJ (2007) Strengthening the <strong>soil</strong> organic carbon pool by increasing<br />
contributions from recalcitrant aliphatic bio(macro)molecules. Geoderma 142, 1-10.<br />
Lundegårdh H (1927) Carbon dioxide evolution of <strong>soil</strong> <strong>and</strong> crop growth. Soil Science 23, 417-453.<br />
Reichstein M, Bednorz F, Broll G, Kätterer T (2000) Temperature dependence of carbon mineralisation:<br />
conclusions from a long-term incubation of subalpine <strong>soil</strong> samples. Soil Biology <strong>and</strong> Biochemistry 32,<br />
947-958.<br />
Schlesinger WH, Andrews JA (2000) Soil respiration <strong>and</strong> the global carbon cycle. Biogeochemistry 48, 7-20.<br />
Winkler JP, Cherry RS, Schlesinger WH (1996) The Q10 relationship of microbial respiration in a temperate<br />
forest <strong>soil</strong>. Soil Biology <strong>and</strong> Biochemistry 28, 1067-1072.<br />
Zerva A, Ball T, Smith KA, Mencuccini M (2005) Soil carbon dynamics in a Sitka spruce (Picea sitchensis<br />
(Bong.) Carr.) chronosequence on a peaty gley. <strong>Forest</strong> Ecology <strong>and</strong> Management 205, 227-240.<br />
© 2010 19 th World Congress of Soil Science, Soil Solutions for a Changing World<br />
1 – 6 August 2010, Brisbane, Australia. Published on DVD.<br />
118
The effect of wood ants (Formica s. str.) on <strong>soil</strong> chemical <strong>and</strong> microbiological<br />
properties<br />
Veronika Jilkova A , Jan Frouz A,B , Timo Domisch C <strong>and</strong> Leena Finer C<br />
A Institute of Soil Biology, Biological Centre ASCR, Ceske Budejovice, Czech Republic, Email jilkova.veronika@gmail.com<br />
B Institute of Environmental Studies, Charles University, Prague, Czech Republic, Email frouz@natur.cuni.cz<br />
C Joensuu Research Unit, Finnisch <strong>Forest</strong> Research Institute, Joensuu, Finl<strong>and</strong>, Email timo.domisch@metla.fi, Email<br />
leena.finer@metla.fi<br />
Abstract<br />
The wood ants are very important for boreal forest ecosystems. They substantially affect <strong>soil</strong> properties, both<br />
in their nests <strong>and</strong> in the nest surroundings. In this study we focused especially on <strong>change</strong>s in <strong>soil</strong> pH <strong>and</strong><br />
activity of microorganisms. Samples were taken from eight ant nests in each of the two types of forest, both<br />
in eastern Finl<strong>and</strong>. Samples were taken at four sampling locations, i. e., from the bottom of the nest, the top,<br />
the rim <strong>and</strong> the control (> 3m from each nest). Soil respiration, pH, water content <strong>and</strong> organic matter content<br />
were measured. Soil respiration was higher in ant nests, although there was lower moisture. This could be<br />
explained by the import of easily available substances in prey <strong>and</strong> honeydew into the nest. pH values were<br />
higher in ant nests. This is most probably caused by enhanced contents of basic cations that are usually found<br />
in ant nests. Differences in organic matter content were found between individual nest sampling locations,<br />
which could be caused by differences in ant nest construction. The differences between the two types of<br />
forest show that the influence of very similar ant species differs in dependence on environmental conditions.<br />
Key Words<br />
Birch forest, pine forest, humus layer, <strong>soil</strong> mineral layer, Formica aquilonia, Formica rufa.<br />
Introduction<br />
Wood ants (Formica s. str., Hymenoptera: Formicidae) are very important for temperate <strong>and</strong> boreal forest<br />
ecosystems because they affect many <strong>soil</strong> properties (Dlusskij 1967; Frouz <strong>and</strong> Jilkova 2008). They are<br />
considered to be ecosystem engineers (Jones et al. 1994; Jouquet et al. 2006). They affect <strong>soil</strong> pH in their<br />
nests <strong>and</strong> their surroundings by mixing <strong>soil</strong> layers <strong>and</strong> bringing food into their nests (Frouz et al. 2003).<br />
Through their activities they maintain stable temperature regime (Frouz <strong>and</strong> Finer 2007) <strong>and</strong> they also affect<br />
the composition of <strong>soil</strong> microorganisms in their nests (Czerwiński et al. 1971; Petal et al. 2003). Through<br />
these effects, <strong>soil</strong> respiration in ant nests could be different from that of the nest surroundings. In this study<br />
we focused especially on differences in <strong>soil</strong> respiration, <strong>soil</strong> pH, water content <strong>and</strong> organic matter content<br />
between individual sampling locations in ant nests <strong>and</strong> between ant nests <strong>and</strong> their surroundings.<br />
Methods<br />
Sampling sites <strong>and</strong> study design<br />
This study was conducted in two types of forest in eastern Finl<strong>and</strong> in August 2009. The first type was a birch<br />
(Betula spp.) dominated forest <strong>and</strong> the second type was a pine (Pinus sylvestris) dominated forest. We<br />
selected 8 ant nests in each type of forest (a birch forest – Formica aquilonia, a pine forest – Formica rufa).<br />
Soil samples were taken at four sampling locations at each nest, i.e., from the top of the nest, the bottom, the<br />
rim, <strong>and</strong> the control (>3 m away of the nest). Samples were taken from the humus layer <strong>and</strong> from the <strong>soil</strong><br />
mineral layer at control locations. Soil samples were then stored in a refrigerator for measuring <strong>soil</strong><br />
respiration <strong>and</strong> water content, <strong>and</strong> then they were dried at 70°C for measuring pH <strong>and</strong> organic matter content.<br />
Analyses of <strong>soil</strong> samples<br />
For <strong>soil</strong> respiration, 10g of <strong>soil</strong> sample was incubated in a 100ml bottle for two days with 3 mL of 1N NaOH<br />
at 25°C <strong>and</strong> then NaOH was titrated with HCl (Page 1982). Water content was determined after drying for<br />
12h at 105°C. Soil pH was measured in a 1:5 <strong>soil</strong>: water suspension by glass electrode. Organic matter<br />
content was determined based on ignition loss after 5 hours in 600°C.<br />
Statistics<br />
The data were analysed using Statistica 8.0. Split-plot design ANOVA with the nest as a r<strong>and</strong>om factor was<br />
used for determination of effects of the forest type <strong>and</strong> sampling location on each <strong>soil</strong> property. Post-hoc test<br />
(Tukey HSD) was used to determine significant differences between individual sampling locations.<br />
© 2010 19 th World Congress of Soil Science, Soil Solutions for a Changing World<br />
1 – 6 August 2010, Brisbane, Australia. Published on DVD.<br />
119
Results<br />
The type of forest has significant effect on <strong>soil</strong> pH (F1,56=7.62, p
a) b)<br />
25000<br />
<strong>soil</strong> respiration [ug C-CO2/g.h]<br />
20000<br />
15000<br />
10000<br />
5000<br />
0<br />
c) d)<br />
WC [%]<br />
70<br />
60<br />
50<br />
40<br />
30<br />
20<br />
10<br />
0<br />
birch<br />
forest<br />
pine<br />
forest<br />
TOP BOTTOM RIM C HUM C SOIL<br />
TOP BOTTOM RIM C HUM C SOIL<br />
© 2010 19 th World Congress of Soil Science, Soil Solutions for a Changing World<br />
1 – 6 August 2010, Brisbane, Australia. Published on DVD.<br />
pH<br />
5.5<br />
5<br />
4.5<br />
4<br />
3.5<br />
100<br />
80<br />
60<br />
40<br />
20<br />
0<br />
TOP BOTTOM RIM C HUM C SOIL<br />
TOP BOTTOM RIM C HUM C SOIL<br />
Figure 1. The effect of sampling locations on a) <strong>soil</strong> respiration, b) <strong>soil</strong> pH, c) water content, <strong>and</strong> d) organic<br />
matter content in a birch <strong>and</strong> a pine forest. TOP, BOTTOM, <strong>and</strong> RIM mean sampling locations in ant nests, C<br />
HUM <strong>and</strong> C SOIL mean control sampling locations in the humus <strong>and</strong> the <strong>soil</strong> mineral layer. Data are based on<br />
80 <strong>soil</strong> samples in total (split-plot design ANOVA).<br />
Discussion<br />
Soil respiration quite differed between the two types of forest. In the birch forest, the highest respiration rates<br />
were found at the top of ant nests, which values differed significantly from that of the humus layer. In the<br />
pine forest, the highest respiration rates were found at the bottom <strong>and</strong> the rim of ant nests. These differences<br />
may be caused by differences in <strong>soil</strong> pH, water content <strong>and</strong> the quality of organic matter content. These<br />
properties are known to be responsible for the <strong>change</strong>s in <strong>soil</strong> respiration (Amador <strong>and</strong> Görres 2007; Lenoir<br />
et al. 2001). The nest respiration strongly depends on nest moisture but here, drier nests had higher<br />
respiration rates probably due to the import of easily available substances in prey <strong>and</strong> honeydew into the<br />
nests (Horstmann 1974). Higher respiration rates in ant nests are in agreement with Laakso <strong>and</strong> Setälä<br />
(1998). In that study, ant nests are considered as hot spots for decomposers.<br />
Higher pH values were found in ant nests, especially in comparison to the humus layer. This is not a<br />
surprising result given that the forest humus layer is typically highly acidic (Brady <strong>and</strong> Weil 2001). pH is<br />
strongly correlated with organic matter content (Frouz et al. 2003). At the top of ant nests, higher pH values<br />
were found in comparison to the humus layer, <strong>and</strong> at the bottom <strong>and</strong> the rim, higher pH values were found in<br />
comparison to the <strong>soil</strong> mineral layer, although high organic matter content was found in ant nests. These<br />
results show that there are also other factors influencing <strong>soil</strong> pH. One of them could be higher contents of<br />
basic cations in ant nests (Frouz et al. 2003). In agreement with previous studies, ant nests were drier in<br />
comparison to the surroundings of the nests (Dlusskij 1967; Frouz <strong>and</strong> Jilkova 2008; Jurgensen et al. 2008).<br />
The highest water contents were found at the tops of ant nests, which is in agreement with Frouz (1996).<br />
The differences in organic matter content between the tops of ant nests <strong>and</strong> the bottoms <strong>and</strong> the rims of ant<br />
nests could be most probably explained by differences in ant nest construction. The bottom <strong>and</strong> the rim of an<br />
ant nest is built by excavation of the deeper <strong>soil</strong> profiles that do not contain much organic matter, whereas the<br />
top of an ant nests is mainly built of needles <strong>and</strong> twigs from the nest surroundings (Dlusskij 1967). The<br />
differences between the two types of forest show that the influence of even very similar ant species differs in<br />
dependence on environmental conditions (Holec 2006)<br />
organic matter content [%]<br />
121
Aknowledgements<br />
This study was supported by grant LC06066.<br />
References<br />
Amador JA, Görres JH (2007) Microbiological characterization of the structures built by earthworms <strong>and</strong><br />
ants in an agricultural field. Soil Biology <strong>and</strong> Biochemistry 39, 2070-2077.<br />
Brady NC, Weil RR (1999) ‘The Nature <strong>and</strong> Properties of Soils.’ (Prentice-Hall: Upper Saddle River, New<br />
Jersey)<br />
Czerwiński Z, Jakubczyk H, Petal J (1971) Influence of ant hills on the meadow <strong>soil</strong>s. Pedobiologia 11, 277-<br />
285.<br />
Dlusskij GM (1967) ‘Muravji roda Formica.’ (Nauka: Moskva)<br />
Frouz J (1996) The role of nest moisture in thermoregulation of ant (Formica polyctena, Hymenoptera,<br />
Formicidae) nests. Biologia 51, 541-547.<br />
Frouz J, Finer L (2007) Diurnal <strong>and</strong> seasonal fluctuations in wood ant (Formica polyctena) nest temperature<br />
in two geographically distant populations among a south-north gradient. Insectes Sociaux 54, 251-259.<br />
Frouz J, Jilkova V (2008) The effect of ants on <strong>soil</strong> properties <strong>and</strong> <strong>processes</strong> (Hymenoptera: Formicidae).<br />
Myrmecological News 11, 191-199.<br />
Frouz J, Holec M, Kalcik J (2003) The effect of Lasius niger (Hymenoptera: Formicidae) ant nest on<br />
selected <strong>soil</strong> chemical properties. Pedobiologia 47, 205-212.<br />
Holec M, Frouz J (2006) The effect of two ant species Lasius flavus <strong>and</strong> Lasius niger on <strong>soil</strong> properties in<br />
two contrasting habitats. European Journal of Soil Biology 42, 213-217.<br />
Horstmann K (1974) Untersuchungen über den Nahrungswerb der Waldameisen (Formica polyctena<br />
Foerster) im Eichenwald. III. Jahresbilanz. Oecologia 15, 187-204.<br />
Jones CG, Lawton JH, Shachak M (1994) Organisms as ecosystem engineers. Oikos 69, 373-386.<br />
Jouquet P, Dauber J, Lagerlöf J, Lavelle P, Lepage M (2006) Soil invertebrates as ecosystem engineers:<br />
Intended <strong>and</strong> accidental effects on <strong>soil</strong> <strong>and</strong> feedback loops. Applied Soil Ecology 32, 153-164.<br />
Jurgensen MF, Finer L, Domisch T, Kilpelainen J, Punttila P, Ohashi M, Niemela P, Sundstrom L,<br />
Neuvonen S, Risch AC (2008) Organic mound-building ants: their impact on <strong>soil</strong> properties in temperate<br />
<strong>and</strong> boreal forest. Journal of Applied Entomology 132, 266-275.<br />
Laakso J, Setälä H (1998) Composition <strong>and</strong> trophic structure of detrital food web in ant nest mounds of<br />
Formica aquilonia <strong>and</strong> in the surrounding forest <strong>soil</strong>. Oikos 81, 266-278.<br />
Lenoir L, Persson T, Bengtsson J (2001) Wood ant nests as potential hot spots for carbon <strong>and</strong> nitrogen<br />
mineralisation. Biology <strong>and</strong> Fertility of Soils 34, 235-240.<br />
Page AL (1982) ‘Methods of <strong>soil</strong> analysis. Part 2. Chemical <strong>and</strong> microbiological properties.’ (American<br />
Society of Agronomy Inc.: Madison, WI)<br />
Petal J, Chmielewski K, Kusińska A, Kaczorowska R, Stachurski A, Zimka J (2003) Biological <strong>and</strong> chemical<br />
properties of fen <strong>soil</strong>s affected by anthills of Myrmica spp. Polish Journal of Ecology 51, 67-78.<br />
© 2010 19 th World Congress of Soil Science, Soil Solutions for a Changing World<br />
1 – 6 August 2010, Brisbane, Australia. Published on DVD.<br />
122
Tree nutrition <strong>and</strong> chemical properties of a s<strong>and</strong>y <strong>soil</strong> in a pine plantation<br />
receiving repeated biosolids applications<br />
Hailong Wang A , Mark O. Kimberley B <strong>and</strong> Peter J. Wilks C<br />
A Scion, Private Bag 3020, Rotorua, New Zeal<strong>and</strong>, Email hailong.wang@scionresearch.com<br />
B Scion, Private Bag 3020, Rotorua, New Zeal<strong>and</strong>, Email mark.kimberley@scionresearch.com<br />
C PF Olsen Ltd., Richmond, Nelson, New Zeal<strong>and</strong>, Email peter.wilks@pfolsen.com<br />
Abstract<br />
Biosolids are rich in organic carbon <strong>and</strong> nutrients <strong>and</strong> are commonly used as a fertiliser <strong>and</strong> <strong>soil</strong> amendment.<br />
Since the mid-1990s, a Pinus radiata (D. Don) plantation growing on a s<strong>and</strong>y, low fertility <strong>soil</strong> at Rabbit<br />
Isl<strong>and</strong> near Nelson, New Zeal<strong>and</strong>, has received aerobically digested liquid biosolids. An experimental<br />
research trial was established on the site in 1997 to investigate the effects of biosolids applications on tree<br />
growth, nutrition, <strong>and</strong> <strong>soil</strong> quality. Biosolids have been applied to the trial site every three years since 1997,<br />
at three application rates: 0 (Control), 300 (Low) <strong>and</strong> 600 kg N/ha (High). Tree nutrition status is monitored<br />
annually. Soil samples were taken in August 2007 to assess the effects of the repeated biosolids application<br />
on <strong>soil</strong> chemical properties. Biosolids application increased N concentration in pine foliage. <strong>Forest</strong> litter <strong>and</strong><br />
<strong>soil</strong> analysis indicates that the High biosolids treatment has significantly increased concentrations of <strong>soil</strong><br />
available P <strong>and</strong> organic C, but reduced <strong>soil</strong> pH. The High biosolids treatment has also increased<br />
concentrations of total <strong>soil</strong> Cu, Pb <strong>and</strong> Zn, although overall concentrations are considered to be very low for<br />
a <strong>soil</strong>. The Low biosolids treatment had no significant effect on <strong>soil</strong> chemical properties. Our results show<br />
that repeated application of biosolids to a plantation forest can significantly improve tree nutrition <strong>and</strong> site<br />
productivity. However, the biosolids-derived heavy metals are strongly retained by the litter layer. The long<br />
term effects of these litter-retained metals need to be evaluated.<br />
Key Words<br />
Sewage sludge, plantation forest, low fertility, <strong>soil</strong> quality.<br />
Introduction<br />
Using biosolids (i.e., treated sewage sludge) as a fertiliser <strong>and</strong> <strong>soil</strong> amendment is one of the most common<br />
options for biosolids management (Magesan <strong>and</strong> Wang 2003). Compared with applying biosolids to<br />
agricultural l<strong>and</strong>, forest l<strong>and</strong> application can reduce the risk of contaminants entering the human food chain,<br />
<strong>and</strong> can also increase tree growth <strong>and</strong> subsequent economic returns (Kimberley et al. 2004). The regional<br />
wastewater treatment plant in Nelson, New Zeal<strong>and</strong>, originally established in 1983, was upgraded to<br />
incorporate the h<strong>and</strong>ling of biosolids in 1995/96. After treatment, biosolids from the scheme are applied to a<br />
1000-ha Pinus radiata D. Don forest plantation at Rabbit Isl<strong>and</strong> near Nelson City. A long-term trial was<br />
established in 1997 to monitor the environmental effects of the repeated application of biosolids on the<br />
plantation, <strong>and</strong> to determine sustainable application rates. Since then tree growth <strong>and</strong> nutrition <strong>and</strong> wood<br />
properties have been assessed along with a number of environmental variables, such as <strong>soil</strong> <strong>and</strong> groundwater<br />
quality (Wang et al. 2004; 2006). The objective of this study was to investigate the effects of repeated<br />
applications of biosolids on tree nutrition <strong>and</strong> <strong>soil</strong> chemical properties.<br />
Materials <strong>and</strong> methods<br />
The research trial was established in 1997 in a 6-year-old st<strong>and</strong> of Pinus radiata in the Rabbit Isl<strong>and</strong><br />
plantation. The <strong>soil</strong> consists of coarse coastal dune s<strong>and</strong>s, classified as a s<strong>and</strong>y raw <strong>soil</strong> (Hewitt 1998), which<br />
provides free rooting access to the shallow groundwater 2.0 to 4.2 m below the surface. Three biosolids<br />
treatments were applied in a split-plot, r<strong>and</strong>omised block design with four replicates. The treatments<br />
consisted of a Control (no biosolids), a Low treatment (target application of 300 kg N/ha) <strong>and</strong> a High<br />
treatment (at a target rate of 600 kg N/ha). Each main-plot contained three stocking density treatments<br />
(subplots) at 300, 450 <strong>and</strong> 600 stems/ha. There were 36 subplots in total (4 replicates × 3 biosolids rates × 3<br />
stocking densities), each plot measuring 25 m × 25 m, plus 5 m buffer zones, so that the whole site covered<br />
an area of approximately 4 ha. The biosolids were applied in October 1997 <strong>and</strong> reapplied at the same rates to<br />
the same plots in November 2000, October 2003, <strong>and</strong> October 2006. The biosolids contained high<br />
concentrations of nitrogen (approximately 10% N with about 40% in ammonium form). Concentrations of<br />
contaminants such as pathogens <strong>and</strong> heavy metals in the biosolids were low <strong>and</strong> well below the New Zeal<strong>and</strong><br />
© 2010 19 th World Congress of Soil Science, Soil Solutions for a Changing World<br />
1 – 6 August 2010, Brisbane, Australia. Published on DVD.<br />
123
guidelines for l<strong>and</strong> application (NZWWA 2003), <strong>and</strong> therefore would not limit beneficial use through l<strong>and</strong><br />
application. Details about properties of the biosolids applied <strong>and</strong> method of application were given by Wang<br />
et al. (2004).<br />
To assess <strong>change</strong>s in tree nutrition due to biosolids application, foliage samples (present year's secondary<br />
foliage in top third of crown) have been collected from selected trees in each plot annually in summer since<br />
1998. The impact of biosolids applications on <strong>soil</strong> chemical properties was assessed from samples taken<br />
from the litter layer, top<strong>soil</strong> (0–0.25 m depth) <strong>and</strong> sub<strong>soil</strong> (0.25–0.5 m depth) in August 2007. Samples were<br />
taken from all subplots within each biosolids treatment main-plot <strong>and</strong> bulked, resulting in four replicate<br />
samples per biosolids treatment. The foliage <strong>and</strong> litter were oven-dried (70 o C) <strong>and</strong> ground for chemical<br />
analysis. Soil samples were air-dried <strong>and</strong> ground to pass a 2-mm sieve. Soil pH was measured at a <strong>soil</strong>:water<br />
ratio of 1:2. Total N in <strong>soil</strong>, tree foliage <strong>and</strong> understorey samples, <strong>and</strong> total C in <strong>soil</strong> were determined by dry<br />
combustion using a Leco CNS 2000 machine. Concentrations of <strong>soil</strong> ex<strong>change</strong>able Ca, Mg, K, <strong>and</strong> Na were<br />
measured using the ammonium acetate method (Blakemore et al. 1987). Extractable <strong>soil</strong> P was determined<br />
using the Olsen P method. Acid digestion was used to extract heavy metals in biosolids <strong>and</strong> <strong>soil</strong> samples<br />
(ASTM International 1999). Flame atomic absorption spectrometry was used to determine As, Cd, Cr, Cu,<br />
Pb, Ni, <strong>and</strong> Zn in the acid digestion <strong>and</strong> groundwater samples. Mercury was analysed using cold vapour<br />
atomic absorption spectrometry (APHA 1995). Foliage <strong>and</strong> litter samples were digested with concentrated<br />
HNO3/H2O2, <strong>and</strong> concentration of nutrients <strong>and</strong> heavy metals in the digest were determined using the<br />
inductively coupled plasma optical emission spectrometry (ICP-OES, Perkin Elmer Optima 3000DV).<br />
Analysis of variance (ANOVA) <strong>and</strong> least significant difference (LSD) tests were used to determine the<br />
statistical significance of the biosolids treatment effects on tree nutrition over time <strong>and</strong> <strong>soil</strong> properties using<br />
the SAS/STAT Version [9] GLM procedure.<br />
Results <strong>and</strong> discussion<br />
Effect of biosolids application on tree nutrition<br />
Annual foliage analyses have shown that foliar concentrations of all nutrients except N have remained in the<br />
“satisfactory” range of tree nutrition <strong>and</strong> indicate that none of these nutrients are limiting tree growth (Will<br />
1985). However, they have consistently shown that natural <strong>soil</strong> N supply in the Rabbit Isl<strong>and</strong> P. radiata<br />
forest is low, with foliar N concentration of the Control treatment averaging 1.2% N since monitoring began<br />
(Figure 1), well under the 1.5% N, threshold below which P. radiata may benefit from nitrogen fertiliser<br />
(Will 1985). Both biosolids treatments have produced significant (P < 0.05) elevations in foliar N with the<br />
Low treatment averaging 1.4% N <strong>and</strong> the High treatment 1.5% N.<br />
Foliar N (%)<br />
2.2<br />
2<br />
1.8<br />
1.6<br />
1.4<br />
1.2<br />
High<br />
High<br />
Low<br />
Low<br />
Control<br />
Control<br />
1<br />
6 7 8 9 10 11 12 13 14 15 16<br />
Age (years)<br />
Figure 1. Effect of biosolids application on concentrations of nitrogen in foliage. Arrows indicate time of<br />
biosolids application. Error bars show least significant differences (P = 0.05) <strong>and</strong> can be used to determine the<br />
significance of treatment differences.<br />
Effect of biosolids application on forest litter <strong>and</strong> <strong>soil</strong> chemistry<br />
Analysis of the forest litter layer samples collected in 2007 show that both of the biosolids treatments<br />
significantly (P < 0.05) increased C/N ratios <strong>and</strong> concentrations of total P <strong>and</strong> Mg (Table 1). The High<br />
biosolids treatment significantly (P < 0.05) increased concentrations of total N <strong>and</strong> Fe, whereas the Low<br />
biosolids treatment significantly (P < 0.05) increased concentrations of total Na <strong>and</strong> B in the litter. Litter Mn<br />
concentration in the High biosolids treatment was significantly (P < 0.05) lower than the Control (Table 1).<br />
These <strong>change</strong>s in litter elemental concentration can be attributed to the initial litter chemical composition <strong>and</strong><br />
retention of biosolids-derived elements. For example, significantly lower Mn concentrations in foliage<br />
samples were observed (Wang et al. 2004).<br />
© 2010 19 th World Congress of Soil Science, Soil Solutions for a Changing World<br />
1 – 6 August 2010, Brisbane, Australia. Published on DVD.<br />
124
Table 1. Effect of biosolids application on litter chemical properties (sampled in August 2007)*<br />
Treatment C N P K Ca Mg Na C/N B Mn Fe<br />
% mg/kg<br />
Control 47.0 a 1.02 a 0.055 a 0.079 a 0.36 a 0.17 a 0.029 a 47 a 10 a 445 a 1100 a<br />
Low 44.0 a 1.28 ab 0.069 b 0.097 a 0.41 a 0.19 b 0.043 b 35 b 14 b 375 ab 1665 ab<br />
High 47.9 a 1.47 b 0.071 b 0.079 a 0.40 a 0.19 b 0.038 ab 34 b 11 ab 318 b 2313 b<br />
*Values within a column followed by the same letter do not differ significantly (LSD test, P = 0.05; number of<br />
replications per treatment = 4).<br />
Analysis of <strong>soil</strong> samples show significantly (P < 0.05) increased <strong>soil</strong> organic C <strong>and</strong> available P (Olsen P),<br />
<strong>and</strong> reduced <strong>soil</strong> pH in the top <strong>soil</strong> layer (0−0.25 m) in the High treatment. Biosolids treatments had no<br />
significant effect on concentrations of total <strong>soil</strong> N <strong>and</strong> ex<strong>change</strong>able Mg, K, <strong>and</strong> Na, but significantly<br />
increased <strong>soil</strong> ex<strong>change</strong>able Ca in the Low treatment (Table 2). The significantly (P < 0.05) higher <strong>soil</strong> P<br />
concentration in the 0-0.25 m <strong>and</strong> 0.25−0.5 m layers (Table 2) suggests that the High rate biosolids application<br />
has not only resulted in accumulation in the top<strong>soil</strong> but also caused some P movement down the <strong>soil</strong> profile.<br />
This agrees with findings of Lu <strong>and</strong> O'Connor (2001) who reported that biosolids-derived P may be susceptible<br />
to leaching through s<strong>and</strong>y <strong>soil</strong>s, due to the low <strong>soil</strong> P-sorbing capacity. Biosolids treatments significantly (P<br />
< 0.05) increased the <strong>soil</strong> C/N ratios in the 0.25-0.5 m layer. This was due to the increase of total C with<br />
biosolids treatments, which may be caused by the downward movement of organic C in the <strong>soil</strong> profile.<br />
Analysis of deeper <strong>soil</strong> layers has been proposed to verify the P <strong>and</strong> organic C movement in the <strong>soil</strong> profile.<br />
Table 2. Effect of biosolids application on <strong>soil</strong> chemical properties (sampled in August 2007)*<br />
Depth Treatment pH C N C/N Olsen P K Ca Mg Na<br />
% mg/kg cmolc/kg<br />
Control 5.30 a 0.55 a 0.03 a 18.4 a 29.1 a 0.09 a 0.95 a 1.11 a 0.07 a<br />
0-0.25m Low 5.18 ab 0.74 ab 0.04 a 18.8 a 36.7 a 0.10 a 1.05 b 1.13 a 0.08 a<br />
High 4.93 b 0.89 b 0.05 a 20.3 a 56.3 b 0.11 a 1.03 ab 0.99 a 0.08 a<br />
Control 5.80 a 0.25 a 0.03 a 8.9 a 21.5 a 0.07 a 0.75 a 1.02 a 0.04 a<br />
0.25-0.5m Low 5.70 a 0.26 a 0.03 a 9.4 b 21.5 a 0.07 a 0.75 a 1.06 a 0.07 a<br />
High 5.33 a 0.36 a 0.03 a 11.8 b 32.8 b 0.08 a 0.68 a 0.95 a 0.07 a<br />
*For each depth, values within a column followed by the same letter do not differ significantly (LSD test, P = 0.05;<br />
number of replications per treatment = 4).<br />
Biosolids applications significantly (P < 0.05) increased total concentrations of all eight heavy metals<br />
measured in the litter layer, except for Pb <strong>and</strong> Ni in the Low treatment (Table 3), which implies that a large<br />
proportion of the biosolids-derived metals are strongly retained by the litter layer. High metal retention<br />
capacity by forest litter was also reported by McLaren et al. (2007) who found that concentration of heavy<br />
metals in the litter layer was greatly elevated even a few years after biosolids were applied.<br />
Table 3. Effect of biosolids application on concentrations of heavy metals in litter <strong>and</strong> <strong>soil</strong> (sampled in August<br />
2007)*.<br />
Depth Treatment As Cd Cr Cu Pb Hg Ni Zn<br />
mg/kg<br />
Control 0.6 a 0.02 a 2.5 a 4.5 a 3.4 a 0.05 a 4.0 a 19.0 a<br />
Litter Low 0.8 b 0.09 b 5.2 b 13.3 b 4.8 ab 0.08 b 5.5 ab 37.5 b<br />
High 1.2 b 0.22 c 10.5 c 61.3 c 8.8 b 0.16 c 11.9 b 69.8 c<br />
Control 2.6 a
increased concentrations of <strong>soil</strong> Pb <strong>and</strong> Zn in the 0–0.25 m layer, <strong>and</strong> significantly increased <strong>soil</strong> Cu<br />
concentrations in both 0–0.25 m <strong>and</strong> 0.25–0.5 m layers (Table 3). The increased Cu concentration in <strong>soil</strong>s<br />
receiving biosolids applications (Table 3) did not result in increased P. radiata foliage Cu concentration<br />
(data not shown), indicating a low bioavailability of the biosolids-derived Cu. The relatively higher<br />
concentrations of Cr <strong>and</strong> Ni in the 0.25-0.5 m layer than in the 0-0.25 m layer were due to the natural <strong>soil</strong><br />
conditions, <strong>and</strong> were not affected by the biosolids applications. Generally, heavy metal concentrations (Table<br />
3), with or without biosolids application, were low <strong>and</strong> well below the <strong>soil</strong> contaminant limits defined by the<br />
guidelines for the safe application of biosolids to l<strong>and</strong> in New Zeal<strong>and</strong> (NZWWA 2003). Overall, repeated<br />
application of biosolids improved <strong>soil</strong> fertility <strong>and</strong> appeared to have no significant detrimental effect on <strong>soil</strong><br />
quality at Rabbit Isl<strong>and</strong>.<br />
Conclusions<br />
Repeated application of biosolids to a P. radiata plantation on a low fertility s<strong>and</strong>y <strong>soil</strong> on Rabbit Isl<strong>and</strong> has<br />
significantly enhanced N supply to meet tree growth dem<strong>and</strong>s. The High biosolids treatment significantly<br />
increased concentrations of <strong>soil</strong> available P <strong>and</strong> organic C, but it resulted in a reduced <strong>soil</strong> pH. Although the<br />
High biosolids treatment increased the concentration of total <strong>soil</strong> Cu, Pb <strong>and</strong> Zn, overall concentrations of<br />
these heavy metals are considered to be very low for a <strong>soil</strong>. The Low biosolids treatment had no significant<br />
effect on <strong>soil</strong> chemistry. However, the biosolids-derived heavy metals are strongly retained by the litter<br />
layer. The long term effects of these litter-retained metals will be further assessed in future studies.<br />
Acknowledgements<br />
The authors wish to thank PF Olsen Limited, Tasman District Council, the Nelson Regional Sewerage<br />
Business Unit, NZ Foundation for Research Science <strong>and</strong> Technology <strong>and</strong> Envirolink for funding or in-kind<br />
support, J.D. Graham for foliage <strong>and</strong> <strong>soil</strong> sampling, <strong>and</strong> all those who have contributed to the project over<br />
the years.<br />
References<br />
APHA (1995) ‘St<strong>and</strong>ard Methods for the Examination of Water <strong>and</strong> Wastewater, 19 th Edition’. (American<br />
Public Health Association: Washington DC).<br />
ASTM International (1999) ‘ASTM St<strong>and</strong>ard D 3974-81. St<strong>and</strong>ard practices for extraction of trace elements<br />
from sediments’. (American Society for Testing <strong>and</strong> Materials: Philadelphia).<br />
Blakemore LC, Searle PL, Daly BK (1987) ‘Methods for chemical analysis of <strong>soil</strong>s’. New Zeal<strong>and</strong> Soil<br />
Bureau Scientific Report 80. (DSIR: Lower Hutt).<br />
Hewitt AE (1998) ‘New Zeal<strong>and</strong> <strong>soil</strong> classification’. 2 nd edition. L<strong>and</strong>care Research Science Series No 1,<br />
(Manaaki Whenua Press: Lincoln).<br />
Kimberley MO, Wang H, Wilks PJ, Fisher CR, Magesan GN (2004) Economic analysis of growth response<br />
from a pine plantation forest applied with biosolids. <strong>Forest</strong> Ecology <strong>and</strong> Management 189, 345-351.<br />
Lu P, O'Connor GA (2001) Biosolids effects on P retention <strong>and</strong> release in some s<strong>and</strong>y Florida <strong>soil</strong>s. Journal<br />
of Environmental Quality 30, 1059-1063.<br />
Magesan GN, Wang H (2003) Application of municipal <strong>and</strong> industrial residuals in New Zeal<strong>and</strong> forests: an<br />
overview. Australian Journal of Soil Research 41, 557-569.<br />
McLaren, RG, Clucas LM, Speir,TM, Schaik, AP (2007) Distribution <strong>and</strong> movement of nutrients <strong>and</strong> metals<br />
in a Pinus radiata forest <strong>soil</strong> following application of biosolids. Environmental Pollution 147, 32-40.<br />
NZWWA (2003) ‘Guidelines for the safe application of biosolids to l<strong>and</strong> in New Zeal<strong>and</strong>’. (New Zeal<strong>and</strong><br />
Water <strong>and</strong> Wastes Association: Wellington).<br />
Wang H, Kimberley MO, Magesan GN, McKinley RB, Lee JR, Lavery JM, Hodgkins PDF, Payn TW, Wilks<br />
PJ, Fisher CR, McConchie DL (2006) Mid-rotation effects of biosolids application on tree growth <strong>and</strong><br />
wood properties in a Pinus radiata plantation. Canadian Journal of <strong>Forest</strong> Research 36, 1921-1930.<br />
Wang H, Magesan GN, Kimberley MO, Payn TW, Wilks PJ, Fisher CR (2004) Environmental <strong>and</strong><br />
nutritional responses of a Pinus radiata plantation to biosolids application. Plant <strong>and</strong> Soil 267, 255-262.<br />
Will GM (1985) ‘Nutrient deficiencies <strong>and</strong> fertiliser use in New Zeal<strong>and</strong> exotic forests’. FRI Bulletin No. 97.<br />
(New Zeal<strong>and</strong> <strong>Forest</strong> Service: Rotorua).<br />
© 2010 19 th World Congress of Soil Science, Soil Solutions for a Changing World<br />
1 – 6 August 2010, Brisbane, Australia. Published on DVD.<br />
126
Using the multivariate data set of SOM quality to assess the managementinduced<br />
<strong>change</strong>s in forest <strong>soil</strong>s<br />
Yan He A , Jiachun Shi A , Zhihong Xu B , Chengrong Chen B <strong>and</strong> Jianming Xu A<br />
A Zhejiang Provincial Key Laboratory of Subtropical Soil <strong>and</strong> Plant Nutrition, College of Environmental <strong>and</strong> Natural Resource<br />
Sciences, Zhejiang University, Hangzhou 310029, China, Email jcshi@zju.edu.cn <strong>and</strong> jmxu@zju.edu.cn<br />
B Centre for <strong>Forest</strong>ry <strong>and</strong> Horticultural Research, Griffith University, Nathan, Brisbane, Queenl<strong>and</strong> 4111, Australia, Email<br />
zhihong.xu@griffith.edu.au<br />
Abstract<br />
Successful <strong>soil</strong> organic matter (SOM) quality assessment is needed to improve our ability to manage forest<br />
<strong>soil</strong>s sustainably. Our objective was to use a multivariate data set to determine whether the l<strong>and</strong>-use<br />
conversion from native forest (NF) to hoop pine plantation <strong>and</strong> the following rotation <strong>and</strong> site preparation<br />
practices had altered SOM quality at three adjacent sites of NF, first (1R) <strong>and</strong> second rotation (2R, including<br />
tree planting row (2R-T) <strong>and</strong> windrow of harvest residues (2R-W)) of hoop pine plantations in southeast<br />
Queensl<strong>and</strong>, Australia. Knowledge of PCA based on the refined set of 41 SOM quantitative <strong>and</strong> qualitative<br />
parameters identified that principal component 1 (PC1), which explained 55.7% of the total variance, was<br />
most responsible for the management induced <strong>change</strong>s in <strong>soil</strong> <strong>processes</strong>. This was reflected by the dynamics<br />
of SOM regarding the aspects of total stock, <strong>soil</strong> basal <strong>and</strong> substrate induced respirations, gross <strong>and</strong> net N<br />
mineralization <strong>and</strong> nitrification, <strong>and</strong> microbial biomass, microbial diversity of C utilization patterns. Further,<br />
the macroaggregates (F250-2000µm) <strong>and</strong> the C/N ratio of acid extracts of SOM physical fractions, which<br />
represented the most informative <strong>and</strong> unique variables loading on PC1, might be the most promising physical<br />
<strong>and</strong> chemical measures for SOM quality assessment of l<strong>and</strong> use <strong>and</strong> management impacts in subtropical<br />
Australian forests.<br />
Key Words<br />
SOM quality assessment, l<strong>and</strong> use <strong>and</strong> management impacts, physical fractions, CPMAS 13 C NMR,<br />
sequential hot water extraction <strong>and</strong> acid hydrolysis, forest.<br />
Introduction<br />
Three well-studied adjacent NF, 1R <strong>and</strong> 2R hoop pine plantation forest sites that exhibited different<br />
responses in whole <strong>soil</strong> chemical <strong>and</strong> biological <strong>processes</strong> to different forest types, rotation practices <strong>and</strong><br />
residue management were selected as the study area. Our objectives were (1) to investigate the complex<br />
interactions between forest management practices <strong>and</strong> SOM quality, <strong>and</strong> (2) to screen <strong>and</strong> explore the most<br />
informative <strong>and</strong> unique SOM quality parameters which underpin the <strong>change</strong>s of <strong>soil</strong> chemical <strong>and</strong> biological<br />
<strong>processes</strong> induced by forest management. We hypothesized that the chemical analyses on physical <strong>soil</strong><br />
separates could reveal more meaningful differences in <strong>soil</strong> C <strong>and</strong> N physical protection <strong>and</strong> biochemical<br />
recalcitrance in response to l<strong>and</strong> use <strong>and</strong> management <strong>change</strong>s. To test these hypotheses, we carried out a<br />
combination of physical (wet-sieving <strong>and</strong> density) fractionation <strong>and</strong> structural chemical analyses (CPMAS<br />
13 C NMR spectroscopy <strong>and</strong> sequential hot water extraction <strong>and</strong> acid hydrolysis) of the fractions obtained.<br />
Methods<br />
Site description<br />
The NF <strong>and</strong> hoop pine plantation study sites were located in Yarraman State <strong>Forest</strong>, southeast Queensl<strong>and</strong>,<br />
Australia. The 1R plantation was converted from NF in 1952. The 2R hoop pine was planted in 2000 after<br />
the clearcut harvest of part of the 1R plantation in 1999. Post harvest residues from the 1R plantation were<br />
formed into windrows approximately 6 m apart, <strong>and</strong> areas between windrows were then used as tree-planting<br />
rows for the 2R plantation. Hence, the three NF, 1R <strong>and</strong> 2R hoop pine plantation areas are adjacent to each<br />
other, <strong>and</strong> the 2R plantation area was divided into the following two treatments based on the residue<br />
management practices, (1) tree planting row (2R-T) <strong>and</strong> (2) windrow of harvest residues (2R-W).<br />
Identification of the quantitative <strong>and</strong> qualitative parameters of SOM fractions<br />
Cross-polarization magic angle spinning 13 C nuclear magnetic resonance (CPMAS 13 C NMR) spectroscopy<br />
<strong>and</strong> sequential hot water <strong>and</strong> acid hydrolysis were conducted on SOM fractions separated by wet-sieving <strong>and</strong><br />
density fractionation procedures to characterize SOM quantitative <strong>and</strong> qualitative relevant parameters, including<br />
carbon (C) functional groups, C <strong>and</strong> nitrogen (N) contents, C/N ratios, <strong>and</strong> C <strong>and</strong> N recalcitrant indices.<br />
© 2010 19 th World Congress of Soil Science, Soil Solutions for a Changing World<br />
1 – 6 August 2010, Brisbane, Australia. Published on DVD.<br />
127
Results<br />
Site-based differences in SOM quality: ANOVA <strong>and</strong> PCA results for fraction C pool, N pool <strong>and</strong> C/N ratio<br />
parameters<br />
The minimum data set of overall SOM quality (constituted by 41 variables that retained from the ANOVA<br />
<strong>and</strong> PCA results of individual categories, data not shown) was assessed to screen for the most informative<br />
<strong>and</strong> unique variables that reflected the SOM quality <strong>change</strong>s induced by l<strong>and</strong> use <strong>and</strong> management among<br />
the tested forest sites. In general, there were three significant PCs that together explained more than 81% of<br />
the total variance. PC1, which accounted for 55.7% of the total variance, contrasted F250-2000µm that showed<br />
relatively high loadings from other SOM fractions. The 27 parameters had significant loadings on PC1,<br />
among which the highest negatively weighted parameters in six physical fractions were absolutely achieved<br />
by the C/N ratio of acid hydrolysable extracts (C/NAC) (Table 1). PC2, which explained 16.7% of the total<br />
variance, include 13 positively <strong>and</strong> five negatively significant weighted parameters that reflected chiefly the<br />
C <strong>and</strong> N content of acid <strong>and</strong> hot water extracts (CAC <strong>and</strong> NAC, <strong>and</strong> CHW <strong>and</strong> NHW) associated with F53-250µm <strong>and</strong><br />
F 1 <strong>and</strong> that explain > 5% of the total variance were retained.<br />
Principal component Principal component<br />
PC1 PC2 PC3 PC1 PC2 PC3<br />
Eigenvalue 22.81 6.85 3.62 Eigenvalue 22.81 6.85 3.62<br />
Proportion (%) 55.65 16.71 8.82 Proportion (%) 55.65 16.71 8.82<br />
Rotated scores of three<br />
retained eigenvectors B<br />
© 2010 19 th World Congress of Soil Science, Soil Solutions for a Changing World<br />
1 – 6 August 2010, Brisbane, Australia. Published on DVD.<br />
Rotated scores of three<br />
retained eigenvectors B<br />
F250-2000µm A F
categories, indicating the status of C pool, N pool, C transformation, N transformation, <strong>and</strong> microbial<br />
quantity <strong>and</strong> diversity, respectively) that were obtained in our previous studies (data now shown). The results<br />
showed that of the three retained PCs, only the scores of PC1 related significantly to all 22 referred<br />
parameters (Figure 1).<br />
C Pool Parameters<br />
C Transformation Parameters<br />
N Transformation Parameters<br />
90<br />
60<br />
4<br />
2<br />
-2 -1 0 1 2 3 -2 -1 0 1 2 3 -2 -1 0 1 2 3 -2 -1 0 1 2 3<br />
120<br />
1.2<br />
1.2<br />
100<br />
Rbas (R=0.64**)<br />
PPSOC (R=0.86**)<br />
1.0<br />
SIRL-Malic acid (R=0.77**) SIRL-Lysine (R=0.72**) SIROxalic acid (R=0.67**)<br />
1.0<br />
80<br />
60<br />
40<br />
20<br />
1<br />
0<br />
0.0<br />
0.0<br />
-2 -1 0 1 2 3 -2 -1 0 1 2 3 -2 -1 0 1 2 3 -2 -1 0 1 2 3<br />
20<br />
15<br />
10<br />
5<br />
-2 -1 0 1 2 3<br />
C whole (R=0.96**)<br />
SOC hw (R=0.94**)<br />
SOC hKCl (R=0.92**)<br />
SOC K2 SO 4 (R=0.62**)<br />
0<br />
0<br />
-2 -1 0 1 2 3<br />
PC1 Scores<br />
-2 -1 0 1 2 3-2<br />
-1 0 1 2 3<br />
GNitri (R=0.62**)<br />
GMineral (R=0.50*)<br />
0<br />
0<br />
-2 -1 0 1 2 3-2<br />
-1 0 1 2 3<br />
PC1 Scores<br />
PC1 Scores<br />
.8<br />
.6<br />
.4<br />
.2<br />
NNitri (R=0.74**)<br />
NMineral (R=0.84**)<br />
PPSON (R=0.89**)<br />
PC1 Scores<br />
PC1 Scores<br />
© 2010 19 th World Congress of Soil Science, Soil Solutions for a Changing World<br />
1 – 6 August 2010, Brisbane, Australia. Published on DVD.<br />
90<br />
60<br />
4<br />
2<br />
20<br />
15<br />
10<br />
5<br />
-2 -1 0 1 2 3<br />
10.00<br />
Nwhole (R=0.98**)<br />
SONhw (R=0.96**)<br />
10.00<br />
8.00<br />
SONhKCl (R=0.90**)<br />
SONK2SO (R=0.52*)<br />
4<br />
8.00<br />
N Pool Parameters<br />
Microbial Quantity <strong>and</strong> Diversity Parameters<br />
6.00<br />
4.00<br />
.40<br />
.20<br />
0.00<br />
PC1 Scores PC1 Scores<br />
-2 -1 0 1 2 3-2<br />
-1 0 1 2 3<br />
4<br />
4<br />
3<br />
2<br />
1<br />
-2 -1 0 1 2 3<br />
MBC (R=0.93**)<br />
MBN (R=0.80**)<br />
0<br />
0<br />
-2 -1 0 1 2 3-2<br />
-1 0 1 2 3<br />
PC1 Scores<br />
PC1 Scores<br />
AWCD (R=0.48*)<br />
SDI (R=0.47*)<br />
PC1 Scores<br />
Figure 1. Correlations between the PC1 scores <strong>and</strong> the chemical <strong>and</strong> biological properties of whole <strong>soil</strong> (n = 20).<br />
Cwhole/Nwhole, total C <strong>and</strong> N of the whole <strong>soil</strong>, mg/g; SOChw/SONhw, 70 o C hot water extractable soluble organic C<br />
<strong>and</strong> N, mg/kg; SOChKCl/SONhKCl, hot 2M KCl extractable soluble organic C <strong>and</strong> N, mg/kg; SOCK2SO4/SONK2SO4,<br />
0.5 M K2SO4 extractable soluble organic C <strong>and</strong> N, mg/kg; Rbas, <strong>soil</strong> basal respiration, µg CO2-C/g/hr;<br />
PPSOC/PPSON, potential production of soluble organic C <strong>and</strong> N calculated based on a 7-day anaerobic<br />
incubation, mg N/kg; SIR, <strong>soil</strong> MicroResp TM C source substrate induced respiration (for individual C<br />
substrates), µg CO2-C/g/hr; GNitri, gross N nitrification, mg N/kg/d; GMineral, gross N mineralization, mg<br />
N/kg/d; NNitri, net N nitrification, mg N/kg/d; NMineral, net N mineralization, mg N/kg/d; MBC/MBN, <strong>soil</strong><br />
microbial biomass C <strong>and</strong> N, mg/kg; AWCD, average well colour development of Biolog TM GN plate after 96 h<br />
incubation; SDI, Shannon’s diversity index. ** <strong>and</strong> * indicate the correlations are significant at the 0.01 <strong>and</strong> 0.05<br />
probability level, respectively.<br />
6.00<br />
4.00<br />
.40<br />
.20<br />
0.00<br />
.8<br />
.6<br />
.4<br />
.2<br />
3<br />
2<br />
1<br />
129
Discussion<br />
On the PCA plots, separate clusterings were found for NF, 1R, 2R-T <strong>and</strong> 2R-W respectively. The<br />
comparison of the PC scores between NF <strong>and</strong> 1R, 1R <strong>and</strong> 2R-T, <strong>and</strong> 2R-T <strong>and</strong> 2R-W identified that only<br />
PC1, which explained three <strong>and</strong> seven times the variance explained by PC2 <strong>and</strong> PC3, was capable of<br />
accounting for all the complex differences among the tested forest sites simultaneously. And the optimum<br />
competence of c<strong>and</strong>idate PC1 for best indicating the <strong>change</strong>s of SOM quality resultant from the l<strong>and</strong> uses<br />
<strong>and</strong> management practices were further confirmed by its good relevance with all the whole <strong>soil</strong> chemical <strong>and</strong><br />
biological <strong>processes</strong> (Figure 1). Therefore, all the quantitative <strong>and</strong> qualitative SOM fraction parameters with<br />
significant loadings on PC1 were the most informative measures that would be responsible for the complex<br />
impacts of l<strong>and</strong> use <strong>and</strong> management on SOM quality in the tested forest ecosystem.<br />
Digging the information suggested by Table 1 more deeply, we can find that most of the F250-2000µm associated<br />
C <strong>and</strong> N aspects were exclusively reflected by the PC1, with the absolute higher loading scores than other<br />
SOM fractions. Thus the F250-2000µm might be excavated as the most unique SOM physical indicator that PC1<br />
represented for the illustration of l<strong>and</strong> use <strong>and</strong> management induced <strong>change</strong>s. This possibly resulted mainly<br />
from the special structures of macroaggregates that have been tested dependent on live binding agents,<br />
generally do not exhibit long-term stability, <strong>and</strong> are sensitive to <strong>change</strong>s in l<strong>and</strong> use <strong>and</strong> management<br />
practices (Six et al. 2004). In contrast, microaggregates, mineral-associated organic matter <strong>and</strong> organic<br />
matter entrapped at sites inaccessible to microbial attack or physically protected within heavy fractions<br />
belong to more stable organic matter pools with a turnover time from decades to centuries <strong>and</strong> thus resist the<br />
impact from outside (Helfrich et al. 2006).<br />
Additionally, if taking a further consideration on the loading scores of PC1, we can also conclude that the<br />
C/N ratio of acid hydrolysable SOM might be another most promising SOM chemical indicator that PC1<br />
represented for the illustration of l<strong>and</strong> use <strong>and</strong> management induced <strong>change</strong>s, since the C/NAC raitos of all the<br />
test physical fractions were always highly weighted variables loading on PC1 (Table 1). Possible<br />
explaination might be that acid hydrolysis by 6 M HCl is the simplest <strong>and</strong> most reproducible method to<br />
differentiate the labile from the recalcitrant SOM fractions, as evidenced in various relevant studies (Refs not<br />
shown). Therefore, the decomposition degree (as indicated by the C/N ratio) of acid extracts conducted on<br />
SOM fractions with different physical protection might be another promising chemial measure for SOM<br />
quality assessment of management impacts in the tested forest ecosystem.<br />
Conclusion<br />
Results from PCA based on 41 retained minimum data set <strong>and</strong> excavation of their dependence on 22 <strong>soil</strong><br />
chemical <strong>and</strong> biological parameters that reflected whole <strong>soil</strong> <strong>processes</strong> revealed that the PC1 was most<br />
responsible for the complex <strong>change</strong>s induced by the l<strong>and</strong> uses <strong>and</strong> management practices, on which the most<br />
informative <strong>and</strong> unique loadings, the macroaggregates (F250-2000µm) <strong>and</strong> the C/N ratio of acid extracts of SOM<br />
physical fractions might be the most promising physical <strong>and</strong> chemical measures for SOM quality assessment<br />
of l<strong>and</strong> use <strong>and</strong> management impacts in subtropical Australian forests.<br />
Acknowledgments<br />
We acknowledge the funding support from Australian Research Council. The joint support funding from<br />
National Natural Science Foundation of China (40971136 <strong>and</strong> 20707020), <strong>and</strong> the Science <strong>and</strong> Technology<br />
Projects of Zhejiang Province (2009C33119) are also acknowledged.<br />
References<br />
Six J, Bossuyt H, Degryze S, Denef K (2004) A history of research on the link between (micro) aggregates,<br />
<strong>soil</strong> biota, <strong>and</strong> <strong>soil</strong> organic matter dynamics. Soil <strong>and</strong> Tillage Research 79, 7-31.<br />
Helfrich M, Ludwig B, Buurman P, Flessa H (2006) Effect of l<strong>and</strong> use on the composition of <strong>soil</strong> organic<br />
matter in density <strong>and</strong> aggregate fractions as revealed by solid-state 13 C NMR spectroscopy. Geoderma<br />
136, 331-341.<br />
© 2010 19 th World Congress of Soil Science, Soil Solutions for a Changing World<br />
1 – 6 August 2010, Brisbane, Australia. Published on DVD.<br />
130
Effects of nitrogen addition on fluxes <strong>and</strong> concentrations of dissolved organic<br />
matter <strong>and</strong> inorganic nitrogen under a temperate old-growth forest in northeast<br />
China<br />
Xu Xingkai A* , Luo Xianbao A,B , Han Lin A,B , Cao Fuqiang A <strong>and</strong> Han Shijie C<br />
A State Key Laboratory of Atmospheric Boundary Layer Physics <strong>and</strong> Atmospheric Chemistry, Institute of Atmospheric Physics,<br />
Chinese Academy of Sciences, Beijing 100029, China<br />
B Graduate School of Chinese Academy of Sciences, Beijing 100049, China<br />
C Institute of Applied Ecology, Chinese Academy of Sciences, Shenyang 110016, China<br />
* Correspondence: xingkai_xu@yahoo.com.cn; fax 0086 10 62041393<br />
Abstract<br />
Soil solutions at 15 cm <strong>and</strong> 60 cm under a Korean pine <strong>and</strong> broadleaf mixed forest (>200 years old) at<br />
Changbai mountain, northeast China, were sampled using porous ceramic cups from July 2006 to October<br />
2008, to study the effects of nitrogen (N) addition on fluxes <strong>and</strong> concentrations of dissolved organic matter<br />
<strong>and</strong> inorganic N. The <strong>soil</strong> net N mineralization <strong>and</strong> wet atmospheric depositions of N <strong>and</strong> dissolved organic<br />
carbon (C) were also measured. The addition of N sources such as (NH4)2SO4, NH4Cl <strong>and</strong> KNO3 at rates of<br />
2.25 <strong>and</strong> 4.5 g N/m 2 each year tended to increase concentrations <strong>and</strong> fluxes of inorganic N <strong>and</strong> dissolved<br />
organic N in <strong>soil</strong> solutions at 15 cm <strong>and</strong> 60 cm depths <strong>and</strong> <strong>soil</strong> net N mineralization, <strong>and</strong> it reduced leaching<br />
losses of <strong>soil</strong> dissolved organic C. The concentration ratios of dissolved organic C to dissolved organic N <strong>and</strong><br />
special UV absorbance values in the <strong>soil</strong> solutions at both depths were smaller under the N-fertilized forest<br />
plots than under non-fertilized plots. Soil net N mineralization under the N-fertilized forest plots can<br />
contribute to the leaching losses of inorganic N from the <strong>soil</strong>. Our observations indicate that N inputs to<br />
temperate forest floors can affect the status of N <strong>and</strong> C <strong>processes</strong> in underlying forest <strong>soil</strong>s.<br />
Key words<br />
Dissolved organic carbon <strong>and</strong> nitrogen, inorganic nitrogen leaching, forest <strong>soil</strong>, nitrogen mineralization<br />
Introduction<br />
Soil solution chemistry can be considered a sensitive indicator of biogeochemical <strong>processes</strong> under forest<br />
st<strong>and</strong>s, responding quickly to disturbances or stresses like nitrogen input (e.g. McDowell et al. 2004;<br />
Pregitzer et al. 2004; Michel et al. 2006). Hence, it is important to study the dynamics of fluxes <strong>and</strong><br />
concentrations of dissolved organic matter <strong>and</strong> inorganic nitrogen (N) in <strong>soil</strong> solutions at the various depths<br />
under different forest st<strong>and</strong>s.<br />
The addition of N sources to temperate forest floors can usually increase N leaching as DON <strong>and</strong><br />
inorganic N from forest top<strong>soil</strong>s (e.g. McDowell et al. 1998; Michalzik et al. 2001; Pregitzer et al. 2004).<br />
The N inputs from forest top<strong>soil</strong>s may increase the activities of <strong>soil</strong> microorganisms <strong>and</strong> the<br />
mineralization of carbon (C) in underlying <strong>soil</strong>s, thus releasing CO2 into the <strong>soil</strong> solution (Xu et al.<br />
2009). Hence, the fluxes <strong>and</strong> concentrations of dissolved organic matter (DOM) <strong>and</strong> inorganic N in <strong>soil</strong><br />
solutions at the various depths would promote our underst<strong>and</strong>ing of C <strong>and</strong> N <strong>processes</strong> in the<br />
underground canopy under N-fertilized forest st<strong>and</strong>s.<br />
At present, there were many contrasting results regarding N effects on DON <strong>and</strong> DOC dynamics in<br />
forest <strong>soil</strong> solution in field <strong>and</strong> laboratory studies (McDowell et al. 1998, 2004; Magill <strong>and</strong> Aber, 2000;<br />
Pregitzer et al. 2004; Michel et al. 2006). Furthermore, these earlier studies mainly focused on the<br />
dynamics of DOC, DON <strong>and</strong> inorganic N concentrations in forest <strong>soil</strong> solutions sampled using zerotension<br />
lysimeters rather than using suction cups. There are rather limited reports about the concentrations<br />
<strong>and</strong> fluxes of dissolved organic matter <strong>and</strong> inorganic N in <strong>soil</strong> solutions at the various depths under Nfertilized<br />
forest st<strong>and</strong>s, especially in northeast Asia.<br />
In this study, <strong>soil</strong> solutions at 15 cm <strong>and</strong> 60 cm under a Korean pine <strong>and</strong> broadleaf mixed forest (>200 years<br />
old) at Changbai mountain, northeast China, was sampled using porous ceramic cups from July 2006 to<br />
October 2008, to study the effects of N addition on the fluxes <strong>and</strong> concentrations of DOM <strong>and</strong> inorganic N.<br />
The <strong>soil</strong> net N mineralization <strong>and</strong> wet atmospheric depositions of N <strong>and</strong> dissolved organic C were also<br />
measured. The objectives of this work were to 1) study the effects of N addition on the fluxes <strong>and</strong><br />
concentrations of DOM <strong>and</strong> inorganic N in forest <strong>soil</strong> solution; <strong>and</strong> 2) to assess the contribution of <strong>soil</strong> net N<br />
mineralization <strong>and</strong> wet atmospheric C <strong>and</strong> N depositions to these fluxes. The results would improve our<br />
underst<strong>and</strong>ing of N <strong>and</strong> C <strong>processes</strong> in underlying forest <strong>soil</strong>s due to the increase in atmospheric N inputs.<br />
© 2010 19 th World Congress of Soil Science, Soil Solutions for a Changing World<br />
1 – 6 August 2010, Brisbane, Australia. Published on DVD.<br />
131
Materials <strong>and</strong> methods<br />
<strong>Forest</strong> st<strong>and</strong> site <strong>and</strong> <strong>soil</strong> properties<br />
Field experiment was located under a Korean pine <strong>and</strong> broadleaf mixed forest (Pinus koraiensis mainly<br />
mixed with hardwood trees such as Tilia amurensis, Fraxinus m<strong>and</strong>sburica <strong>and</strong> Quercus mongolica, >200<br />
years old, altitude 738 m above sea level) nearby the National Research Station of Changbai Mountain<br />
<strong>Forest</strong>ry Ecology, northeast China (128°6′E, 42°24′N). The area around the mountain is a temperate,<br />
continental climate, with a long-term cold winter <strong>and</strong> warm summer. The annual mean temperature is<br />
approximately 4.1 o C, <strong>and</strong> precipitation averages approximately 855 mm at the bottom of the mountain, with<br />
more than 80% of rainfall from May to August. The dark brown forest <strong>soil</strong> belongs to Andosols (Food <strong>and</strong><br />
Agriculture Organization <strong>soil</strong> classification), <strong>and</strong> the depth of litters <strong>and</strong> A-horizons is approximately 3-5 cm<br />
<strong>and</strong> 10 cm, respectively. The main properties of the <strong>soil</strong>s at the various depths <strong>and</strong> groundwater table levels<br />
were reported by Xu et al. (2007, 2009).<br />
Effects of N addition on <strong>soil</strong> solution chemistry under forest st<strong>and</strong><br />
Twenty-eight individual plots with 3 m x 3 m each were selected on the flatness under the mixed forest st<strong>and</strong>.<br />
Aqueous solutions of N sources such as (NH4)2SO4, NH4Cl <strong>and</strong> KNO3 were respectively sprayed on the<br />
ground within four individual plots in equal monthly doses at rates of 2.25 <strong>and</strong> 4.5 g per m 2 each year, during<br />
the growing season from June to October in 2006-2008, corresponding with 5.0 mm rainfall each; tap water<br />
was added only to the control. The N addition experiments at high <strong>and</strong> low doses started from July 2006 <strong>and</strong><br />
June 2007, respectively. According to the depth of A-horizons <strong>and</strong> the distribution of tree roots in underlying<br />
<strong>soil</strong>, two sets of porous ceramic suction cups (3.1 cm in diameter <strong>and</strong> 7 cm in height) were installed at 15<br />
cm <strong>and</strong> 60 cm depths, respectively, to collect <strong>soil</strong> solutions of organic layers <strong>and</strong> beyond root zones<br />
(V<strong>and</strong>enbruwane et al. 2008). To eliminate the disturbance of <strong>soil</strong>, <strong>soil</strong> auger with a diameter of 3.3 cm was<br />
used to establish the holes down to 15 cm <strong>and</strong> 60 cm depths, respectively, <strong>and</strong> the suction cups connected to<br />
PVC tubes were fixed closely inside the holes. The pressure inside each tube within a week at water-filled<br />
pore space more than 70% or within 24 hours after heavy rainfall was brought to approximately -70 kPa by a<br />
portable vacuum/pressure pump (Mityvac4010, Missouri, USA). Over the years from July 2006 to October<br />
2008, <strong>soil</strong> solutions were sampled via the stopcock attached to each tube to avoid degassing, using 100-ml<br />
plastic syringes equipped with a stopcock, <strong>and</strong> the volume of <strong>soil</strong> solution was measured simultaneously.<br />
Considering initial effects of installing the suction cups, the early two collections were discarded. These<br />
samples were rapidly transported to the laboratory <strong>and</strong> were frozen prior to the analysis of dissolved organic<br />
C, total N, NH4 + -N <strong>and</strong> NO3 - -N concentrations.<br />
Measurement of wet atmospheric C <strong>and</strong> N depositions <strong>and</strong> <strong>soil</strong> net N mineralization<br />
Monthly wet atmospheric C <strong>and</strong> N depositions under such forest st<strong>and</strong> were sampled at an irregular interval<br />
dependent on intensity of precipitation using self-made rainfall collections during the whole experimental<br />
period. Dynamics of net N mineralization fluxes of the <strong>soil</strong> at 15 cm depth under all the experimental plots<br />
were measured in 2006-2008 using in-situ resin-core incubation method (Han et al. 2009).<br />
Measurement of concentrations of dissolved organic C, total N, NH4 + -N <strong>and</strong> NO3 - -N<br />
Concentrations of DOC <strong>and</strong> total N in <strong>soil</strong> solutions were measured using a TOC/TN-analyzer (Shimadzu<br />
TOC-VCSH/TN, Kyoto, Japan). Both NH4 + -N <strong>and</strong> NO3 - -N concentrations of solutions were measured<br />
colorimetrically via the nitroprusside <strong>and</strong> hydrazine-reduction methods, respectively (Kim, 1995).<br />
Concentrations of dissolved organic N (DON) were calculated as the differences between total N <strong>and</strong><br />
mineral N (NH4 + -N <strong>and</strong> NO3 - -N) concentrations of solutions.<br />
Calculation <strong>and</strong> statistical analysis<br />
Wet atmospheric C <strong>and</strong> N depositions, <strong>and</strong> fluxes of dissolved organic matter <strong>and</strong> inorganic N in the <strong>soil</strong><br />
solution were calculated via multiplying corresponding volume mean concentrations of solution C <strong>and</strong> N<br />
forms by amount of water flux. Means <strong>and</strong> st<strong>and</strong>ard errors of <strong>soil</strong> solution chemistry for each sampling date<br />
were calculated. Correlation coefficients between the tested properties of <strong>soil</strong> solutions at 15 cm <strong>and</strong> 60 cm<br />
depths were calculated using SPSS software for Windows (version 13.0). The multivariate tests <strong>and</strong> pairedsample<br />
T tests were performed using SPSS software for Windows to compare the differences in<br />
concentrations <strong>and</strong> fluxes of DOC, DON, NH4 + <strong>and</strong> NO3 - in <strong>soil</strong> solutions between treatment, sampling date<br />
<strong>and</strong> <strong>soil</strong> depth.<br />
© 2010 19 th World Congress of Soil Science, Soil Solutions for a Changing World<br />
1 – 6 August 2010, Brisbane, Australia. Published on DVD.<br />
132
Results <strong>and</strong> discussion<br />
Effect of N addition on concentrations of DOC, DON <strong>and</strong> inorganic N in <strong>soil</strong> solution<br />
NH4 + -N concentrations in the <strong>soil</strong> solutions at 15 cm <strong>and</strong> 60 cm depths under N-fertilized <strong>and</strong> nonfertilized<br />
plots were mostly below 0.2 µg N/ml, which were much smaller than NO3 - -N concentrations in<br />
<strong>soil</strong> solutions (Figure 1). The addition of N increased the accumulation of NH4 + -N, NO3 - -N <strong>and</strong> DON in<br />
the <strong>soil</strong> solutions at both depths (Figure 1). Thus, the export of inorganic N <strong>and</strong> DON from such forest<br />
st<strong>and</strong> was significantly increased by addition of N.<br />
- -N (μg N ml -1 )<br />
+ -N (μg N ml -1 )<br />
NO3<br />
NH 4<br />
DON (μg N ml -1 )<br />
DOC (μg C ml -1 )<br />
1.4<br />
1.2<br />
1.0<br />
0.8<br />
0.6<br />
0.4<br />
0.2<br />
0.2<br />
0.0<br />
Jul 15Aug 15Sep 15 Apr 15 May 15 Jun 15 Jul 15 Aug 15 Sep 15 May 15 Jun 15 Jul 15 Aug 15 Sep 15<br />
0.0<br />
Jul 15 Aug 15Sep 15 Apr 15 May 15 Jun 15 Jul 15 Aug 15 Sep 15 May 15 Jun 15 Jul 15 Aug 15 Sep 15<br />
0.6<br />
0.6<br />
0.5<br />
0.4<br />
0.3<br />
0.2<br />
0.1<br />
0<br />
Jul 15Aug 15Sep 15 Apr 15 May 15 Jun 15 Jul 15 Aug 15 Sep 15 May 15 Jun 15 Jul 15 Aug 15 Sep 15<br />
0<br />
Jul 15 Aug 15Sep 15 Apr 15 May 15 Jun 15 Jul 15 Aug 15 Sep 15 May 15 Jun 15 Jul 15 Aug 15 Sep 15<br />
2006<br />
2007 2008<br />
2006<br />
2007<br />
2008<br />
© 2010 19 th World Congress of Soil Science, Soil Solutions for a Changing World<br />
1 – 6 August 2010, Brisbane, Australia. Published on DVD.<br />
↓ 1.4<br />
1.2<br />
↓<br />
1.0<br />
0.8<br />
0.6<br />
0.4<br />
0.5<br />
0.4<br />
0.3<br />
0.2<br />
0.1<br />
0.0<br />
0.0<br />
Jul 15Aug 15Sep 15 Apr 15 May 15 Jun 15 Jul 15 Aug 15 Sep 15 May 15 Jun 15 Jul 15 Aug 15 Sep 15 Jul 15 Aug 15Sep 15 Apr 15 May 15 Jun 15 Jul 15 Aug 15 Sep 15 May 15 Jun 15 Jul 15 Aug 15 Sep 15<br />
6<br />
5<br />
4<br />
3<br />
2<br />
1<br />
3.5<br />
3.0<br />
2.5<br />
2.0<br />
1.5<br />
1.0<br />
0.5<br />
0<br />
Jul 15Aug 15Sep 15 Apr 15 May 15 Jun 15 Jul 15 Aug 15 Sep 15 May 15 Jun 15 Jul 15 Aug 15 Sep 15<br />
0.0<br />
Jul 15 Aug 15 Sep 15 Apr 15 May 15 Jun 15 Jul 15 Aug 15 Sep 15 May 15 Jun 15 Jul 15 Aug 15 Sep 15<br />
30<br />
(d)<br />
25<br />
20<br />
20<br />
15<br />
(h) Control<br />
(NH ) SO 4 2 4<br />
NH Cl 4<br />
15<br />
10<br />
KNO3 10<br />
5<br />
↓ ↓ (a)<br />
(b)<br />
(c)<br />
↓<br />
↓<br />
↓ ↓ ↓<br />
↓ ↓<br />
↓ ↓ ↓<br />
↓ ↓<br />
5<br />
↓ ↓<br />
(e)<br />
(f)<br />
(g)<br />
Sampling date (month-day)<br />
↓<br />
↓<br />
↓<br />
↓ ↓<br />
↓ ↓ ↓ ↓ ↓ ↓<br />
Figure 1. Dynamics of dissolved organic matter <strong>and</strong> inorganic N concentrations in forest <strong>soil</strong> solutions in 2006-<br />
2008 upon addition of N at a rate of 4.5 g /m 2 each year. a-d: <strong>soil</strong> solution at 15 cm depth; e-h: <strong>soil</strong> solution at 60<br />
cm depth. Arrows indicate date of N addition.<br />
The DOC concentrations in <strong>soil</strong> solutions at 15 cm depth (1.2 to 27.8 µg C/ml) throughout the period of<br />
the experiment were significantly larger than those at 60 cm depth (1.1-16.5 µg C/ml) (Figure 1d,h). The<br />
addition of N sources such as (NH4)2SO4 <strong>and</strong> NH4Cl tended to decrease DOC concentrations in the <strong>soil</strong><br />
solutions at 60 cm depth (Figure 1h) <strong>and</strong> showed a small <strong>change</strong> in concentrations at 15 cm depth<br />
(Figure 1d). DOC concentrations in the <strong>soil</strong> solutions decreased with increasing <strong>soil</strong> depth under all the<br />
experimental plots to a greater degree than did DON, especially under N-fertilized plots. This<br />
phenomenon may decrease rates of DOC to DON concentrations in <strong>soil</strong> solutions at both depths upon N<br />
addition. Our observations indicated that the mechanisms for DOC dynamics under N-fertilized forest<br />
st<strong>and</strong>s on a plot-scale differed from those for DON.<br />
Effect of N addition on fluxes of DOC, DON <strong>and</strong> inorganic N in <strong>soil</strong> solution<br />
Monthly DOC fluxes in <strong>soil</strong> solutions at 15 cm depth (0.2 to 25.0 g C/m 2 ) throughout the period of the<br />
experiment were significantly larger than those at 60 cm depth (0.1-16.3 g C/m 2 ). The addition of N<br />
sources such as (NH4)2SO4 <strong>and</strong> NH4Cl tended to decrease monthly DOC fluxes in <strong>soil</strong> solutions at 60 cm<br />
depth <strong>and</strong> showed a small <strong>change</strong> in fluxes at 15 cm depth. Probably, there was high amount of DOC<br />
retained in underlying mineral <strong>soil</strong>s (15-60 cm) under N-fertilized forest plots. The addition of N<br />
increased fluxes of NH4 + -N <strong>and</strong> NO3 - -N <strong>and</strong> DON in the <strong>soil</strong> solutions at both depths <strong>and</strong> tended to<br />
decrease the proportion of DON in total N fluxes.<br />
Effect of N addition on special UV absorbance of forest <strong>soil</strong> solution<br />
There was a relatively small special UV absorbance of forest <strong>soil</strong> solution at 60 cm depth under all<br />
experimental plots in 2007-2008 compared to the solution at 15 cm depth (Figure 2). This indicated that<br />
DOM leached from deep <strong>soil</strong> layers is characterized by high decomposability. The addition of N tended to<br />
decrease special UV absorbance of <strong>soil</strong> solutions at 15 cm <strong>and</strong> 60 cm depths, especially at the latter.<br />
Probably, N inputs to forest floors can affect the stability of DOM in <strong>soil</strong> solution.<br />
↓<br />
133
C cm -1<br />
)<br />
Special UV absorbance (L mg -1<br />
3.0<br />
2.5<br />
2.0<br />
1.5<br />
1.0<br />
0.5<br />
0.0<br />
0.0<br />
Jun 15 Jul 15 Aug 15 Sep 15 Apr 15 May 15 Jun 15 Jul 15 Aug 15 Sep 15 Jun 15 Jul 15 Aug 15 Sep 15 Apr 15 May 15 Jun 15 Jul 15 Aug 15 Sep 15<br />
3.0<br />
2.5<br />
2.0<br />
1.5<br />
1.0<br />
0.5<br />
(a): 15 cm depth<br />
3.0<br />
(b): 15 cm depth (d): 60 cm depth<br />
0.0<br />
0.0<br />
Jun 15 Jul 15 Aug 15 Sep 15 Apr 15 May 15 Jun 15 Jul 15 Aug 15 Sep 15 Jun 15 Jul 15 Aug 15 Sep 15 Apr 15 May 15 Jun 15 Jul 15 Aug 15 Sep 15<br />
2007<br />
Control<br />
(NH 4 ) 2 SO 4<br />
NH 4 Cl<br />
KNO 3<br />
2008<br />
© 2010 19 th World Congress of Soil Science, Soil Solutions for a Changing World<br />
1 – 6 August 2010, Brisbane, Australia. Published on DVD.<br />
3.0<br />
2.5<br />
2.0<br />
1.5<br />
1.0<br />
0.5<br />
2.5<br />
2.0<br />
1.5<br />
1.0<br />
0.5<br />
Sampling date<br />
(c): 60 cm depth<br />
Figure 2. Dynamics of special UV absorbance of <strong>soil</strong> solutions at 15 cm <strong>and</strong> 60 cm depth in 2007-2008. a <strong>and</strong> c: N<br />
addition at a rate of 4.5 g /m 2 each year; b <strong>and</strong> d: N addition at a rate of 2.25 g /m 2 each year.<br />
Contribution of N inputs <strong>and</strong> <strong>soil</strong> net N mineralization to N fluxes in <strong>soil</strong> solution<br />
In combination with previous published studies, our data can be used to assess the contribution of N inputs<br />
<strong>and</strong> <strong>soil</strong> net N mineralization to N fluxes in <strong>soil</strong> solution under forest ecosystems.<br />
Acknowledgements<br />
This research was funded jointly by the National Natural Science Foundation of China (Grant Nos.<br />
40875085 <strong>and</strong> 20777071) <strong>and</strong> by the Hundred Talents Project from the Chinese Academy of Sciences.<br />
References<br />
Han L, Xu XK, Luo XB, Cao FQ, Han SJ (2009) Effects of nitrogen addition on <strong>soil</strong> net N mineralization<br />
under a temperate old-growth forest st<strong>and</strong>. Chin. Sci. Bull. submitted.<br />
Kim HT (1995) Soil Sampling, Preparation <strong>and</strong> Analysis. Marcel Dekker, New York.<br />
Magill A, Aber JD (2000) Dissolved organic carbon <strong>and</strong> nitrogen relationships in forest litter as affected by<br />
nitrogen deposition. Soil Biol. Biochem. 32, 603-613.<br />
McDowell WH, Currie WS, Aber JD, Yano Y (1998) Effects of chronic nitrogen amendments on production<br />
of dissolved organic carbon <strong>and</strong> nitrogen in forest <strong>soil</strong>s. Water Air Soil Pollu. 105, 175-182.<br />
McDowell WH, Magill AH, Aitkenhead-Peterson JA, Aber JD, Merriam JL, Kaushal SS (2004) Effects<br />
of chronic nitrogen amendment on dissolved organic matter <strong>and</strong> inorganic nitrogen in <strong>soil</strong><br />
solution. For. Ecol. Manage. 196, 29-41.<br />
Michalzik B, Kalbitz K, Park JH, Solinger S, Matzner E (2001) Fluxes <strong>and</strong> concentrations of dissolved<br />
organic carbon <strong>and</strong> nitrogen – a synthesis for temperate forests. Biogeochemistry 52, 173-205.<br />
Michel K, Matzner E, Dignac MF, Kögel Knabner I (2006) Properties of dissovled organic matter related to<br />
<strong>soil</strong> organic matter quality <strong>and</strong> nitrogen additions in Norway spruce forest floors. Geoderma 130, 250-<br />
264.<br />
Pregitzer KS, Zak DR, Burton AJ, Ashby JA, MacDonald NW (2004) Chronic nitrate additions dramatically<br />
increase the export of carbon <strong>and</strong> nitrogen from northern hardwood ecosystems. Biogeochemistry 68,<br />
179-197.<br />
V<strong>and</strong>enbruwane J, Neve SD, Schrijver AD, Geudens G, Verheyen K, Hofman G (2008) Comparison of<br />
ceramic <strong>and</strong> polytetrafluoroethene/Quartz suction cups for sampling inorganic ions in <strong>soil</strong> solution.<br />
Commun. Soil Sci. Plant Anal. 39, 1105-1121.<br />
Xu XK, Han L, Luo XB, Liu ZR, Han SJ (2009) Effects of nitrogen addition on dissolved N2O <strong>and</strong> CO2,<br />
dissolved organic matter, <strong>and</strong> inorganic nitrogen in <strong>soil</strong> solution under a temperate old-growth forest.<br />
Geoderma 151, 370-377.<br />
Xu XK, Han L, Wang YS, Inubushi K (2007) Influence of vegetation types <strong>and</strong> <strong>soil</strong> properties on<br />
microbial biomass carbon <strong>and</strong> metabolic quotients in temperate volcanic <strong>and</strong> tropical forest <strong>soil</strong>s.<br />
Soil Sci. Plant Nutr. 53, 430-440.<br />
2007<br />
2008<br />
134
Planning the forest roads in reforestation - cases in south Brazil<br />
Carla Maria Camargo Corrêa A ; Itamar Bognola B<br />
A Federal University of Paraná – NIMAD – Interdisciplinary Nucleus of Environment <strong>and</strong> Development – Polytechnic Center / UFPR<br />
– P.O. Box 19023 – 81531-990 – Curitiba - Paraná – Brazil – Email: camargocorrea@ufpr.br<br />
B CNPFlorestas – National Center in <strong>Forest</strong> Research – P.O. Box 319 - 83411-000 Colombo – Paraná – Email:iabog@yahoo.com.br<br />
Abstract<br />
This work examines two cases of reforestation with Pinus sp. in South Brazil, with the main focus of the<br />
forest road-net. The first case indicates the importance of using a better harvest system to reduce<br />
environmental damage <strong>and</strong> increase the productive area of undulating relief. In this case it was observed the<br />
productive area is enhanced by around 28 %, where a cable system is used. The second case, <strong>soil</strong> losses in<br />
secondary forest roads have been evaluated for segments of roads with <strong>and</strong> without conservation <strong>and</strong><br />
firebreaks on soft undulating <strong>and</strong> plain relief, with various <strong>soil</strong> texture conditions. This work clarifies the<br />
importance of conservation measures with a reduction in 11% of <strong>soil</strong> loss when using conservation measures<br />
for undulating relief <strong>and</strong> <strong>soil</strong>s with s<strong>and</strong> texture predominantly <strong>and</strong> 24.3% for gently undulating to plain<br />
relief <strong>and</strong> clay texture. Development of practical code for planning of forest roads is required, considering<br />
the economical <strong>and</strong> environmental aspects during the wood harvesting.<br />
Keyword<br />
Environmental degradation, road-net, road density, technical parameters, planning,<br />
Introduction<br />
In reforestation l<strong>and</strong>, it is necessary to take care with planning the forest road-net, considering the high<br />
possibility to develop different kind of environmental degradation, like erosion <strong>and</strong> the water pollution,<br />
mainly during the occasion of wood harvesting <strong>and</strong> timber hauling, where this troubles are evidenced, in<br />
function the high level of traffic (machines <strong>and</strong> trucks).<br />
The wood harvesting <strong>and</strong> timber hauling represent a substantial part of industrial’s raw material costs, <strong>and</strong><br />
have a major influence in the sector’s overall competitiveness. In Brazil this costs represent surrounded by<br />
60 <strong>and</strong> 70%, varying in agreement to the timber transported system adopted. If this activities represent the<br />
major part of costs, they are responsible for the main environmental damage, like (<strong>soil</strong> compaction, erosion<br />
process <strong>and</strong> water sedimentation), <strong>and</strong> the quality of road-net are the fundamental importance for the<br />
damages magnitude.<br />
Inside the reforestation cycle, the planning of forest road-net comprehends two distinctive phases where it is<br />
essential to be linked, during the implantation (Basic Road-net) <strong>and</strong> during the harvesting <strong>and</strong> timber hauling<br />
(Complementary Road-net).<br />
Basic Road-net or Main Roads (permanent roads <strong>and</strong> all-weather roads)<br />
For planning this Basic Road-net, it is thoughtful to provide work for st<strong>and</strong>’s implantation, when the<br />
primarily focus are to attend the necessity of access <strong>and</strong> traffic the different kind of equipments <strong>and</strong><br />
machines used for silvicultural operations: <strong>soil</strong> preparation, nursery operations, control (fire, pest <strong>and</strong><br />
disease), cutting system, logging <strong>and</strong> transport methods, as well as the better choice for minimize the<br />
environmental impacts <strong>and</strong> reduce the costs.<br />
The mainly characteristics observed in majority of Basic Road-net are: technical parameters are improved,<br />
like drainage system, paved (gravel or bituminous mixtures) <strong>and</strong> the road density is minimized. Through the<br />
planning of these roads, are necessary to attend the necessity of implantation the Complementary Road-net,<br />
during the wood harvesting operations (CAMARGO CORRÊA et al, 2006).<br />
Complementary Road-net or Secondary Roads, Feeder Roads (seasonal roads)<br />
During the wood harvesting operations, the Basic Road-net are amplify for attend the necessity of high level<br />
of traffic with weighty machines used for timber haulage. The FAO (2009) have some advices for planning<br />
the Complementary Road-net it was necessary to ensure that all of the elements which go into the successful<br />
combination of: road which is right for the wood harvesting operation; which is capable of safely carrying<br />
the haulage traffic; ease interference in the natural drainage patterns; minimize the damage the l<strong>and</strong>scape; try<br />
to takes account of the flora <strong>and</strong> fauna <strong>and</strong> can be satisfactorily <strong>and</strong> economically maintained are included.<br />
Camargo Corrêa (2005) suggest the inclusion the environmental control during the planning the<br />
© 2010 19 th World Congress of Soil Science, Soil Solutions for a Changing World<br />
1 – 6 August 2010, Brisbane, Australia. Published on DVD.<br />
135
Complementary Road-net mainly during the wood harvesting, where the erosion process are increased,<br />
exposure the water body to sedimentation.<br />
This work aimed to explain two situations observed in Pinus sp. reforestations located in South Brazil, where<br />
the objective was to expose the possibility of grow up in the production area <strong>and</strong> environmental concept<br />
when adoption adequate planning for road-net <strong>and</strong> the importance the adoption of conservation measure in<br />
forest road during the wood harvesting.<br />
Fist Case<br />
The first case refer the necessity of planning the Complementary Road-net taking careful attention for choice<br />
the wood harvesting system, if the l<strong>and</strong>scape are highly waved, are increase the vulnerability for<br />
development the environmental harms. In the Figures 1 <strong>and</strong> 2, are exposed different kinds of wood<br />
harvesting system.<br />
Figure 1. <strong>Forest</strong> Road-net with conventional harvesting system (tree length)<br />
In this case, the Pinus sp. was harvested thought the tree length system, where the major road density <strong>and</strong> the<br />
awful forest road-net planning it was observed. This road-net are very susceptible to surface damages<br />
(potholing, rutting, corrugation <strong>and</strong> disaggregation the <strong>soil</strong>s particles) <strong>and</strong> associated with the absent of<br />
paved <strong>and</strong> waved relief, where the s<strong>and</strong>y <strong>soil</strong> are predominant, the necessity of project with erosion<br />
prevention measure are eminent, but it is not observed in field.<br />
Figure 2. <strong>Forest</strong> Road- net integrated with cable system<br />
This figure is around the former region, where the system adopted for harvester operations are cable, the<br />
improvement of this system in contrast with another harvesting systems consist in increase the productivity<br />
area, in this case it was appraise around 28 %, beyond the environmental advantage associated, as erosion<br />
process reduction <strong>and</strong> water preservation in susceptible areas.<br />
Second Case<br />
The second case refers the use of conservation measure (water bars equidistant in 50 meters) in secondary<br />
forest roads considering two sampling: undulating relief conditions with s<strong>and</strong> <strong>soil</strong> texture predominately <strong>and</strong><br />
another in soft undulating to plain relief conditions with clay <strong>soil</strong> texture for the most part. They had been<br />
evaluated tree treatments being: road with conservation, road without conservation <strong>and</strong> firebreaks, <strong>and</strong><br />
measure the rainfall during the period of one year, <strong>and</strong> the results are represented in Figures 3 <strong>and</strong> 4.<br />
© 2010 19 th World Congress of Soil Science, Soil Solutions for a Changing World<br />
1 – 6 August 2010, Brisbane, Australia. Published on DVD.<br />
136
Figure 3. Secondary forest roads in soft undulating relief whit s<strong>and</strong> <strong>soil</strong> texture<br />
Figure 4. Secondary forest roads in plain relief whit clay <strong>soil</strong> texture<br />
The <strong>soil</strong> losses proceeding from secondary forest road observed on the first sampling (undulating relief with<br />
s<strong>and</strong> texture predominantly) it was represented around 48,9 % in secondary roads without conservation,<br />
38,0% in secondary roads with conservation <strong>and</strong> 13,1% in firebreaks. And in second sampling (soft to plain<br />
relief with clay texture mainly) the <strong>soil</strong> losses was represented 60.4% in secondary roads without<br />
conservation 36,1 % in secondary roads with conservation <strong>and</strong> 3,5% in firebreaks (CAMARGO CORRÊA,<br />
et al. 2007).<br />
These cases wanted to collaborate for development the knowledge the susceptibility of environmental<br />
damage in forestl<strong>and</strong>, <strong>and</strong> the importance of planning the wood harvesting <strong>and</strong> timber hauling <strong>and</strong> the<br />
proposition of measures were want minimize the this harms, <strong>and</strong> perhaps develop the wood harvesting<br />
practical code considering the environmental weakness associated with economical aspects.<br />
References<br />
Camargo Corrêa CM, Roloff G, Silva IC (2007) Real <strong>and</strong> estimative erosion through RUSLE from forest<br />
roads in two relief conditions <strong>and</strong> four <strong>soil</strong>s profile (Piracicaba/SP). Sci. For.76, 57-66.<br />
http://www.ipef.br/publicacoes/scientia/nr76/cap05.pdf<br />
Camargo Corrêa CM, Malinovski JR, Roloff G (2006) Bases for planning the Road - net in South Brazil<br />
reforestation. (Curitiba/PR.). Floresta 36(2) 277-286.<br />
http://ojs.c3sl.ufpr.br/ojs2/index.php/floresta/article/viewFile/6450/4641<br />
Camargo Corrêa CM (2005) Soil loses <strong>and</strong> water quality proceeded from <strong>Forest</strong> roads in Catarinense Plato.<br />
These Silvicultural Area – <strong>Forest</strong> Engineering / Federal University of Paraná. Curitba/Pr. 158 p.<br />
http://www.floresta.ufpr.br/pos-graduacao/defesas/pdf_dr/2005/t192_0237-D.pdf<br />
FAO–Food <strong>and</strong> Agriculture Organization (1998) visited 29/10/2009, in<br />
http://www.fao.org/docrep/W8297E/w8297e00.HTM<br />
© 2010 19 th World Congress of Soil Science, Soil Solutions for a Changing World<br />
1 – 6 August 2010, Brisbane, Australia. Published on DVD.<br />
137
Quantified <strong>soil</strong> dynamics <strong>and</strong> spatial fragmentation within the shifting<br />
agricultural l<strong>and</strong>scape in southern Cameroon<br />
Martin Yemefack A* , Rosaline Njomgang A , Laurent Nounamo A , <strong>and</strong> David G. Rossiter B<br />
A<br />
Institute of Agricultural Research for Development (IRAD), P.O. Box 2067 Yaoundé-Cameroon. E-mail: yemefack@itc.nl <strong>and</strong><br />
myemefack@yahoo.fr; rnjomgang@yahoo.fr; lnounamo@yahoo.fr<br />
B<br />
Faculty of Geo-Information Science <strong>and</strong> Earth Observation (ITC), University of Twente, P.O. Box 6, 7500 AA Enschede, The<br />
Netherl<strong>and</strong>s Email: rossiter@itc.nl<br />
*<br />
Corresponding author, Tel: (237) 94144812 / 22015826, E-mail: yemefack@itc.nl <strong>and</strong> myemefack@yahoo.fr<br />
Abstract<br />
This research used scientific modeling tools to produce quantitative information on the effects of shifting agriculture on<br />
<strong>soil</strong> <strong>and</strong> spatial pattern of l<strong>and</strong>scape dynamics in the area. An analysis of farming system led to the development of a<br />
conceptual model of the spatio-temporal dynamics of shifting agriculture, including transition matrices of rotational<br />
cycles. The study of <strong>soil</strong> variability showed that 30-35% of the total variance of some top<strong>soil</strong> (0-20 cm) properties was<br />
due to the influence l<strong>and</strong> use practices. A robust quantitative multi-criteria method was then developed that selected five<br />
<strong>soil</strong> properties (pH, calcium, available phosphorus, bulk density <strong>and</strong> organic carbon) that are the most sensitive to these<br />
agricultural practices. Empirical models of linear/quadratic fractional rational functions were successfully fitted to time<br />
series <strong>soil</strong> variables to derive quantitative measures on temporal <strong>change</strong>s in <strong>soil</strong> with l<strong>and</strong> use. Multi-spectral satellite<br />
imagery was able to map with 80% accuracy the extension front of shifting agricultural l<strong>and</strong>scape <strong>and</strong> the most dynamic<br />
l<strong>and</strong> cover types (crop fields, young fallows), which shift every season <strong>and</strong> every year. Data <strong>and</strong> methods produced are<br />
useful for <strong>soil</strong> quality assessment <strong>and</strong> spatio-temporal dynamic simulation in order to guide decision-making for<br />
sustainable l<strong>and</strong>-use planning <strong>and</strong> forest resources management.<br />
Key words<br />
Shifting agriculture; Farming systems analysis; Soil dynamics; L<strong>and</strong>scape fragmentation; Rain forest;<br />
Southern Cameroon.<br />
Introduction<br />
In the tropical rain forest zone of Southern Cameroon, the spatial pattern of the shifting agricultural l<strong>and</strong> use<br />
system is a l<strong>and</strong>scape mosaic system (Forman 1995), which is defined here as a spatial <strong>and</strong> temporal<br />
heterogeneity of aggregated elements of distinct boundaries, where various fallow types, various food crop<br />
fields, various perennial plantation types, undisturbed forest, <strong>and</strong> settlement areas are repeated in similar<br />
form over the l<strong>and</strong>scape. This leads to a dynamic process acting in <strong>soil</strong> <strong>and</strong> on the spatial pattern of l<strong>and</strong><br />
use/L<strong>and</strong> cover (LULC) within the mosaic system. Beside the small-scale farmers’ agriculture, the<br />
sustainable use <strong>and</strong> management of the national forests has become a challenge at national as well as<br />
international levels (ITTO 1990). In such a context of multifunctional use of the space, better l<strong>and</strong><br />
management practices that can ensure efficient use of energy <strong>and</strong> nutrient capital from <strong>soil</strong>-vegetation<br />
complex, <strong>and</strong> minimize l<strong>and</strong> use conflicts should be promoted. However, this can only be effective if based<br />
on thorough knowledge on integrative indicators of the current status of the agricultural production capacity<br />
of l<strong>and</strong> <strong>and</strong> their <strong>change</strong>s over time. This is what motivated the research reported in this paper which main<br />
objective was to provide quantitative information, developed through modelling <strong>processes</strong>, on short <strong>and</strong><br />
long-term effects of shifting agriculture on <strong>soil</strong> <strong>and</strong> the l<strong>and</strong>scape dynamic in space.<br />
The research design <strong>and</strong> methods<br />
The study area is located between 2º47’ - 3º14’ N <strong>and</strong> 10º24’ - 10º51’ E. It belongs to the mid-altitude dense<br />
moist evergreen Biafran forest of Cameroon (Gartlan 1989). Two rainy seasons account for 1600-2000 mm<br />
of annual rainfall. Most <strong>soil</strong>s are Ferralsols <strong>and</strong> Acrisols (FAO-ISRIC 2006). The area is sparsely populated.<br />
Selective industrial logging <strong>and</strong> extensive shifting agriculture are the most important l<strong>and</strong> use activities.<br />
In four representative villages of the area, a synchronic approach for data collection was combined with<br />
diachronic monitoring of plots during the two-year cropping period <strong>and</strong> after five subsequent years. LULC<br />
treatments (10 in total) were chosen based on actual agricultural production cycles (Figure 1) described in<br />
Yemefack (2005, Chapter 2). Samples were taken with 3-4 replications in each village. In selected LULC<br />
patches, composite <strong>soil</strong> samples were collected, at three depths (0-10, 10-20, <strong>and</strong> 30-50 cm). Soil samples<br />
were analysed in the IRAD laboratory for pH, organic matter, available phosphorus, ex<strong>change</strong>able bases,<br />
ex<strong>change</strong> acidity <strong>and</strong> particle size distribution, using procedures described in Van Reeuwijk (1993). Surface<br />
areas of 293 crop fields opened within three years by 35 households were measured. 33 plots were monitored<br />
from the first year of cropping to seven years.<br />
© 2010 19 th World Congress of Soil Science, Soil Solutions for a Changing World<br />
1 – 6 August 2010, Brisbane, Australia. Published on DVD.<br />
138
Figure 1. Observed transitions between l<strong>and</strong> uses. Adapted from Yemefack (2005, Chapter 2)<br />
Key:( ) Common transitions; ( ) Infrequent transitions; ( ) PF recovery after definite<br />
ab<strong>and</strong>onment; (+) patches can split (fragmentation); (-) patches can merge with others of the same type (consolidation);<br />
(*) patches can merge with those of other types.<br />
Investigating l<strong>and</strong>scape spatial fragmentation, two questions guided our research: (i) Can L<strong>and</strong>sat-7 ETM+<br />
imagery be used to map various LULC of the area? (ii) At which level of aggregation could this l<strong>and</strong>scape<br />
structure be characterized in terms of composition <strong>and</strong> spatial configuration? In two sample sub-areas<br />
(Ebimimbang area on Acrisols <strong>and</strong> Mvie area on Ferralsols), the geographic coordinates of the centre of 158<br />
LULC patches were recorded with a GPS six weeks before the image was taken on the 31 March 2003.<br />
Descriptive statistics, analysis of variance <strong>and</strong> means separations (Tukey’s method), principal component<br />
analysis, cluster analysis, discriminant analysis, <strong>and</strong> geostatistical analysis were applied to different datasets<br />
designed purposely for each specific objective. Detailed descriptions of these analyses are giving in<br />
Yemefack (2005). The analyses were carried out with R environment (Ihaka <strong>and</strong> Gentleman 1996). Spatial<br />
analysis <strong>and</strong> remote sensing processing were done using ILWIS (ITC ILWIS Unit 2001).<br />
Results <strong>and</strong> discussion<br />
Dynamics of shifting agriculture<br />
The analysis of farmers’ field size distribution <strong>and</strong> the conceptual model of l<strong>and</strong> use dynamic exposed the<br />
issue of rotational fallow systems, which tend to replace the ideal shifting cultivation in which short-term<br />
cropping alternates with secondary forest on a plot. This has shown (Figure 2) that 1/5 of food crop field<br />
plots were based on short rotational fallow cycles (RSFS), about 1/2 on long rotational fallow cycles (RLFS),<br />
1/5 on very long fallow cycles (RVFS), <strong>and</strong> 1/10 on forest conversion (FCS). If the shorter fallow cycles are<br />
sustainable, this may require intensification: tighter integration into the market economy <strong>and</strong> some purchased<br />
inputs, with special attention to nutrient cycling <strong>and</strong> <strong>soil</strong> management.<br />
BF<br />
FF<br />
FCF<br />
CL<br />
CF<br />
PF<br />
© 2010 19 th World Congress of Soil Science, Soil Solutions for a Changing World<br />
1 – 6 August 2010, Brisbane, Australia. Published on DVD.<br />
PP<br />
Key: Cycle Area (%) Household (%)<br />
………………… CL-BF-CL (RSFS) 19 32<br />
CL-CF-BF-CL (RLFS) 52 52 Food crop production cycles<br />
CL-CF-BF-FF-FCF-CL (RVFS) 17 11<br />
PF-FCF (FCS) 12 5<br />
PP cycle 3-25 (including elites’ plantations)<br />
PF recovery unknown<br />
Figure 2. Cycle proportions of shifting agricultural l<strong>and</strong> use management in southern Cameroon. Adapted <strong>and</strong><br />
modified from Yemefack (2005, Chapter 2).<br />
In this study, 35 households cleared 95 ha in three years, of which 88% of the area cleared for crop fields<br />
came from fallow l<strong>and</strong>s <strong>and</strong> only 12% from primary forest (Figure 2). However, with the involvement of<br />
139
elites in agricultural plantations, net deforestation is probably occurring, since their plantation plot sizes are<br />
far larger than those of small farmers. This brings the total proportion of PF in the cleared area to about 40%<br />
when including elite plantations.<br />
Soil variability in the study area<br />
For a better underst<strong>and</strong>ing of complex relations between <strong>soil</strong> properties, environmental factors <strong>and</strong> l<strong>and</strong> use<br />
systems, sources of <strong>soil</strong> variability were evaluated at four scales: region, village, plot <strong>and</strong> laboratory<br />
(Yemefack et al. 2005). This four-scale study was able to explain for several variables, an encouraging 80%<br />
(for less sensitive <strong>soil</strong> variables) to 95% (most sensitive ones) of the overall <strong>soil</strong> variation; with 5 to 70% by<br />
regional factors, 3 to 35% by local factors, 1 to 10% by within-plot factors, <strong>and</strong> less than 5% by laboratory<br />
errors. L<strong>and</strong> use practices significantly (p
Proportional Deviation<br />
Proportional Deviation<br />
0.3<br />
0.2<br />
0.1<br />
0<br />
-0.1<br />
-0.2<br />
-0.3<br />
4<br />
3.5<br />
3<br />
2.5<br />
2<br />
1.5<br />
1<br />
0.5<br />
0<br />
pH (Cultiv ation-fallow sy stems) pH (Perennial plantations sy stems)<br />
Bulk density (Cultiv ation-fallow sy stems) Bulk densisty (Perennial plantations sy stems)<br />
Organic carbon (Cultiv ation-fallow sy stems) Organic carbon (Perennial plantations sy stems)<br />
0 2 4 6 8 10 12 14 16 18 20 22 24 26 28 30 32<br />
Time (Year)<br />
Ca (Cultiv ation-fallow sy stems) Ca (Perennial plantations sy stems)<br />
Av ailable P (Cultiv ation-fallow sy stems) Av ailable P (Perennial plantations sy stems)<br />
0 2 4 6 8 10 12 14 16 18 20 22 24 26 28 30 32<br />
Time (Year)<br />
Figure 3. Linear/quadratic fractional rational functions<br />
fitted to <strong>soil</strong> properties (0-10 cm) dynamics under two<br />
l<strong>and</strong> use chronosequences (food cropping-fallow system<br />
<strong>and</strong> perennial plantation) as shown by proportional<br />
deviations from the reference under primary forest over<br />
time.<br />
© 2010 19 th World Congress of Soil Science, Soil Solutions for a Changing World<br />
1 – 6 August 2010, Brisbane, Australia. Published on DVD.<br />
Figure 4. Spatial configuration of the two<br />
sub-areas based on the Maximum Likelihood<br />
supervised classification.<br />
Concluding remarks<br />
• The short rotational fallow cycle is increasingly being used due to the farmers’ desire to replace cash<br />
income from cocoa with cash food crops. This may require intensification with special attention to nutrient<br />
cycling <strong>and</strong> <strong>soil</strong> management. This l<strong>and</strong> use practice significantly influence top<strong>soil</strong> variation <strong>and</strong> accounted<br />
for 30-35% of the total variance.<br />
• Five <strong>soil</strong> properties (pH, ex<strong>change</strong>able Ca, available P, bulk density <strong>and</strong> organic carbon) are the most<br />
affected by the shifting agricultural practices in top<strong>soil</strong>. Interpretation metrics derived from their functions<br />
(linear/quadratic fractional rational functions) in time are useful figures for supporting decision in defining<br />
<strong>and</strong> timing any intervention action.<br />
• From multispectral remote sensing, only crop fields <strong>and</strong> short fallow patches were most accurately<br />
classified by the maximum likelihood classifier with over 80% accuracy.<br />
• Data <strong>and</strong> methods produced are useful for <strong>soil</strong> quality assessment <strong>and</strong> spatio-temporal dynamic<br />
simulation in order to guide decision-making for sustainable l<strong>and</strong>-use planning <strong>and</strong> forest resources<br />
management.<br />
References<br />
FAO-ISRIC (2006) 'World Reference Base for <strong>soil</strong> resources.' (FAO: Rome)<br />
Forman RTT (1995) 'L<strong>and</strong> mosaics: The ecology of l<strong>and</strong>scapes <strong>and</strong> regions.' (Cambridge University Press:<br />
Cambridge, UK)<br />
Gartlan S (Ed.) (1989) 'La conservation des écosystèmes forestiers du Cameroun.' (UICN: Gl<strong>and</strong>, Suisse et<br />
Cambridge, UK)<br />
Ihaka R, Gentleman R (1996) R: A Language for Data Analysis <strong>and</strong> Graphics. Journal of Computational &<br />
Graphical Statistics 5, 299-314.<br />
ITC ILWIS Unit (2001) ILWIS 3.0 Academic user's guide. In. pp. 520. (ITC: Enschede, NL)<br />
ITTO (1990) 'ITTO Guidelines for Sustainable Management of Natural Tropical <strong>Forest</strong>s.' (Yokohama, Japan)<br />
Van Reeuwijk LP (1993) 'Procedures for <strong>soil</strong> analysis.' (ISRIC: Wageningen, The Netherl<strong>and</strong>s)<br />
Yemefack M (2005) 'Modelling <strong>and</strong> monitoring <strong>soil</strong> <strong>and</strong> l<strong>and</strong> use dynamics within shifting agricultural l<strong>and</strong>scape<br />
mosaic systems.' (ITC Enschede <strong>and</strong> Utrecht University: Enschede, The Netherl<strong>and</strong>s)<br />
Yemefack M, Bijker W, De Jong SM (2006a) Investigating relationships between L<strong>and</strong>sat-7 ETM + data <strong>and</strong><br />
spatial segregation of LULC types under shifting agriculture in southern Cameroon. International Journal<br />
of Applied Earth Observation & Geoinformation 8, 96-112.<br />
Yemefack M, Jetten VG, Rossiter DG (2006b) Developing a minimum data set for characterizing <strong>soil</strong> dynamics<br />
under shifting cultivation systems. Soil & Tillage Research 86, 84-98.<br />
Yemefack M, Rossiter DG, Jetten VG (2006c) Empirical modelling of <strong>soil</strong> dynamics along a chronosequence of<br />
shifting cultivation in southern Cameroon. Geoderma 133, 380-397.<br />
Yemefack M, Rossiter DG, Njomgang R (2005) Multi-scale characterization of <strong>soil</strong> variability within an<br />
agricultural l<strong>and</strong>scape mosaic system in southern Cameroon. Geoderma 125, 117-143.<br />
141
Soil fertility of Pinus taeda L. areas with low growth rates in Jaguariaíva –<br />
Paraná State, Brazil<br />
Verediana Fern<strong>and</strong>a Cherobim (A) , Giovana Clarice Poggere (A) , Ana Karina Nunes Santos (A) , Antonio Carlos<br />
Vargas Motta (B) Carlos Bruno Reissmann (B) & V<strong>and</strong>er de Freitas Melo (B)<br />
A Graduated of Agronomy, Setor de Ciências Agrárias, Universidade Federal do Paraná<br />
B Department Professors of Solo e Engenharia Agrícola, Setor de Ciências Agrárias, Universidade Federal do Paraná. Rua dos<br />
Funcionários, 1534, Curitiba, PR, Brazil - ZIP 80035-050. E-mail: mottaacv@ufpr.br<br />
Abstract<br />
Pine forests in Brazil have reached a high level of productivity. However, there are many areas with low rate<br />
of plant growth, associated with low <strong>soil</strong> fertility. Seven sites showing low rate of plant growth were selected<br />
<strong>and</strong> sampled for <strong>soil</strong> <strong>and</strong> litter analysis, in order to establish the limiting factor of <strong>soil</strong> fertility. Soils samples<br />
were collected within the following depths (0-20, 20-40 <strong>and</strong> 40-60 cm) <strong>and</strong> analyzed for <strong>soil</strong> fertility<br />
properties. Total <strong>soil</strong> concentration of K was also determined. Litter accumulation <strong>and</strong> its nutrient<br />
concentrations were established for each site. The results indicated that the <strong>soil</strong>s were very acid with Al<br />
saturation higher than 75%, for all samples. Ca, Mg <strong>and</strong> K availability varied from < 0.1 to 0.4 < 0.1 to 0.2<br />
cmolc /dm 3 , <strong>and</strong> 2.5 to 21.5 mg/dm 3 , respectively. The total concentration of K varied from 97 to 360 mg/kg<br />
of K, indicating a very low level of K reserves. The litter accumulated on the <strong>soil</strong> surface showed the<br />
influence of plant age <strong>and</strong> insufficient decomposition, forming a typical moder profile. The data suggested<br />
that lime <strong>and</strong> nutrient applications may be necessary to promote plant growth.<br />
Key words<br />
Pinus taeda, forest <strong>soil</strong>, <strong>soil</strong> acidity, <strong>soil</strong> nutrients reservoir, Cerrado, Brazil.<br />
Introduction<br />
During the 60´s the Brazilian government promoted a large reforestation program in the south. Pine species<br />
were selected reflecting the favorable subtropical climate condition <strong>and</strong> the original low <strong>soil</strong> fertility. Today,<br />
the pine reforestation is concentrated in the three southern states, where in Paraná the covering area reaches<br />
686,453 ha (ABRAF 2007).<br />
The good plant adaptability has been shown by the high productivity (Higa <strong>and</strong> Silva 2008). Depending on<br />
site quality, this productivity varies from 15 to 56 /m 3 /ha/y (Mainarde et al. 1996). Despite the low fertility<br />
requirement, there are indications that nutritional lack has been limitimg pinus growth under some conditions<br />
(Chaves <strong>and</strong> Corrêa 2003; 2005). This fact has been observed in reforestations occupying earlier Cerrado<br />
vegetation areas, which are well known to have very low <strong>soil</strong> fertility.<br />
Fertilizer application is not usual practice in pine plantations so nutrient depletion exacerbated by log<br />
extraction without nutrients return can start to impact on plant growth on poor <strong>soil</strong>s after the second cut<br />
cycle.<br />
Soil chemical <strong>and</strong> plant tissue analysis are the most used tools to evaluate the abundance of nutrients or toxic<br />
elements which can compromise plant growth (Reissmann 1981). These tools have been shown to be<br />
effective to distinguish different growth sites in the Brazilian pinus plantation (Wisniewski <strong>and</strong> Reissmann<br />
1996; Vogel 2003). However, there were conditions where these tools had low efficiency like in Cerrado <strong>soil</strong><br />
(Chaves <strong>and</strong> Corrêa 2003; 2005) where <strong>soil</strong>s are very likely to have more than one limiting factor.<br />
Litter accumulation on forest floor <strong>and</strong> its quality can also be used to evaluate pine growth sites (Mead<br />
1984). For the same age plantation, an inverse relationship was observed between litter accumulation <strong>and</strong><br />
plant growth (Wisniewski <strong>and</strong> Reissmann 1996).<br />
Located in the north of Paraná State, Jaguariaiva region is the transition area between subtropical <strong>and</strong><br />
tropical climate condition. The regional natural vegetation reflects this climate transition where subtropical<br />
forest of araucária, subtropical grassl<strong>and</strong> <strong>and</strong> Cerrado (Brazilian savanna) share the <strong>soil</strong> occupation. Also,<br />
two kinds of s<strong>and</strong>stone are the major parent materials forming <strong>soil</strong>s, giving a s<strong>and</strong>y texture to the <strong>soil</strong>s as<br />
well as low nutrient reserves. The region has lower pinus growth rates compared to others region <strong>and</strong><br />
responded to nutrient applications as organic residue (Rodrigues 2005). Our objective was to collect <strong>and</strong><br />
analyze <strong>soil</strong> <strong>and</strong> litter in order to identify factor limiting plant growth.<br />
Material e methods<br />
Commercial pinus plots plantations were selected, near Jaguariaíva city. The region is located on the second<br />
© 2010 19 th World Congress of Soil Science, Soil Solutions for a Changing World<br />
1 – 6 August 2010, Brisbane, Australia. Published on DVD.<br />
142
paranaense high plain, with altitudes between 960 to 1320 m. Furnas <strong>and</strong> Itararé s<strong>and</strong>stone are the <strong>soil</strong> parent<br />
material for the region. The regional climate is a transition between subtropical <strong>and</strong> tropical, with mean<br />
annual precipitation ranging from 1440 to 1600 mm <strong>and</strong> mean temperature from 17 to 19ºC. Frost occurs<br />
almost every year.<br />
Using a 50000 ha inventory, it was selected seven sites. Five of them had age 4 <strong>and</strong> 5, one 11 <strong>and</strong> one 17<br />
years old. The plantation was made 2 x 3m spacing <strong>and</strong> all was at least one time cropped with pinus or<br />
eucalyptus. For each plot it was selected an area of 1.2 ha (96 x 112 m), representing 34 lines. Then, it area<br />
was split in four line of 8 lines where it was collected eight <strong>soil</strong> samples within 0-20, 20-40 <strong>and</strong> 40-60 cm<br />
depth, in order to form one compost sample for each depth.<br />
In the same places where were collected the <strong>soil</strong> samples were collected the litter (L, F <strong>and</strong> H) horizon. After<br />
dry at 60 ºC, the litter samples were weighted, ground using Wiley type. Then samples were submitted a dry<br />
combustion (500 ºC) <strong>and</strong> attack with HCl 3 mol/L, <strong>and</strong> analyzed for macro <strong>and</strong> micronutrients according<br />
with Martins <strong>and</strong> Reissmann (2007).<br />
Soil samples were dried, sieved <strong>and</strong> analyzed for pH (CaCl2 0,01M – 1/2.5 <strong>soil</strong>/solution), Al toxic<br />
(extractable Al – KCl 1 M), H + + Al +3 (buffer capacity until pH 7,0), available Ca <strong>and</strong> Mg (extractable KCl 1<br />
M), available K <strong>and</strong> P (Mehlich I extraction) <strong>and</strong> total organic Carbon (C) (Walkley-Black methods),<br />
following Marques <strong>and</strong> Motta (2003). Total, non ex<strong>change</strong>able, <strong>and</strong> ex<strong>change</strong>able K were determined by<br />
using concentrated HF, boiling HNO3 1N, <strong>and</strong> ammonium acetate 1 mol/L, respectively. (MELO, 1994)<br />
Results <strong>and</strong> discussion<br />
Soil Fertility<br />
Soil results (Table 1) indicated that the <strong>soil</strong> were very acid high with low pH, high ex<strong>change</strong>able Al <strong>and</strong><br />
saturation. It was expected since the <strong>soil</strong> was natural acid <strong>and</strong> not lime was applied on pinus plantation. High<br />
values of (H + Al) can be associated with low pH <strong>and</strong> high organic C, <strong>and</strong> indicated high buffer capacity.<br />
Following the high <strong>soil</strong> acidity, very low level of Ca <strong>and</strong> Mg was observed, suggesting possibility of<br />
deficiency. Application of lime as Ca <strong>and</strong> Mg source is recommended, especially because there are large<br />
lime reservoirs close <strong>and</strong> price was accessible.<br />
Table 1. Mean values of pH, Al, (H + Al), m % ( Al saturation), C (total organic carbon), Ca, Mg, <strong>and</strong> P<br />
(Mehlich I), for seven <strong>soil</strong>s under pinus in the Jaguariaiva region – Brazil.<br />
pH Al +3 (H + + Al +3 ) m (%)<br />
1* 2 3 1 2 3 1 2 3 1 2 3<br />
cmolc/dm 3 %<br />
P1 3,8 4,1 4,1 2,7 1,7 1,6 10,9 7,9 7,1 81 81 81<br />
P2 4,0 4,2 4,2 1,5 1,2 1,1 6,5 5,2 4,7 81 76 77<br />
P3 4,1 4,1 4,2 1,6 1,3 1,0 9,4 8,4 7,8 78 75 76<br />
P4 3,9 4,1 4,1 1,9 1,4 1,2 8,0 5,8 5,5 85 80 82<br />
P5 3,9 4,0 4,1 1,3 0,9 0,8 6,5 5,5 5,3 84 77 75<br />
P6 4,0 4,1 4,1 1,5 1,1 0,9 7,2 6,0 5,9 85 84 81<br />
P7 4,0 4,1 4,1 1,6 1,3 1,2 8,5 8,1 7,8 84 84 85<br />
C Ca Mg P<br />
g/dm 3 cmolc/dm 3 mg/dm 3<br />
P1 29,9 24,5 18,0 0,4 0,3 0,3 0,2 0,1 0,1 6,4 3,2 1,9<br />
P2 25,0 17,8 17,2 0,3 0,3 0,2 0,1 0,1 0,1 2,9 1,0 0,4<br />
P3 33,6 24,0 19,7 0,3 0,2 0,2 0,2 0,1 0,1 2,6 0,4 0,4<br />
P4 18,2 16,3 12,0 0,2 0,2 0,2 0,1 0,1 0,1 2,3 1,0 0,4<br />
P5 17,7 13,8 13,9 0,2 0,1 0,2 0,1 0,0 0,1 0,4 0,2 0,1<br />
P6 20,3 15,3 13,0 0,2 0,1 0,1 0,1 0,0 0,1 0,7 0,6 0,2<br />
P7 24,9 16,3 13,4 0,2 0,1 0,1 0,1 0,0 0,0 0,5 0,1 0,2<br />
*1 – 0-20 cm depth; 2 – 20-40 cm depth; 4-60 cm depth.<br />
The same was observed for available K (Mehlich I) as well as total <strong>and</strong> non ex<strong>change</strong>able (HNO3) (Table 2).<br />
The level of K total obtained was bellow to others in the south (Martins et al.. 2004, Nachtigalll <strong>and</strong> Vahl<br />
1989 <strong>and</strong> Melo 1994) but similar to observed to Cerrado region (Ritchey 1982). Since the non ex<strong>change</strong>able<br />
K has been considered a medium <strong>and</strong> long term reservoir farmer cannot afford to have this reservoir to<br />
supply K for these <strong>soil</strong> types. This suggests that K can be a limiting factor to pinus growth, fertilizer<br />
application need to be test. Phosphorus can also be problem since low <strong>and</strong> very low levels were obtained<br />
(Payn et al.. 1988).<br />
© 2010 19 th World Congress of Soil Science, Soil Solutions for a Changing World<br />
1 – 6 August 2010, Brisbane, Australia. Published on DVD.<br />
143
Table 2. Mean values (mg/kg) of total, non-ex<strong>change</strong>able (HNO3), Mehlich I, <strong>and</strong> ex<strong>change</strong>able K (ammonium<br />
acetate) for seven <strong>soil</strong> under pinus in the Jaguariaiva region – Brazil.<br />
Total HNO3 Mehlich I Ammonium acetate<br />
1* 2 3 1 2 3 1 2 3 1 2 3<br />
P1 117 138 147 33,0 24,3 25,5 20,5 12,7 10,7 14,8 9,3 5,5<br />
P2 250 357 357 30,5 23,0 24,0 14,6 7,8 7,8 12,0 4,5 3,3<br />
P3 197 196 192 39,5 28,0 21,5 21,5 13,7 12,7 21,5 10,8 5,5<br />
P4 319 315 360 31,5 25,3 26,5 12,7 8,8 5,9 9,3 4,8 2,5<br />
P5 98 103 107 13,8 10,5 9,8 12,7 7,8 7,8 8,0 3,3 4,3<br />
P6 168 213 192 18,0 14,8 11,5 10,7 5,9 5,9 8,3 4,3 4,3<br />
P7 109 164 97 25,0 19,0 15,5 16,6 11,7 7,8 17,0 10,3 6,8<br />
*1 – 0-20 cm depth; 2 – 20-40 cm depth; 4-60 cm depth.<br />
Litter <strong>and</strong> nutrients<br />
The amount of litter on <strong>Forest</strong> floor was affected by forest age with the plantations with 11 <strong>and</strong> 17 high<br />
values (Table 3). However, the age could not explain the high values observed site number 7. This fact could<br />
be related with <strong>soil</strong> fertility, but it was not possible to confirm give the influence of first plantation.<br />
The carbon concentration did not vary among sites so the amount of C retained on litter was direct related<br />
with total litter mass (Table 3). Very low concentration of P, K, Zn <strong>and</strong> Cu observed (Table 3) in our study<br />
indicated that the amount of nutrients on litter is small. Also, this fact can be result of low nutrients<br />
availability or leaching process (mobile elements). In opposite way, high level of Fe <strong>and</strong> Mn obtained can be<br />
result of very low <strong>soil</strong> pH. Theses fact can be also give by Zn deficiency which is very common under<br />
Cerrado condition.<br />
Table 3. Mean values for macro <strong>and</strong> micronutrients in litter for seven sites under pinus in the Jaguariaiva<br />
region – Brazil.<br />
Sites Age Litter C N P K Ca Mg Fe Mn Zn Cu<br />
years kg/ha g/kg mg/kg<br />
1 5 3404 472 6,7 0,77 0,50 3,44 0,80 297 605 6,9 4,48<br />
2 5 4347 465 7,1 0,73 0,55 2,64 0,91 437 177 3,6 3,26<br />
3 5 3541 473 7,6 0,67 0,70 3,49 0,70 419 416 10,9 4,16<br />
4 11 24656 470 10,5 0,73 0,45 0,80 0,11 526 107 4,5 4,17<br />
5 5 4093 479 8,0 0,58 0,56 0,80 0,76 422 1107 6,6 1,33<br />
6 17 13069 472 12,2 0,95 0,51 0,79 0,23 979 76 1,4 1,55<br />
7 5 16240 459 12,4 0,96 0,49 0,59 0,25 1075 78 1,2 1,73<br />
Conclusions<br />
Soil from Jaguariaiva region showed to be very acid, with low nutrients availability <strong>and</strong> K reserve. The litter<br />
showed to be very poor <strong>and</strong> also may not contribute to supply plant growth. Lime <strong>and</strong> fertilizer application<br />
may be necessary to reach similar yield from others states regions.<br />
Acknowledgments<br />
The authors wish to express their most sincere appreciation to Valor Florestal Company, in especial to <strong>Forest</strong><br />
Engineers Renato <strong>and</strong> Fabiane Vargas <strong>and</strong> technician Antonio (Mineiro), for contributing to conduct the<br />
sampling.<br />
References<br />
ABRAF (2007) Anuário estatístico: ano base 2006. ABRAF. Brasília, 80 p.<br />
Chaves R, de Q Corrêa GF (2005) Macronutrientes no sistema solo-Pinus caribea Morelet em plantios<br />
apresent<strong>and</strong>o amarelecimentos das acículas e morte de plantas. Revista Árvore 29(5), 691-700.<br />
Chaves R, de Q. e Corrêa GF (2003) Micronutrientes no sistema solo-Pinus caribea Morelet em plantios<br />
apresent<strong>and</strong>o amarelecimentos das acículas e morte de plantas. Revista Árvore 27(6), 769-778.<br />
Higa AR, Silva LD (2008) Situação atual e perspectivas do melhoramento genético de pínus e eucaliptos no<br />
Brasil. In: I Encontro Brasileiro de Silvicultura. 10 a 12 de novembro de 2008. Curitiba, Paraná – Br. –<br />
Piracicaba: IPEF/FUPEF/ PTSM. pp.105-115<br />
Mainarde GL, Schneider PR, Finger CA (1996) Produção de Pinus taeda L. na Região de Cambará do Sul,<br />
RS. Ciência Florestal 6(1), 39-52.<br />
Marques R, Motta ACV (2003) Análise química do solo par fins de fertilidade. In: Lima. M. R. (org.).<br />
Manual de Diagnóstico da Fertilidade e Manejo dos Solos Agrícolas. 2º ed. Curitiba: Departamento de<br />
Solos e Engenharia Agrícola. cap. 5, p. 82-101.<br />
© 2010 19 th World Congress of Soil Science, Soil Solutions for a Changing World<br />
1 – 6 August 2010, Brisbane, Australia. Published on DVD.<br />
144
Martins APL, Reissmann CB (2007) Material vegetal e as rotinas laboratoriais nos procedimentos químicoanalíticos.<br />
Scientia Agraria 8(1), 1-17.<br />
Martins R, Melo V de F; Serrat BM (2004) Reserva de mineral de potássio em solo dos Campos Gerais,<br />
estado do Paraná. Revista Ceres 51(296), 521-533.<br />
Mead DJ (1984) Diagnosis of nutrient deficiencies in plantations. In “Nutrition of Plantation <strong>Forest</strong>s”. (eds<br />
GD Bowen, EKS Nambiar) pp. 259-291. (Academic Press, London).<br />
Melo V deF (1994) Relação entre a reserva de solos e a produção e nutrientes em povoamentos de<br />
Eucalyptus saligna Smith, no Rio Gr<strong>and</strong>e do Sul. Viçosa. 145p. (Dissertação de mestrado).<br />
Nachtigall GRE, Vahl LC (1989) Formas de potássio em solos da região sul do estado do Rio Gr<strong>and</strong>e do Sul.<br />
Rev. Bras. Ci. Solo 13(1), 7-12.<br />
Reissmann CB (1981) Naehrelementversorgung und Wuchsleistung von Kiefernbestaenden in Suedbrasilien.<br />
Freiburg i. Br. Alemenha: Albert Ludwig Universitaet. Tese de Doutoramento. 159 p.<br />
Ritchey KD (1982) O potássio nos oxissolos e ultissolos dos trópicos. Piracicaba, Inst. da Potassa e Fosfato.<br />
(Boletim Técnico, 7).<br />
Rodriges CM (2005) Efeito da aplicação de resíduos da indústria de papel e celulose nos atributos químicos,<br />
físicos e biológicos do solo, na nutrição e biomassa do Pinus taeda L. Curitiba: UFPR. 109p.<br />
(Dissertação de mestrado).<br />
Vogel HLM (2003) Crescimento de Pinus taeda L. relacionado a doses de N, P e K e sua diagnose<br />
nutricional pelo DRIS. Rev. Ciência Florestal 13(1), 182-188.<br />
Wisniewski C, Reissmann CB (1996) Deposição de serapilheira e nutrients em plantios de Pinus taeda L. na<br />
região de Ponta Grossa – PR. Arq. Biol. Tecnol. 39(2), 435-442.<br />
© 2010 19 th World Congress of Soil Science, Soil Solutions for a Changing World<br />
1 – 6 August 2010, Brisbane, Australia. Published on DVD.<br />
145