Technical Analysis within a Fundamental Framework Jeff Hochman I
Technical Analysis within a Fundamental Framework Jeff Hochman I
Technical Analysis within a Fundamental Framework Jeff Hochman I

Create successful ePaper yourself
Turn your PDF publications into a flip-book with our unique Google optimized e-Paper software.
FIDELITY INTERNATIONAL<br />
<strong>Technical</strong> <strong>Analysis</strong> <strong>within</strong> a <strong>Fundamental</strong> <strong>Framework</strong><br />
<strong>Jeff</strong> <strong>Hochman</strong> I Director of <strong>Technical</strong> Research<br />
Frankfurt, 29. April 2009<br />
This presentation is for Investment Professionals only, and should not be relied upon by private investors
2<br />
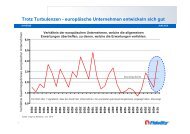
The more things change, the more they stay the same…<br />
…whether in 1934… …or in 2009!<br />
Chicago Tribune The Economist, WSJ, Wiedenroth’s<br />
Vorborse
3<br />
…and therefore our BEHAVIOR is often repeated!<br />
THEN<br />
UP HERE<br />
STOCKS<br />
BUYS BACK<br />
AND<br />
BULLISH<br />
TURNS<br />
ONE<br />
EVERY-<br />
AND<br />
OR TWO<br />
PERCENT<br />
RISE A<br />
THEY<br />
THEN<br />
PRICES FALL A<br />
PER-<br />
CENT OR<br />
DOWN HERE<br />
TWO IN A<br />
DAY OR<br />
TWO AND<br />
EVERY-<br />
ONE<br />
TURNS<br />
BEARISH<br />
ON THE<br />
MARKET<br />
AND<br />
SELLS<br />
STOCKS
4<br />
Stock markets are semi-efficient at discounting the future…<br />
40%<br />
30%<br />
20%<br />
10%<br />
0%<br />
-10%<br />
-20%<br />
-30%<br />
-40%<br />
-50%<br />
0.90<br />
0.80<br />
0.70<br />
0.60<br />
0.50<br />
0.40<br />
0.30<br />
0.20<br />
0.10<br />
0.00<br />
-0.10<br />
Dec-94<br />
Dec-95<br />
MSCI AC EUROPE - 12MTH FWD WTD EPS and 12m Fwd<br />
Earnings Relatives<br />
MSEUROL 6 month(s) % chg.<br />
Europe Fwd EPS 6 month(s) % chg.<br />
lagged by 5 months (RHS)<br />
Rolling 3 Year<br />
Correlation<br />
Source: Datastream, FIL<br />
Dec-96<br />
Dec-97<br />
Dec-98<br />
Dec-99<br />
Dec-00<br />
Dec-01<br />
Dec-02<br />
Dec-03<br />
Correl.= 0.5<br />
Dec-04<br />
Dec-05<br />
Dec-06<br />
Dec-07<br />
Dec-08<br />
40%<br />
30%<br />
20%<br />
10%<br />
0%<br />
-10%<br />
-20%<br />
-30%<br />
-40%<br />
-50%<br />
0.90<br />
0.80<br />
0.70<br />
0.60<br />
0.50<br />
0.40<br />
0.30<br />
0.20<br />
0.10<br />
0.00<br />
-0.10<br />
It’s a FACT…In the long run,<br />
EARNINGS are the main<br />
driver of stock market returns.<br />
BUT REMEMBER, the long<br />
run is comprised of many<br />
shorter runs!<br />
There are often significant<br />
periods of disconnect between<br />
earnings and actual stock<br />
price movements.
5<br />
…whether at the macro OR micro level<br />
Consensus GDP forecasts & Equity Market<br />
1800<br />
1600<br />
1400<br />
1200<br />
1000<br />
800<br />
600<br />
Source: Reuters, MF Global, FIL<br />
Q1 06 Q1 07 Q1 08 Q1 09 Q1 10<br />
Eurozone Real GDP (% y/y, RH Scale) FTSE Eurofirst 300 Price Index (RH Scale)<br />
4<br />
3<br />
2<br />
1<br />
0<br />
-1<br />
-2<br />
-3<br />
-4
6<br />
Perhaps Anthony Bolton says it best…<br />
Source: Anthony Bolton, “Investing Against the Tide”, April 2009<br />
“The way I look at technical analysis today is as a<br />
framework or overlay into which I put my fundamental<br />
bets on individual stocks. I see it as a discipline for<br />
my stock picking.<br />
What I mean by this is that, if the technical analysis<br />
confirms my fundamental views, I may take a bigger bet<br />
than I would do otherwise.<br />
However, if the technical analysis doesn’t confirm my<br />
fundamental positive view, it makes me review my<br />
investment thesis on a company, for example checking<br />
that there aren’t negative factors we have overlooked. If<br />
my conviction is very strong I will often ignore the<br />
technical view; at other times if it conflicts I will take a<br />
smaller bet or reduce my position”.
7<br />
…a picture paints a thousand words, and them some more<br />
Source: Anthony Bolton, “Investing Against the Tide”, April 2009<br />
“Although at heart I’m a fundamentalist I have definitely<br />
found that the combination of two approaches seems to<br />
work better than just one on its own.<br />
A few years ago I spoke at a technical analysis<br />
conference and said that if I was on a desert island and<br />
was only allowed one input for my investment decisions,<br />
it would be an up-to-date chart book. I think today<br />
I would still be of the same opinion.<br />
The trouble with fundamental data is that I can’t<br />
single out only one source that on its own would be<br />
sufficient. I could, if pushed, run a portfolio with<br />
just a chart book…”
8<br />
When to SELL as important as when to BUY!<br />
Source: Bloomberg Data
9<br />
How & Why does Fidelity use <strong>Technical</strong> <strong>Analysis</strong>?<br />
<strong>Technical</strong> <strong>Analysis</strong> @ Fidelity is employed as a value added Tactical tool to<br />
our Strategic fundamental research<br />
Charts provide a visual “Reality Check” to the fundamental assumptions made<br />
by our PM’s and Analysts<br />
Main focus is on Stock picking, but also integral in the Asset Allocation<br />
process<br />
Primary idea is to increase our level of conviction in the decision making<br />
process – after all, it is a game of probabilities!<br />
<strong>Technical</strong> <strong>Analysis</strong> therefore provides an element<br />
of Risk Control for all our fund offerings
10<br />
Equities have likely reached the “Tipping Point”<br />
The Markets<br />
Wow, I feel GREAT<br />
Point of<br />
Maximum<br />
about this<br />
financial RISK<br />
investment!<br />
Euphoria<br />
Anxiety<br />
Temporary setback, I’m a long term<br />
investor…<br />
Optimism<br />
Excitement<br />
Thrill<br />
2006<br />
Maybe the markets just<br />
aren’t for me<br />
Denial<br />
Sentiment is now moving up the emotional<br />
pendulum from the “quicksand phase” to<br />
steadily climbing a new Wall of Worry<br />
Fear<br />
Desperation<br />
Panic<br />
2008/09<br />
2002/03<br />
Capitulation<br />
Despondency<br />
Point of Maximum<br />
financial<br />
OPPORTUNITY<br />
Hope<br />
Depression<br />
Optimism<br />
Relief
11<br />
Love goes, cash stays, and equities will finally bottom…<br />
NDR Total Market Value vs Money Market Fund Assets / NDR Total Market Value<br />
NDR Total Market Value Gain / Annum When:<br />
Money Market Fund Assets/ Gain/ % of<br />
NDR Total Market Value Annum Time<br />
* Above 10.80<br />
99 89.4<br />
10.80 and Below<br />
-125 106<br />
3541<br />
2907<br />
2386<br />
1959<br />
1608<br />
1320<br />
1083<br />
889<br />
730<br />
599<br />
492<br />
404<br />
331<br />
272<br />
223<br />
183<br />
150<br />
123<br />
101<br />
(S423)<br />
1055.64<br />
1981<br />
1982<br />
276.66<br />
Source: NDR, ICI<br />
196.81<br />
1983<br />
1984<br />
1985<br />
1986<br />
1987<br />
1988<br />
NDR Total Market Value<br />
(Billions, Scale Right)<br />
3/31/2009 = 8916.7<br />
613.84<br />
570.10<br />
Monthly Data 10/31/1980 - 3/31/2009 (Log Scale)<br />
17102.05<br />
9715.02 9322.61<br />
2382.00<br />
Money Market Fund Assets / NDR Total Market Value<br />
(Scale Right)<br />
3/31/2009 = 43.0%<br />
1989<br />
1990<br />
1991<br />
1992<br />
1993<br />
1994<br />
1995<br />
1996<br />
1997<br />
1998<br />
1862.00<br />
18082.49<br />
Total Money Market Fund Assets<br />
(Scale Left In Billions)<br />
3/31/2009 = $3834<br />
1999<br />
2000<br />
2001<br />
2002<br />
2003<br />
2004<br />
High Liquidity<br />
Low Liquidity<br />
2005<br />
2006<br />
2007<br />
2008<br />
2009<br />
18646<br />
15978<br />
13692<br />
11733<br />
10054<br />
8615<br />
7383<br />
6326<br />
5421<br />
4645<br />
3981<br />
3411<br />
2923<br />
2505<br />
2146<br />
1839<br />
1576<br />
1351<br />
1157<br />
43.9<br />
38.3<br />
33.4<br />
29.1<br />
25.4<br />
22.2<br />
19.3<br />
16.9<br />
14.7<br />
12.8<br />
11.2<br />
9.8<br />
8.5<br />
7.4<br />
All of the net selling<br />
the past 18 months<br />
has left a dramatic<br />
pile of cash on the<br />
sidelines, especially<br />
as a % of the total<br />
value of equities.<br />
Indeed, the ratio of<br />
cash to equities is<br />
now near 43%, or 2x<br />
the levels at the<br />
market lows in 1982,<br />
1991, and 2003.<br />
So if near everyone<br />
has already sold, is it<br />
not a good time to<br />
BUY???
12<br />
Risk spreads continue to moderate, a precursor to recovery…<br />
Emerging Market spreads<br />
3m Swap spreads<br />
3m LIBOR<br />
CDS spreads<br />
Source: Bloomberg<br />
Stabilizing
13<br />
Earnings will continue to fall, but this is now “old news”…<br />
98<br />
88<br />
79<br />
70<br />
63<br />
56<br />
50<br />
45<br />
40<br />
36<br />
32<br />
29<br />
26<br />
23<br />
21<br />
19<br />
17<br />
15<br />
13<br />
12<br />
11<br />
10<br />
9<br />
8<br />
7<br />
6<br />
40<br />
30<br />
20<br />
10<br />
0<br />
-10<br />
-20<br />
-30<br />
FID84<br />
World Earnings and Growth Rate<br />
Consensus growth rates<br />
% Over Or Under<br />
Trendline Growth<br />
* Trailing 12-Month Reported Earnings Per Share<br />
Weak Earnings<br />
Monthly Data 1/31/1970 - 3/31/2009 (Log Scale)<br />
Strong Earnings<br />
MSCI World Earnings Growth * = 6.1% per annum<br />
( )<br />
Trendline Growth = 6.6% per annum<br />
( )<br />
Trendline based on linear regression = average<br />
growth weighted for extreme observations.<br />
(Line will change very slightly with new updates)<br />
3/31/2009 = -16.7%<br />
1970 1975 1980 1985 1990 1995 2000 2005<br />
Source: NDR, Goldman Sachs<br />
98<br />
88<br />
79<br />
70<br />
63<br />
56<br />
50<br />
45<br />
40<br />
36<br />
32<br />
29<br />
26<br />
23<br />
21<br />
19<br />
17<br />
15<br />
13<br />
12<br />
11<br />
10<br />
9<br />
8<br />
7<br />
6<br />
40<br />
30<br />
20<br />
10<br />
0<br />
-10<br />
-20<br />
-30
14<br />
Global EPS estimates are becoming “less bad”, which is “good”<br />
40%<br />
20%<br />
0%<br />
-20%<br />
-40%<br />
-60%<br />
-80%<br />
Number of upgrades minus downgrades / total number of estimates (2-week rolling avg)<br />
Pan-Europe Index<br />
JP<br />
Asia ex-Japan Index<br />
Emerging Markets Index<br />
US<br />
Falling EPS should not<br />
come as a major surprise<br />
to anyone<br />
anymore, so maybe<br />
the surprise will be on<br />
the upside…<br />
Jan-07 May-07 Sep-07 Jan-08 May-08 Sep-08 Jan-09 May-09<br />
Source: Datastream, FIL, FactSet, MSCI, Soc Gen<br />
Net Downgrades<br />
Net Upgrades<br />
40%<br />
20%<br />
0%<br />
-20%<br />
-40%<br />
-60%<br />
-80%
15<br />
Trends are all a matter of proper perspective!<br />
As my grandfather once told me, the<br />
secret to investing is just living long<br />
enough…<br />
1929<br />
Bear<br />
Source: Bloomberg<br />
Bull<br />
Bear<br />
80 year secular uptrend from 1931/32 lows +7% pa<br />
% decline from S&P 500 Quarterly peaks<br />
Bull<br />
Bear<br />
The average secular bear market<br />
has lasted about 14 years, so we<br />
likely still have a few years to go…<br />
2009
16<br />
Is the “V” flashing Victory sign for the Bulls?<br />
Although we like to see large base<br />
patterns to help raise our level of<br />
conviction, monthly “V” shaped<br />
reversals do occur more often than we<br />
like to admit.<br />
Source: Bloomberg<br />
2000 -2003<br />
- 60%<br />
36 months<br />
2007 – 2009<br />
-61%<br />
18 months<br />
It sure feels that March/April has marked<br />
a significant cyclical turning point.
17<br />
A cyclical bull market <strong>within</strong> a secular bear has likely begun…<br />
Source: Bloomberg<br />
The past 6 week +25% sharp advance was in line with<br />
previous bear market rallies, yet was set up by a host of<br />
positive internal breadth divergences. If March was the<br />
low, then current set back should be limited in scope,<br />
and indicators stay at high end of recent ranges.<br />
Minimum<br />
H2 target
18<br />
After a pause in the action, Emerging Markets are re - emerging<br />
240<br />
220<br />
200<br />
180<br />
160<br />
140<br />
120<br />
100<br />
80<br />
60<br />
40<br />
Source: Datastream<br />
GLOBAL REGIONAL EQUITY RELATIVES<br />
The starting point one chooses means everything<br />
for performance!<br />
Beginning at the peak of the 2000 bull market, the Emerging<br />
Markets and Asia did extremely well, only to do poorly during the<br />
2008 downturn. But since November 2008 they have emerged<br />
again, outperforming even as the global economy has worsened.<br />
This trend seems set to continue into H2 2009.<br />
Europe<br />
UK<br />
Pac basin x jp<br />
US<br />
Japan<br />
Emerging Markets<br />
Since 01/01/09<br />
2000 2001 2002 2003 2004 2005 2006 2007 2008 2009<br />
22/4/09
19<br />
There’s been nowhere to run baby, nowhere to hide…<br />
30<br />
20<br />
10<br />
Agg<br />
cash infl FI<br />
0<br />
-10<br />
-20<br />
-30<br />
-40<br />
-50<br />
Annualized Returns<br />
L/S<br />
HF<br />
FoF<br />
BAL<br />
PORT<br />
EMBI<br />
HY<br />
ALT<br />
CNV<br />
Gold<br />
comm<br />
LG<br />
SPX<br />
Japan<br />
EQTY SG<br />
RUT<br />
LV EAFE<br />
EUR<br />
SV<br />
The Efficient Frontier<br />
The 2007-2009 Bear Market<br />
Compound Annual Return vs.<br />
Standard Deviation of Monthly Return.<br />
PORT: 50/30/20 model portfolio<br />
(stocks/bonds/alternatives).<br />
0 1 2 3 4 5 6 7 8 9 10 11 12<br />
Source: Ibbotson Associates, NAREIT, Lehman Bros., FMR Co.<br />
This bear market has distinguished itself in that<br />
historical correlations have been thrown out<br />
the door, with very little room to manoeuvre<br />
(except Gold). This is causing everyone to<br />
revaluate former beliefs about inter market<br />
relationships and economic principles.<br />
EM<br />
REITs<br />
Volatility<br />
of Returns
20<br />
Intermediate momentum suggests yields may fall again…<br />
The directional correlation between bond markets<br />
is also very high, with currency movements often the big<br />
determinant of performance.<br />
Quantitative Easing policies might keep yields<br />
lower for now, but eventually they are set to rise,<br />
maybe back to mid 2008 levels.<br />
Source: Bloomberg
21<br />
…and High Yield is beginning to show strength<br />
Despite growing fears of increasing default rates, HY<br />
spreads continue to contract somewhat, especially as<br />
equities have rallied, suggesting a more risk taking<br />
appetite amongst investors.<br />
35<br />
30<br />
25<br />
20<br />
15<br />
10<br />
5<br />
15/4/09<br />
1998 1999 2000 2001 2002 2003 2004 2005 2006 2007 2008 2009<br />
Source: DATASTREAM<br />
1.50<br />
1.40<br />
1.30<br />
1.20<br />
1.10<br />
1.00<br />
0.90<br />
0.80<br />
0.70<br />
0.60<br />
x10 -3<br />
BARCLAYS HIGH YIELD BANKING - RED. YIELD<br />
BARCLAYS HIGH YIELD TELECOMM. - RED. YIELD<br />
BARCLAYS HIGH YIELD TECHNOLOGY - RED. YIELD<br />
BARCLAYS HIGH YIELD UTILITY - RED. YIELD<br />
US HY SPREADS(R.H.SCALE)<br />
EUROPEAN HY SPREADS (R.H.SCALE)<br />
INVERSE S&P 500<br />
HY Europe<br />
S&P (inverted)<br />
HY US<br />
2007 2008 2009<br />
15/4/09<br />
30<br />
25<br />
20<br />
15<br />
10<br />
5<br />
0
22<br />
Busted bubble, regroup, reform, reflate, and rise again…<br />
400<br />
350<br />
300<br />
250<br />
200<br />
150<br />
100<br />
50<br />
0<br />
Source: DATASTREAM<br />
The Super Cycle is dead, long live the Super Cycle!<br />
Despite the strong correction past 18 months,<br />
commodity prices are stabilizing and should<br />
tend to move higher next several years.<br />
CRB Index<br />
CRB Energy<br />
CRB Grains<br />
CRB Industrials<br />
CRB Livestock<br />
CRB Precious Metals<br />
CRB Softs<br />
EMG Markets Relative<br />
2001 2002 2003 2004 2005 2006 2007 2008 2009<br />
23/4/09<br />
400<br />
350<br />
300<br />
250<br />
200<br />
150<br />
100<br />
50<br />
0
23<br />
Though both have fallen lately, secular trends favour commodities…<br />
10<br />
9<br />
8<br />
7<br />
6<br />
5<br />
4<br />
3<br />
2<br />
1<br />
A long-Term History of Stocks & Commodities<br />
The average commodities secular bull market<br />
has lasted about 18 years, which would mean<br />
we are right now just in the middle of it.<br />
1800 1812 1824 1836 1848 1860 1872 1884 1896 1908 1920 1932 1944 1956 1968 1980 1992 2004<br />
Annual Data. Source: FMRCo | Source: Haver Analytics, FactSet, FMR<br />
DJIA (log)<br />
Recessions<br />
DJIA/CRB<br />
Secular Trend: Stocks<br />
Secular Trend: Commodities<br />
`<br />
100<br />
10<br />
1<br />
0<br />
0
24<br />
In summary…<br />
Whether in a Bull Market or Bear, <strong>Technical</strong> <strong>Analysis</strong> is an efficient and<br />
objective method of determining if one’s fundamental beliefs are translated<br />
into actual money making opportunities <strong>within</strong> our portfolios.<br />
Charts therefore provide a visual “Reality Check” and help keep one honest<br />
in all market environments.<br />
Very good chance that markets are now transitioning into a cyclical Bull<br />
market <strong>within</strong> a secular bear, with a promising H2 2009 outlook.<br />
Therefore, tilting portfolios to favour more Offense vs. Defense in both stock<br />
and asset allocation selection.
25<br />
Rechtliche Hinweise<br />
Dieses Dokument ist nur für professionelle Investoren und nicht für Privatanleger bestimmt.<br />
Diese Präsentation darf ohne vorherige Erlaubnis weder reproduziert oder veröffentlicht werden. Eine<br />
Anlageentscheidung sollte in jedem Fall auf Grundlage der Prospekte, des letzten Geschäftsberichtes<br />
und – sofern nachfolgend veröffentlicht – des jüngsten Halbjahresberichtes getroffen werden. Diese<br />
Unterlagen sind die allein verbindliche Grundlage des Kaufes. Fidelity veröffentlicht ausschließlich<br />
produktbezogene Informationen und erteilt keine Anlageempfehlung. Die Prospekte, den Geschäftsbericht<br />
und den Halbjahresbericht erhalten Sie kostenlos bei FIL Investment Services GmbH, Postfach<br />
200237, D-60606 Frankfurt/ Main oder über www.fidelity.de. Anleger in Österreich erhalten diese<br />
Dokumente kostenlos bei FIL Investments International – Zweigniederlassung Wien, Schottenring 16,<br />
A-1010 Wien oder bei der österreichischen Zahlstelle Bank Austria Creditanstalt AG, Vordere Zollamtsstraße<br />
13, A-1030 Wien. Der Wert der Anteile sowie die Höhe der Erträge kann schwanken und<br />
wird nicht garantiert. Fidelity, Fidelity International und das Pyramiden-Logo sind eingetragene<br />
Warenzeichen von FIL Limited. Die genannten Unternehmen dienen zu rein illustrativen Zwecken.<br />
Dies stellt keine Aufforderung zum Kauf oder Verkauf der jeweiligen Werte dar, und die genannten<br />
Unternehmen können ggfls. nicht zu den Fondsbeständen zählen. Herausgeber für Deutschland: FIL<br />
Investment Services GmbH, Postfach 200237, D-60606 Frankfurt/ Main. Herausgeber für Österreich:<br />
FIL Investments International – Zweigniederlassung Wien, Schottenring 16, A-1010 Wien. Für<br />
institutionelle Investoren in Deutschland gilt als Herausgeber: FIL Investment Management GmbH,<br />
Kastanienhöhe 1, D-61476 Kronberg im Taunus. Stand, falls nicht anders vermerkt: April 2009.<br />
Alle Angaben ohne Gewähr. MK4372
26<br />
Rechtliche Hinweise<br />
Dieses Dokument ist nur für professionelle Investoren und nicht für Privatanleger bestimmt.<br />
Diese Präsentation darf ohne vorherige Erlaubnis weder reproduziert oder veröffentlicht werden. Eine<br />
Anlageentscheidung sollte in jedem Fall auf Grundlage der Prospekte, des letzten Geschäftsberichtes und –<br />
sofern nachfolgend veröffentlicht – des jüngsten Halbjahresberichtes getroffen werden. Diese Unterlagen<br />
sind die allein verbindliche Grundlage des Kaufes. Fidelity veröffentlicht ausschließlich produktbezogene<br />
Informationen und erteilt keine Anlageempfehlung. Die Prospekte, den Geschäftsbericht und den<br />
Halbjahresbericht erhalten Sie kostenlos bei FIL Investment Services GmbH, Postfach 200237, D-60606<br />
Frankfurt/ Main oder über www.fidelity.de. Anleger in Österreich erhalten diese Dokumente kostenlos bei<br />
FIL Investments International – Zweigniederlassung Wien, Schottenring 16, A-1010 Wien oder bei der<br />
österreichischen Zahlstelle Bank Austria Creditanstalt AG, Vordere Zollamtsstraße 13, A-1030 Wien.<br />
Der Wert der Anteile sowie die Höhe der Erträge kann schwanken und wird nicht garantiert. Fidelity, Fidelity<br />
International und das Pyramiden-Logo sind eingetragene Warenzeichen von FIL Limited. Die genannten<br />
Unternehmen dienen zu rein illustrativen Zwecken. Dies stellt keine Aufforderung zum Kauf oder Verkauf der<br />
jeweiligen Werte dar, und die genannten Unternehmen können ggfls. nicht zu den Fondsbeständen zählen.<br />
Herausgeber für Deutschland: FIL Investment Services GmbH, Postfach 200237, D-60606 Frankfurt/ Main.<br />
Herausgeber für Österreich: FIL Investments International – Zweigniederlassung Wien, Schottenring 16, A-<br />
1010 Wien. Für institutionelle Investoren in Deutschland gilt als Herausgeber: FIL Investment Management<br />
GmbH, Kastanienhöhe 1, D-61476 Kronberg im Taunus. Stand, falls nicht anders vermerkt: April 2009.<br />
Alle Angaben ohne Gewähr. MK4372