Detailed due-diligence - Fidelity Investments
Detailed due-diligence - Fidelity Investments
Detailed due-diligence - Fidelity Investments

Create successful ePaper yourself
Turn your PDF publications into a flip-book with our unique Google optimized e-Paper software.
FIDELITY INTERNATIONAL<br />
Focus on favourable risk/reward<br />
Thomas Fraenkel-Thonet I Portfolio Manager<br />
Frankfurt, 29. April 2009<br />
This presentation is for Investment Professionals only, and should not be relied upon by private investors
2<br />
Adding value over the long-term<br />
Cumulative return (%)<br />
FIDELITY INTERNATIONAL<br />
10<br />
0<br />
-10<br />
-20<br />
-30<br />
-40<br />
-50<br />
-34.9<br />
-40.2<br />
-40.2<br />
Fund Benchmark<br />
-42.7<br />
1 1 1 1<br />
Source: FIL & Standard & Poor’s, NAV to NAV, based in euros, gross income reinvested, all data to 31/03/2009. Fund launched on 16/09/2002. Benchmark = MSCI Europe<br />
-12.1<br />
-15.4<br />
1 Year 3 Years 5 Years Since Launch<br />
Please note that past performance is not a guide to future performance<br />
5.3<br />
-4.2
3<br />
Differentiation of FF European Larger Companies Fund<br />
FIDELITY INTERNATIONAL<br />
“Market Focus”<br />
Earnings above<br />
expectations<br />
Short-term catalyst<br />
Follow economic trends<br />
FF European Larger<br />
Companies Fund<br />
Long-term potential of<br />
business franchise<br />
<strong>Detailed</strong> <strong>due</strong>-<strong>diligence</strong><br />
Diversification / stock<br />
selection<br />
Weight (%)<br />
45%<br />
40%<br />
35%<br />
30%<br />
25%<br />
20%<br />
15%<br />
10%<br />
5%<br />
0%<br />
€0 -<br />
€1bn<br />
€1 -<br />
€10bn<br />
€10 -<br />
€50bn<br />
Fund Benchmark<br />
+€50bn<br />
Source: FIL Limited Market cap as at 31/03/2009. Benchmark = MSCI Europe
4<br />
Long-term potential of business franchise<br />
FIDELITY INTERNATIONAL<br />
Short-term catalyst<br />
“Market Focus”<br />
Earnings above expectations<br />
Follow economic trends<br />
FF European Larger Companies Fund<br />
Long-term potential of business<br />
franchise<br />
<strong>Detailed</strong> <strong>due</strong>-<strong>diligence</strong><br />
Diversification / stock selection
5<br />
Long-term potential of business franchise:<br />
Selecting quality companies<br />
FIDELITY INTERNATIONAL<br />
Evaluate track record of<br />
management<br />
Determine edge in<br />
evaluating market<br />
inefficiency<br />
Determine sustainability<br />
of business model<br />
Decision<br />
Decision making<br />
making process<br />
process<br />
Assess risk policy of<br />
company<br />
Focus on companies<br />
with multiple growth<br />
options<br />
Estimate valuation<br />
discount of the stock
6<br />
Companies with sustainable business models<br />
Relative return rebased<br />
Relative return rebased<br />
150<br />
140<br />
130<br />
120<br />
110<br />
100<br />
90<br />
80<br />
140<br />
130<br />
120<br />
110<br />
100<br />
FIDELITY INTERNATIONAL<br />
ARYZTA (IAWS)<br />
Apr 06 Oct 06 Apr 07 Oct 07 Apr 08 Oct 08 Apr 09<br />
90<br />
80<br />
70<br />
NEOPOST<br />
60<br />
Apr 06 Oct 06 Apr 07 Oct 07 Apr 08 Oct 08 Apr 09<br />
Bakery products<br />
Strong pricing power<br />
High margin product for convenience stores<br />
Recently merged<br />
Franking machines<br />
Duopoly with Pitney Bowes<br />
Strong revenue stream<br />
Decertification in the US<br />
Source: DataStream, 03/04/2006 to 03/04/2009, rebased, share price relative to the MSCI Europe index, total returns, in euros<br />
N.B. Reference to specific securities is included for the purpose of illustration only and should not be construed as a recommendation to buy or sell these securities.
7<br />
Companies that have performed well over the<br />
longer term<br />
Relative return rebased<br />
Relative return rebased<br />
170<br />
160<br />
150<br />
140<br />
130<br />
120<br />
110<br />
100<br />
90<br />
80<br />
FIDELITY INTERNATIONAL<br />
ROCHE<br />
Apr 06 Oct 06 Apr 07 Oct 07 Apr 08 Oct 08 Apr 09<br />
150<br />
140<br />
130<br />
120<br />
110<br />
100<br />
REED ELSEVIER<br />
Key pharmaceutical stock<br />
Misunderstood franchise<br />
Strong product pipeline<br />
Defensively positioned<br />
Academic, scientific publishing<br />
Subscription model<br />
Steady income stream<br />
Consolidating its position<br />
90<br />
Apr 06 Oct 06 Apr 07 Oct 07 Apr 08 Oct 08 Apr 09<br />
Source: DataStream, 03/04/2006 to 03/04/2009, rebased, share price relative to the MSCI Europe index, total returns, in euros<br />
N.B. Reference to specific securities is included for the purpose of illustration only and should not be construed as a recommendation to buy or sell these securities.
8<br />
<strong>Detailed</strong> <strong>due</strong>-<strong>diligence</strong><br />
FIDELITY INTERNATIONAL<br />
Short-term catalyst<br />
“Market Focus”<br />
Earnings above expectations<br />
Follow economic trends<br />
FF European Larger Companies Fund<br />
Long-term potential of business<br />
franchise<br />
<strong>Detailed</strong> <strong>due</strong>-<strong>diligence</strong><br />
Diversification / stock selection
9<br />
<strong>Detailed</strong> <strong>due</strong>-<strong>diligence</strong>:<br />
Working with a team of research analysts world-wide<br />
FIDELITY INTERNATIONAL<br />
FMR Co & Pyramis<br />
Americas (Boston)<br />
149 Portfolio Managers<br />
353 Research Professionals<br />
Local market coverage<br />
Proprietary research<br />
Analysts manage industry / country funds<br />
Pan Europe<br />
66 Portfolio Managers<br />
95 Research Professionals<br />
Team France<br />
3 Portfolio Managers<br />
2 Research Professional<br />
Team Italy<br />
1 Portfolio Manager<br />
Main investment offices in London, Tokyo, Hong Kong & Boston<br />
with sub-investment offices in Paris, Frankfurt, Milan, Mumbai,<br />
Seoul, Singapore, Sydney & Taipei<br />
Team Germany<br />
3 Portfolio Managers<br />
1 Research Professional<br />
Team India<br />
3 Portfolio Managers<br />
7 Research Professionals<br />
<strong>Fidelity</strong> International (FIL)<br />
Team Korea<br />
2 Portfolio Managers<br />
3 Research Professionals<br />
Team Taiwan<br />
3 Portfolio Managers<br />
Team Singapore<br />
4 Portfolio Managers<br />
3 Research Professionals<br />
Japan<br />
17 Portfolio Managers<br />
35 Research Professionals<br />
Pacific ex Japan<br />
27 Portfolio Managers<br />
38 Research Professionals<br />
Team Australia<br />
2 Portfolio Managers<br />
5 Research Professionals<br />
NB: Teams France, Germany and Italy are constituents of the Pan European total. Teams Australia, India, Korea, Singapore & Taiwan are constituents of the Pacific ex Japan total.<br />
These figures reflect the resources of FMR LLC, a U.S. company, and its subsidiaries, and the resources of FIL Limited, a non-U.S. company and affiliate, and its subsidiaries.<br />
Includes Equity, Bonds, Real Estate, Multimanager, Quants, Derivatives and Technical analysts. Source: FMR LLC, Pyramis Global Advisors, FIL Limited, as of 31 December 2008.<br />
Data is unaudited. Research Professionals include both analysts and associates.
10<br />
<strong>Detailed</strong> <strong>due</strong>-<strong>diligence</strong>:<br />
Portfolio construction around three basic pillars<br />
FIDELITY INTERNATIONAL<br />
Analyst<br />
400 – 500<br />
Ideas<br />
Portfolio of<br />
50 – 100 stocks<br />
Investment Decision<br />
Company<br />
&<br />
Management<br />
Visits<br />
PM Due<br />
Diligence<br />
Investment Universe of 1,500 stocks
11<br />
<strong>Detailed</strong> <strong>due</strong>-<strong>diligence</strong>:<br />
Industry team structure unchanged since Dec-06 (1)<br />
Large Cap Team<br />
13 analysts<br />
Mid Cap Team<br />
31 analysts<br />
Small Cap Team<br />
3 analysts<br />
FIDELITY INTERNATIONAL<br />
Emerging Market Team<br />
5 analysts<br />
Small Cap Generalists<br />
2 analysts<br />
Country Analyst Team<br />
3 analysts<br />
Total analysts: 57 (1)<br />
Total DoRs: 5<br />
Natural<br />
resources &<br />
utilities<br />
Healthcare Industrials Financials TMT Consumer<br />
Team leader Team leader Team leader Team leader Team leader Team leader<br />
9 analysts (2) 3 analysts 14 analysts (2) 10 analysts 8 analysts 9 analysts<br />
Analysts work within industry teams, co-ordinated by Industry Team Leaders.<br />
Approx mkt<br />
cap range<br />
>$10 billion<br />
$0.5-10 Billion<br />
$1.0 Billion<br />
Structure provides industry perspective and support, while helping spread knowledge and best<br />
practice between industry teams.<br />
Coverage approach and universe tailored by market cap/ liquidity/ ownership level.<br />
Typical stock<br />
number<br />
(1) Chart shows analyst positions. Number of analysts in the team at any time may be more or less than number of positions<br />
(2) One emerging EMEA analyst is in both the resources and industrials teams<br />
Source: FIL Limited, 31/03/2009<br />
7-20<br />
25-50<br />
>200<br />
25-60
12<br />
Diversification / stock selection<br />
FIDELITY INTERNATIONAL<br />
Short-term catalyst<br />
“Market Focus”<br />
Earnings above expectations<br />
Follow economic trends<br />
FF European Larger Companies Fund<br />
Long-term potential of business<br />
franchise<br />
<strong>Detailed</strong> <strong>due</strong>-<strong>diligence</strong><br />
Diversification / stock selection
13<br />
Diversification / stock selection:<br />
Stock picking is diversified across sectors<br />
ROCHE<br />
CRH<br />
ARYZTA<br />
RYANAIR<br />
AXA<br />
FIDELITY INTERNATIONAL<br />
EXPERIAN<br />
NOVARTIS<br />
Name<br />
REED ELSEVIER<br />
DEUTSCHE BOERSE<br />
INTESA SANPAOLO<br />
HEALTHCARE<br />
MATERIALS<br />
INDUSTRIALS<br />
FINANCIALS<br />
FINANCIALS<br />
INDUSTRIALS<br />
FINANCIALS<br />
HEALTHCARE<br />
Source: FIL Ltd as at 31/03/2009. Benchmark = MSCI Europe.<br />
Sector<br />
CONSUMER STAPLES<br />
CONSUMER DISCRETIONARY<br />
Fund %<br />
7.0<br />
4.9<br />
4.3<br />
4.1<br />
4.2<br />
3.6<br />
3.7<br />
2.8<br />
3.2<br />
4.6<br />
Benchmark %<br />
2.2<br />
0.3<br />
0.0<br />
0.0<br />
0.4<br />
0.2<br />
0.3<br />
0.2<br />
0.5<br />
2.1<br />
Relative%<br />
4.7<br />
4.6<br />
4.3<br />
4.1<br />
3.8<br />
3.4<br />
3.4<br />
2.7<br />
2.7<br />
2.5
14<br />
Diversification / stock selection:<br />
Stock picking is diversified across sectors<br />
Weight (%)<br />
FIDELITY INTERNATIONAL<br />
20%<br />
18%<br />
16%<br />
14%<br />
12%<br />
10%<br />
8%<br />
6%<br />
4%<br />
2%<br />
0%<br />
Financials<br />
Industrials<br />
Health Care<br />
Consumer<br />
Staples<br />
Source: FIL Ltd, MSCI Groups as at 31/03/2009. Benchmark = MSCI Europe<br />
Energy<br />
Consumer<br />
Disc.<br />
Materials<br />
Fund Benchmark<br />
Telecoms<br />
IT<br />
Utilities<br />
Cash
15<br />
Constant risk monitoring<br />
FIDELITY INTERNATIONAL<br />
Portfolio<br />
Review<br />
PMS Reports<br />
Frequency<br />
Quarterly<br />
Monthly<br />
Daily, etc.<br />
Objectives<br />
Fund review with Chief<br />
Investment Officer<br />
Investment Risk Oversight<br />
Committee<br />
Quantitative Portfolio Review<br />
Risks monitored daily<br />
by portfolio manager<br />
Discussion<br />
Performance<br />
Risk profile<br />
Ratings of stocks held<br />
Largest bet stocks<br />
Sector allocation bets<br />
Concentration of portfolio<br />
Liquidity of holdings<br />
Discuss investment decisions made during<br />
the months<br />
Review risk measures and dispersion<br />
Quant screening developed for risk<br />
monitoring<br />
Stock specific<br />
Sector allocation<br />
Regional allocation
16<br />
Differentiation of FF European Larger Companies Fund<br />
FIDELITY INTERNATIONAL<br />
Short-term catalyst<br />
“Market Focus”<br />
Earnings above expectations<br />
Follow economic trends<br />
FF European Larger Companies Fund<br />
Long-term potential of business<br />
franchise<br />
<strong>Detailed</strong> <strong>due</strong>-<strong>diligence</strong><br />
Diversification / stock selection
17<br />
FIDELITY INTERNATIONAL<br />
Appendix
18<br />
Market outlook:<br />
Market complacency up to H1 2008<br />
JPY/€ Exchange Rate<br />
FIDELITY INTERNATIONAL<br />
170<br />
160<br />
150<br />
140<br />
130<br />
120<br />
110<br />
Jan 06 May 06 Sep 06 Jan 07 May 07 Sep 07 Jan 08 May 08 Sep 08 Jan 09<br />
JPY/€ spot rate JPY/€ 200 day moving average JPY/€ 50 day moving average<br />
Source: Datastream, 01/10/2006 to 15/04/2009
19<br />
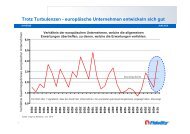
Market outlook:<br />
European margins are set to “take the strain”<br />
15<br />
12<br />
9<br />
6<br />
FIDELITY INTERNATIONAL<br />
EBIT GDP Y/Y chg<br />
6<br />
3<br />
Jan-80 Jan-83 Jan-86 Jan-89 Jan-92 Jan-95 Jan-98 Jan-01 Jan-04 Jan-07 Jan-10<br />
European non-financial margins IBES forecasted margins European GDP growth<br />
Source: ASR Ltd, Thomson Financial Worldscope Aggregates, IBES as at December 2008.<br />
5<br />
4<br />
3<br />
2<br />
1<br />
0<br />
-1<br />
-2
20<br />
Market outlook:<br />
Earnings risk in 2009<br />
YoY% Change<br />
FIDELITY INTERNATIONAL<br />
80%<br />
60%<br />
40%<br />
20%<br />
0%<br />
-20%<br />
-40%<br />
-60%<br />
89 90 91 92 93 94 95 96 97 98 99 00 01 02 03 04 05 06 07 08 09<br />
Source: Datastream, 15/01/1989 to 15/04/2009<br />
European 12 month forward EPS est. UK 12 month forward EPS est.
21<br />
Market outlook:<br />
Equity markets are the cheapest in 20 years<br />
Europe Market Trailing PE<br />
27<br />
24<br />
21<br />
18<br />
15<br />
12<br />
FIDELITY INTERNATIONAL<br />
9<br />
6<br />
Apr-89<br />
Apr-91<br />
Price-to-Earnings<br />
Apr-93<br />
European market is at its cheapest<br />
level for 20 years on a PE basis<br />
Apr-95<br />
Apr-97<br />
Apr-99<br />
Source: Datastream / IBES, 02/04/1989 to 02/04/2009<br />
Apr-01<br />
Apr-03<br />
Apr-05<br />
Average<br />
Apr-07<br />
Apr-09<br />
European Market Price-to-Book<br />
4.5<br />
4.0<br />
3.5<br />
3.0<br />
2.5<br />
2.0<br />
1.5<br />
1.0<br />
Apr-89<br />
Average<br />
Apr-91<br />
Apr-93<br />
Price-to-Book<br />
European market is also cheap<br />
on a Price-to-Book basis<br />
Apr-95<br />
Apr-97<br />
Apr-99<br />
Apr-01<br />
Apr-03<br />
Source: Datastream / IBES, 02/04/1989 to 02/04/2009<br />
Apr-05<br />
Apr-07<br />
Apr-09
22<br />
Market outlook:<br />
US valuation spreads<br />
FIDELITY INTERNATIONAL<br />
Source: Empirical research Partners Analysis
23<br />
Key points<br />
FIDELITY INTERNATIONAL<br />
Portfolio returns driven by bottom-up stock picking<br />
A robust investment process for selecting companies<br />
With sustainable business models<br />
Attractive risk reward profile<br />
Longer term perspective<br />
European equities are trading at highly attractive valuations<br />
Portfolio is well positioned to benefit from a market recovery
24<br />
Rechtliche Hinweise<br />
FIDELITY INTERNATIONAL<br />
Dieses Dokument ist nur für professionelle Investoren und nicht für Privatanleger bestimmt.<br />
Diese Präsentation darf ohne vorherige Erlaubnis weder reproduziert oder veröffentlicht werden. Eine<br />
Anlageentscheidung sollte in jedem Fall auf Grundlage der Prospekte, des letzten Geschäftsberichtes und –<br />
sofern nachfolgend veröffentlicht – des jüngsten Halbjahresberichtes getroffen werden. Diese Unterlagen<br />
sind die allein verbindliche Grundlage des Kaufes. <strong>Fidelity</strong> veröffentlicht ausschließlich produktbezogene<br />
Informationen und erteilt keine Anlageempfehlung. Die Prospekte, den Geschäftsbericht und den<br />
Halbjahresbericht erhalten Sie kostenlos bei FIL Investment Services GmbH, Postfach 200237, D-60606<br />
Frankfurt/ Main oder über www.fidelity.de. Anleger in Österreich erhalten diese Dokumente kostenlos bei<br />
FIL <strong>Investments</strong> International – Zweigniederlassung Wien, Schottenring 16, A-1010 Wien oder bei der<br />
österreichischen Zahlstelle Bank Austria Creditanstalt AG, Vordere Zollamtsstraße 13, A-1030 Wien.<br />
Der Wert der Anteile sowie die Höhe der Erträge kann schwanken und wird nicht garantiert. <strong>Fidelity</strong>, <strong>Fidelity</strong><br />
International und das Pyramiden-Logo sind eingetragene Warenzeichen von FIL Limited. Die genannten<br />
Unternehmen dienen zu rein illustrativen Zwecken. Dies stellt keine Aufforderung zum Kauf oder Verkauf der<br />
jeweiligen Werte dar, und die genannten Unternehmen können ggfls. nicht zu den Fondsbeständen zählen.<br />
Herausgeber für Deutschland: FIL Investment Services GmbH, Postfach 200237, D-60606 Frankfurt/ Main.<br />
Herausgeber für Österreich: FIL <strong>Investments</strong> International – Zweigniederlassung Wien, Schottenring 16, A-<br />
1010 Wien. Für institutionelle Investoren in Deutschland gilt als Herausgeber: FIL Investment Management<br />
GmbH, Kastanienhöhe 1, D-61476 Kronberg im Taunus. Stand, falls nicht anders vermerkt: April 2009.<br />
Alle Angaben ohne Gewähr. MK4375