Issue 06/2018
bioplasticsMAGAZINE_1806
bioplasticsMAGAZINE_1806

Create successful ePaper yourself
Turn your PDF publications into a flip-book with our unique Google optimized e-Paper software.
From Science & Research<br />
To obtain land use data from production capacities in this<br />
bottom-up approach (see Table 1), it needs producer-specific<br />
production capacities of a type of bioplastics to be multiplied by<br />
the output data of the corresponding process routes. If producerspecific<br />
feedstock was known, it was taken into consideration.<br />
In other cases, where these data were missing, only the most<br />
common used crop per material was taken into consideration (e.g.<br />
corn starch for PLA).<br />
For the basic assumptions referring to PLA, previous estimates<br />
of IfBB resulted in a need of 0.37 hectares land for feedstock<br />
cultivation per tonne of material. This is a corn-based, PLAspecific<br />
global average land use factor, for which the following<br />
calculation impact factors (CIF) are assumed.<br />
One obvious impact factor on land use of bioplastics might be<br />
the production capacity itself. According to own research, total<br />
annual installed capacity for PLA worldwide in 2017 was roughly<br />
240,000 tonnes, which gives 88,300 hectares according to the<br />
basic assumptions. However, is relying on the installed capacity<br />
correct? Very few industrial plants run at full degree of capacity<br />
continuously, so an optimistic sensitivity would be 85 % degree of<br />
capacity.<br />
Another impact factor is the region specific yield of a feedstock<br />
in different countries. While for the basic estimation for PLA made<br />
out of corn, a global average yield of 6.5 tonnes of corn per hectare<br />
over the past decade (weighted by production amount) (FAO <strong>2018</strong>),<br />
corn being grown in the United States in the same period would<br />
yield in 9.5 tonnes per hectare and the same acreage in China<br />
delivered 40 % less of corn (5.5 t / ha). This is even more important,<br />
as corn from USA makes up to 37 % of world’s corn production,<br />
but China, with its significantly lower yield per hectare still ranks at<br />
an important one fifth (20 %) of global corn production. Therefore it<br />
has a decreasing effect on the global average corn yield (6.5 t / ha).<br />
Further impacts derive from natural harvesting fluctuation.<br />
Using single year data leads to tremendous deviation in calculating<br />
PLA land use. Comparing available corn yields between 2002<br />
and 2013 for e.g. corn in the USA shows, that there is a deviation<br />
between minimum and maximum of 3.2 tonnes per hectare<br />
(Average yield: 9.1 t / ha). By using either minimum or maximum<br />
yield data of a given period for calculation will result in this case in<br />
a fluctuation of land use of +43 % or -30 %.<br />
But even when looking at a global average yield for corn, the<br />
choice of a certain decade leads to different results. Using a global<br />
average yield over a mid-term period (10 years) helps to minimize<br />
natural harvesting fluctuation while at the same time provides<br />
data, which are not influenced by single local yield deviations.<br />
When comparing two different time periods (2002 – 2011 and 2003<br />
– 2014), the worldwide general increase in harvesting yields of<br />
corn raised by 2.5 %. For other (food) crops relevant in bioplastics<br />
production, the increase is at the same level or even higher, e.g.<br />
sugar beet (+ 5.9 %), sugar cane (+ 1.9 %) and castor oil (+ 17.1 %).<br />
Advances in crop growing techniques and better feedstock yields<br />
result in a lower land use, which decreases to the same extent<br />
for each bioplastic material. Even without changes in bioplastics<br />
technology (1st, 2nd, 3rd generation), future land use per tonne of<br />
bioplastic material will de facto decrease.<br />
Additional impact factors could arise from the source of<br />
feedstock (e.g. PLA made from sugar cane versus corn starch)<br />
and allocation assumptions. Allocation is in detail also a very<br />
complex topic and would go beyond the scope of this comparison<br />
as there are different factors itself, which can be used. In general,<br />
this would be mass-balanced, energy-balanced or economicbalanced<br />
allocation. In this case, if using residues is being taken<br />
into account, the bioplastic material will only be burdened with<br />
parts of the full impact of its land use. To make a proposal, the<br />
results will cover 30 % use of residues.<br />
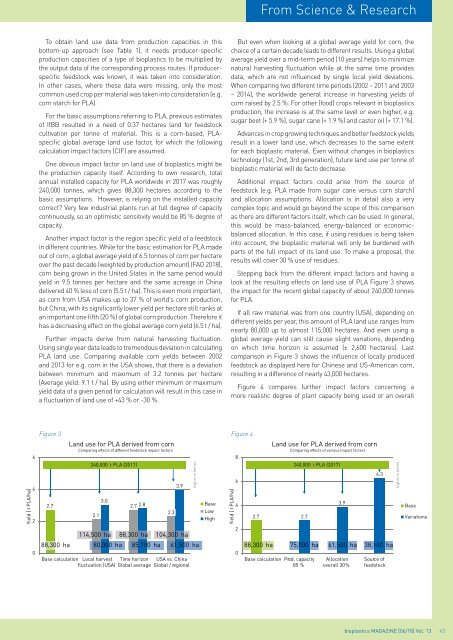
Stepping back from the different impact factors and having a<br />
look at the resulting effects on land use of PLA Figure 3 shows<br />
the impact for the recent global capacity of about 240,000 tonnes<br />
for PLA.<br />
If all raw material was from one country (USA), depending on<br />
different yields per year, this amount of PLA land use ranges from<br />
nearly 80,000 up to almost 115,000 hectares. And even using a<br />
global average yield can still cause slight variations, depending<br />
on which time horizon is assumed (± 2,600 hectares). Last<br />
comparison in Figure 3 shows the influence of locally produced<br />
feedstock as displayed here for Chinese and US-American corn,<br />
resulting in a difference of nearly 43,000 hectares.<br />
Figure 4 compares further impact factors concerning a<br />
more realistic degree of plant capacity being used or an overall<br />
Yield [ t PLA/ha]<br />
6<br />
4<br />
2<br />
0<br />
Figure 3 Figure 4<br />
2.7<br />
Land use for PLA derived from corn<br />
Comparing effects of different feedstock impact factors<br />
240,000 t PLA (2017)<br />
2.1<br />
3.0<br />
114,500 ha<br />
88,300 ha 80,000 ha<br />
Base calculation Local harvest<br />
fluctuation (USA)<br />
2.7 2.8<br />
88,300 ha<br />
Time horizon<br />
Global average<br />
2.3<br />
3.9<br />
104,300 ha<br />
USA vs. China<br />
Global / regional<br />
higher is better<br />
85,700 ha 61,500 ha<br />
Base<br />
Low<br />
High<br />
Yield [ t PLA/ha]<br />
8<br />
6<br />
4<br />
2<br />
0<br />
Land use for PLA derived from corn<br />
Comparing effects of various impact factors<br />
2.7 2.7<br />
Base calculation Prod. capacity<br />
85 %<br />
240,000 t PLA (2017)<br />
88,300 ha 75,000 ha 61,500 ha 38,100 ha<br />
3.9<br />
Allocation<br />
overall 30 %<br />
6.3<br />
Source of<br />
feedstock<br />
higher is better<br />
Base<br />
Variations<br />
bioplastics MAGAZINE [<strong>06</strong>/18] Vol. 13 43